Attached files
| file | filename |
|---|---|
| 8-K - FORM 8-K - SELECTA BIOSCIENCES INC | tm2032159-1_8k.htm |
Exhibit 99.1

Phase 2 COMPARE Trial Topline Data Presentation September 30, 2020

Any statements in this presentation about the future expectations, plans and prospects of Selecta Biosciences, Inc. (“the com pan y”), including without limitation, statements regarding the clinical development, regulatory, and commercialization activities related to SEL - 212 by either the company or Sobi , including with respect to anticipated geographic markets, the availability and timing of data from the DISSOLVE Phase 3 clinical program, the timing and execution of company’s plans to submit a BLA for SEL - 212, the potential market opportun ity for SEL - 212, the potential of SEL - 212 to address unmet needs in chronic refractory gout patients including sustained reduction in SUA levels, longer duration of treatment, and elimination of tophi wit h a convenient monthly treatment, the potential treatment applications and regulatory and clinical development of the company’s product candidates utilizing the ImmTOR platform in areas such as enzyme therapy and gene therapy and related timing, the potential of the ImmTOR technology platform generally and the company’s ability to grow its strategic collaborations, upcoming events and presentatio ns, including with respect to the presentation of the Phase 2 COMPARE full data set, and other statements containing the words “anticipate,” “believe,” “continue,” “could,” “estimate,” “expect,” “hypothesi ze, ” “intend,” “may,” “plan,” “potential,” “predict,” “project,” “should,” “target,” “would,” and similar expressions, constitute forward - looking statements within the meaning of The Private Securities Litigation Reform Ac t of 1995. Actual results may differ materially from those indicated by such forward - looking statements as a result of various important factors, including, but not limited to, the following: the uncertain ties inherent in the initiation, completion and cost of clinical trials including their uncertain outcomes, the effect of the COVID - 19 pandemic on any of the company’s planned or ongoing clinical trials, manufacturin g activities, supply chain and operations, the availability and timing of data from ongoing and future clinical trials and the results of such trials, whether preliminary results from a particular clinica l t rial will be predictive of the final results of that trial or whether results of early clinical trials will be indicative of the results of later clinical trials, the unproven approach of the company’s ImmTOR technology, undesirable side effects of the company’s product candidates, the company’s reliance on third parties to manufacture its product candidates and to conduct its clinical trials as well as the impact of the COVID - 19 pandemic on those third parties and their ability to continue their operations, the company’s inability to maintain its existing or future collaborations, licenses or contractual relationships and the inabilit y o f the company’s licensees to make up - front and milestone payments under these collaborations, its inability to protect its proprietary technology and intellectual property, management’s ability to perfor m a s expected, potential delays in regulatory approvals, the company’s business development strategy, the availability of funding sufficient for its foreseeable and unforeseeable operating expenses and cap ita l expenditure requirements, the company’s recurring losses from operations and negative cash flows from operations raise substantial doubt regarding its ability to continue as a going concern, substantial fl uctuation in the price of its common stock, and other important factors discussed in the “Risk Factors” section of the company’s Quarterly Report on Form 10 - Q for the quarterly period ended June 30, 2020 filed wit h the U.S. Securities and Exchange Commission (SEC), and in other filings that the company makes with the SEC. In addition, any forward - looking statements included in this presentation represent the com pany’s views only as of the date of its publication and should not be relied upon as representing its views as of any subsequent date. The company specifically disclaims any intention to update any forw ard - looking statements included in this presentation. Safe Harbor / Disclaimer 2

3 SEL - 212 (n=83) pegloticase (n=87) Period 3 End of Study 0 1 2 3 4 5 6 Period 6 months Pegadricase 0.2 mg/kg ImmTOR ™ 0.15 mg/kg KRYSTEXXA® (pegloticase) 8 mg SEL - 212 Randomization Phase 2 COMPARE Study Design Patient Inclusion Criteria • Chronic refractory gout with serum uric acid (SUA) ≥7 mg/dL and one of the following: • ≥ 1 tophus OR ≥ 3 gout flares in last 18 months OR diagnosis of gouty arthritis Endpoints • Primary Endpoint: Comparison of the percentage of patients on SEL - 212 vs. pegloticase who achieve and maintain reduction of SUA < 6 mg/dL for at least 80% of the time during months 3 and 6 combined • Key Secondary Endpoints: • Comparison of the percentage of patients on SEL 212 vs. pegloticase who achieve and maintain reduction of SUA < 6 mg/dL for at least 80% of the time during months 3 and 6 individually • Reduction of mean SUA levels during months 3 and 6 combined • Safety and tolerability Once - monthly doses of SEL - 212 were compared to bi - weekly doses of pegloticase for six months

4 Phase 2 COMPARE Subject Disposition and Analysis Sets 170 patients were randomized and dosed in the phase 2 COMPARE trial Randomized and Dosed (170) SEL - 212 (83) pegloticase (87) Intention to Treat (ITT) (83) Per Protocol (PP) (59) Intention to Treat (ITT) (87) Per Protocol (PP) (70) Per Protocol Analysis Set: Defined as patients who were administered any amount of study medication and have completed at least 65% of the study dosing unless : • Early termination from the study occurred after study drug withdrawal due to meeting stopping rules or due to an adverse even t • Early termination due to investigator discretion • Major protocol deviations affecting the primary efficacy assessment

5 Impact of COVID - 19 Pandemic Per FDA guidance, the statistical analysis plan was modified and submitted to FDA prior to database lock to address the potential impact of the COVID - 19 pandemic on the trial One patient in the pegloticase arm of the trial had a confirmed COVID - 19 infection, and this led to discontinuation; no patients in the SEL - 212 arm had a COVID - 19 infection Increased protocol deviations in the intention - to - treat (ITT) population were observed during the ongoing COVID - 19 pandemic The COMPARE trial statistical analysis plan (SAP) was modified and submitted to the U.S. Food and Drug Administration (FDA) prior to database lock in compliance with FDA guidance (1) to account for the potential impact of the COVID - 19 pandemic on statistical analysis The company is pleased we completed the trial during the COVID - 19 pandemic. Trials conducted and completed during the pandemic may heighten the importance of the per protocol data set more than usual in analysis of the data. After receipt of the full data set, the impact of COVID - 19 will be more deeply explored. (1) Statistical Considerations for Clinical Trials During the COVID - 19 Public Health Emergency: Guidance for Industry. FDA, June 2020.

6 Parameter Stats Intention - to - Treat Per Protocol SEL - 212 (n=83) pegloticase (n=87) Total (n=170) SEL - 212 (n=59) pegloticase (n=70) Total (n=129) Age Mean (SD) 52.6 (11.47) 52.0 (10.43) 52.3 (10.92) 52.3 (11.86) 51.3 (10.89) 51.8 (11.31) Tophus Presence Yes n (%) 35 ( 42.2) 34 ( 39.1) 69 ( 40.6) 26 (44.1) 26 (37.7) 52 (40.3) No n (%) 48 ( 57.8) 53 ( 60.9) 101 ( 59.4) 33 (55.9) 44 (62.9) 77 (59.7) Gender Male n (%) 78 ( 94.0) 85 ( 97.7) 163 ( 95.9) 56 (94.9) 68 (97.1) 124 (96.1) Female n (%) 5 ( 6.0) 2 ( 2.3) 7 ( 4.1) 3 (5.1) 2 (2.90) 5 (3.9) BMI n (SD) 34.8 (6.73) 35.4 (7.18) 35.1 (6.95) 34.8 (6.60) 35.8 (7.43) 35.3 (7.05) Race White n (%) 62 ( 74.7) 69 ( 79.3) 131 ( 77.1) 45 (76.3) 57 (81.4) 102 (79.1) AA n (%) 16 ( 19.3) 16 ( 18.4) 32 ( 18.8) 10 (16.9) 11 (15.7) 21 (16.3) Other n (%) 5 (6) 2 (2.3) 7 (4.1) 4 (6.8) 2 (2.8) 6 (4.7) Ethnicity Hispanic n (%) 15 ( 18.1) 21 ( 24.1) 36 ( 21.2) 9 (15.3) 16 (22.9) 25 (19.4) Not Hispanic n (%) 68 ( 81.9) 66 ( 75.9) 134 ( 78.8) 50 (84.7) 54 (77.1) 104 (80.6) Baseline Characteristics and Demographics Approximately 41% of patients had visible tophi at baseline in the phase 2 COMPARE trial

7 * Number of patients with Responder Assessment ** Absolute Treatment difference = SEL - 212 percent responders – pegloticase percent responders. Percent values are rounded to nearest integer *** Relative Treatment difference = (SEL - 212 percent responders – pegloticase percent responders) / pegloticase percent responde rs*100. Percent values are rounded to nearest integer **** One - sided p - value (SEL - 212 > pegloticase) Based on stratified Cochran - Mantel - Haenszel (CMH) test. Stratification factor i s tophus presence at randomization (Yes/No) Evaluation Period (Month) Data Set SEL - 212 pegloticase Treatment Difference p**** n* Responder Percent** n* Responder Percent** Absolute** Relative*** Month 3 PP 59 70% 70 51% 18% 37% 0.019 ITT 83 70% 87 54% 16% 30% 0.017 Month 6 PP 59 61% 70 47% 14% 30% 0.053 ITT 83 54% 87 47% 7% 15% 0.179 Months 3 and 6 combined (primary endpoint) PP 59 59% 70 46% 14% 28% 0.056 ITT 83 53% 87 46% 7% 15% 0.181 SEL - 212 demonstrated statistically significant higher response rate during month 3 and numerically higher response rate during month 6, and during months 3 and 6 combined, but did not meet the primary endpoint of statistical superiority during months 3 and 6 combined Patients Who Achieved and Maintained Reduction of Serum Uric Acid (SUA) < 6 mg/dL for at least 80% of the Time During the Evaluation Period

8 Treatment with SEL - 212 demonstrated a statistically significant greater reduction in mean SUA levels than pegloticase during months 3 plus 6 combined in both PP and ITT data sets Baseline SUA levels were not statistically different between SEL - 212 and pegloticase * Number of patients with SUA assessments ** Reduction in SUA computed by subtracting baseline SUA from mean during treatment period as determined by the area under the S UA time curve divided by the corresponding time interval (mg/dL). Rounded to two decimal points. *** Computed by (pegloticase – SEL - 212) / pegloticase * 100 (rounded to nearest integer) *** p - value is based on ANOVA with fixed factor for treatment and tophus presence at randomization (Yes/No) Reduction in Mean Serum Uric Acid (SUA) During Months 3 and 6 Combined Statistically significant 48% overall reduction in mean SUA for SEL - 212 versus pegloticase Evaluation Period (Month) Data Set Treatment Group Baseline SUA (mg/dL) n* Mean Reduction (mg/dL)** % reduction of SEL - 212 versus pegloticase*** p**** Months 3 and 6 combined PP SEL - 212 9.00 49 - 6.68 - 48% 0.003 pegloticase 8.52 61 - 4.51 ITT SEL - 212 9.12 64 - 6.79 - 40% 0.003 pegloticase 8.47 72 - 4.85
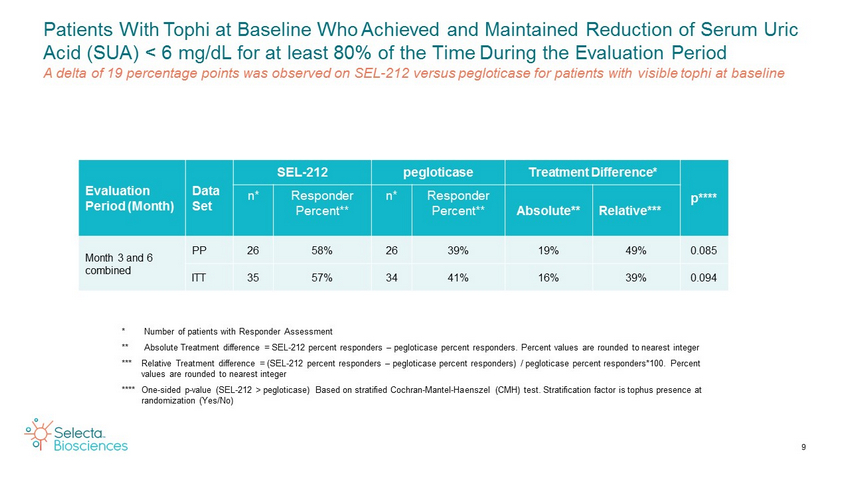
9 Patients With Tophi at Baseline Who Achieved and Maintained Reduction of Serum Uric Acid (SUA) < 6 mg/dL for at least 80% of the Time During the Evaluation Period A delta of 19 percentage points was observed on SEL - 212 versus pegloticase for patients with visible tophi at baseline Evaluation Period (Month) Data Set SEL - 212 pegloticase Treatment Difference* p**** n* Responder Percent** n* Responder Percent** Absolute** Relative*** Month 3 and 6 combined PP 26 58% 26 39% 19% 49% 0.085 ITT 35 57% 34 41% 16% 39% 0.094 * Number of patients with Responder Assessment ** Absolute Treatment difference = SEL - 212 percent responders – pegloticase percent responders. Percent values are rounded to nearest integer *** Relative Treatment difference = (SEL - 212 percent responders – pegloticase percent responders) / pegloticase percent responde rs*100. Percent values are rounded to nearest integer **** One - sided p - value (SEL - 212 > pegloticase) Based on stratified Cochran - Mantel - Haenszel (CMH) test. Stratification factor i s tophus presence at randomization (Yes/No)

10 * Number of patients with SUA assessments ** Reduction in SUA computed by subtracting baseline SUA from mean during treatment period as determined by the area under the S UA time curve divided by the corresponding time interval (mg/dL). Rounded to two decimal points. *** Computed by (pegloticase – SEL - 212) / pegloticase * 100 (rounded to nearest integer) **** p - value is based on ANOVA with fixed factor for treatment and tophus presence at randomization (Yes/No) Reduction in Mean Serum Uric Acid (SUA) During Months 3 and 6 Combined in Patients with Tophi at Baseline SEL - 212 demonstrated a statistically significant 60% overall reduction versus pegloticase in mean SUA levels for patients with visible tophi at baseline Evaluation Period (Month) Data Set Treatment Group Baseline SUA (mg/dL) n* Mean Reduction (mg/dL)** % reduction of SEL - 212 versus pegloticase*** p**** Months 3 and 6 combined PP SEL - 212 9.48 19 - 7.42 - 60% 0.016 pegloticase 8.58 19 - 4.64 ITT SEL - 212 9.42 26 - 7.32 - 50% 0.019 pegloticase 8.28 24 - 4.89 Treatment with SEL - 212 demonstrated a statistically significant greater reduction in mean SUA levels than pegloticase during months 3 and 6 combined in both PP and ITT Data Sets Baseline SUA levels were not statistically different between SEL - 212 and pegloticase

11 Topline data suggests that both SEL - 212 and pegloticase were generally well - tolerated There were no deaths during the study There were no differences in serious TEAEs, treatment - related serious TEAEs, or infusion reactions between the two groups Full analysis of safety signals, including gout flare incidence and severity, awaits evaluation of the full data set and will be reported along with full efficacy analysis at a future medical meeting Safety Summary Both SEL - 212 and pegloticase were shown to be safe and well - tolerated

2 double blinded placebo - controlled trials of SEL - 212 (0.1 mg/kg & 0.15 mg/kg ImmTOR ) Randomized 1:1:1 against Placebo with a total of 210 Treated Subjects First patient randomized and dosed in September 2020 Topline data from the DISSOLVE program is expected in 2H 2022 SEL - 212 Phase 3 DISSOLVE Program Design SEL - 212 is being evaluated in a pivotal phase 3 program versus placebo, with topline data expected in 2H 2022 Baseline 6 Months: Primary Efficacy Endpoint 12 Months Study 1 N = 35 subjects / arm SEL - 212 - 0.1/0.2 mg/kg SEL - 212 - 0.15/0.2 mg/kg Placebo SEL - 212 - 0.1/0.2 mg/kg SEL - 212 - 0.15/0.2 mg/kg Placebo Study 2 N = 35 subjects / arm 12

13 SEL - 212 showed a numerical response rate on the primary endpoint during months 3 and 6 combined, but did not meet the primary endpoint of statistical superiority during months 3 and 6 combined Statistically significant higher response rate of SEL - 212 during month 3 Numerically higher response rate of SEL - 212 during month 6 Statistically significant greater overall reduction in SUA levels in SEL - 212 versus pegloticase In patients with tophi at baseline, substantially higher responder rates for SEL - 212 compared to pegloticase on the primary endpoint, and statistically significant reduction in mean SUA SEL - 212 and pegloticase showed favorable safety results and were well - tolerated Summary of Data From COMPARE Clinical Trial All data consistent with stronger performance of SEL - 212 versus pegloticase