Attached files
| file | filename |
|---|---|
| EX-99.1 - EX-99.1 - Evolent Health, Inc. | a20200929form8-kexhibi.htm |
| 8-K - 8-K - Evolent Health, Inc. | evh-20200929.htm |

Exhibit 99.2 Evolent Health 2020 Investor & Analyst Day September 29, 2020 1

Agenda 10-10:20 AM Introduction and Key Investment Themes • Frank Williams, Executive Chairman1 • Seth Blackley, CEO1 10:20-10:40 AM Theme 1: Focused Strategy to Create Shareholder Value • Seth Blackley, CEO1 10:40-10:45 AM Break 10:45-11:30 AM Theme 2: Our Solutions Create Differentiated Value • Seth Blackley, CEO1 • Specialty Care Management Case Study: Giselle Habeych, SVP National Provider Solutions, New Century Health and Casey Stockman, VP Pharmacy, Neighborhood Health Plan of RI • Total Cost of Care Management Case Study: Jessica Landin, COO, Evolent Care Partners and Barry Feldman, Co-Founder, Michigan Healthcare Professionals • Administration Simplification Case Study: Emily Rafferty, President and COO, Evolent Health Services and Cyndy Demarest, CEO, Maryland Physicians Care 11:30-11:50 AM Theme 3: Attractive Financial Profile • John Johnson, CFO 11:50-12:20 PM Close and Q&A 1) Effective October 1, 2020. 2

Introduction & Key Investment Themes • Evolent Health Executive Chairman Frank Williams • Evolent Health CEO Seth Blackley 3

Executive Summary: Key Takeaways of 2020 Investor and Analyst Day Strong portfolio of “evergreen” solutions addresses clinical and administrative pain points for payers and providers 1 Focused Strategy to Drive continued organic growth in core Services business Create Expand Adjusted EBITDA margin Shareholder Value Optimize the capital structure and simplify the portfolio 2 Deep clinical and administrative capabilities with scalable, technology-driven platform Our Solutions Create Strong track record of driving clinical and financial performance Differentiated Value $130B in total addressable market with low penetration in target segments 3 Recurring revenue model with diversified customer base Attractive Margin profile drives strong cash flow at scale Financial Profile Positive cash generation focused on continuing to strengthen balance sheet 4

Evolent in Brief WHAT WE DO WHO WE SERVE BY THE NUMBERS (Core Services) (Revenue Mix %)1 Clinical Solutions ~$239M Q2 Revenue2 Specialty Care Management ~40% Total Cost of Care $9M Management Q2 Adjusted EBITDA3 ~60% 35+ Administrative Solution partners Providers Payers Administrative Simplification 3.1M lives supported 1) Evolent Health data for the period ending June 30, 2020. Providers includes provider-sponsored health plans. 2) Q2 2020 GAAP Total Revenue. 5 3) Non-GAAP measure, see “Non-GAAP Financial Measures” for definition and Appendix B for reconciliation to GAAP. Q2 2020 GAAP net loss to common shareholders was $(203.5M).

The Problems We Address in Health Care Out of Control Highest Cost, Poor Customer Specialty Spending Lowest Life Expectancy Satisfaction U.S. spending on oncology drugs U.S. spends more on health care Health insurers ranked 21 out rose 60% from 2013 to 2017 ($38 than other high-income countries yet of 23 industries that receive billion to $61 billion)1 has the lowest life expectancy2 a Net Promoter Score3 Specialty Care Total Cost of Care Administrative Management Management Simplification Transformation requires integrated capabilities that engage payers, providers, and patients effectively 1) “Global Oncology Trends 2018.” IQVIA Institute. 24 May 2018. https://www.iqvia.com/insights/the-iqvia-institute/reports/global-oncology-trends-2018 2) “Health Care Spending in the United States and Other High-Income Countries.” JAMA Network. 13 March 2018. https://jamanetwork.com/journals/jama/article-abstract/2674671 6 3) “How Your Net Promoter Score Could Influence Your Business.” Managed Healthcare Executive. 3 March 2018. https://www.managedhealthcareexecutive.com/business-strategy/ how-your-net-promoter-score-could-influence-your-business

Using Clinical Evidence to Better Manage Care: Inpatient 21% Admissions1 Total Medical 22% Expense1 7 1. “Effective Care Management by Next Generation Accountable Care Organizations.” The American Journal of Managed Care, July 2020.

Market Context: The Structural Problem in Health Care Traditional fee-for-service payment pits payers and providers against each other and leaves patients caught in the middle ??? Payer Provider Patient 8
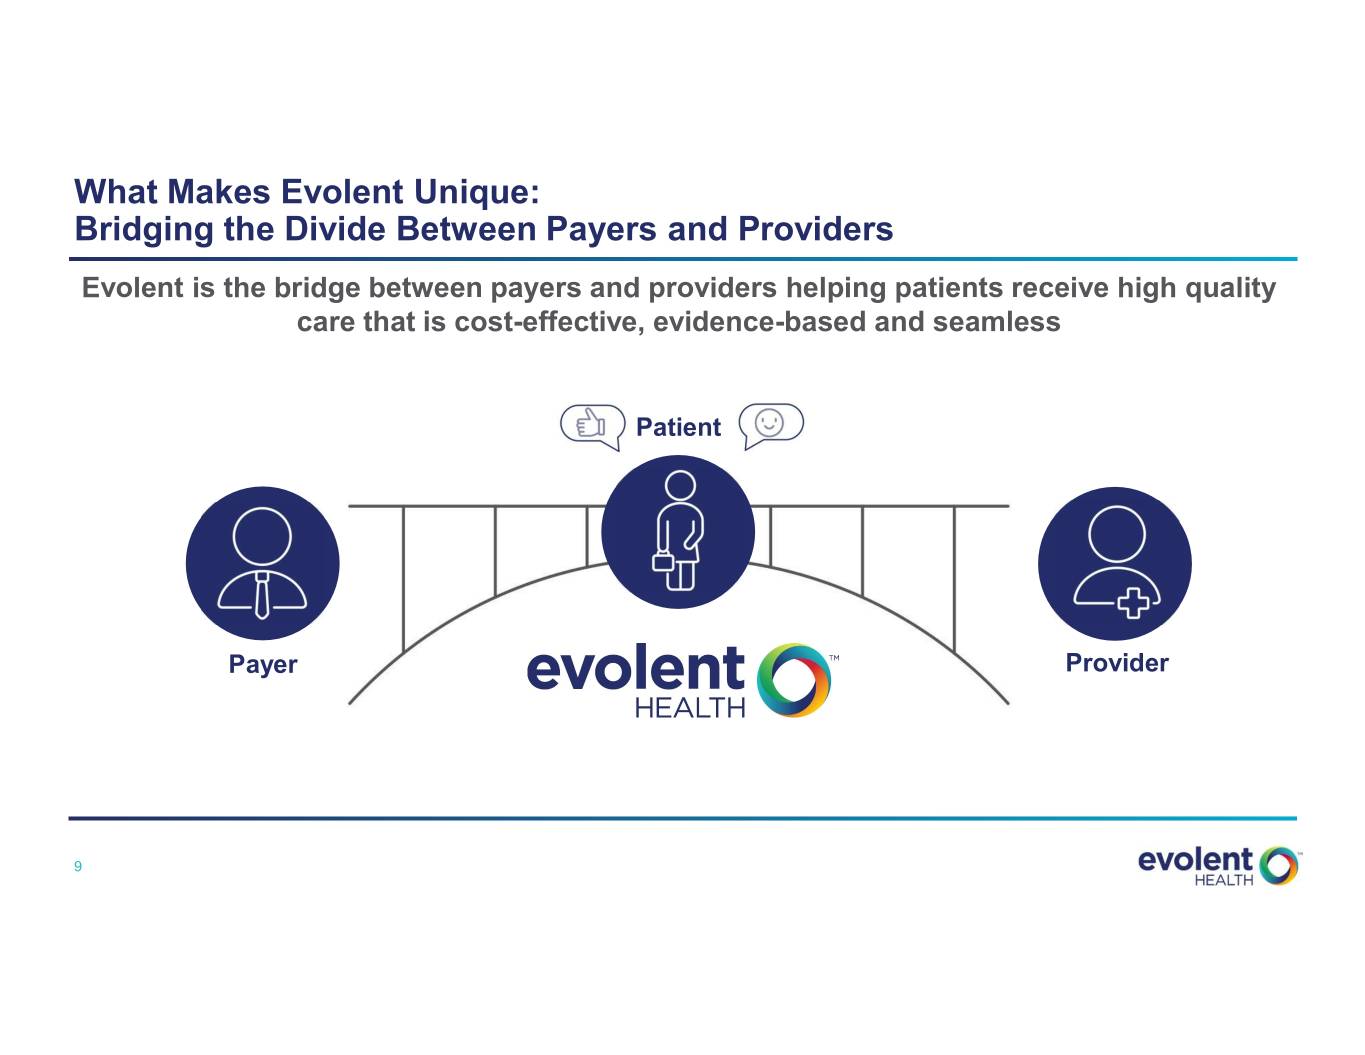
What Makes Evolent Unique: Bridging the Divide Between Payers and Providers Evolent is the bridge between payers and providers helping patients receive high quality care that is cost-effective, evidence-based and seamless Patient Payer Provider 9

Value-Based Care Market Landscape Payer-Provider New Payer Models New Provider Models Enablers Business Insurance / Consumers, Tech-enabled services / Risk / Owned practices Model / technology Clinical value Focus Example Bright Health (NYSE: EVH) Oak Street Health (NYSE: OSH) Companies Oscar Health Livongo (NYSE: LVGO) VillageMD Devoted Health Progyny (NYSE: PGNY) ChenMed 10

The Evolution of Evolent: Expanded Total Addressable Market via Offerings and New Customer Types Offerings Customer Types Specialty Total Care Total Addressable Management Addressable Payers Market Market Administrative Simplification Independent Physicians Total Cost of Care Management Health Systems Time Time 11

Core Services: Our Portfolio of “Evergreen” Solutions Clinical Administrative Specialty Care Total Cost of Care Administrative Solution Management Management Simplification Proprietary Technology Platform: CareProSM | Identifi® Operating Model Scalable Clinical IP and Infrastructure Efficient Services Model Fee-Based, Economic Model Fee- and Performance-Based, Recurring Revenue Recurring Revenue % of Services Revenue1 ~76% ~24% 1) For three months ended June 30, 2020. 12 Confidential – Do Not Distribute

Is Our Business Dependent on the Upcoming Election or the Pace of Value-Based Care? 2020 Bi-partisan support for controlling health care costs Election Results Election and reducing waste Industry Shift < 10% of current Evolent pipeline dependent on pace of Toward Value- value-based care Based Care 13

Theme 1: Focused Strategy to Create Shareholder Value • Evolent Health CEO Seth Blackley 14

Where We Are Going: Reaffirming Our Strategy to Create Shareholder Value Pillars of Our Strategy 1 Drive continued organic growth in core Services business 2 Expand Adjusted EBITDA margin 3 Optimize the capital structure and simplify the portfolio 15

Where We Are Going: Medium-Term Targets MEDIUM-TERM TARGETS 1 Adjusted Mid-teens annual growth rate on core Adjusted Services Services Revenue* Revenue 2 Adjusted Mid-teens Adjusted EBITDA margin via annual EBITDA 200-300 bps expansion from 2021 base 3 Capital Use proceeds to de-lever Structure *Excludes revenues from Passport for purposes of calculating 2021 growth rate. Passport represented 23.6% of revenue for the six months ended June 30, 2020. 16

Where We Are Going: Reaffirming Our Strategy to Create Shareholder Value MEDIUM-TERM TARGETS Mid-teens annual growth rate Drive continued organic growth in core 1 on core Adjusted Services Services business Revenue* Mid-teens Adjusted EBITDA 2 Expand Adjusted EBITDA margin margin via 200-300 bps expansion annually* Optimize the capital structure and simplify the 3 Use proceeds to de-lever portfolio *Excludes revenues from Passport for purposes of calculating 2021 growth rate. Passport represented 23.6% of revenue for the six months ended June 30, 2020. 17

How We Get There Organic Growth Drivers Add New Further Penetrate Customers Existing Customers Growth Historic Organic Target Growth Rate1 New Customers Cross-Sell / Expansion (Six to Eight)2 (Two to Four) 1) Organic revenue growth excludes the impact of acquired revenue. Calculated through December 31, 2020 (based on midpoint of adjusted services revenue). 2) New customer target for 2020 18

Over $130B in Target Addressable Market Administrative Simplification3 Total Cost of Care Management2 $23B Estimated Target $60B Addressable Market Specialty Care Management1 $50B 1) Includes MA HMO and MSSP 2) Includes MA Part A, Part B and Medicaid 19 3.) Estimated market size based on internal assessment. See Company’s Quarterly Reports on Form 10-Q and Form 10-K for risks and uncertainties.

Strong Track Record of Organic Growth Adjusted Services Organic Growth Drivers Revenue ($M)1 $915 $670 a) Add new customers $554 $436 b) Further penetrate existing customers (Same Store Growth): i. Cross-sell ii. Expand into additional geographies 2 2017 2018 2019 2020P Adjusted Services Revenue CAGR of 28% Same Store Growth has accounted for ~40% since 2017, including 15% average annual of our organic growth since 2017 organic growth3 1) Non-GAAP measure, see “Non-GAAP Financial Measures” above for definition and Appendix A for reconciliation to GAAP. GAAP Services Revenue in 2017, 2018, and 2019 was $435M, $533.1M, and $674.6M respectively. 2) 2020 represents midpoint of adjusted services revenue guidance for the year ending December 31, 2020. 20 3) Organic revenue growth excludes the impact of acquired revenue. Calculated through December 31, 2020 (based on midpoint of adjusted services revenue).

a) Add New Customers Recent New Partnership Examples Announcing Today: Two New Provider Customers 21

b) Further Penetrate Existing Customers: Cross-Sell or Expand Geographies (Case Study) Cross-selling specialties or expanding nationally with one existing NCH customer (< 1M Medicare Advantage lives) would yield an additional $462M in annual revenue for Evolent $1.4B $447 $462 $15 Cross-sell cardiology Cross-sell cardiology: and oncology: existing markets expand nationally $915 $915 Adjusted Services Revenue Further Penetrate Existing Customer Illustrative Adjusted ($M, 2020P)1 (Illustrative Annual Revenue Opportunity, $M) Services Revenue ($M) 1) 2020P represents midpoint of reiterated Adjusted Services revenue guidance for the year ending December 31, 2020. 22
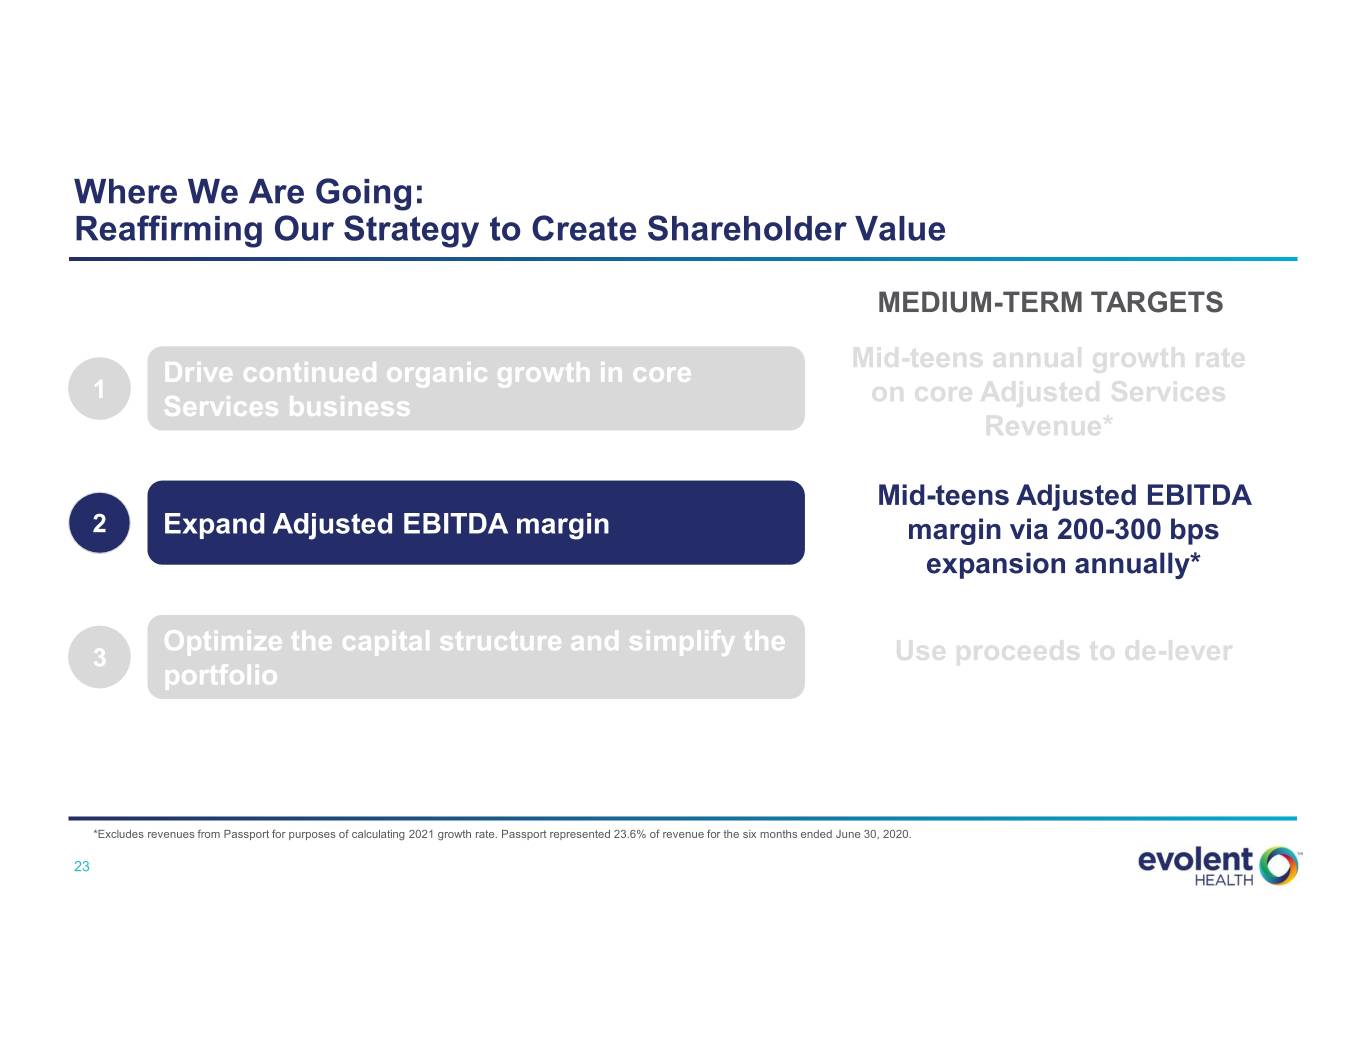
Where We Are Going: Reaffirming Our Strategy to Create Shareholder Value MEDIUM-TERM TARGETS Mid-teens annual growth rate Drive continued organic growth in core 1 on core Adjusted Services Services business Revenue* Mid-teens Adjusted EBITDA 2 Expand Adjusted EBITDA margin margin via 200-300 bps expansion annually* Optimize the capital structure and simplify the 3 Use proceeds to de-lever portfolio *Excludes revenues from Passport for purposes of calculating 2021 growth rate. Passport represented 23.6% of revenue for the six months ended June 30, 2020. 23

Streamline Overhead and Drive Annual Margin Improvement One-Time Targeted Cost Targeted Annual Margin Improvement Reductions for 2021 100-200 bps 200-300 bps 100 bps $20-25M Gross Incremental Growth Leverage Gross Margin: Targeted SG&A Cost Reduction on SG&A Product Mix and Annual Margin Automation Improvement 24

How We Get There Expanded Adjusted EBITDA margins by 700+ basis points across last four quarters (Q2’20 vs.Q2’19) Overhead • Substantial reduction in SG&A • Greater yield/productivity in tech development Cost • Disciplined targets on customer profitability (e.g., scale efficiencies) Reduction Continuing to intensify cost containment to achieve 2020 margin expansion; working with consultant on cost takeout initiatives: Targeting gross $20-25M incremental SG&A cost reduction by 2021 Growth Harvesting value of historical platform investments lower investment needed going forward Leverage on Scalable talent and corporate overhead model expands margin as revenue is added SG&A Product Mix: acceleration of lighter technology solution to complement our full NCH performance suite – Gross lower PMPM, higher margin %; also allows faster market entry with new payer customers Margin Automation drives lower unit costs across business 25
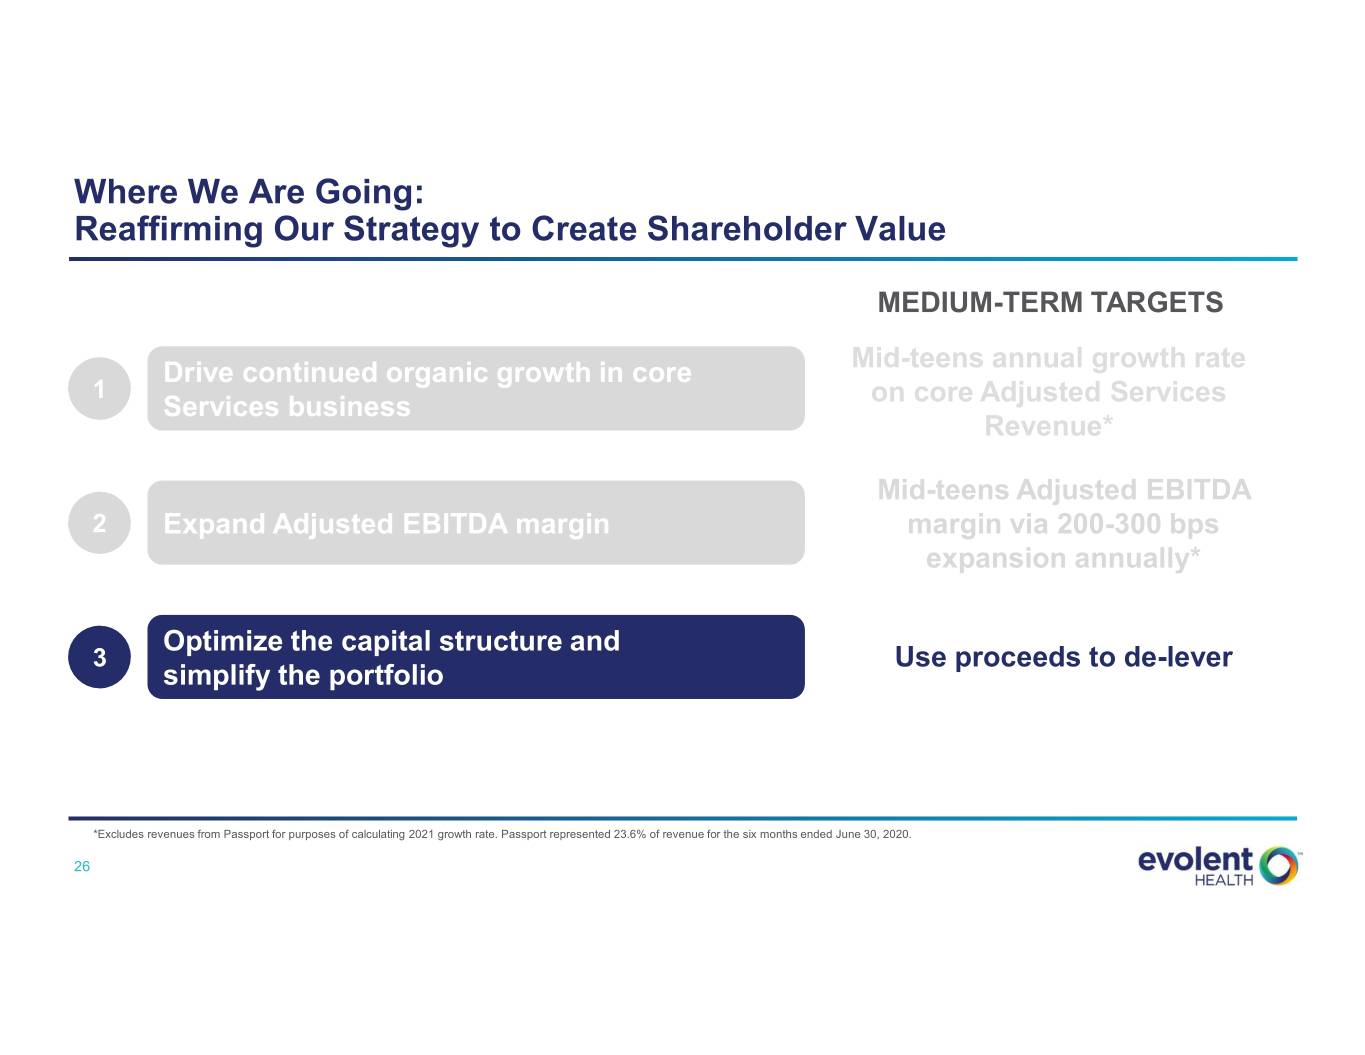
Where We Are Going: Reaffirming Our Strategy to Create Shareholder Value MEDIUM-TERM TARGETS Mid-teens annual growth rate Drive continued organic growth in core 1 on core Adjusted Services Services business Revenue* Mid-teens Adjusted EBITDA 2 Expand Adjusted EBITDA margin margin via 200-300 bps expansion annually* Optimize the capital structure and 3 Use proceeds to de-lever simplify the portfolio *Excludes revenues from Passport for purposes of calculating 2021 growth rate. Passport represented 23.6% of revenue for the six months ended June 30, 2020. 26
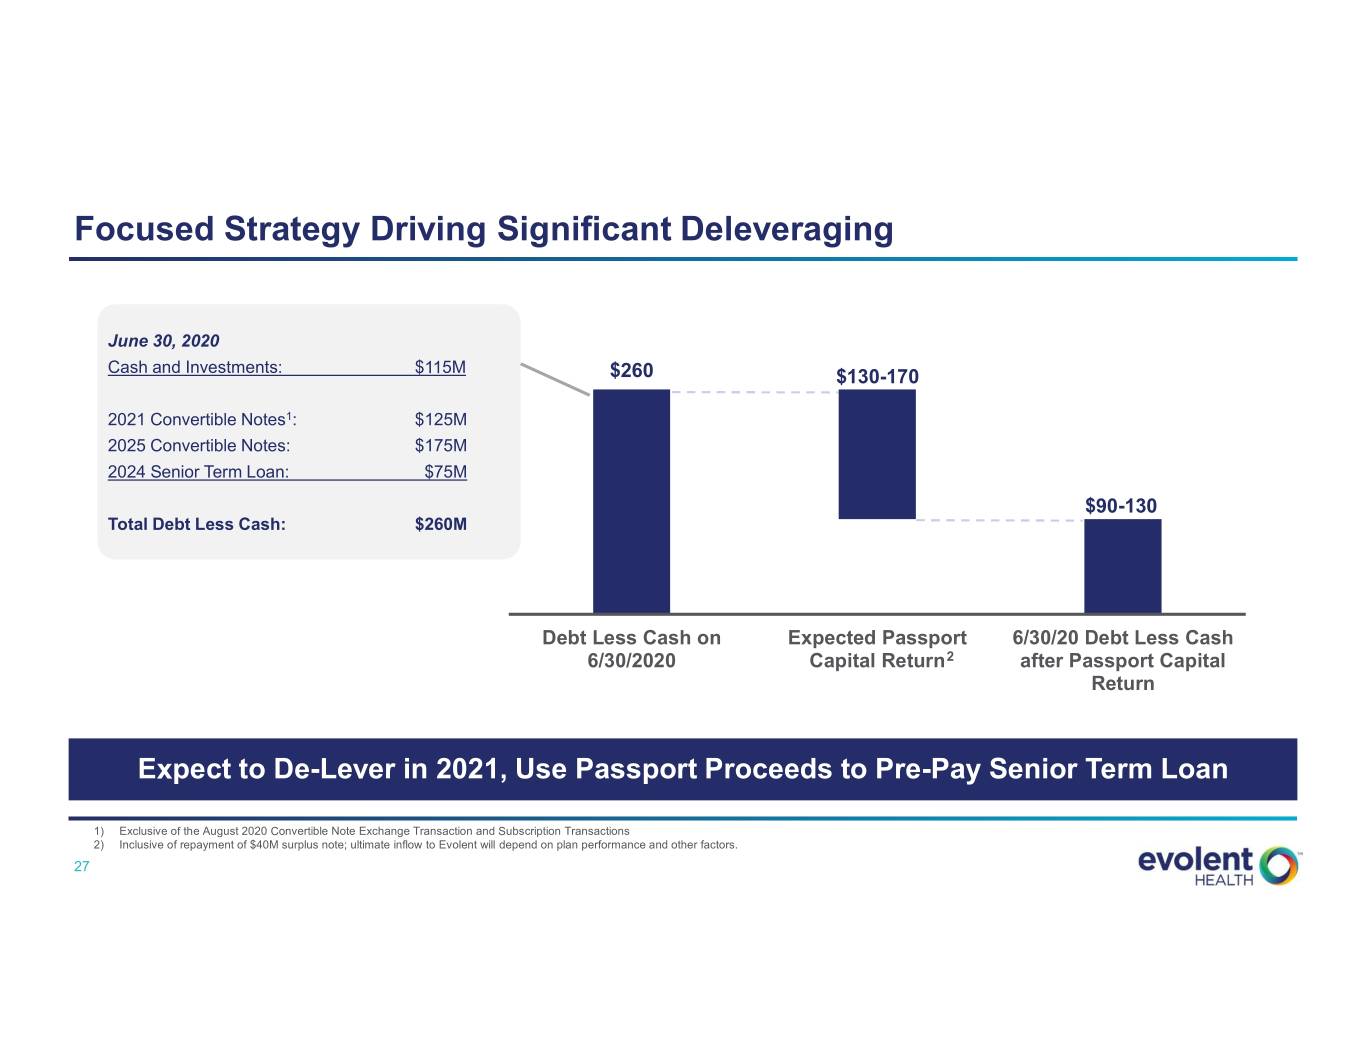
Focused Strategy Driving Significant Deleveraging June 30, 2020 Cash and Investments: $115M $260 $130-170 2021 Convertible Notes1: $125M 2025 Convertible Notes: $175M 2024 Senior Term Loan: $75M $90-130 Total Debt Less Cash: $260M Debt Less Cash on Expected Passport 6/30/20 Debt Less Cash 6/30/2020 Capital Return2 after Passport Capital Return Expect to De-Lever in 2021, Use Passport Proceeds to Pre-Pay Senior Term Loan 1) Exclusive of the August 2020 Convertible Note Exchange Transaction and Subscription Transactions 2) Inclusive of repayment of $40M surplus note; ultimate inflow to Evolent will depend on plan performance and other factors. 27
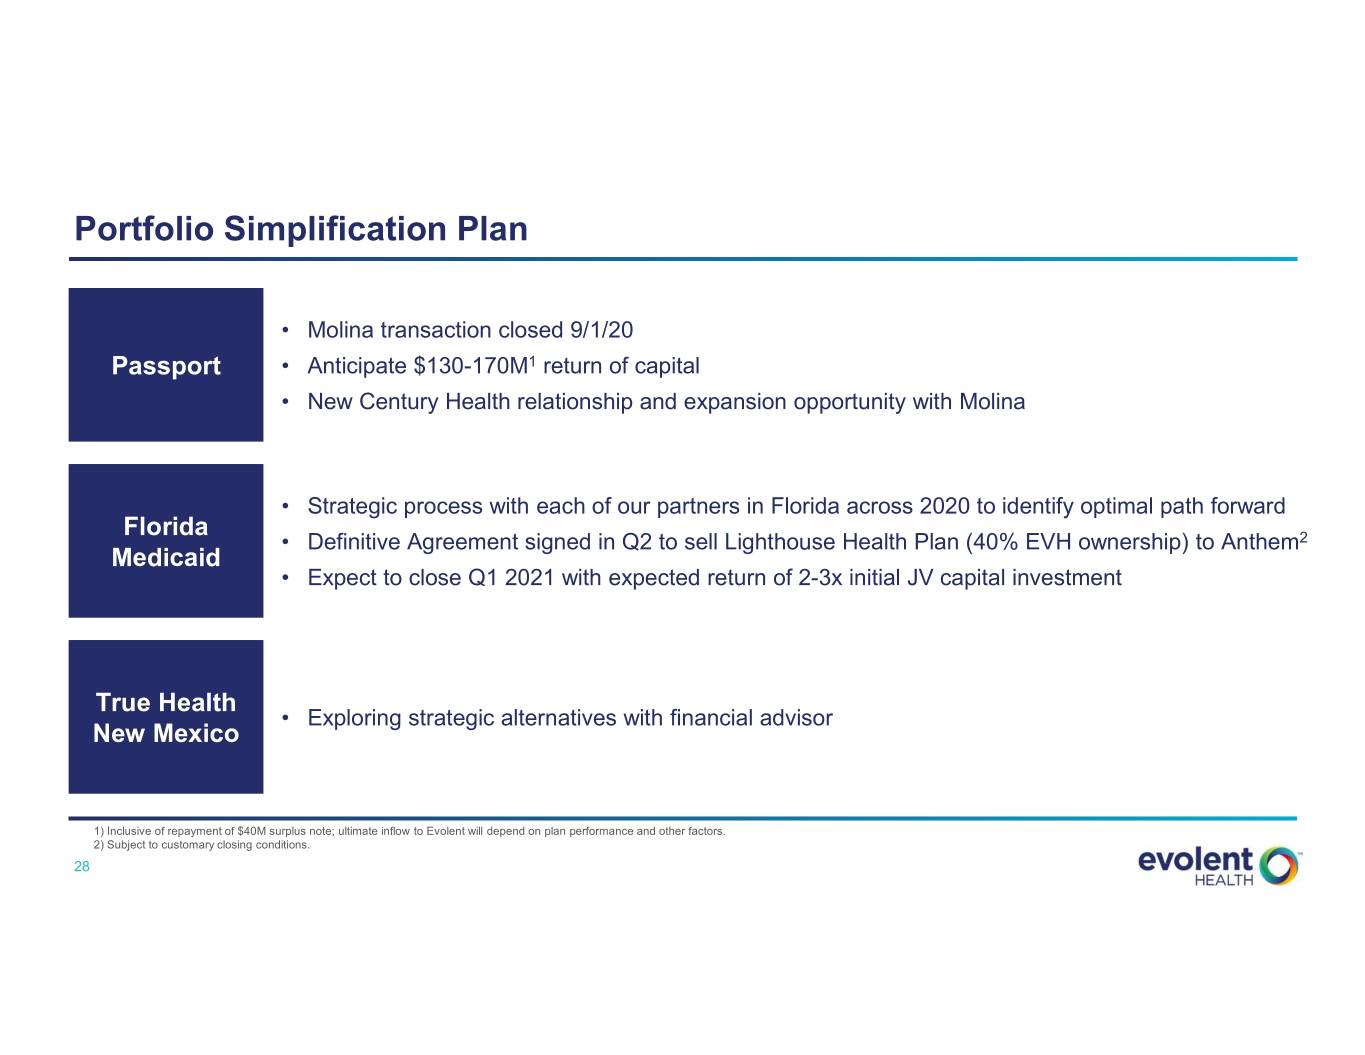
Portfolio Simplification Plan • Molina transaction closed 9/1/20 Passport • Anticipate $130-170M1 return of capital • New Century Health relationship and expansion opportunity with Molina • Strategic process with each of our partners in Florida across 2020 to identify optimal path forward Florida • Definitive Agreement signed in Q2 to sell Lighthouse Health Plan (40% EVH ownership) to Anthem2 Medicaid • Expect to close Q1 2021 with expected return of 2-3x initial JV capital investment True Health • Exploring strategic alternatives with financial advisor New Mexico 1) Inclusive of repayment of $40M surplus note; ultimate inflow to Evolent will depend on plan performance and other factors. 2) Subject to customary closing conditions. 28

Deep Leadership Team and Continued Evolution of Governance Profile Substantial Talent Across Management Team Board Expertise Closely Aligned with Strategy2 Seth Blackley John Johnson Jonathan Frank Williams Bruce Felt • Chief Executive • Chief Financial Weinberg • Executive • Presiding Lead 1 1 Director, Evolent Health Officer and Officer • General Counsel Chairman and Co-Founder Co-Founder • CFO, Domo Anita Cattrell, John Tam, MD Frank LaSota M. Bridget Duffy, David Farner PhD • Chief Strategy • Chief Technology MD • EVP, Chief Strategic & • Chief Innovation Officer Officer • Chief Medical Officer, Transformation Officer, Officer Vocera Communications UPMC Jessica Somers Michelle Engel Asit Gosar Peter Grua Diane Holder • SVP, Corporate • Chief Talent • Chief Executive • Managing Partner, • President, UPMC Insurance Development Officer Officer, Evolent HLM Venture Services Division, President Care Partners Partners and CEO, UPMC Health Plan, EVP, UPMC Dan McCarthy Steve Tutewohl Andrew Hertler, Cheryl Scott Michael D’Amato MD • Chief Executive • Chief Executive • Main Principal, • Managing Partner, Officer, New Officer, Evolent Health • Chief Medical McClintock Scott Group Sears Road Partners Century Health Services and Chief Officer, New Operating Officer Century Health Continued positive evolution of governance profile since our 2015 IPO – commencing process for Board declassification and moving to majority vote standard for charter/bylaw amendments at 2021 Annual Meeting of Stockholders 1) Effective October 1, 2020. 2) Reflects Non-Executive Directors, other than Frank Williams. 29

Evolent Health 2020 Investor & Analyst Day September 29, 2020 5 MIN BREAK 30

Theme 2: Our Solutions Create Differentiated Value • Evolent Health CEO Seth Blackley 31 Confidential – Do Not Distribute

Our Solutions: Deep Dive on Specialty Care Management Clinical Administrative Specialty Care Total Cost of Care Administrative Solution Management Management Simplification Payers and Payers and Risk-Bearing Providers Target Market Risk-Bearing Providers Risk-Bearing Providers $60B2 $50B1 $23B3 Immediate and ongoing Proven track record of clinical Value Modernizing administrative and savings via a performance- and financial results in ACO Proposition clinical operations based business model programs High-performance provider Key Solution Integrated clinical programs and Comprehensive health plan networks; Precision Components technology administration services PathwaysSM; Workflow platform 1) Includes MA Part A, Part B and Medicaid 2) Includes MA HMO and MSSP 3) Estimated market size based on internal assessment 32
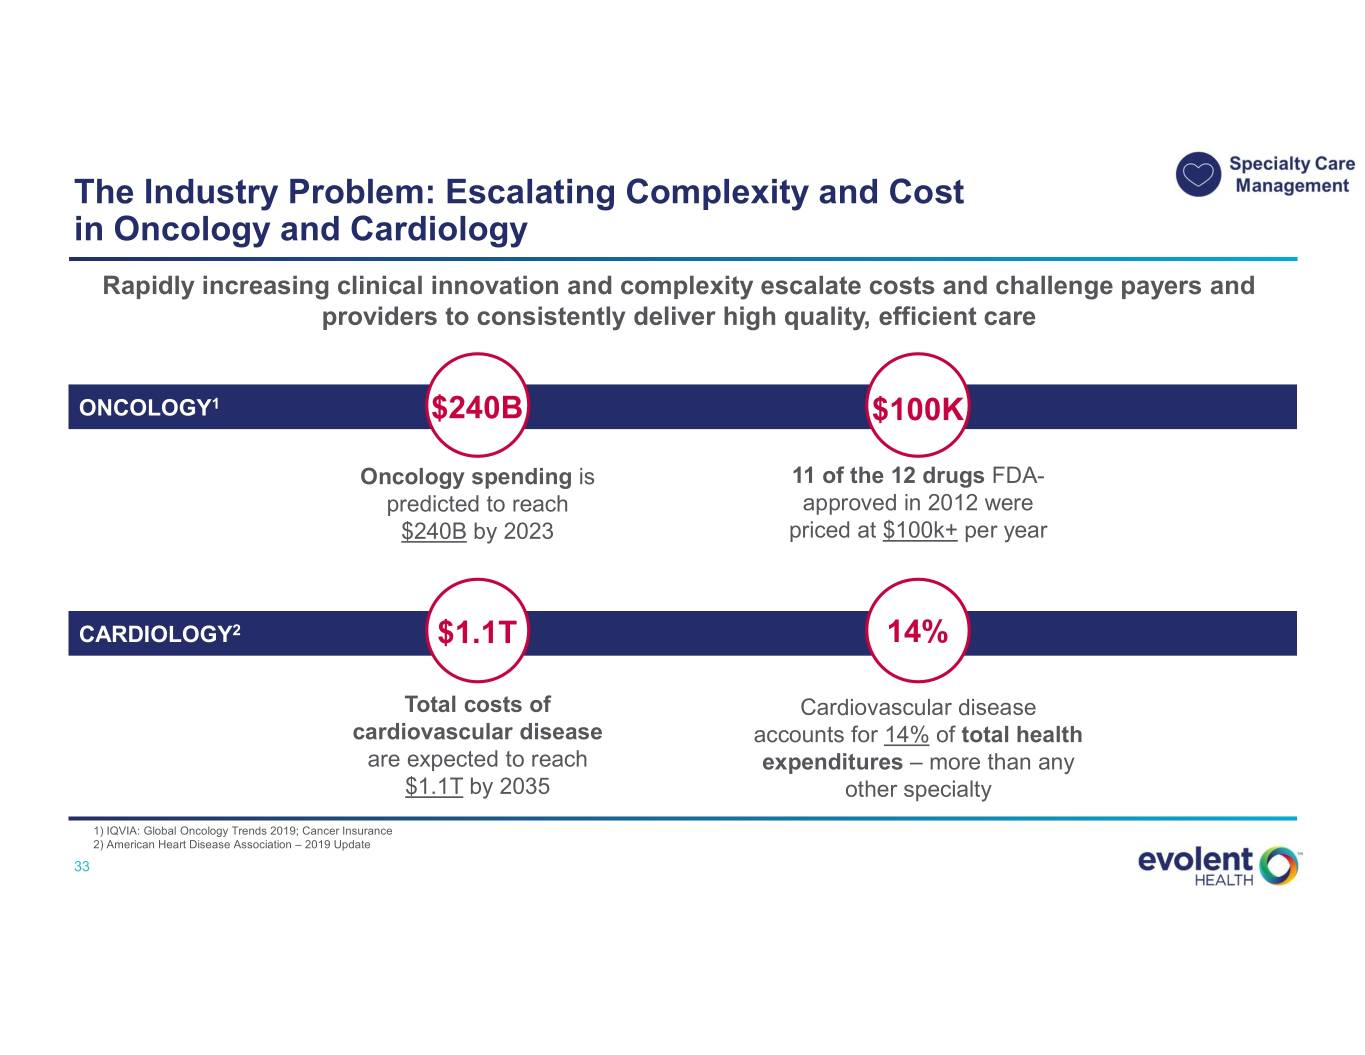
The Industry Problem: Escalating Complexity and Cost in Oncology and Cardiology Rapidly increasing clinical innovation and complexity escalate costs and challenge payers and providers to consistently deliver high quality, efficient care ONCOLOGY1 $240B $100K Oncology spending is 11 of the 12 drugs FDA- predicted to reach approved in 2012 were $240B by 2023 priced at $100k+ per year CARDIOLOGY2 $1.1T 14% Total costs of Cardiovascular disease cardiovascular disease accounts for 14% of total health are expected to reach expenditures – more than any $1.1T by 2035 other specialty 1) IQVIA: Global Oncology Trends 2019; Cancer Insurance 2) American Heart Disease Association – 2019 Update 33 Confidential – Do Not Distribute

Our Value Proposition: Immediate and Ongoing Savings via a Performance-Based Business Model Total Medical Expense on Oncology & Cardiology Illustrative Savings for Medicare Advantage Population (Part B), PMPM ($) Immediate medical 1 expense savings to $100 customer in Year 1 $98 $95 Ongoing medical expense savings $93 2 Status Quo versus Unmanaged $90 unmanaged trend Trend 1 2 $83 ~$79M NCH $82 $82 $81 $82 Managed Illustrative Savings to Trend Customer Over Five Year 1 Year 2 Year 3 Year 4 Year 5 Years Source: Based on data for a Medicare Advantage payer’s book of business. Total five-year savings to customer assumes 100K MA lives under management. 34 Confidential – Do Not Distribute

Key Solution Components: Our Solution Overcomes Traditional Barriers to Success Most payers attempt to manage complex specialties through traditional utilization management, but they struggle to bend the cost curve. Evolent's approach overcomes key barriers to success. Traditional Barriers to Success Specialty Care Management: Key Solution Components • Sub-Optimal Network Performance 1 High-Performance o Misaligned incentives o Lack of physician engagement Provider Networks • Rapidly Increasing Medical Complexity 2 o Rapid influx of new drugs and treatment protocols Precision PathwaysSM o Lack of scientific rigor in clinical evaluation • Manual, Labor-Intensive Administrative 3 Specialty Care Management Processes Workflow Platform 35 Confidential – Do Not Distribute

Key Solution Components: High-Performance Provider Networks 1 Develop high-performance provider networks with tools, capabilities and incentives to align and support physicians Specialty Network Provider Financial Physician Engagement Development Incentive Alignment & Support & Management • Direct contracts with specialists • Incentivize financial payment for • Dedicated provider operations facilitates ease of care quality and cost-efficient staff to support practices • Comprehensive specialty utilization • Clinical response team provides networks include multiple • Minimize “buy and bill” incentives clinical education on-site to downstream subspecialists through shared savings practice staff methodologies • Central call center facilitates referrals and helps to resolve claims issues • Established system of ongoing provider education and training 36 Confidential – Do Not Distribute

Key Solution Components: Network Effects Strengthen Our Business Over Time 1 In Florida from 2015 to 2020, New Century Health increased its number of oncologists in its network by 25% and payer lives under contract by over 50% Benefits of the Two-Sided Network Effect Oncologists in Network Payer Customers FL Provides a single set of “tracks” into Drives greater savings via “all payer” each provider model Reduces administrative burden with one Increases provider satisfaction platform and set of processes RESULTS 4.13 / 5.00 4.47 / 5.00 25% Provider Satisfaction1 Provider Portal Ease of Use1 Medical Expense Savings vs. Unmanaged Trend2 1) NCH 2019 Provider Satisfaction Survey results; scale of 1-Highly Dissatisfied to 5-Highly Satisfied. 2) 2020E medical expense savings for a Florida payer customer with a 5+ year relationship 37 Confidential – Do Not Distribute

Key Solution Components: Precision PathwaysSM 2 Design evidence-based clinical pathways to drive provider behavior towards improved quality of care at a lower cost ROOTED IN CLINICAL EVIDENCE BASED FOREMOST ON QUALITY WITH SUBSTANTIAL COST SAVINGS Level 2 Pathways Anti-Cancer Regimens Average Cost Per Treatment Example Options* $ Thousands National Guidelines 30 A B C D E F G H I Physician Trade Organizations 19 19 Efficacy B C E G H 18 Practicing 14 Physicians 13 B E G Advisory Toxicity Board Cost B E $ Breast Lung Colorectal NCH Level 1 Precision PathwaysSM Level 2 Level 1 *Sub-optimal regimen options based on efficacy, toxicity and/or cost shown in red (illustrative); Preferred regimen options shown in green. Source: Internal NCH Cost Analysis Q4 2016-Q3 2017 38 Confidential – Do Not Distribute
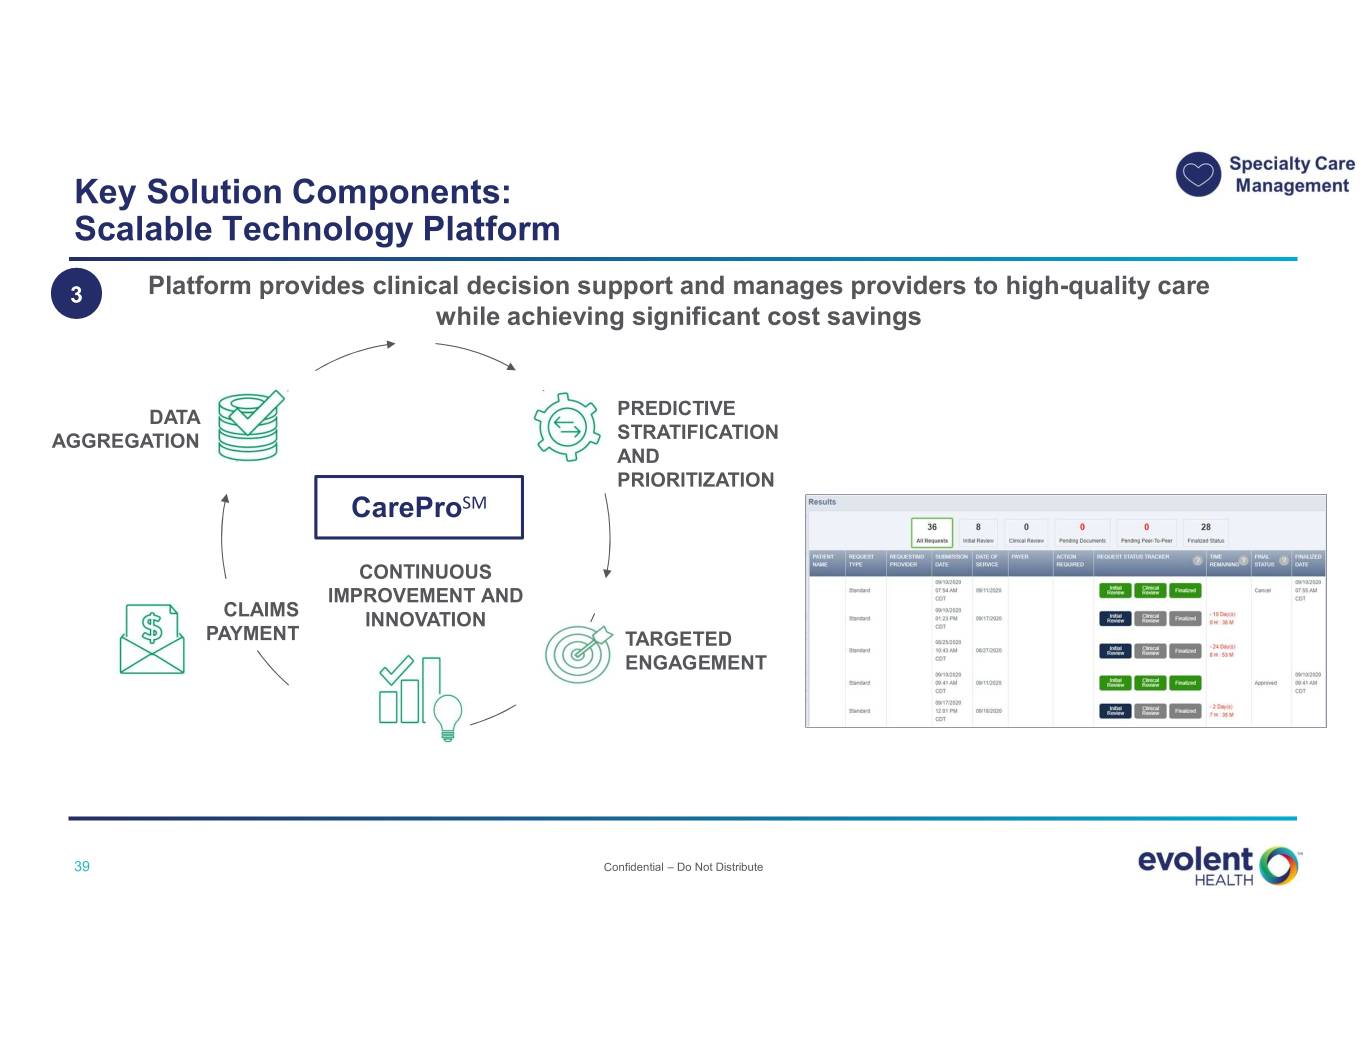
Key Solution Components: Scalable Technology Platform 3 Platform provides clinical decision support and manages providers to high-quality care while achieving significant cost savings DATA PREDICTIVE AGGREGATION STRATIFICATION AND PRIORITIZATION CareProSM CONTINUOUS IMPROVEMENT AND CLAIMS INNOVATION PAYMENT TARGETED ENGAGEMENT 39 Confidential – Do Not Distribute

Large Opportunity within Oncology Estimated Annual Oncology Market 66K+ cancer patients managed by NCH1 ~1.8M new cancer cases diagnosed in the U.S.2 1) NCH internal data on oncology; active cancer patients equates to those receiving chemotherapy treatment from August 2019-July 2020. 2) American Cancer Society. Cancer Facts & Figures 2020 (new cancer cases diagnosed in 2020): https://www.cancer.org/research/cancer-facts-statistics/all-cancer-facts-figures/cancer-facts-figures-2020.html 40 Confidential – Do Not Distribute

Case Study Customer Overview Opportunity • Ensure high-quality, evidence-based care for adult and pediatric patients • Bend the oncology cost curve for the plan Why Evolent • Holistic oncology management solution Type of Organization: Regional payer • Deep clinical expertise • High-value specialist network engagement and financial alignment • Strong track record of driving cost and quality improvements through evidence-based Precision PathwaysSM and peer-based collaboration model Geography: RI Scope / Results • Scope: Lines of Business: Medicaid, o Comprehensive oncology management services with a focus on medical Dual-Eligible and Exchange oncology, radiation therapy and genomic testing o New Century Health launched in September 2020 • Anticipated Areas of Positive Impact: Oncology cost reduction while focusing on # Lives: ~200,000 quality; higher provider engagement and efficiency through CareProSM platform 41 Confidential – Do Not Distribute

Market Strategy Why Evolent is Well- Target Addressable Market Est. Market Size & Share Positioned • Target Customer: Payers Performance-based model and Risk-Bearing Providers Specialty Care delivers immediate and Management1 ongoing savings • Lines of Business: Medicare Advantage, $50B Model rooted in clinical Medicaid evidence • Focus Areas: Oncology & Evolent Market Penetration Cardiology Specialist network ~2% engagement and financial alignment 1) Includes MA Part A, Part B and Medicaid 42 Confidential – Do Not Distribute

Our Solutions: Deep Dive on Total Cost of Care Management Clinical Administrative Specialty Care Total Cost of Care Administrative Solution Management Management Simplification Payers and Payers and Risk-Bearing Providers Target Market Risk-Bearing Providers Risk-Bearing Providers $60B2 $50B1 $23B3 Immediate and ongoing Proven track record of clinical Value Modernizing administrative and savings via a performance- and financial results in ACO Proposition clinical operations based business model programs High-performance provider Key Solution Integrated clinical programs and Comprehensive health plan networks; Precision Components technology administration services PathwaysSM; Workflow platform 1) Includes MA Part A, Part B and Medicaid 2) Includes MA HMO and MSSP 3) Estimated market size based on internal assessment 43 Confidential – Do Not Distribute

The Industry Problem: Primary Care Physicians Face Financial and Clinical Challenges Financial Challenges • 61% see declining reimbursement from third party payers1 Clinical Challenges • 75% find increasing demands on provider time are impacting care delivery1 • Only 44% feel confident in their ability to track and report on regulatory compliance initiatives1 Physician Burnout • 73% find avoiding burnout and remaining dedicated to medicine is an ongoing challenge 1) “State of the Independent Practice Industry Survey,” Kareo Go Practice, 2019. 44 Confidential – Do Not Distribute

Our Value Proposition: Driving Financial and Clinical Results Financial Results Clinical Results1 ~$100M+ Total Savings Generated with Next Generation ACO Partners in 2017 and 20182 Partner Ranked #3 Next Generation ACO in U.S. for 2018 by CMS1 and 21% Inpatient Admissions has been a Top 5 Next Generation ACO Three Years in a Row2 22% Total Medical Expense 1) “Effective Care Management by Next Generation Accountable Care Organizations.” The American Journal of Managed Care, July 2020. Paper focuses on case-control study conducted on five Evolent NGACO customers and measures the impact of Complex Care (care management) program on patients. 2) "Financial and Quality Results," CMS.gov. https://innovation.cms.gov/initiatives/Next-Generation-ACO-Model/. Total savings includes the shared savings payment made to ACOs Confidential – Do Not Distribute 45 as well as savings that accrue to CMS through the benchmark discount and sharing rate and risk corridor elections.
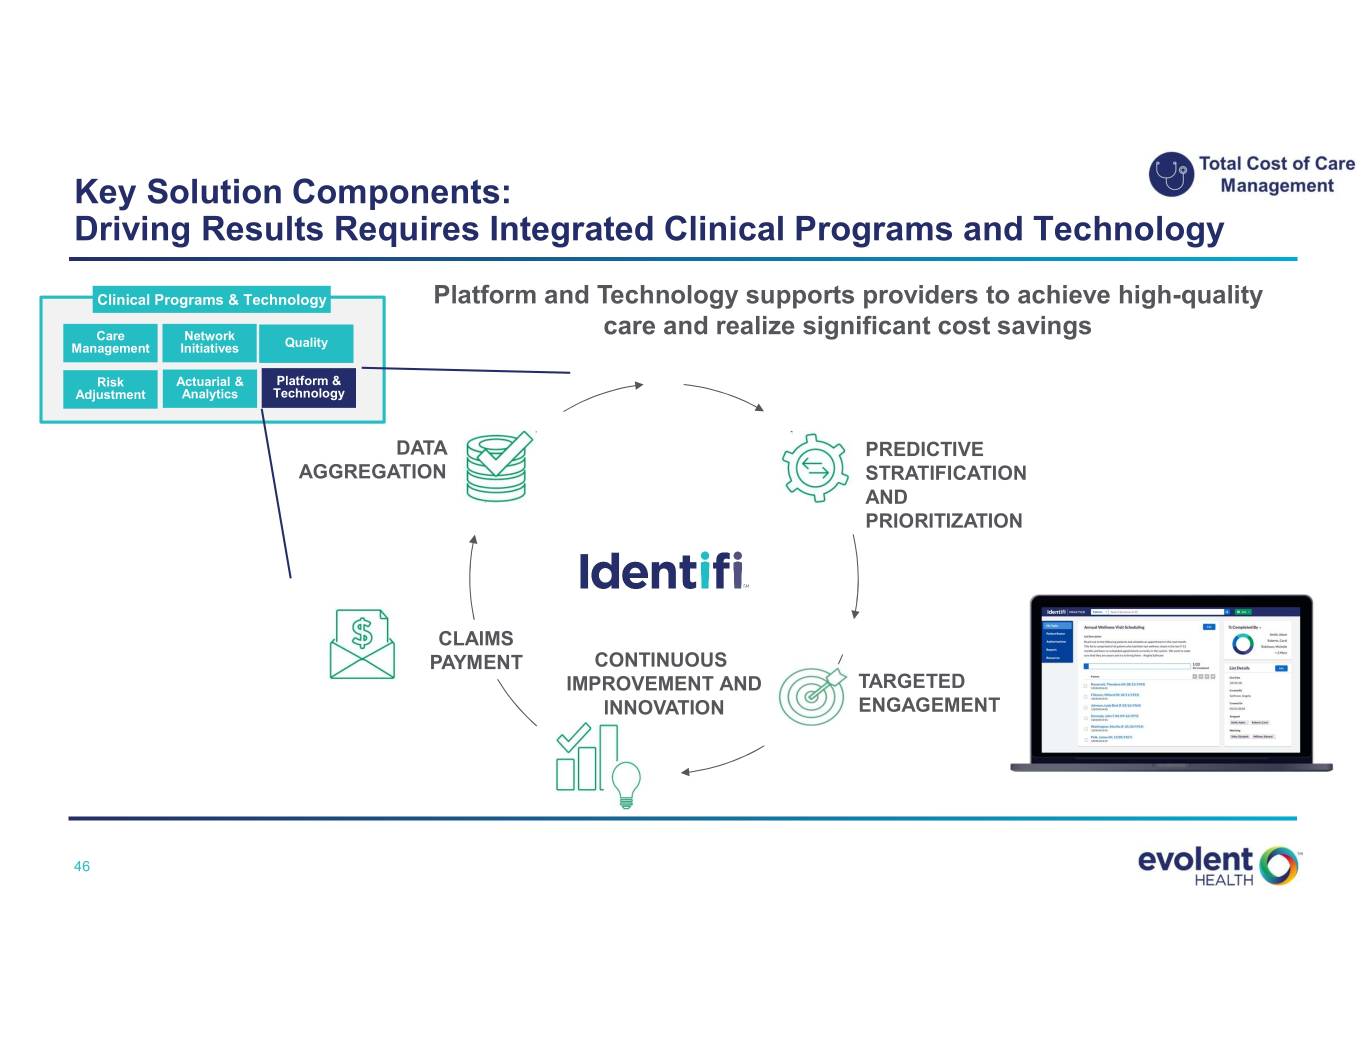
Key Solution Components: Driving Results Requires Integrated Clinical Programs and Technology Clinical Programs & Technology Platform and Technology supports providers to achieve high-quality Care Network care and realize significant cost savings Management Initiatives Quality Risk Actuarial & Platform & Adjustment Analytics Technology DATA PREDICTIVE AGGREGATION STRATIFICATION AND PRIORITIZATION CLAIMS PAYMENT CONTINUOUS IMPROVEMENT AND TARGETED INNOVATION ENGAGEMENT 46 Confidential – Do Not Distribute

Case Study Customer Overview Opportunity • Rapidly establish and leverage a value-based infrastructure and comprehensive solution within months to hit the ground running in CMS’s Pathways to Success ACO program Why Evolent Type of Organization: Risk-bearing provider • Successful track record supporting Next Generation ACOs • Clinical capabilities, provider and patient engagement expertise • Support for independent provider practices Geography: MI Scope / Results • Scope: Partnered with Evolent in 2019 and entered Pathways to Success Lines of Business: program in early 2020 Medicare Shared Savings Program • Results: o Patient and practice support during COVID-19 pandemic o High levels of provider and patient engagement: 85% of practices exceeding # Lives: ~20,000 performance targets 47 Confidential – Do Not Distribute

Market Strategy Why Evolent is Well- Target Addressable Market Est. Market Size & Share Positioned • Target Customer: Risk- Proven track record in Bearing Providers ACO programs Total Cost of Care Management1 • Lines of Business: Current: Medicare, Integrated clinical program and technology Commercial $60B Medicaid (future) Provider engagement • Focus Areas: expertise and support for Value-Based Care Evolent Market Penetration independent providers Services <1% 1) Includes MA HMO and MSSP 48 Confidential – Do Not Distribute

Our Solutions: Deep Dive on Administrative Simplification Clinical Administrative Specialty Care Total Cost of Care Administrative Solution Management Management Simplification Payers and Payers and Risk-Bearing Providers Target Market Risk-Bearing Providers Risk-Bearing Providers $60B2 $50B1 $23B3 Immediate and ongoing Proven track record of clinical Value Modernizing administrative and savings via a performance- and financial results in ACO Proposition clinical operations based business model programs High-performance provider Key Solution Integrated clinical programs and Comprehensive health plan networks; Precision Components technology administration services PathwaysSM; Workflow platform 1) Includes MA Part A, Part B and Medicaid 2) Includes MA HMO and MSSP 3) Estimated market size based on internal assessment 49 Confidential – Do Not Distribute

The Industry Problem: Costly and Inefficient Health Plan Administration Problem Result Antiquated Infrastructure Waste / Unnecessary Spend o Administrative cost pressures from process inefficiencies, outdated systems ~$760-935 billion o Clinical and administrative silos estimated total annual costs of health administration waste in U.S.1 o Multiple, disparate point solutions Sub-Par Patient and Physician Poor Customer Satisfaction Engagement o Inability to predict and prevent impactable events for patients o Inability to build and monitor value-based arrangements with network providers Health insurers ranked 21 out of 23 industries that receive a Net Promoter Score2 1) “Waste in the US Health Care System - Estimated Costs and Potential for Savings,” JAMA. William H. Shrank, MD., October 2019. 2) “How Your Net Promoter Score Could Influence Your Business.” Managed Healthcare Executive. 3 March 2018. https://www.managedhealthcareexecutive.com/business-strategy/ how-your-net-promoter-score-could-influence-your-business 50 Confidential – Do Not Distribute
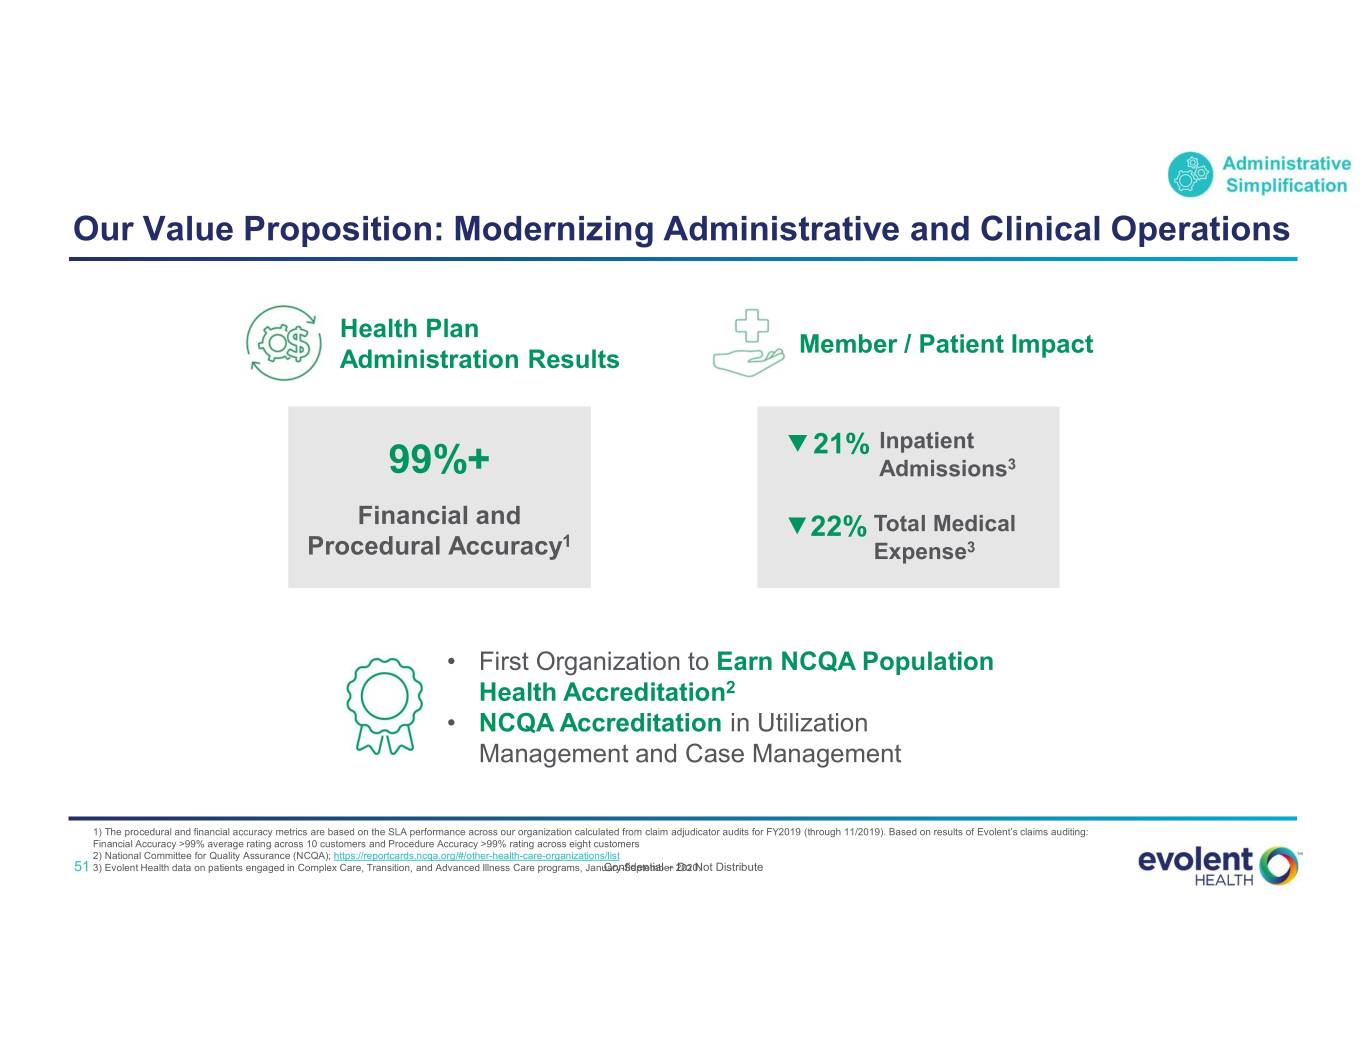
Our Value Proposition: Modernizing Administrative and Clinical Operations Health Plan Member / Patient Impact Administration Results 21% Inpatient 99%+ Admissions3 Financial and 22% Total Medical Procedural Accuracy1 Expense3 • First Organization to Earn NCQA Population Health Accreditation2 • NCQA Accreditation in Utilization Management and Case Management 1) The procedural and financial accuracy metrics are based on the SLA performance across our organization calculated from claim adjudicator audits for FY2019 (through 11/2019). Based on results of Evolent’s claims auditing: Financial Accuracy >99% average rating across 10 customers and Procedure Accuracy >99% rating across eight customers 2) National Committee for Quality Assurance (NCQA); https://reportcards.ncqa.org/#/other-health-care-organizations/list 51 3) Evolent Health data on patients engaged in Complex Care, Transition, and Advanced Illness Care programs, January-SeptemberConfidential – 2020. Do Not Distribute

Key Solution Components: Comprehensive Health Plan Administration Services End-to-end administrative and clinical processes powered by a modern and integrated platform Front Office Middle Office Back Office Corporate Plan design & promotion Provider network & clinical Claims intake & processing to Health plan regulatory services & performance resolution financial measurement Network Care Enrollment & Pricing, Benefit Fraud, Waste & Broker Portal Actuarial Development Management Eligibility Configuration Abuse Provider Disease Billing & Finance, Member Portal Claims General Ledger Relations Management Disbursements Accounting Behavioral Risk Customer Provider Portal Fulfillment Health Adjustment Service Provider Provider Data Analytics and Quality (HEDIS) Contracting Management Reporting Physician Util. Mgmt. Payment Encounter Engagement (includes G&A) Integrity Reporting Pharmacy Credentialing Subrogation Services/PBM 52 Confidential – Do Not Distribute
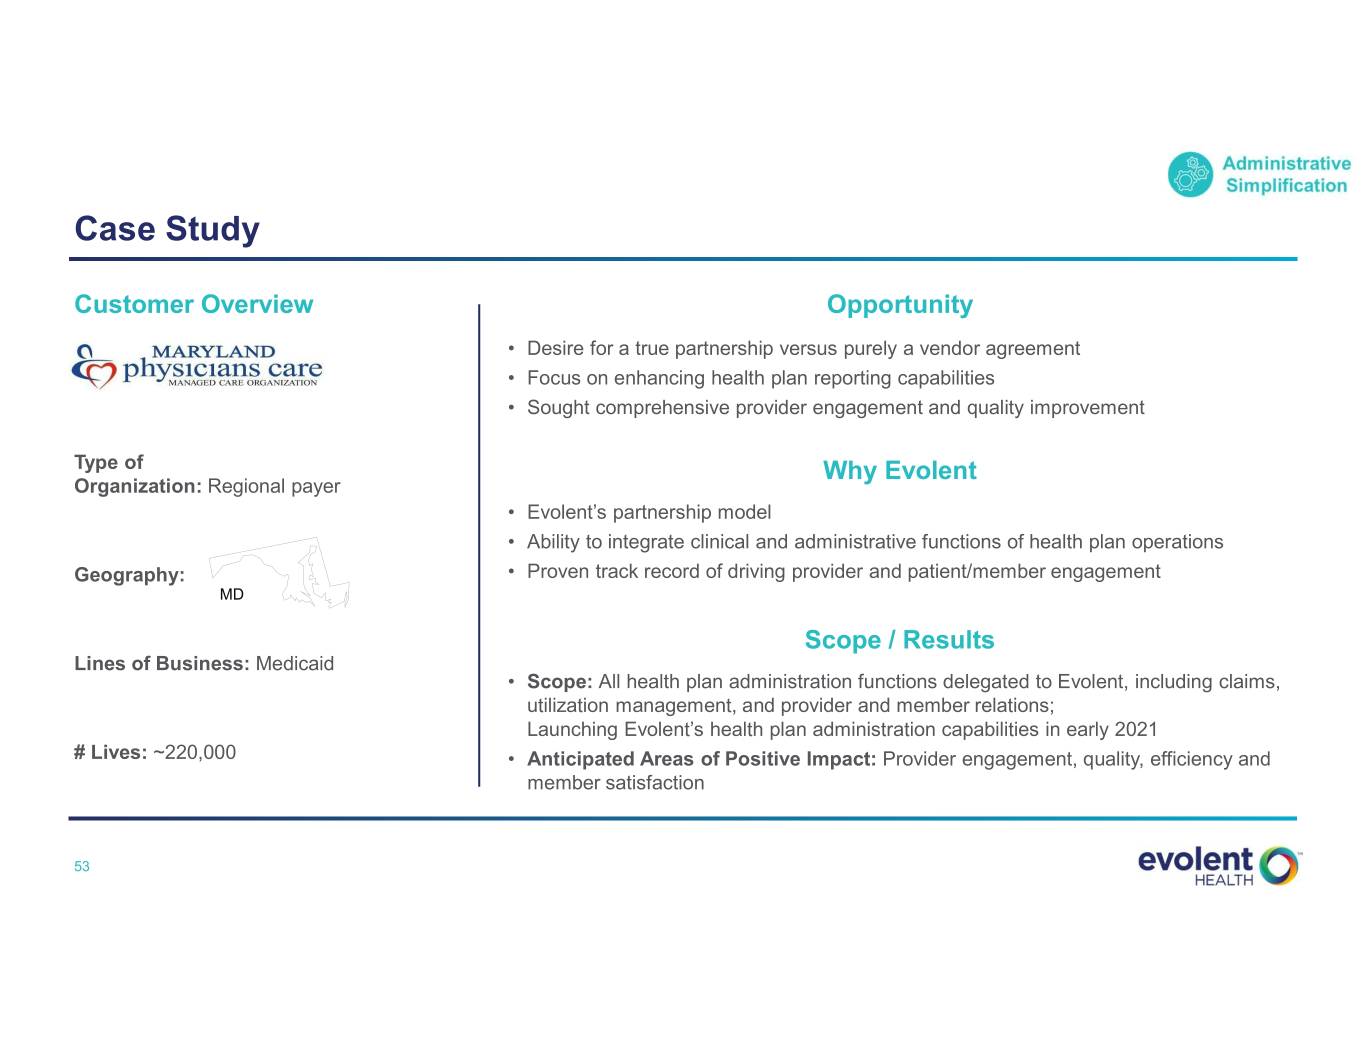
Case Study Customer Overview Opportunity • Desire for a true partnership versus purely a vendor agreement • Focus on enhancing health plan reporting capabilities • Sought comprehensive provider engagement and quality improvement Type of Why Evolent Organization: Regional payer • Evolent’s partnership model • Ability to integrate clinical and administrative functions of health plan operations Geography: • Proven track record of driving provider and patient/member engagement MD Scope / Results Lines of Business: Medicaid • Scope: All health plan administration functions delegated to Evolent, including claims, utilization management, and provider and member relations; Launching Evolent’s health plan administration capabilities in early 2021 # Lives: ~220,000 • Anticipated Areas of Positive Impact: Provider engagement, quality, efficiency and member satisfaction 53 Confidential – Do Not Distribute

Market Strategy Why Evolent is Well- Target Addressable Market Est. Market Size & Share Positioned • Target Customer: Payers Scaled infrastructure and differentiated technology platform that integrates administrative and • Lines of Business: Administrative clinical services 1 Medicaid, Medicare Simplification Advantage, Commercial $23B Deep subject matter expertise; (including Exchange) staff average 10+ years in plan operations experience across all lines of business • Focus Areas: Evolent Market Penetration Comprehensive Health ~2% Unique provider heritage Plan Administration accelerates transformation and Services drives performance at the physician level 1) Estimated market size based on internal assessment 54 Confidential – Do Not Distribute

Theme 3: Attractive Financial Profile • Evolent Health CFO John Johnson 55 Confidential – Do Not Distribute
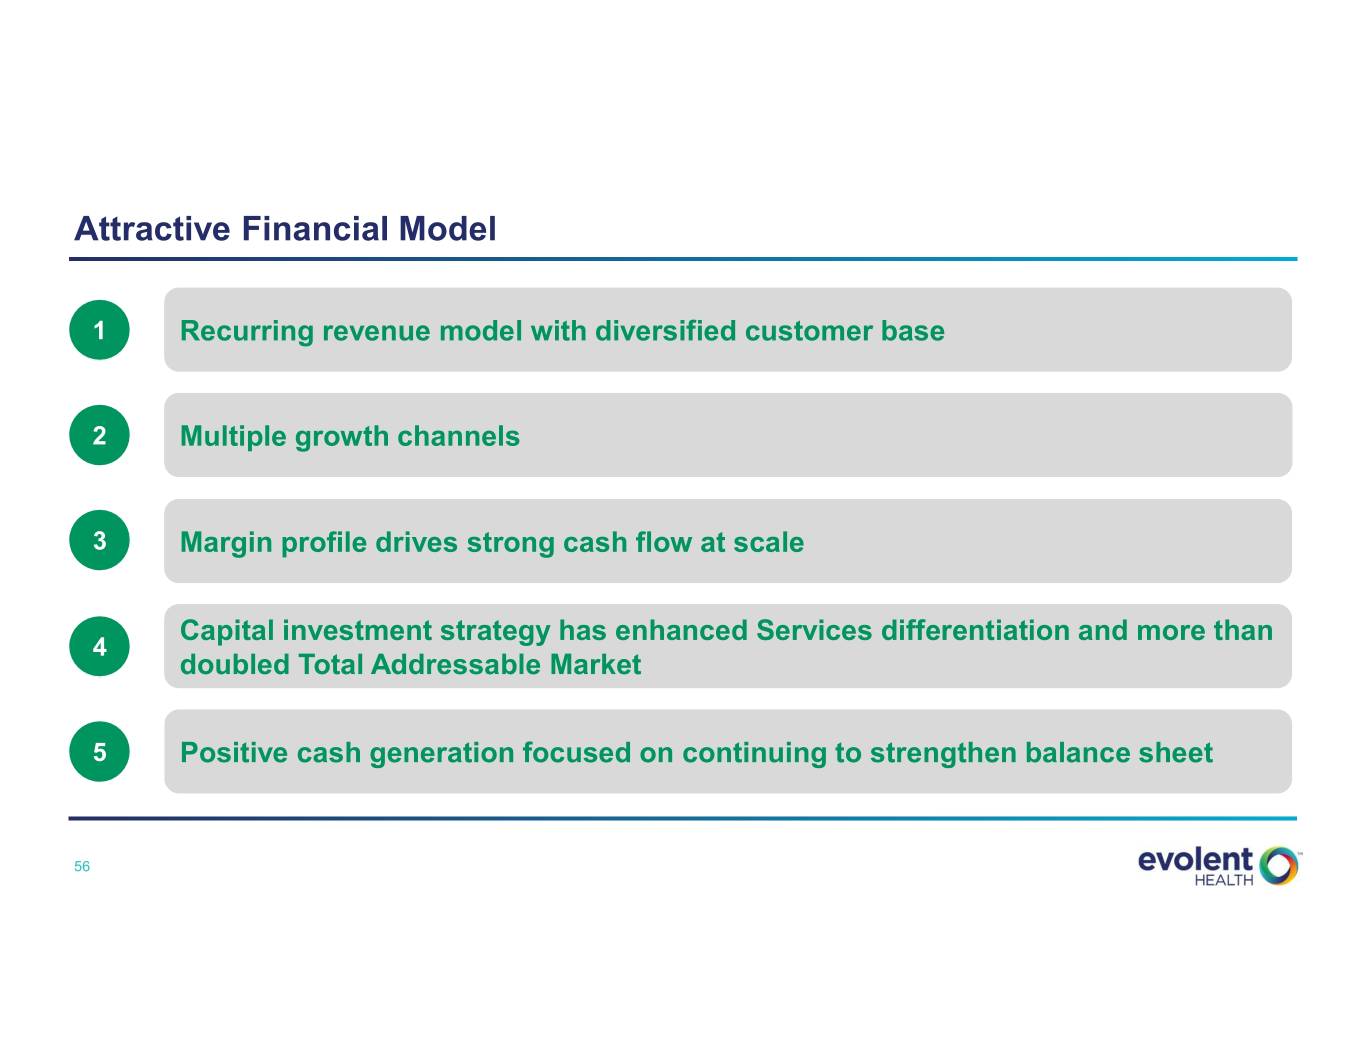
Attractive Financial Model 1 Recurring revenue model with diversified customer base 2 Multiple growth channels 3 Margin profile drives strong cash flow at scale Capital investment strategy has enhanced Services differentiation and more than 4 doubled Total Addressable Market 5 Positive cash generation focused on continuing to strengthen balance sheet 56 Confidential – Do Not Distribute

1 Recurring Revenue Model with Diversified Customer Base Recurring Revenue Model EXAMPLE CONTRACT FIXED PER MEMBER PERFORMANCE TOTAL PLATFORM & MEMBERSHIP x PER MONTH FEES + PAYMENTS = OPERATIONS REVENUE Diversified Customer Base Membership by Line of Business1 Customer Mix By Channel1* 13% 11% 17% 7% Health System Medicaid Physician Group Medicare 33% 54% Regional Payer Commercial 65% National Payer 1) As of June 30, 2020 *Based on percentage of revenue YTD 57 Confidential – Do Not Distribute

2 Multiple Growth Channels Customer Revenue Example Add New Customers New • Targeted six-to-eight in 2020, with seven announced YTD in 2020 Partnership • Broader service offering and end markets provide increased confidence Expand with Existing Customers • Same store growth has accounted for ~40% of our organic growth Membership since 2017 Expansion • For example: Two states contracted for cardiovascular services with Molina, with opportunity to expand • Large cross-sell opportunity Cross-Sell Cross-Sell to Existing Customers • 40% of specialty care management customers have only one specialty 58 Confidential – Do Not Distribute

3 Margin Profile Drives Strong Cash Flow At Scale Target SG&A Gross Margin Improvement Fixed Cost Leverage Cost Reductions • Significant ($65M+) reductions • High flow through on new life • Sales and overhead infrastructure in achieved in 2020 vs. 2019 additions. Gross margin on place to drive growth for several years • Additional efficiencies identified in membership expansion within an shared services and corporate existing line of business at existing overhead customer can be 2-3x initial gross margin • Automation drives lasting value. Machine learning and automation lower need for manual intervention At target growth rates, SG&A leverage Annual Gross Margin Opportunity of drives ~100 bps of margin expansion 100-200 bps per year Targeting gross $20-25M Cumulative annual opportunity to drive 200-300 bps of annual incremental SG&A cost reduction Adjusted EBITDA Margin improvement to achieve mid-teens target by 2021 59 Confidential – Do Not Distribute

4 Capital Investment Strategy has Enhanced Services Differentiation and More than Doubled Total Addressable Market Services Differentiation and Expansion Share of Capital Deployment1 • Vast majority of deployed capital into both internal product development and core M&A • Modest capital deployed in customer alignment with strong IRRs >85% – future focused on driving alignment through performance-based Services differentiation arrangements with minimal capital requirements and expansion • Significantly expanded Total Addressable Market Health Plan Investments • Three equity investments made in existing Health Plans • All three divested or in strategic review process; anticipate <15% positive aggregate cash returns for divestitures in process Health plan • No future investments in Health Plans investments 1) Since January 1, 2015. 60 Confidential – Do Not Distribute

5 Positive Cash Generation Focused on Continuing to Strengthen Balance Sheet 6/30/2020 Cash and Debt Actions 2021+ Cash and Investments: $115M • August 2020 Convertible Note Pay off Senior Term Loan Refinancing eliminated near-term maturity Senior Term Loan: $75M No maturities until 2024 2021 Convertible Notes: $125M • Passport/Molina transaction expected 2025 Convertible Notes: $175M Expect positive EBITDA less CapEx to return $130M-$170M3 in capital to Evolent • 7% Senior Debt to Capital ratio1 2 • 3x Senior Leverage • Plan to prepay Senior Term Loan with • Expect positive cash flow full year 2020 proceeds from Passport transaction 1) 7% Senior Debt to Capital Ratio is the Senior Term Loan divided by the market capitalization using the closing price on September 26, 2020 ($1.063B). 2) 3X Senior Leverage is the Senior Term Loan divided by $24M LTM Adjusted EBITDA. 3) Inclusive of repayment of $40M surplus note; ultimate inflow to Evolent will depend on plan performance and other factors. 61 Confidential – Do Not Distribute
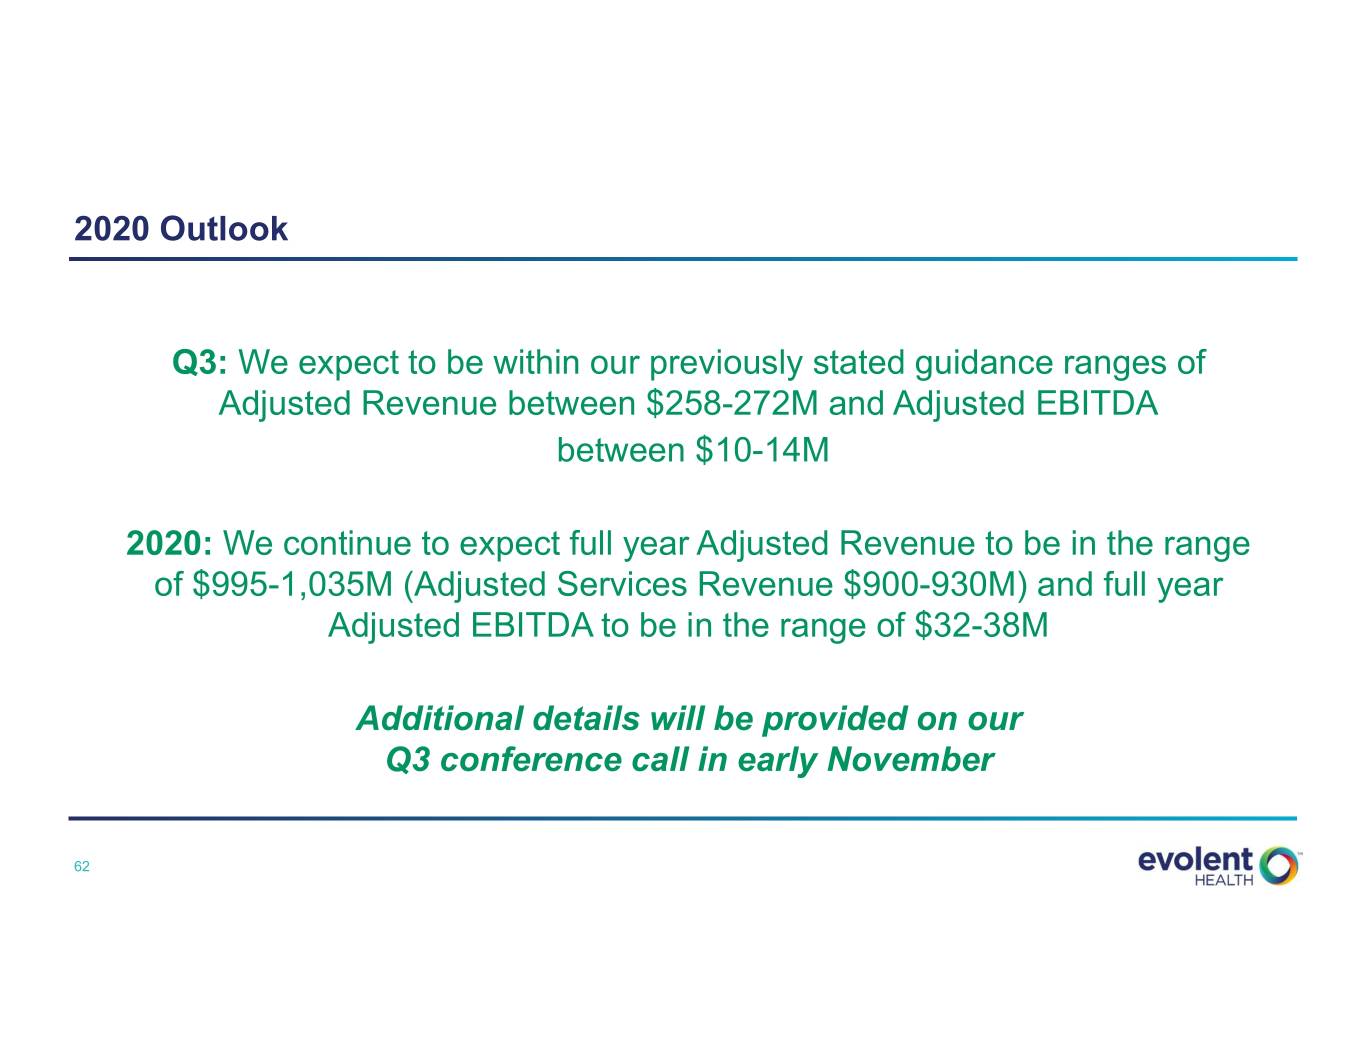
2020 Outlook Q3: We expect to be within our previously stated guidance ranges of Adjusted Revenue between $258-272M and Adjusted EBITDA between $10-14M 2020: We continue to expect full year Adjusted Revenue to be in the range of $995-1,035M (Adjusted Services Revenue $900-930M) and full year Adjusted EBITDA to be in the range of $32-38M Additional details will be provided on our Q3 conference call in early November 62 Confidential – Do Not Distribute

Wrap-Up 63 Confidential – Do Not Distribute
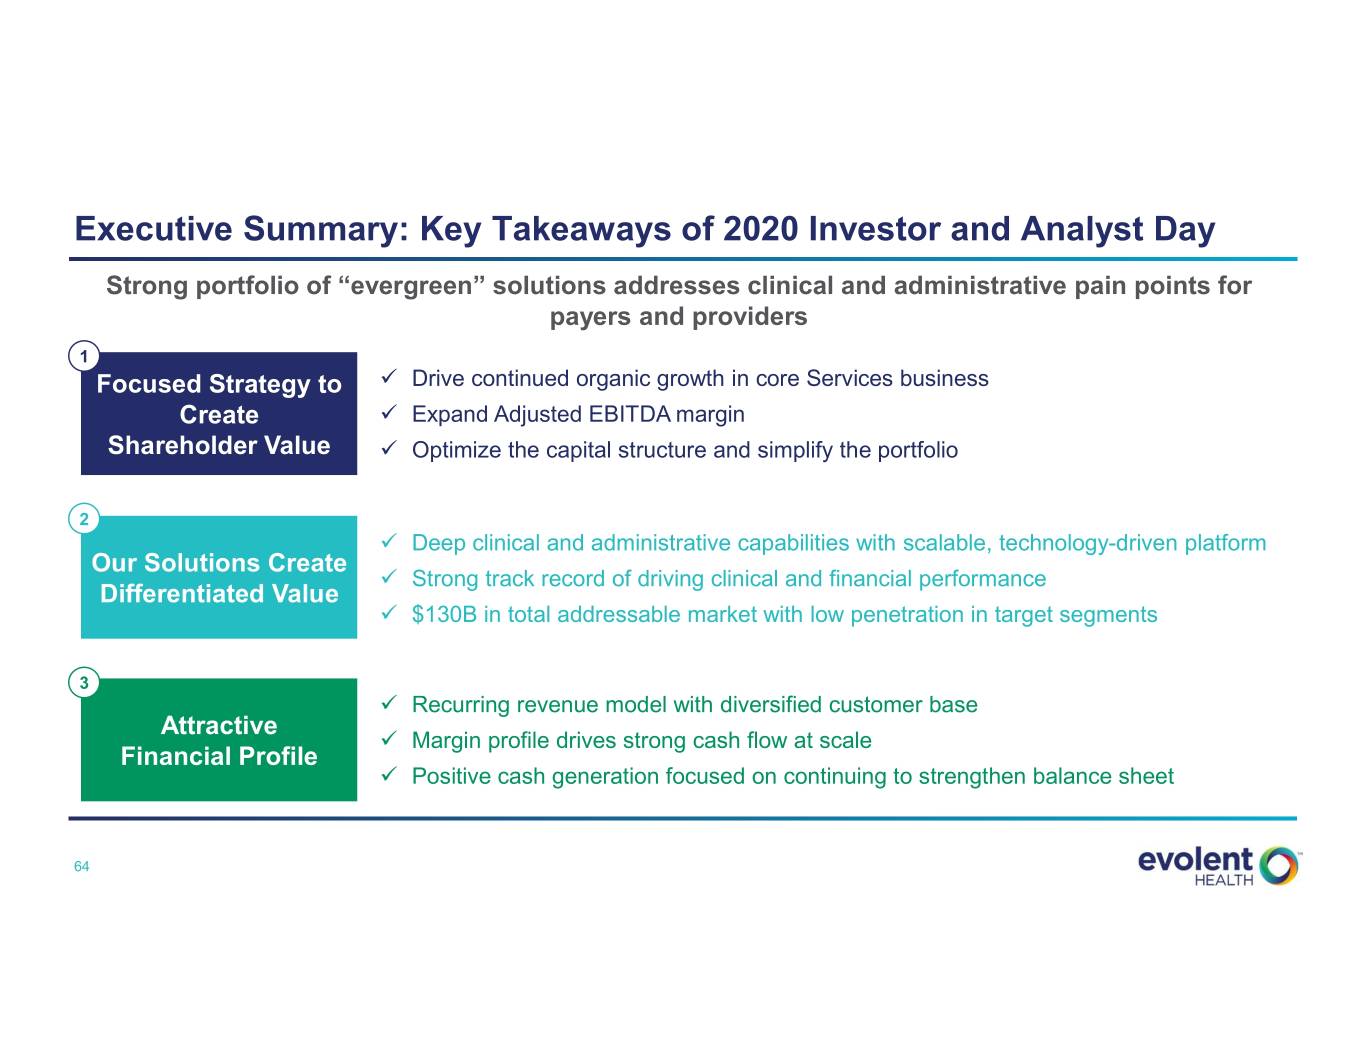
Executive Summary: Key Takeaways of 2020 Investor and Analyst Day Strong portfolio of “evergreen” solutions addresses clinical and administrative pain points for payers and providers 1 Focused Strategy to Drive continued organic growth in core Services business Create Expand Adjusted EBITDA margin Shareholder Value Optimize the capital structure and simplify the portfolio 2 Deep clinical and administrative capabilities with scalable, technology-driven platform Our Solutions Create Strong track record of driving clinical and financial performance Differentiated Value $130B in total addressable market with low penetration in target segments 3 Recurring revenue model with diversified customer base Attractive Margin profile drives strong cash flow at scale Financial Profile Positive cash generation focused on continuing to strengthen balance sheet 64 Confidential – Do Not Distribute

Q&A 65 Confidential – Do Not Distribute

Appendix 66 Confidential – Do Not Distribute

Safe Harbor Statement Certain statements made in this presentation and in other written or oral statements made by us or on our behalf are “forward-looking statements” within the meaning of the Private Securities Litigation Reform Act of 1995 (“PSLRA”). A forward-looking statement is a statement that is not a historical fact and, without limitation, includes any statement that may predict, forecast, indicate or imply future results, performance or achievements, and may contain words like: “believe,” “anticipate,” “expect,” “estimate,” “aim,” “predict,” “potential,” “continue,” “plan,” “project,” “will,” “should,” “shall,” “may,” “might” and other words or phrases with similar meaning in connection with a discussion of future operating or financial performance. In particular, these include statements relating to future actions, trends in our businesses, prospective services, future performance or financial results and the outcome of contingencies, such as legal proceeding, including our ability to expand Adjusted EBITDA margin and grow cashflow, our ability to drive profitable organic growth in our core services business, our ability to achieve a mid-teens annual growth rate in adjusted services revenue in the medium-term, our ability to add new services for New Century Health’s existing customers, our ability to expand the client base, our ability to improve adjusted EBITDA margin by 200-300 basis points per year and reach mid-teens adjusted EBITDA margins and our expectation to be cash flow positive, our ability to streamline overhead and drive annual margin improvement, the proceeds we expect to receive from the Passport/Molina transaction, our plan to prepay the senior term loan with proceeds from the Passport transaction, our ability to close the sale of Lighthouse Health Plan and our expected return of 2-3x our initial investment, our intent to commence the process of Board declassification and removal or supermajority provisions, our expectation of meeting guidance ranges for the third quarter of 2020 and achieving expected financial results for the year ending December 31, 2020. We claim the protection afforded by the safe harbor for forward-looking statements provided by the PSLRA. These statements are only predictions based on our current expectations and projections about future events. Forward-looking statements involve risks and uncertainties that may cause actual results, level of activity, performance or achievements to differ materially from the results contained in the forward-looking statements. Risks and uncertainties that may cause actual results to vary materially, some of which are described within the forward-looking statements, include, among others: the potential negative impact of the COVID-19 pandemic; the economic benefits we expect to receive as a result of the sale of certain assets of Passport may not be realized; the significant portion of revenue we derive from our largest partners, and the potential loss, termination or renegotiation of our relationship or contract with any significant partner, or multiple partners in the aggregate; the loss of future revenues from Passport; the structural change in the market for health care in the United States; uncertainty in the health care regulatory framework, including the potential impact of policy changes; uncertainty in the public exchange market; the uncertain impact of CMS waivers to Medicaid rules and changes in membership and rates; the uncertain impact the results of elections may have on health care laws and regulations; our ability to effectively manage our growth and maintain an efficient cost structure, and to successfully implement cost cutting measures; our ability to offer new and innovative products and services; risks related to completed and future acquisitions, investments, alliances and joint ventures, including the acquisition of assets from New Mexico Health Connections (“NMHC”), and the acquisitions of Valence Health Inc., excluding Cicerone Health Solutions, Inc. (“Valence Health”), Aldera Holdings, Inc. (“Aldera”), NCIS Holdings, Inc. (“New Century Health”), and Passport, which may be difficult to integrate, divert management resources, or result in unanticipated costs or dilute our stockholders; our ability to consummate opportunities in our pipeline; risks relating to our ability to maintain profitability for our total cost of care and New Century Health’s performance-based contracts and products, including capitation and risk-bearing contracts; the growth and success of our partners, which is difficult to predict and is subject to factors outside of our control, including governmental funding reductions and other policy changes, enrollment numbers for our partners’ plans (including in Florida), premium pricing reductions, selection bias in at-risk membership and the ability to control and, if necessary, reduce health care costs; our ability to attract new partners and successfully capture new growth opportunities; the increasing number of risk-sharing arrangements we enter into with our partners; our ability to recover the significant upfront costs in our partner relationships; our ability to estimate the size of our target markets; our ability to maintain and enhance our reputation and brand recognition; consolidation in the health care industry; competition which could limit our ability to maintain or expand market share within our industry; risks related to governmental payer audits and actions, including whistleblower claims; our ability to partner with providers due to exclusivity provisions in our contracts; restrictions and penalties as a result of privacy and data protection laws; adequate protection of our intellectual property, including trademarks; any alleged infringement, misappropriation or violation of third-party proprietary rights; our use of “open source” software; our ability to protect the confidentiality of our trade secrets, know-how and other proprietary information; our reliance on third parties and licensed technologies; our ability to use, disclose, de-identify or license data and to integrate third-party technologies; data loss or corruption due to failures or errors in our systems and service disruptions at our data centers; online security risks and breaches or failures of our security measures, including with respect to privacy of health information; our reliance on Internet infrastructure, bandwidth providers, data center providers, other third parties and our own systems for providing services to our users; our reliance on third-party vendors to host and maintain our technology platform; our ability to contain health care costs, implement increases in premium rates on a timely basis, maintain adequate reserves for policy benefits or maintain cost effective provider agreements; True Health New Mexico’s (“True Health”) ability to enter the individual market; the risk of a significant reduction in the enrollment in our health plan; our ability to accurately underwrite performance-based risk-bearing contracts; risks related to our offshore operations; our dependency on our key personnel, and our ability to attract, hire, integrate and retain key personnel; the impact of additional goodwill and intangible asset impairments on our results of operations; our indebtedness, our ability to service our indebtedness, the impact of covenants in our credit agreement on our business, our ability to access the delayed draw loan under our credit facility and our ability to obtain additional financing; our ability to achieve profitability in the future; the impact of litigation, including the ongoing class action lawsuit; our obligations to make payments to certain of our pre-IPO investors for certain tax benefits we may claim in the future; our ability to utilize benefits under the tax receivables agreement described herein; our obligations to make payments under the tax receivables agreement that may be accelerated or may exceed the tax benefits we realize; the terms of agreements between us and certain of our pre-IPO investors; the conditional conversion feature of the 2025 convertible notes, which, if triggered, could require us to settle the 2025 convertible notes in cash; the impact of the accounting method for convertible debt securities that may be settled in cash; the potential volatility of our Class A common stock price; the potential decline of our Class A common stock price if a substantial number of shares are sold or become available for sale; provisions in our second amended and restated certificate of incorporation and second amended and restated by-laws and provisions of Delaware law that discourage or prevent strategic transactions, including a takeover of us; the ability of certain of our investors to compete with us without restrictions; provisions in our second amended and restated certificate of incorporation which could limit our stockholders’ ability to obtain a favorable judicial forum for disputes with us or our directors, officers or employees; our intention not to pay cash dividends on our Class A common stock; and our ability to remediate our material weaknesses and to maintain effective internal control over certain instances of one of our claims processing systems. The risks included here are not exhaustive. Although we believe the expectations reflected in the forward-looking statements are reasonable, we cannot guarantee future results, level of activity, performance or achievements. Our Annual Report on Form 10-K for the year ended December 31, 2019, our Quarterly Report on Form 10-Q for the quarterly period ended June 30, 2020, and other documents filed with the SEC include additional factors that could affect our businesses and financial performance. Moreover, we operate in a rapidly changing and competitive environment. New risk factors emerge from time to time, and it is not possible for management to predict all such risk factors. Further, it is not possible to assess the effect of all risk factors on our businesses or the extent to which any factor, or combination of factors, may cause actual results to differ materially from those contained in any forward-looking statements. Given these risks and uncertainties, investors should not place undue reliance on forward-looking statements as a prediction of actual results. In addition, we disclaim any obligation to update any forward-looking statements to reflect events or circumstances that occur after the date of this presentation. 67 Confidential – Do Not Distribute

Non-GAAP Financial Measures and Disclaimer In addition to disclosing financial results that are determined in accordance with GAAP, we present and discuss Adjusted Revenue, Adjusted Transformation Revenue, Adjusted Platform and Operations Revenue, Adjusted Services Revenue, Adjusted EBITDA, and Adjusted EBITDA Margin, which are all non-GAAP financial measures, as supplemental measures to help investors evaluate our fundamental operational performance. Adjusted Services Revenue, Adjusted Transformation Revenue and Adjusted Platform and Operations Revenue are defined as services revenue, transformation revenue, platform and operations revenue, respectively, adjusted to exclude the impact of purchase accounting adjustments. In addition, the company’s Adjusted Transformation Services Revenue and Adjusted Platform and Operations Services Revenue for the year ended December 31, 2018, include a $4.5 million adjustment related to revenue that was contracted for prior to 2018 and that was properly excluded from revenue in our 2017 results under the revenue recognition rules then in effect under Accounting Standards Codification (“ASC”) 605. On January 1, 2018, we adopted the new revenue recognition rules under ASC 606 using the modified retrospective method, which required us to include this $4.5 million as part of the cumulative transition adjustment to beginning retained earnings as of January 1, 2018. Under ASC 605, and based on proportionate performance revenue recognition, we would have recognized an additional $4.5 million in revenue during 2018, primarily within our Adjusted Transformation Services Revenue. The company has therefore included this revenue, and related profit, in its adjusted results for the year ended December 31, 2018, as they had not been previously reported prior to 2018 and the contracts are expected to be completed within 2018. This is a one-time adjustment and it will not reoccur in future periods. Adjusted Revenue is defined as the sum of Adjusted Services Revenue and True Health Premium Revenue less intercompany eliminations. Evolent Health, Inc. is a holding company and its principal asset is all of the common units in its operating subsidiary, Evolent Health LLC, which has owned all of its operating assets and substantially all of its business since inception. Prior to the offering reorganization on June 4, 2015, the predecessor of Evolent Health, Inc. accounted for Evolent Health LLC as an equity method investment. The financial results of Evolent Health LLC have been consolidated in the financial statements of Evolent Health, Inc. following the offering reorganization. Management uses Adjusted Revenue, Adjusted Services Revenue, Adjusted Transformation Revenue and Adjusted Platform and Operations Revenue as supplemental performance measures because they reflect a complete view of the operational results. The measures are also useful to investors because they reflect the full view of our operational performance in line with how we generate our long term forecasts. Adjusted EBITDA is the sum of Services Adjusted EBITDA and True Health Adjusted EBITDA and is defined as EBITDA (net income (loss) attributable to Evolent Health, Inc. before interest income, interest expense, (provision) benefit for income taxes, depreciation and amortization expenses), adjusted to exclude income (loss) from equity method investees, gain (loss) on disposal of assets, changes in fair value of contingent consideration and indemnification asset, other income (expense), net, net (income) loss attributable to non-controlling interests, ASC 606 transition adjustments, purchase accounting adjustments, stock-based compensation expenses, severance costs, amortization of contract cost assets recorded as a result of a one-time ASC 606 transition adjustment, transaction costs related to acquisitions and business combinations, and other one-time adjustments. Management uses Adjusted EBITDA as a supplemental performance measure because the removal of transaction costs, one-time or non-cash items (e.g. depreciation, amortization and stock-based compensation expenses) allows us to focus on operational performance. We believe that this measure is also useful to investors because it allows further insight into the period over period operational performance in a manner that is comparable to other organizations in our industry and in the market in general. Adjusted EBITDA Margin is defined as Adjusted EBITDA divided by Adjusted Revenue. These adjusted measures do not represent and should not be considered as alternatives to GAAP measurements, and our calculations thereof may not be comparable to similarly entitled measures reported by other companies. A reconciliation of these adjusted measures to the comparable GAAP financial measures is presented in the Appendix. 68 Confidential – Do Not Distribute

Appendix A – Adjusted Revenue Reconciliation Evolent Evolent Evolent Health, Evolent Health LLC Health, Inc. Evolent Health, Evolent Health LLC Health, Inc. ($ in millions) Inc. as Reported Operations Adjustments as Adjusted ($ in millions) Inc. as Reported Operations Adjustments as Adjusted Q2 2020 Guidance – Q3 2020 (3) Transformation services $0.8 $- $- $0.8 Services revenue $240.0 $- $- $240.0 Platform and operations services 212.4 - - 212.4 Premiums 25.0 - - 25.0 Services revenue 213.2 - - 213.2 Total revenue $265.0 - - $265.0 Premiums 25.5 - - 25.5 Total revenue $238.6 $- $- $238.6 Guidance – Full Year 2020 (4) Services revenue $915.0 $- $- $915.0 2019 Premiums 100.0 - - 100.0 Transformation services $15.2 $- $- $15.2 Total revenue $1,015.0 - - $1,015.0 Platform and operations services(1) 659.4 - 1.9 661.4 Services revenue 674.6 - 1.9 676.5 (1) Adjustments to platform and operations services revenue include deferred revenue purchase accounting adjustments of Premiums 171.7 - - 171.7 approximately $1.9 million and $0.9 million for the years ended December 31, 2019 and 2018, respectively. Adjustments to Total revenue $846.4 $- $1.9 $848.3 transformation services revenue and platform and operations services revenue for the year ended December 31, 2018, include approximately $3.6 million and $0.8 million, respectively, resulting from our transition adjustments related to the implementation of ASC 606. 2018 (2) Adjustments to platform and operations services revenue include deferred revenue purchase accounting adjustments of Transformation services(1) $32.9 $- $3.6 $36.5 approximately $1.4 million for the year ended December 31, 2017, resulting from our acquisitions and business combinations. Platform and operations services(1) 500.2 - 1.7 501.9 Services revenue 533.1 - 5.3 538.4 (3) Represents the mid-point of the guidance range. For the three months ended September 30, 2020, Adjusted Revenue is Premiums 94.0 - - 94.0 expected to be in the range of approximately $258.0 million to $272.0 million. The components of Adjusted Revenue include Adjusted Services revenue, which is forecasted to be approximately $235.0 million to $245.0 million, and True Health Total revenue $627.1 $- $5.3 $632.4 premiums revenue, which is forecasted to be approximately $28.0 million to $32.0 million; intersegment eliminations are forecasted to be approximately $(5.0) million for the quarter. 2017 (4) Represents the mid-point of the guidance range. For the full year 2020, Adjusted Revenue is expected to be in the range of Transformation services $29.5 $- $- $29.5 approximately $995.0 million to $1.035 billion. The components of Adjusted Revenue include Adjusted Services revenue, which (2) is forecasted to be approximately $900.0 million to $930.0 million, and True Health premiums revenue, which is forecasted to Platform and operations services 405.5 - 1.4 406.9 be approximately $115.0 million to $125.0 million; intersegment eliminations are forecasted to be approximately $(20.0) million Total revenue $435.0 - $1.4 $436.4 for the full year. 69 Confidential – Do Not Distribute

Appendix B – Evolent Health, Inc. Adjusted EBITDA Reconciliation Three Months Ended Guidance ($ in millions) 6/30/2020 Q3 2020 FY 2020 Net loss attributable to common shareholders of Evolent Health, Inc. $(203.5) $(16.2) $(316.1) Less: Interest income 0.8 0.9 3.5 Interest expense (6.3) (6.4) (25.3) Benefit for income taxes 3.9 - 3.6 Depreciation and amortization expenses (15.8) (16.0) (63.9) EBITDA (186.2) 5.3 (234.0) Less: Goodwill impairment (215.1) - (215.1) Impairment of equity method investees - - (47.1) Gain (loss) from equity method investees 25.1 - 24.7 Gain (loss) on disposal of assets - - (6.4) Gain on change in fair value of contingent consideration (0.8) - 3.1 Other income (expense), net 0.4 - 0.3 Net loss attributable to non-controlling interests - - - Purchase accounting adjustments - - - Stock-based compensation expense (3.7) (3.8) (14.7) Severance costs - (0.5) (7.0) Amortization of contract cost assets (0.8) (0.8) (2.7) Acquisition-related costs (0.4) (1.7) (4.0) Adjusted EBITDA $9.0 $12.0 $35.0 70 Confidential – Do Not Distribute
