Attached files
| file | filename |
|---|---|
| 8-K - FORM 8-K - RITE AID CORP | tm2031523-1_8k.htm |
| EX-99.1 - EXHIBIT 99.1 - RITE AID CORP | tm2031523d1_ex99-1.htm |
Exhibit 99.2


2 Cautionary Statement Regarding Forward Looking Statements Statements in this presentation that are not historical, are forward - looking statements made pursuant to the safe harbor provisions of the Private Securities Litigation Reform Act of 1995 . Such statements include, but are not limited to, statements regarding Rite Aid Corporation’s (the “Company”) outlook and guidance for fiscal 2021 ; the ability to generate positive free cash flow in fiscal 2021 ; the continued impact of the recent global coronavirus ( COVID - 19 ) pandemic on the Company’s business ; and any assumptions underlying any of the foregoing . Words such as “anticipate,” “believe,” “continue,” “could,” “estimate,” “expect,” “intend,” “may,” “plan,” “predict,” “project,” “should,” and “will” and variations of such words and similar expressions are intended to identify such forward - looking statements . These forward - looking statements are not guarantees of future performance and involve risks, assumptions and uncertainties, including, but not limited to : the impact of COVID - 19 on the Company’s workforce, operations, stores, expenses and supply chain, and the operations of the Company’s customers, suppliers and business partners ; the Company’s ability to successfully implement its new business strategy (including any delays and adjustments as a result of COVID - 19 ) and improve the operating performance of its stores ; Company’s high level of indebtedness and its ability to satisfy its obligations and the other covenants contained in the Company’s debt agreements ; general competitive, economic, industry, market, political (including healthcare reform) and regulatory conditions, civil unrest (including any resulting store closures, damage, or loss of inventory), as well as other factors specific to the markets in which we operate ; the impact of private and public third - party payers continued reduction in prescription drug reimbursements and efforts to encourage mail order ; the Company’s ability to manage expenses and its investments in working capital ; the Company’s ability to achieve the benefits of the Company’s efforts to reduce the costs of its generic and other drugs ; the Company’s ability to achieve cost savings and other benefits of its organizational restructuring within the Company’s anticipated timeframe, if at all ; and outcomes of legal and regulatory matters ; the Company’s ability to partner and have relationships with health plans and health systems . These and other risks, assumptions and uncertainties are more fully described in Item 1 A (Risk Factors) of the Company’s most recent Annual Report on Form 10 - K, in Item 1 A (Risk Factors) of the Company’s Quarterly Report on Form 10 - Q filed on July 2 , 2020 and in other documents that it files or furnishes with the Securities and Exchange Commission (the “SEC”), which you are encouraged to read . To the extent that COVID - 19 adversely affects the Company’s business and financial results, it may also have the effect of heightening many of such risk factors . Should one or more of these risks or uncertainties materialize, or should underlying assumptions prove incorrect, actual results may vary materially from those indicated or anticipated by such forward - looking statements . Accordingly, you are cautioned not to place undue reliance on these forward - looking statements, which speak only as of the date they are made . The degree to which COVID - 19 may adversely affect the Company’s results and operations, including its ability to achieve its outlook for fiscal 2021 guidance, will depend on numerous evolving factors and future developments, which are highly uncertain, including, but not limited to, the duration and spread of the outbreak, its severity, the actions to contain the virus or treat its impact (including travel bans and restrictions, quarantines, shelter - in - place orders and shutdowns), and how quickly and to what extent normal economic and operating conditions can resume . As a result, the impact on the Company’s financial and operating results cannot be reasonably estimated with specificity at this time, but the impact could be material . The Company expressly disclaims any current intention to update publicly any forward - looking statement after the distribution of this presentation, whether as a result of new information, future events, changes in assumptions or otherwise .

3 The following presentation includes the non - GAAP financial measures, Adjusted EBITDA, Adjusted Net Income (Loss), Adjusted Net Income (Loss) per Diluted Share, Adjusted EBITDA Gross Profit and Adjusted EBITDA SG&A . The Company defines Adjusted EBITDA as net income (loss) excluding the impact of income taxes, interest expense, depreciation and amortization, LIFO adjustments, charges or credits for facility closing and impairment, goodwill and intangible asset impairment charges, inventory write - downs related to store closings, gains or losses on debt retirements and modifications, the WBA merger termination fee, and other items (including stock - based compensation expense, merger and acquisition - related costs, a non - recurring litigation settlement, severance, restructuring - related costs and costs related to facility closures and gain or loss on sale of assets) . The presentation includes a reconciliation of Adjusted EBITDA to net income (loss), which is the most directly comparable GAAP financial measure . Adjusted Net Income (Loss) and Adjusted Net Income (Loss) per Diluted Share exclude amortization expense, merger and acquisition - related costs, a non - recurring litigation settlement, gains or losses on debt retirements and modifications, LIFO adjustments, goodwill and intangible asset impairment charges, restructuring - related costs and the WBA merger termination fee . Additionally, the add back of LIFO (credit) charge when calculating Adjusted EBITDA, Adjusted Net Income (Loss) and Adjusted Net Income (Loss) per Diluted Share removes the entire impact of LIFO (credits) charges, and effectively reflects the Company’s results as if the Company was on a FIFO inventory basis . The presentation includes a reconciliation of Adjusted Net Income (Loss) to net income (loss), which is the most directly comparable GAAP financial measure . Adjusted EBITDA Gross Profit includes LIFO adjustments, depreciation and amortization (COGS portion only) and other items . The presentation includes a reconciliation of Adjusted EBITDA Gross Profit to Revenue, which is the most directly comparable GAAP financial measure . Adjusted EBITDA SG&A excludes depreciation and amortization (SG&A portion only), stock - based compensation expense, merger and acquisition - related costs, litigation settlement and other items . The presentation includes a reconciliation of Adjusted EBITDA SG&A to Revenue, which is the most directly comparable GAAP financial measure . Non - GAAP Financial Measures

$151.6 Adjusted EBITDA* 5 Q2 FY2021 at a Glance 2.6% Script count growth 6.1% Increase in FE same store sales (excluding tobacco ) 29% Increase in revenues at Elixir 11.5% Increase in revenues 130 Basis point increase in front - end dollar market share *Adjusted EBITDA reconciliation located in the Appendix

6 Key Second Quarter FY2021 Highlights Revenue increased 11.5% and Adjusted EBITDA increased $17.4 million to $151.6 million Retail Pharmacy: x Front end comparable sales increased 6.1% (excluding tobacco related products) x Pharmacy comparable sales increased 2.3% x Same store 30 - day equivalent prescription count grew 2.6% x Reduced SG&A expenses x Acute prescription declined 4.9%, but improved sequentially throughout the quarter Elixir: x Revenue increased 29.1% to $2.0 billion x Mail order revenue up 21%, and specialty revenue up 5% x Improved pharmacy network management x Reduced SG&A expenses performance Bond Exchange : Recently completed an exchange offer of $1.063 billion aggregate principal amount of outstanding 6.125% Senior Notes Due 2023 fo r a combination of newly issued $850 million of 8.0% Senior Secured Notes Due November 2026 and cash which significantly improves ou r maturity profile.

7 Continued progress on our key strategic pillars Becoming the dominant mid - market PBM Unlocking the value of our pharmacists Renewing our retail and digital experience
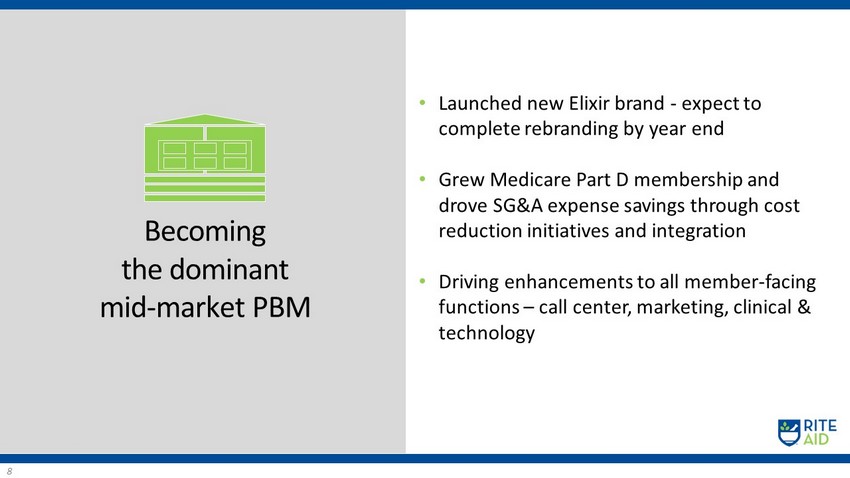
8 Becoming the dominant mid - market PBM • Launched new Elixir brand - expect to complete rebranding by year end • G rew Medicare Part D membership and drove SG&A expense savings through cost reduction initiatives and integration • Driving enhancements to all member - facing functions – call center, marketing, clinical & technology

9 • Positioning pharmacists to deliver comprehensive care by fusing traditional medicine and alternative remedies • 6,300 pharmacists in training for immunity, holistic care & new customer engagement tools • Empowering pharmacists to make informed product recommendations • Currently operating 300 COVID - 19 testing sites and have conducted more than 550,000 tests Unlocking the value of our pharmacists
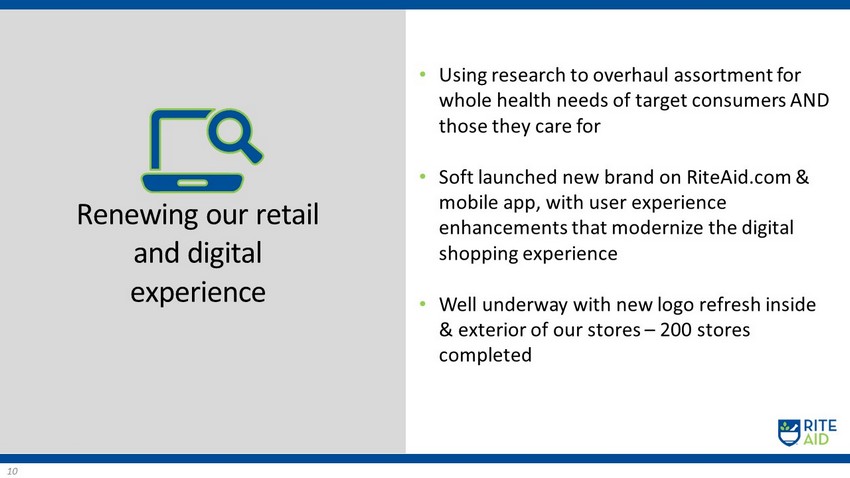
10 • Using research to overhaul assortment for whole health needs of target consumers AND those they care for • Soft launched new brand on RiteAid.com & mobile app, with user experience enhancements that modernize the digital shopping experience • Well underway with new logo refresh inside & exterior of our stores – 200 stores completed Renewing our retail and digital experience


12 Total Revenues $23.5B – $24.0B Same Store Sales 3.0% - 4.0% Adjusted EBITDA $475M - $525M Net Loss $190M - $140M Adjusted net (loss)/income per share $(0.67) - $0.09 FY 2021 Guidance

($ in thousands) FY 2021 Guidance 13 Guidance Range Low High Total Revenues $ 23,500,000 $ 24,000,000 PBM Revenues $ 7,550,000 $ 7,650,000 Same store sales 3.00% 4.00% Gross Capital Expenditures $ 275,000 $ 275,000 Reconciliation of net loss to adjusted EBITDA: Net loss $ (190,000) $ (140,000) Adjustments: Interest expense 202,000 202,000 Income tax benefit (12,000) (7,000) Depreciation and amortization 338,000 338,000 LIFO credit (38,000) (38,000) Lease termination and impairment charges 53,000 53,000 Intangible asset impairment charges 30,000 30,000 Gain on debt modification, net (5,300) (5,300) Restructuring - related costs 75,000 75,000 Other 22,300 17,300 Adjusted EBITDA $ 475,000 $ 525,000
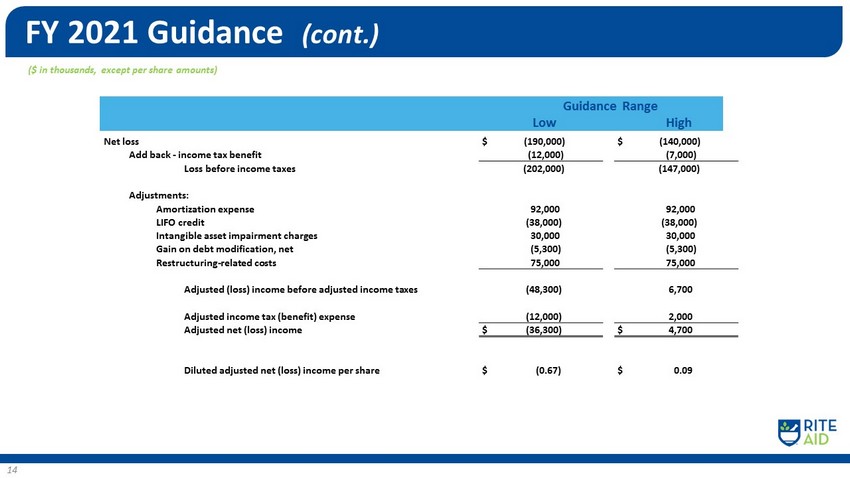
($ in thousands, except per share amounts) FY 2021 Guidance (cont.) 14 Guidance Range Low High Net loss $ (190,000) $ (140,000) Add back - income tax benefit (12,000) (7,000) Loss before income taxes (202,000) (147,000) Adjustments: Amortization expense 92,000 92,000 LIFO credit (38,000) (38,000) Intangible asset impairment charges 30,000 30,000 Gain on debt modification, net (5,300) (5,300) Restructuring - related costs 75,000 75,000 Adjusted (loss) income before adjusted income taxes (48,300) 6,700 Adjusted income tax (benefit) expense (12,000) 2,000 Adjusted net (loss) income $ (36,300) $ 4,700 Diluted adjusted net (loss) income per share $ (0.67) $ 0.09

($ in thousands) FY 2021 Guidance (cont.) 15 Guidance Range Low High Adjusted EBITDA $ 475,000 $ 525,000 Cash interest expense (189,000) (189,000) Restructuring - related costs (75,000) (75,000) Closed store rent (26,000) (26,000) Working capital benefit 200,000 200,000 Cash flow from operations 385,000 435,000 Gross capital expenditures (275,000) (275,000) Free cash flow $ 110,000 $ 160,000

($ in millions, except per share amounts) Q2 Fiscal 2021 Summary 17 Revenues $ 5,982.0 $ 5,366.3 Net Loss $ (13.2) $ (78.7) Net Loss per Diluted Share $ (0.25) $ (1.48) Adjusted Net Income per Diluted Share $ 0.25 $ 0.12 Adjusted EBITDA $ 151.6 2.53% $ 134.2 2.50% Note: Data on this slide and throughout the presentation is on a continuing operations basis. 13 Weeks Ended August 29, 2020 13 Weeks Ended August 31, 2019

($ in thousands) Q 2 - Fiscal 2021 Reconciliation of Net Loss to Adjusted EBITDA 18 Net Loss $ (13,197) $ (78,705) Adjustments: • Interest expense 50,007 60,102 • Income tax expense 47 27,628 • Depreciation and amortization 87,117 83,044 • LIFO (credit) charge (8,750) 7,504 • Lease termination and impairment charges 1 1 ,528 1, 471 • Gain on debt modification, net (5,274) - • Merger and Acquisition - related costs - 514 • Stock - based compensation expense 3,936 4,712 • Restructuring - related costs 23,186 25,145 • Inventory write - downs related to store closings 1,058 3,149 • Loss (g ain) on sale of assets, net 1,092 (1,587) • Other 853 1,213 Adjusted EBITDA $ 151,603 $ 134,190 Percent of revenues 2.53% 2.50% 13 Weeks Ended August 29, 2020 13 Weeks Ended August 31, 2019

($ in thousands, except per share amounts) Q2 - Fiscal 2021 Reconciliation of Net Loss to Adjusted Net Income 19 Net Loss $ (13,197) $ (78,705) Add back - Income tax expense 47 27,628 Loss before income taxes $ (13,150) $ (51,077) Adjustments: Amortization expense 22,695 26,596 LIFO (credit) charge (8,750) 7,504 Gain on debt modification, net (5,274) - Merger and Acquisition - related costs - 514 Restructuring - related costs 23,186 ____ 25,145 ______ Adjusted income before income taxes $ 18,707 $ 8,682 Adjusted income tax expense 5,171 2,394 Adjusted net income $ 13,536 $ 6,288 Net loss per diluted share $ (0.25) $ (1.48) Adjusted net income per diluted share $ 0.25 $ 0.12 13 Weeks Ended August 29, 2020 13 Weeks Ended August 31, 2019

Q2 - Fiscal 2021 Summary – Retail Pharmacy Segment 20 (1) Refer to slides 22 and 23 for the reconciliations of these non - GAAP measures to their applicable GAAP measures. ($ in millions) Revenues $ 4,017.9 $ 3,848.1 Adjusted EBITDA Gross Profit (1) $ 1,056.2 26.29% $ 1,045.3 27.16% Adjusted EBITDA SG&A (1) $ 933.9 23.24% $ 952.6 24.75% Adjusted EBITDA $ 122.3 3.04% $ 92.7 2.41% 13 Weeks Ended August 29, 2020 13 Weeks Ended August 31, 2019

($ in millions) Reconciliation of Adj. EBITDA Gross Profit – Retail Pharmacy Segment 21 Revenues $ 4,017.9 $ 3,848.1 Gross Profit 1,061.9 1,032.4 Addback: LIFO (credit) charge (8.8) 7.5 Depreciation and amortization (COGS portion only) 2.2 2.2 Other 0.9 3.2 Adjusted EBITDA Gross Profit $ 1,056.2 $ 1,045.3 Adjusted EBITDA Gross Profit as a percent of revenues 26.29% 27.16% 13 Weeks Ended August 29, 2020 13 Weeks Ended August 31, 2019
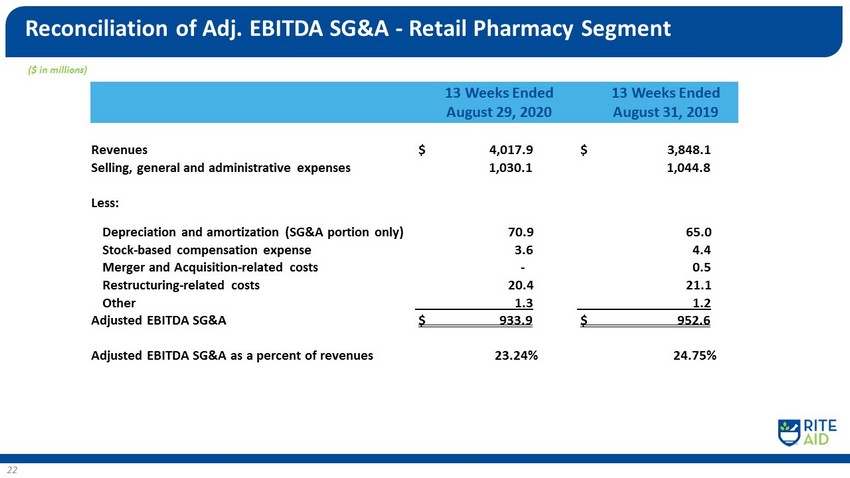
($ in millions) Reconciliation of Adj. EBITDA SG&A - Retail Pharmacy Segment 22 Revenues $ 4,017.9 $ 3,848.1 Selling, general and administrative expenses 1,030.1 1,044.8 Less: Depreciation and amortization (SG&A portion only) 70.9 65.0 Stock - based compensation expense 3.6 4.4 Merger and Acquisition - related costs - 0.5 Restructuring - related costs 20 .4 21.1 Other 1.3 1.2 Adjusted EBITDA SG&A $ 933.9 $ 952.6 Adjusted EBITDA SG&A as a percent of revenues 23.24% 24.75% 13 Weeks Ended August 29, 2020 13 Weeks Ended August 31, 2019

($ in millions) Pharmacy Services Segment Results 23 Revenues $ 2,038.4 $ 1,579.1 Cost of Revenues 1,940.0 1,467.1 Gross Profit 98.4 112.0 Selling, General and Administrative Expenses (86.1) (90.7) Addback: Depreciation and Amortization 14.1 15.9 Restructuring - related costs 2.7 4.1 Other 0.2 0.2 Adjusted EBITDA - Pharmacy Services Segment $ 29.3 $ 41.5 13 Weeks Ended August 29, 2020 13 Weeks Ended August 31, 2019

Comparable Store Sales Growth 24 FRONT END SALES - 1.5% - 1.9% - 0.3% - 1.8% - 0.5% 0.1% 14.2% 4.6% 0.3% - 0.6% 1.0% 1.5% 16.0% 6.1% 3.1% 2.1% 2.3% 1.5% 0.1% 1.6% 2.2% 2.3% 2.4% 0.8% 3.7% 2.7% 2.8% 5.0% 0.4% 2.6% Excluding cigarette and tobacco products (1) Script count growth shown on a 30 - day equivalent basis. FY 2019 FY2020 FY2021

($ in thousands) Capitalization Table 25 August 29, 2020 February 29, 2020 Secured Debt: Senior secured revolving credit facility due December 2023 1,283,365$ 630,833$ FILO Term Loan due December 2023 447,362 446,954 1,730,727 1,077,787 Second Lien Secured Debt: 7.5% senior secured notes due July 2025 590,099 589,073 8.0% senior secured notes due November 2026 830,208 - 1,420,307 589,073 Guaranteed Unsecured Debt: 6.125% senior notes due April 2023 90,253 1,145,060 90,253 1,145,060 Unguaranteed Unsecured Debt: 7.7% notes due February 2027 236,544 236,478 6.875% fixed-rate senior notes due December 2028 28,877 28,870 265,421 265,348 Lease financing obligations 24,837 28,166 Total debt 3,531,545 3,105,434 Current maturities of long-term debt and lease financing obligations (6,902) (8,840) Long-term debt and lease financing obligations, less current maturities 3,524,643$ 3,096,594$ Total debt, gross 3,581,950$ 3,148,043$ Less: Unamortized debt issuance costs (50,405) (42,609) Total Debt per balance sheet: 3,531,545$ 3,105,434$

($ in thousands) Leverage Ratio 26 August 29, 2020 Total Debt: $ 3,531,545 Less: Cash and cash equivalents (92,730) Net Debt $ 3,438,815 LTM Adjusted EBITDA: Retail Pharmacy Segment 379,076 Pharmacy Services Segment 173,593 LTM Adjusted EBITDA $ 552,669 Leverage Ratio 6.22
