Attached files
| file | filename |
|---|---|
| 8-K - FORM 8-K - BEASLEY BROADCAST GROUP INC | d44797d8k.htm |
Exhibit 99.1
|
|
NASDAQ: BBGI
BEASLEY
BROADCAST GROUP
TOMORROW’S MEDIA COMPANY TODAY
INVESTOR PRESENTATION
|
|
Forward-Looking Statements and Non-GAAP
Financial
Measures
BEASLEY
BROADCAST GROUP
This presentation includes certain financial measures that have not been prepared in a manner that complies with generally accepted accounting principles in the United States
(“GAAP”), including, without limitation, EBITDA, Adjusted EBITDA, Station Operating Income (“SOI”) and Free Cash Flow (“FCF”) (collectively, the “non-GAAP financial measures”).
These non-GAAP financial measures are not measures of financial performance in accordance with GAAP and may exclude items that are significant in understanding and assessing the
Company’s financial results. Therefore, these measures should not be considered in isolation or as an alternative to net income, net revenue, net cash
provided by operating activities, earnings per fully-diluted share or other measures of profitability, liquidity or performance under GAAP. Management believes that these non-GAAP financial measures provide meaningful information to investors
because they provide insight into how effectively we operate our business. You should be aware that these non-GAAP financial measures may not be comparable to similarly-titled measures used by other companies. Reconciliations of these non-GAAP
financial measures to the most directly comparable GAAP financial measures can be found in the appendix of this presentation.
Statements in this presentation that
are “forward-looking statements” are based upon current expectations and assumptions, and involve certain risks and uncertainties within the meaning of the U.S. Private Securities Litigation Reform Act of 1995. Words or expressions such as
“believe,” “plan,” “intends,” “expects,” “expected,” “anticipates” or variations of such words and similar expressions are intended to identify such forward-looking statements.
Forward-looking statements by their nature address matters that are, to different degrees, uncertain, such as statements about expected income, revenues and growth. Key risks are described in our reports filed with the Securities and Exchange
Commission (the “SEC”), including in our annual report on Form 10-K and quarterly reports on Form 10-Q. Readers should note that forward-looking statements are subject to change and to inherent risks and uncertainties and may be impacted
by several factors including:
• the effects of the novel coronavirus (“COVID-19”) pandemic, including its potential effects on the economic
environment, our results of operations, liquidity and financial condition; impairments of our Federal Communications Commission (“FCC”) licenses and/or goodwill that will adversely affect our operating results; and any changes to federal,
state or local government laws, regulations or orders in connection with the pandemic;
• external economic forces that could have a material adverse impact on
our advertising revenues and results of operations;
• the ability of our radio stations to compete effectively in their respective markets for advertising
revenues;
• our ability to develop compelling and differentiated digital content, products and services;
• audience acceptance of our content, particularly our radio programs;
• our ability
to respond to changes in technology, standards and services that affect the radio industry;
• our dependence on federally issued licenses subject to extensive
federal regulation;
• actions by the FCC or new legislation affecting the radio industry;
• our dependence on selected market clusters of radio stations for a material portion of our net revenue;
• credit risk on our accounts receivable;
• the risk that our FCC licenses and/or
goodwill could become impaired;
• our substantial debt levels and the potential effect of restrictive debt covenants on our operational flexibility and
ability to pay dividends;
• the potential effects of hurricanes on our corporate offices and radio stations;
• the failure or destruction of the internet, satellite systems and transmitter facilities that we depend upon to distribute our programming;
• disruptions or security breaches of our information technology infrastructure;
•
the loss of key personnel;
• our ability to integrate acquired businesses and achieve fully the strategic and financial objectives related thereto and their
impact on our financial condition and results of operations;
• the fact that we are controlled by the Beasley family, which creates difficulties for any
attempt to gain control of us; and
• other economic, business, competitive, and regulatory factors affecting our business, including those set forth in our
filings with the SEC.
Our actual performance and results could differ materially because of these factors and other factors discussed in the
“Management’s Discussion and Analysis of Results of Operations and Financial Condition” in our SEC filings, including but not limited to our annual reports on Form 10-K or quarterly reports on Form 10-Q, copies of which can be
obtained from the SEC website, www.sec.gov, or our website, www.bbgi.com. While forward-looking statements reflect our good faith beliefs, they are not guarantees of future performance. All information in this presentation is as of the date of this
presentation, and we undertake no obligation to update the information contained herein to actual results or changes to our expectations.
Beasley Broadcast Group
// Investor Presentation 2
|
|

Today’s Presenters
Beasley Broadcast Group
Caroline Beasley
CEO
Marie Tedesco
CFO
Justin Chase
CCO
Tina Murley
SVP, Sales
Beasley Broadcast Group // Investor Presentation 3
|
Table of Contents
I. Beasley Business at a Glance
II. Key Credit Highlights
III. Financial Overview
I. Appendix
Beasley Broadcast Group // Investor Presentation 4
|
|

I. Beasley Business at a Glance
|
|
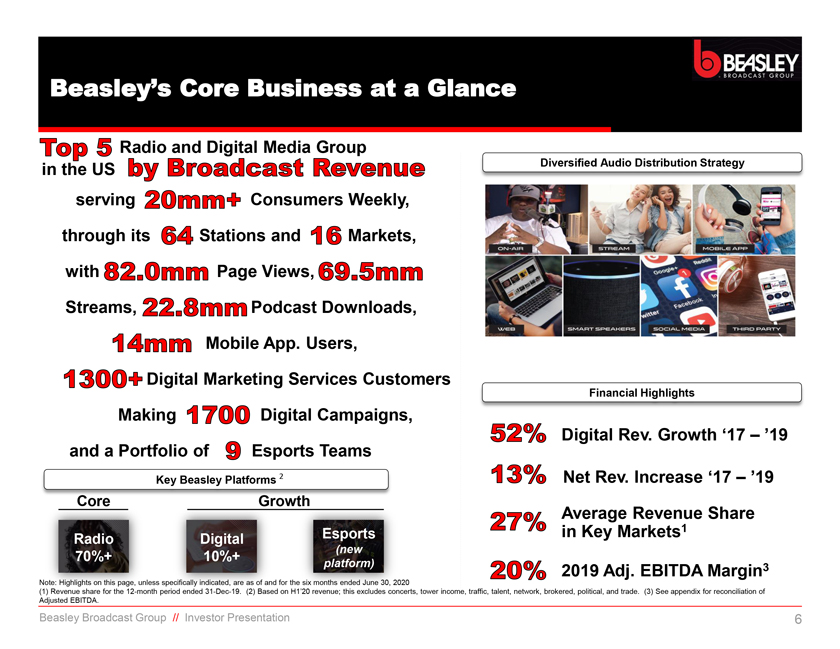
Beasley’s Core Business at a Glance
Radio and
Digital Media Group
in the US
serving Consumers Weekly,
through its Stations and Markets,
with Page Views,
Streams, Podcast Downloads,
Mobile App. Users,
Digital Marketing Services Customers
Making Digital Campaigns,
and a Portfolio of Esports Teams
Key Beasley Platforms 2
Core Growth
Radio 70%+
Digital 10%+
Esports
(new platform)
Diversified Audio Distribution Strategy
Financial Highlights
Digital Rev. Growth ‘17 – ‘19
Net Rev. Increase ‘17 – ‘19
Average Revenue Share in Key Markets1
2019 Adj. EBITDA Margin3
Note: Highlights on this page, unless specifically indicated, are as
of and for the six months ended June 30, 2020
(1) Revenue share for the 12-month period ended 31-Dec-19. (2) Based on H1’20 revenue; this excludes concerts,
tower income, traffic, talent, network, brokered, political, and trade. (3) See appendix for reconciliation of
Adjusted EBITDA.
Beasley Broadcast Group // Investor Presentation 6
|
|
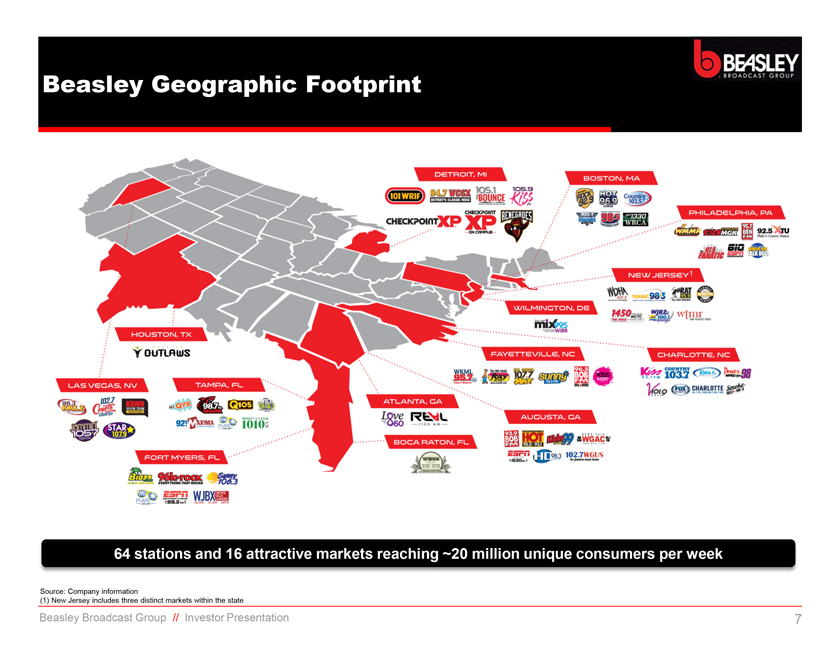
Beasley Geographic Footprint
64 stations and 16
attractive markets reaching ~20 million unique consumers per week
Source: Company information
(1) New Jersey includes three distinct markets within the state
Beasley Broadcast Group //
Investor Presentation 7
|
|
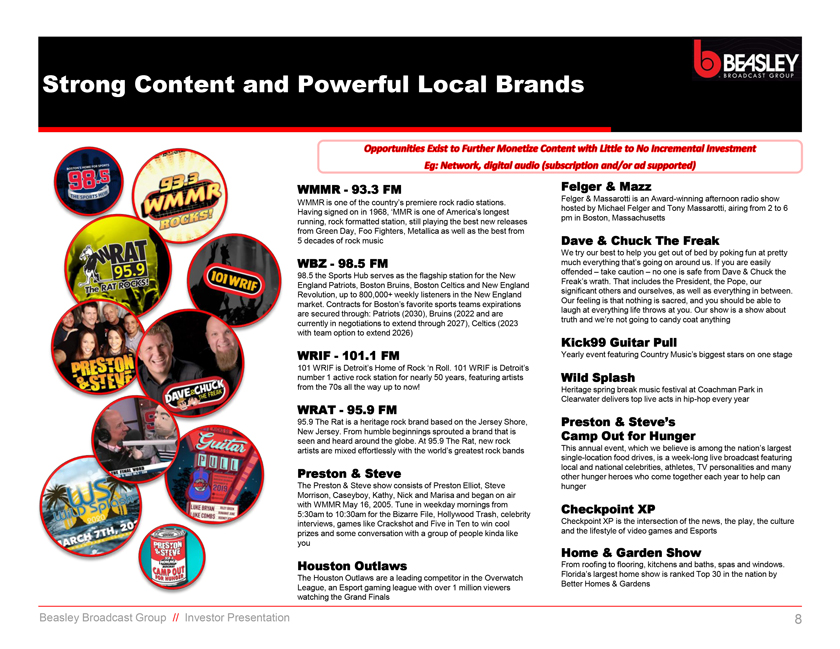
Strong Content and Powerful Local Brands
WMMR - 93.3
FM
WMMR is one of the country’s premiere rock radio stations. Having signed on in 1968, ‘MMR is one of America’s longest running, rock formatted
station, still playing the best new releases from Green Day, Foo Fighters, Metallica as well as the best from 5 decades of rock music
WBZ - 98.5 FM
98.5 the Sports Hub serves as the flagship station for the New
England Patriots, Boston
Bruins, Boston Celtics and New England
Revolution, up to 800,000+ weekly listeners in the New England market. Contracts for Boston’s favorite sports teams
expirations are secured through: Patriots (2030), Bruins (2022 and are currently in negotiations to extend through 2027), Celtics (2023 with team option to extend 2026)
WRIF - 101.1 FM
101 WRIF is Detroit’s Home of Rock ‘n Roll. 101 WRIF is
Detroit’s number 1 active rock station for nearly 50 years, featuring artists from the 70s all the way up to now!
WRAT - 95.9 FM
95.9 The Rat is a heritage rock brand based on the Jersey Shore, New Jersey. From humble beginnings sprouted a brand that is seen and heard around the globe. At 95.9 The Rat, new
rock artists are mixed effortlessly with the world’s greatest rock bands
Preston & Steve
The Preston & Steve show consists of Preston Elliot, Steve Morrison, Caseyboy, Kathy, Nick and Marisa and began on air with WMMR May 16, 2005. Tune in weekday mornings from
5:30am to 10:30am for the Bizarre File, Hollywood Trash, celebrity interviews, games like Crackshot and Five in Ten to win cool prizes and some conversation with a group of people kinda like you
Outlaws Houston
The Houston Outlaws are a leading competitor in the Overwatch League, an
Esport gaming league with over 1 million viewers watching the Grand Finals
Felger & Mazz
Felger & Massarotti is an Award-winning afternoon radio show hosted by Michael Felger and Tony Massarotti, airing from 2 to 6 pm in Boston, Massachusetts
Dave & Chuck The Freak
We try our best to help you get out of bed by poking fun at pretty
much everything that’s going on around us. If you are easily offended – take caution – no one is safe from Dave & Chuck the
Freak’s wrath.
That includes the President, the Pope, our significant others and ourselves, as well as everything in between. Our feeling is that nothing is sacred, and you should be able to laugh at everything life throws at you. Our show is a show about truth
and we’re not going to candy coat anything
Guitar Pull Kick99
Yearly
event featuring Country Music’s biggest stars on one stage
Splash Wild
Heritage spring break music festival at Coachman Park in Clearwater delivers top live acts in hip-hop every year
Preston & Steve’s Camp Out for Hunger
This annual event, which we believe is among
the nation’s largest single-location food drives, is a week-long live broadcast featuring local and national celebrities, athletes, TV personalities and many other hunger heroes who come together each year to help can hunger
XP Checkpoint
Checkpoint XP is the intersection of the news, the play, the culture and the
lifestyle of video games and Esports
Home & Garden Show
From roofing to
flooring, kitchens and baths, spas and windows.
Florida’s largest home show is ranked Top 30 in the nation by
Better Homes & Gardens
Beasley Broadcast Group // Investor Presentation 8
|
|
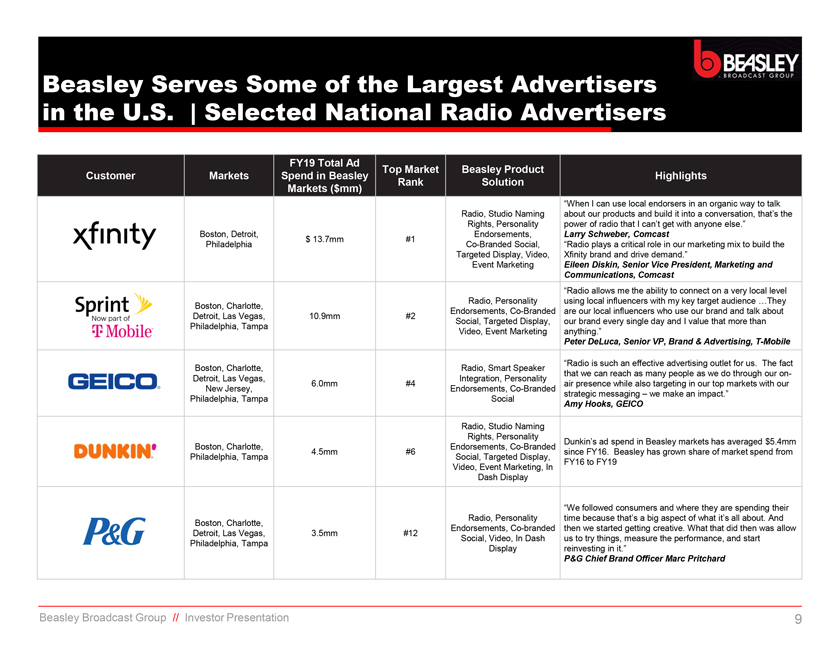
Beasley Serves Some of the Largest Advertisers in the U.S. | Selected National Radio Advertisers
Customer Markets
Boston, Detroit, Philadelphia
Boston, Charlotte, Detroit, Las Vegas, Philadelphia, Tampa
Boston, Charlotte, Detroit, Las
Vegas, New Jersey, Philadelphia, Tampa
Boston, Charlotte, Philadelphia, Tampa
Boston, Charlotte, Detroit, Las Vegas, Philadelphia, Tampa
FY19 Total Ad
Spend in Beasley
Markets ($mm) $ 13.7mm 10.9mm
6.0mm
4.5mm
3.5mm
Top Market Rank
#1 #2 #4 #6 #12
Beasley Product Solution
Radio, Studio Naming Rights, Personality Endorsements, Co-Branded
Social, Targeted Display, Video, Event Marketing
Radio, Personality Endorsements, Co-Branded Social, Targeted Display, Video, Event Marketing
Radio, Smart Speaker Integration, Personality Endorsements, Co-Branded Social
Radio, Studio
Naming Rights, Personality Endorsements, Co-Branded Social, Targeted Display, Video, Event Marketing, In Dash Display Radio, Personality Endorsements, Co-branded Social, Video, In Dash Display
Highlights
“When I can use local endorsers in an organic way to talk about our products
and build it into a conversation, that’s the power of radio that I can’t get with anyone else.”
Larry Schweber, Comcast
“Radio plays a critical role in our marketing mix to build the Xfinity brand and drive demand.”
Eileen Diskin, Senior Vice President, Marketing and Communications, Comcast
“Radio allows
me the ability to connect on a very local level using local influencers with my key target audience …They are our local influencers who use our brand and talk about our brand every single day and I value that more than anything.”
Peter DeLuca, Senior VP, Brand & Advertising, T-Mobile
“Radio is
such an effective advertising outlet for us. The fact that we can reach as many people as we do through our on-air presence while also targeting in our top markets with our strategic messaging – we make an impact.”
Amy Hooks, GEICO
Dunkin’s ad spend in Beasley markets has averaged $5.4mm since FY16.
Beasley has grown share of market spend from FY16 to FY19
“We followed consumers and where they are spending their time because that’s a big aspect of
what it’s all about. And then we started getting creative. What that did then was allow us to try things, measure the performance, and start reinvesting in it.”
P&G Chief Brand Officer Marc Pritchard
Beasley Broadcast Group // Investor Presentation 9
|
|
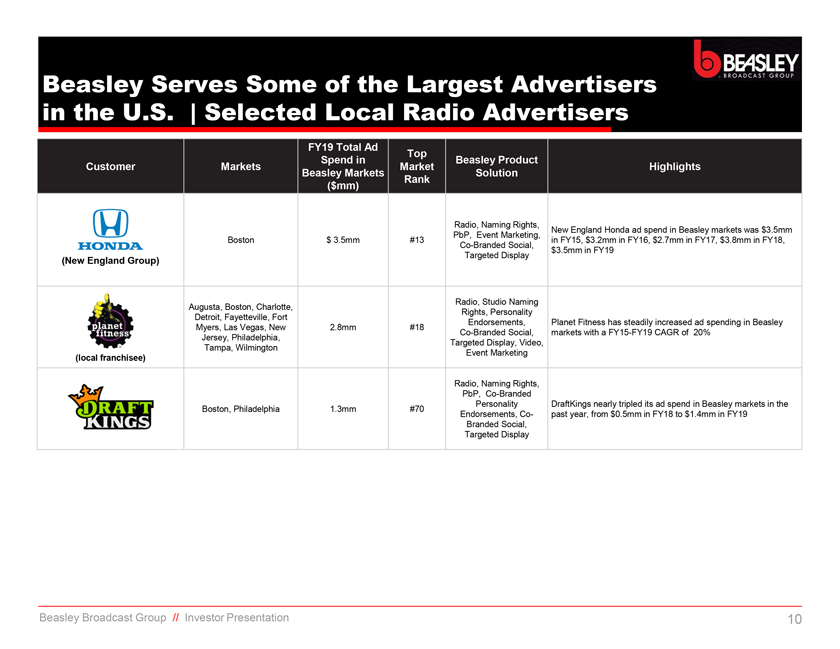
Beasley Serves Some of the Largest Advertisers in the U.S. | Selected Local Radio Advertisers
Customer Markets
Boston Augusta, Boston, Charlotte, Detroit, Fayetteville, Fort Myers, Las
Vegas, New Jersey, Philadelphia, Tampa, Wilmington
Boston, Philadelphia
FY19
Total Ad Spend in
Beasley Markets
($mm) $ 3.5mm 2.8mm 1.3mm
Top
Market
Rank
#13 #18 #70
Beasley Product
Solution
Radio, Naming Rights, PbP, Event Marketing, Co-Branded Social, Targeted Display
Radio, Studio
Naming Rights, Personality Endorsements, Co-Branded Social, Targeted Display, Video, Event Marketing
Radio, Naming Rights, PbP, Co-Branded Personality
Endorsements, Co-Branded Social, Targeted Display
Highlights
New England
Honda ad spend in Beasley markets was $3.5mm in FY15, $3.2mm in FY16, $2.7mm in FY17, $3.8mm in FY18, $3.5mm in FY19
Planet Fitness has steadily increased ad
spending in Beasley markets with a FY15-FY19 CAGR of 20%
DraftKings nearly tripled its ad spend in Beasley markets in the past year, from $0.5mm in FY18 to $1.4mm
in FY19
Beasley Broadcast Group // Investor Presentation 10
|
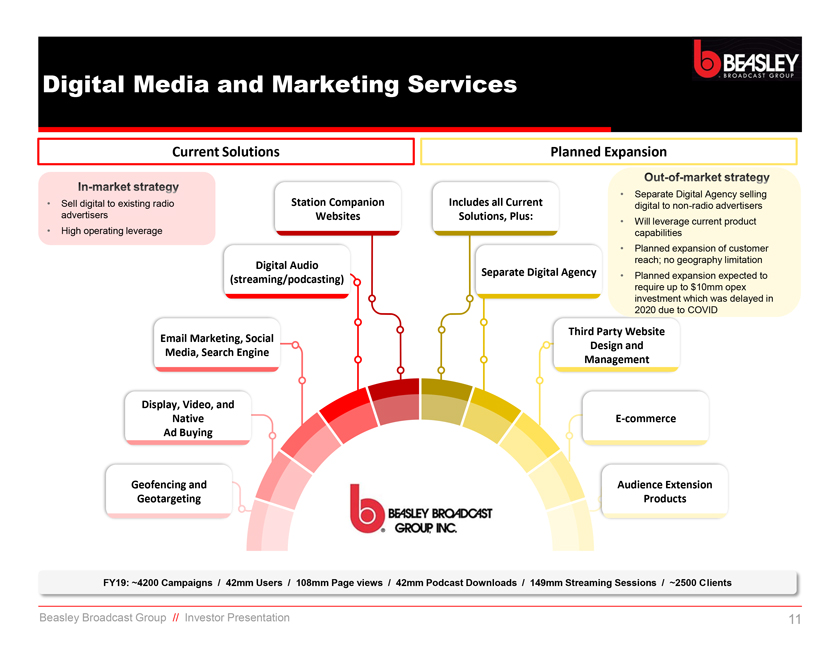
Digital
Media and Marketing
Services
Current Solutions
Planned Expansion
Sell digital to existing radio advertisers
High operating leverage
Separate Digital Agency selling digital to non-radio advertisers
Will leverage current product capabilities
Planned expansion of customer reach; no geography limitation
Planned expansion expected to
require up to $10mm opex investment which was delayed in 2020 due to COVID
Geofencing and Geotargeting
Email Marketing, Social Media, Search Engine
Display, Video, and Native Ad Buying
Digital Audio (streaming/podcasting)
Station Companion Websites
Includes all Current Solutions, Plus:
Separate Digital Agency
Third Party Website Design and Management
E-commerce
Audience Extension Products
FY19: ~4200 Campaigns / 42mm Users / 108mm Page
views / 42mm Podcast Downloads / 149mm Streaming Sessions / ~2500 Clients
Beasley Broadcast Group // Investor Presentation 11
|
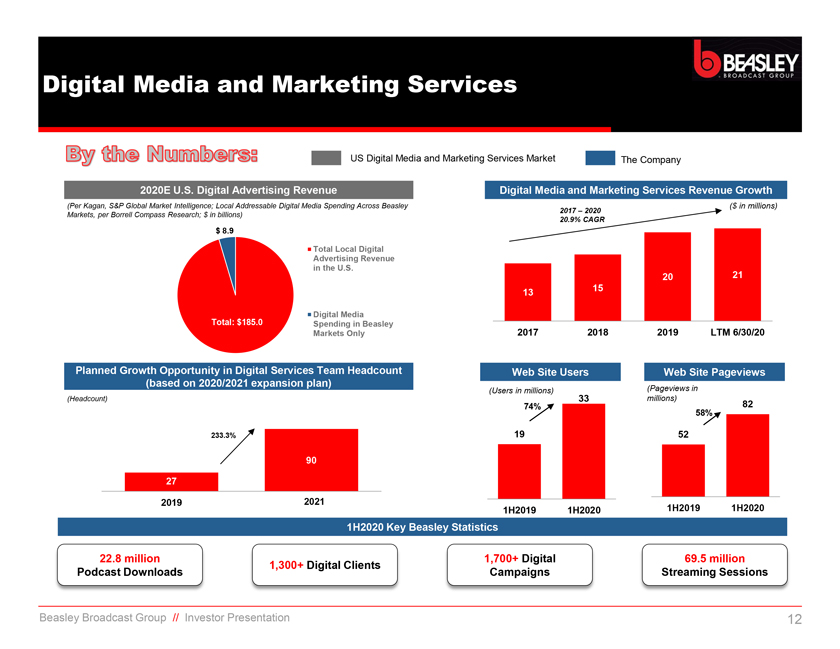
Digital Media and Marketing Services
US Digital Media
and Marketing Services Market The Company
2020E U.S. Digital Advertising Revenue
(Per Kagan, S&P Global Market Intelligence; Local Addressable Digital Media Spending Across Beasley Markets, per Borrell Compass Research; $ in billions)
Total Local Digital Advertising Revenue in the U.S.
Digital Media
Spending in Beasley Markets Only
Planned Growth Opportunity in Digital Services Team Headcount
(based on 2020/2021 expansion plan)
(Headcount)
Digital Media and Marketing
Services Revenue Growth
[Graphic Appears Here]
Web Site Users Web Site
Pageviews
(Users in millions) (Pageviews in
33 millions)
1H2020 Key Beasley Statistics
22.8 million Podcast Downloads
1,300+ Digital Clients
1,700+ Digital Campaigns
69.5 million Streaming Sessions
Beasley Broadcast Group // Investor Presentation 12
|
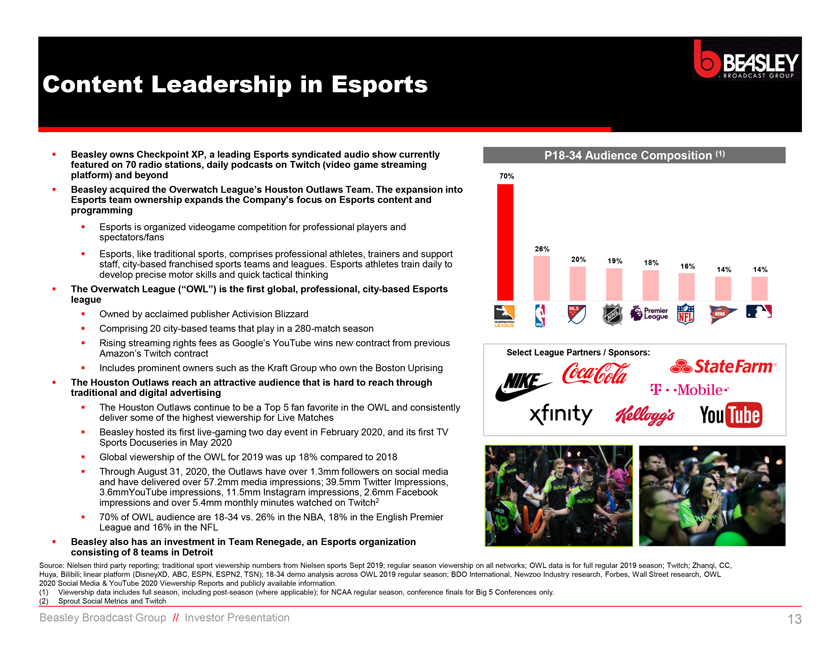
Content Leadership in Esports
Beasley owns Checkpoint
XP, a leading Esports syndicated audio show currently featured on 70 radio stations, daily podcasts on Twitch (video game streaming platform) and beyond
Beasley
acquired the Overwatch League’s Houston Outlaws Team. The expansion into Esports team ownership expands the Company’s focus on Esports content and programming
Esports is organized videogame competition for professional players and spectators/fans
Esports, like traditional sports, comprises professional athletes, trainers and support staff, city-based franchised sports teams and leagues. Esports athletes
train daily to develop precise motor skills and quick tactical thinking
The Overwatch League (“OWL”) is the first global, professional, city-based
Esports league
Owned by acclaimed publisher Activision Blizzard
Comprising 20
city-based teams that play in a 280-match season
Rising streaming rights fees as Google’s YouTube wins new contract
from previous Amazon’s Twitch contract
Includes prominent owners such as the Kraft Group who own the Boston Uprising
The Houston Outlaws reach an attractive audience that is hard to reach through traditional and digital advertising
The Houston Outlaws continue to be a Top 5 fan favorite in the OWL and consistently deliver some of the highest viewership for Live Matches
Beasley hosted its first live-gaming two day event in February 2020, and its first TV Sports Docuseries in May 2020
Global viewership of the OWL for 2019 was up 18% compared to 2018
Through August 31,
2020, the Outlaws have over 1.3mm followers on social media and have delivered over 57.2mm media impressions; 39.5mm Twitter Impressions, 3.6mmYouTube impressions, 11.5mm Instagram impressions, 2.6mm Facebook impressions and over 5.4mm monthly
minutes watched on Twitch2
70% of OWL audience are 18-34 vs. 26% in the NBA, 18% in the English Premier League and 16% in
the NFL
Beasley also has an investment in Team Renegade, an Esports organization consisting of 8 teams in Detroit
Source: Nielsen third party reporting; traditional sport viewership numbers from Nielsen sports Sept 2019; regular season viewership on all networks; OWL data is for full regular
2019 season; Twitch; Zhanqi, CC, Huya, Bilibili; linear platform (DisneyXD, ABC, ESPN, ESPN2, TSN); 18-34 demo analysis across OWL 2019 regular season; BDO International, Newzoo Industry research, Forbes, Wall
Street research, OWL 2020 Social Media & YouTube 2020 Viewership Reports and publicly available information.
(1) Viewership data includes full season,
including post-season (where applicable); for NCAA regular season, conference finals for Big 5 Conferences only. (2) Sprout Social Metrics and Twitch
P18-34 Audience Composition (1)
Beasley Broadcast Group // Investor Presentation 13

|
II. Key Credit Highlights

|
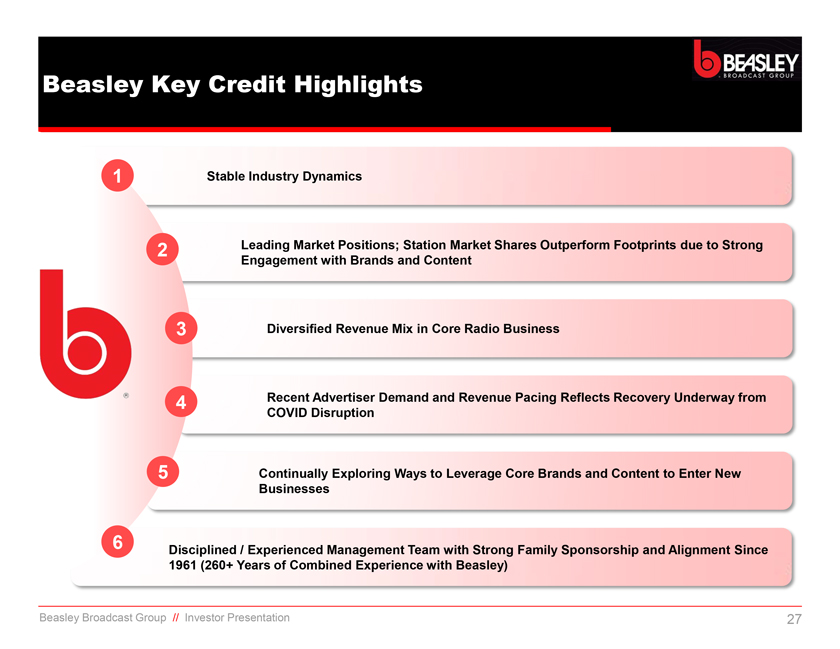
Beasley Key Credit Highlights
Stable Industry
Dynamics
Leading Market Positions; Station Market Shares Outperform Footprints due to Strong Engagement with Brands and Content
Diversified Revenue Mix in Core Radio Business
Recent Advertiser Demand and Revenue Pacing
Reflects Recovery Underway from COVID Disruption
Continually Exploring Ways to Leverage Core Brands and Content to Enter New Businesses
Disciplined / Experienced Management Team with Strong Family Sponsorship and Alignment Since 1961 (260+ Years of Combined Experience with Beasley)
Beasley Broadcast Group // Investor Presentation 15
|
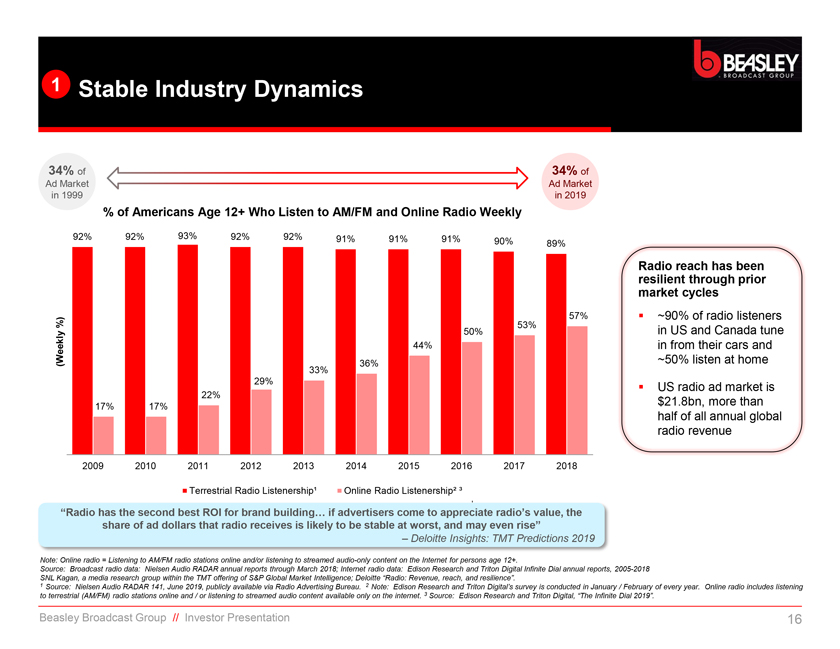
1 Stable Industry Dynamics
34% of
Ad Market in 1999
% of Americans Age 12+ Who Listen to AM/FM and Online Radio Weekly
34% of
Ad Market in 2019
Radio reach has been resilient through prior market cycles
ï,§ ~90% of radio
listeners in US and Canada tune in from their cars and ~50% listen at home
ï,§ US radio ad market is
$21.8bn, more than half of all annual global radio revenue
Terrestrial Radio
Listenership¹ Online Radio Listenership² ³
“Radio has the second best ROI for brand building… if advertisers come to appreciate ‘
radio’s value, the share of ad dollars that radio receives is likely to be stable at worst, and may even rise”
– Deloitte Insights: TMT Predictions
2019
Note: Online radio = Listening to AM/FM radio stations online and/or listening to streamed audio-only content on the Internet for persons age 12+.
Source: Broadcast radio data: Nielsen Audio RADAR annual reports through March 2018; Internet radio data: Edison Research and Triton Digital Infinite Dial annual reports, 2005-2018
SNL Kagan, a media research group within the TMT offering of S&P Global Market Intelligence; Deloitte “Radio: Revenue, reach, and resilience”.
1 Source: Nielsen Audio RADAR 141, June 2019, publicly available via Radio Advertising Bureau. 2 Note: Edison Research and Triton Digital’s survey is
conducted in January / February of every year. Online radio includes listening to terrestrial (AM/FM) radio stations online and / or listening to streamed audio content available only on the internet. 3 Source: Edison Research and Triton Digital,
“The Infinite Dial 2019”.
Beasley Broadcast Group // Investor Presentation 16
|
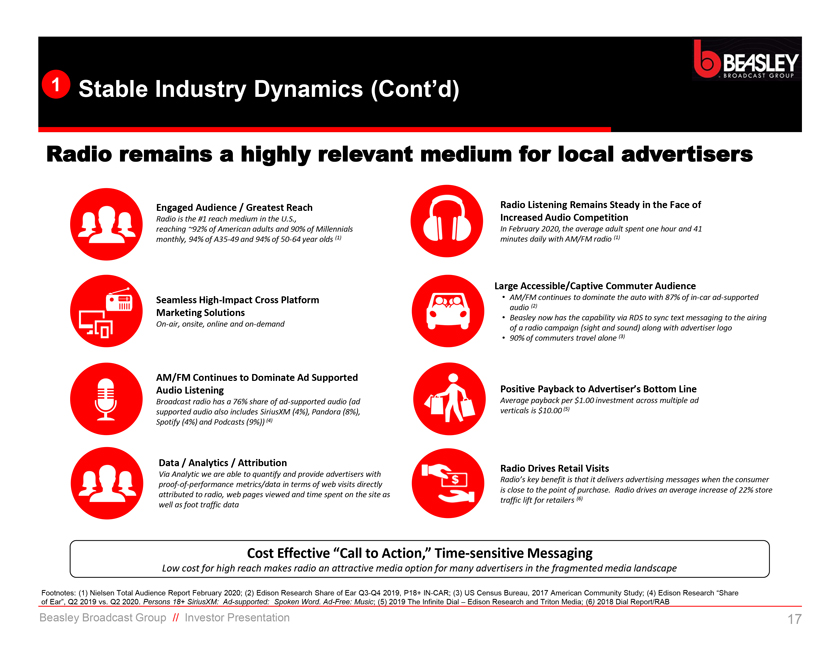
1 Stable Industry Dynamics (Cont’d)
Radio
remains a highly relevant medium for local advertisers
Engaged Audience / Greatest Reach
Radio is the #1 reach medium in the U.S., reaching ~92% of American adults and 90% of Millennials monthly, 94% of A35-49 and 94% of 50-64 year olds (1)
Seamless High-Impact Cross Platform Marketing Solutions
On-air, onsite, online and on-demand
AM/FM Continues to Dominate Ad Supported Audio Listening
Broadcast radio has a 76% share of ad-supported audio (ad supported audio also includes SiriusXM (4%), Pandora (8%), Spotify (4%) and Podcasts (9%)) (4)
Data /
Analytics / Attribution
Via Analytic we are able to quantify and provide advertisers with
proof-of-performance metrics/data in terms of web visits directly attributed to radio, web pages viewed and time spent on the site as well as foot traffic data
Radio Listening Remains Steady in the Face of Increased Audio Competition
In
February 2020, the average adult spent one hour and 41 minutes daily with AM/FM radio (1)
Large Accessible/Captive Commuter Audience
• AM/FM continues to dominate the auto with 87% of in-car ad-supported audio (2)
• Beasley now has the capability via RDS to sync text messaging to the airing of a radio campaign (sight and sound) along with advertiser logo
• 90% of commuters travel alone (3)
Positive Payback to Advertiser’s Bottom Line
Average payback per $1.00 investment across multiple ad verticals is $10.00 (5)
Radio Drives Retail Visits
Radio’s key benefit is that it delivers
advertising messages when the consumer is close to the point of purchase. Radio drives an average increase of 22% store traffic lift for retailers (6)
Cost
Effective “Call to Action,” Time-sensitive Messaging
Low cost for high reach makes radio an attractive media option for many advertisers in the
fragmented media landscape
Footnotes: (1) Nielsen Total Audience Report February 2020; (2) Edison Research Share of Ear
Q3-Q4 2019, P18+ IN-CAR; (3) US Census Bureau, 2017 American Community Study; (4) Edison Research “Share of Ear”, Q2 2019 vs. Q2 2020. Persons 18+
SiriusXM: Ad-supported: Spoken Word. Ad-Free: Music; (5) 2019 The Infinite Dial – Edison Research and Triton Media; (6) 2018 Dial Report/RAB
Beasley Broadcast Group // Investor Presentation 17
|
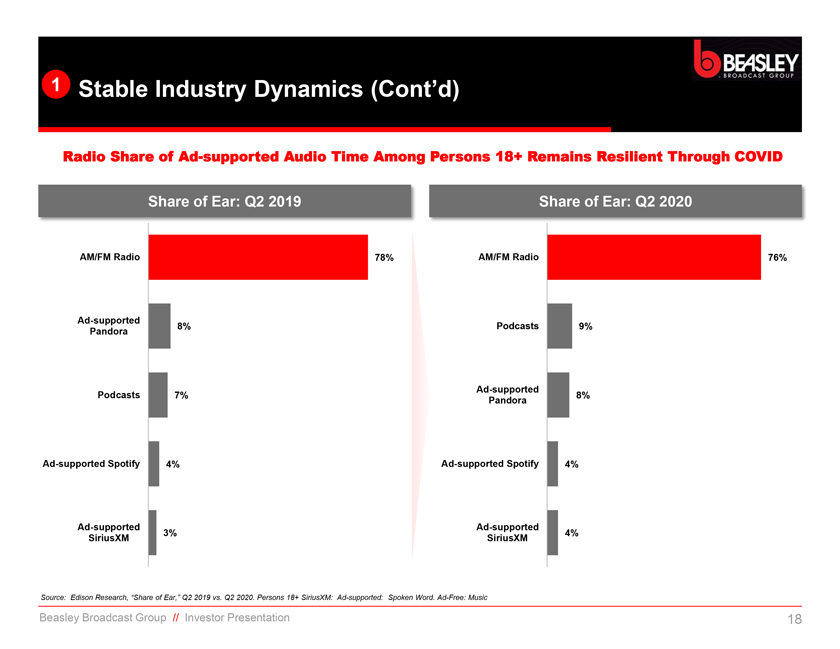
1 Stable Industry Dynamics (Cont’d)
Radio Share
of Ad-supported Audio Time Among Persons 18+ Remains Resilient Through COVID
Share of Ear: Q2 2019
AM/FM Radio
Ad-supported Pandora
Podcasts
Ad-supported Spotify
Ad-supported SiriusXM
Share of Ear: Q2 2020
AM/FM Radio
Podcasts
Ad-supported Pandora
Ad-supported Spotify
Ad-supported SiriusXM
Source: Edison Research, “Share of Ear,” Q2 2019 vs. Q2 2020. Persons 18+ SiriusXM: Ad-supported: Spoken Word. Ad-Free: Music
Beasley Broadcast Group // Investor
Presentation 18
|
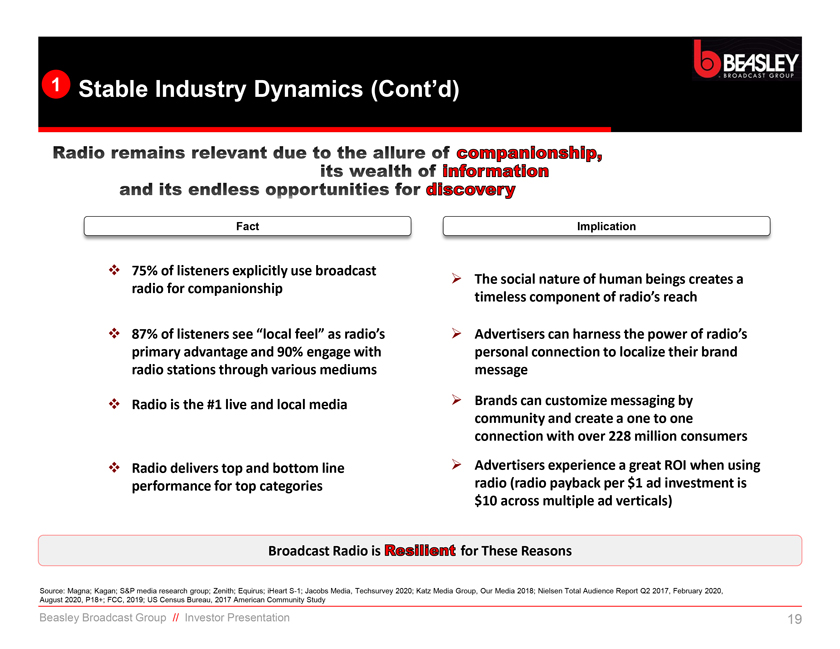
1 Stable Industry Dynamics (Cont’d)
Fact
75% of listeners explicitly use broadcast radio for companionship
87% of
listeners see “local feel” as radio’s primary advantage and 90% engage with radio stations through various mediums
Radio is the #1 live and local
media
Radio delivers top and bottom line performance for top categories
Implication
The social nature of human beings creates a timeless component of
radio’s reach
Advertisers can harness the power of radio’s personal connection to localize their brand message
Brands can customize messaging by community and create a one to one connection with over 228 million consumers
Advertisers experience a great ROI when using radio (radio payback per $1 ad investment is $10 across multiple ad verticals)
Broadcast Radio is for These Reasons
Source: Magna; Kagan; S&P media research group;
Zenith; Equirus; iHeart S-1; Jacobs Media, Techsurvey 2020; Katz Media Group, Our Media 2018; Nielsen Total Audience Report Q2 2017, February 2020, August 2020, P18+; FCC, 2019; US Census Bureau, 2017 American
Community Study
Beasley Broadcast Group // Investor Presentation 19
|
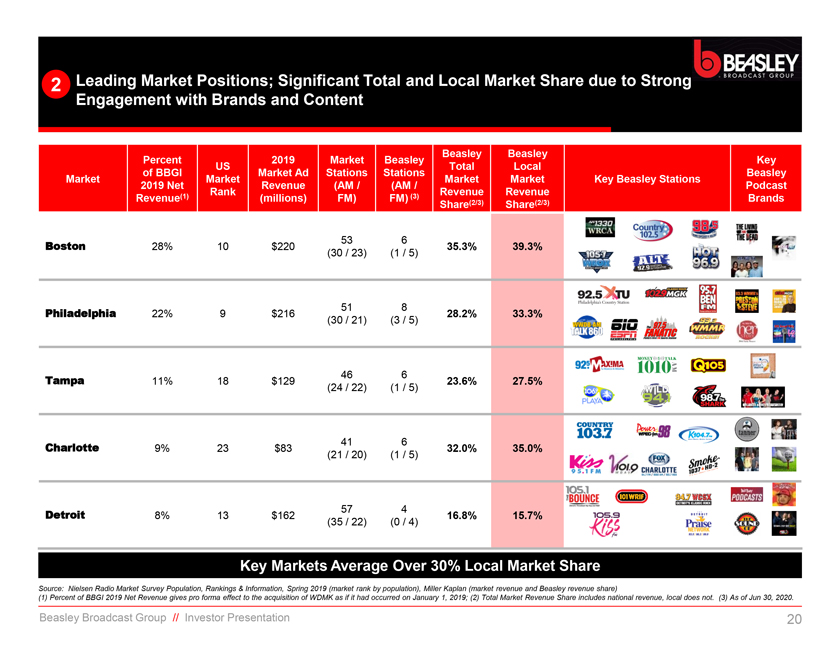
2 Leading Market Positions; Significant Total and Local Market Share due to Strong Engagement with Brands and Content
Beasley Beasley
Percent 2019 Market Beasley Key US Total Local of BBGI Market Ad Stations
Stations Beasley Market Market Market Market Key Beasley Stations 2019 Net Revenue (AM / (AM / Podcast Rank Revenue Revenue Revenue(1) (millions) FM) FM) (3) Share(2/3) Share(2/3) Brands
Boston 53 6
28% 10 $220 35.3% 39.3%
(30 / 23) (1 / 5)
Philadelphia 51 8
22% 9 $216 28.2% 33.3%
(30 / 21) (3 / 5)
Tampa 46 6
11% 18 $129 23.6% 27.5%
(24 / 22) (1 / 5)
Charlotte 41 6
9% 23 $83 32.0% 35.0%
(21 / 20) (1 / 5)
Detroit 57 4
8% 13 $162 16.8% 15.7%
(35 / 22) (0 / 4)
Key Markets Average Over 30% Local Market Share
Source: Nielsen Radio Market Survey Population, Rankings & Information, Spring 2019 (market rank by population), Miller Kaplan (market revenue and Beasley revenue share)
(1) Percent of BBGI 2019 Net Revenue gives pro forma effect to the acquisition of WDMK as if it had occurred on January 1, 2019; (2) Total Market Revenue
Share includes national revenue, local does not. (3) As of Jun 30, 2020.
Beasley Broadcast Group // Investor Presentation 20
|
|
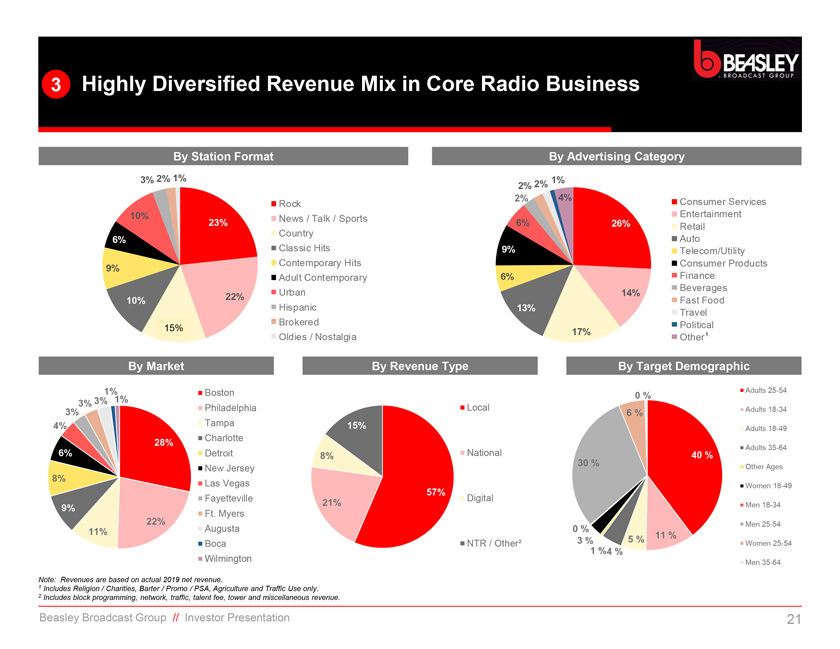
3 Highly Diversified Revenue Mix in Core Radio Business
By Station Format
By Advertising Category
By Market
Rock
News / Talk / Sports
Country Classic Hits
Contemporary Hits
Adult Contemporary Urban
Hispanic Brokered
Oldies / Nostalgia
Consumer Services
Entertainment
Retail Auto
Telecom/Utility
Consumer Products Finance
Beverages Fast Food
Travel
Political Other1
Boston Philadelphia Tampa Charlotte Detroit New Jersey Las Vegas Fayetteville Ft. Myers Augusta Boca Wilmington
By Revenue Type By Target Demographic
Local National Digital NTR / Other²
Adults 25-54 Adults 18-34 Adults 18-49 Adults 35-64 Other Ages Women 18-49 Men 18-34 Men 25-54 Women
25-54 Men 35-64
Note: Revenues are based on actual 2019 net revenue.
1 Includes Religion / Charities, Barter / Promo / PSA, Agriculture and Traffic Use only.
2
Includes block programming, network, traffic, talent fee, tower and miscellaneous revenue.
Beasley Broadcast Group // Investor Presentation
|
|
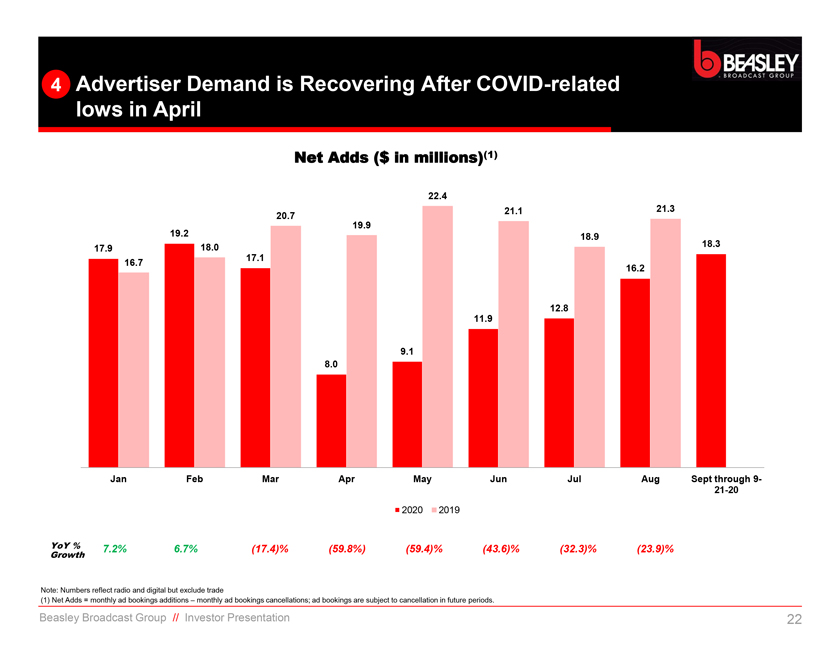
4 Advertiser Demand is Recovering After COVID-related lows in April
Net Adds ($ in millions)(1)
YoY % 7.2% 6.7% (17.4)% (59.8%) (59.4)%
(43.6)% (32.3)% (23.9)%
Growth
Note: Numbers reflect
radio and digital but exclude trade
(1) Net Adds = monthly ad bookings additions – monthly ad bookings cancellations; ad bookings are
subject to cancellation in future periods.
Beasley Broadcast Group // Investor Presentation
|
|
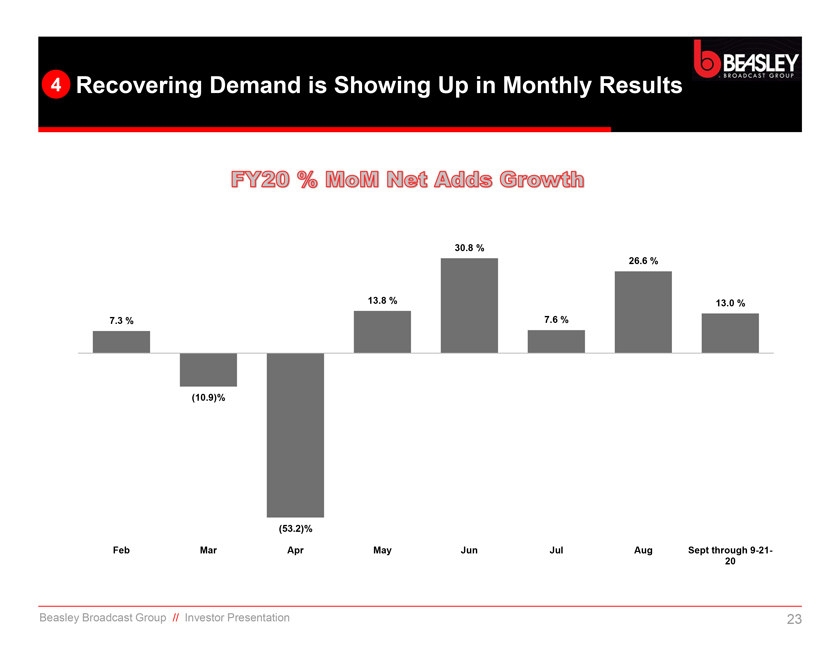
4 Recovering Demand is Showing Up in Monthly Results
|
|
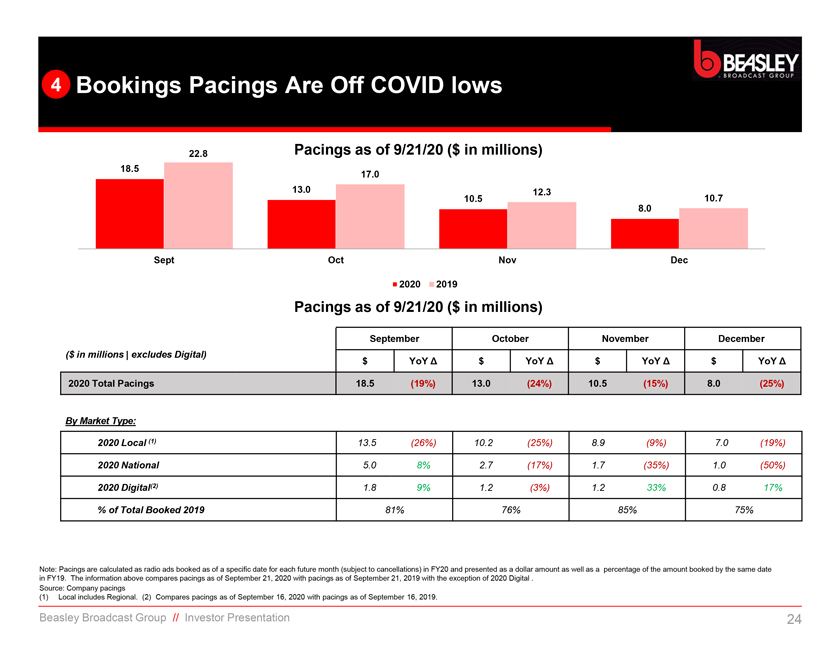
4 Bookings Pacings Are Off COVID lows
22.8 Pacings as
of 9/21/20 ($ in millions)
18.5
17.0
13.0 12.3 10.7 10.5
8.0
Sept Oct Nov Dec
2020 2019
Pacings as of 9/21/20 ($ in millions)
September October November December
($ in millions | excludes Digital) $ YoY Δ $ YoY Δ $ YoY Δ $ YoY Δ
2020 Total Pacings 18.5 (19%) 13.0 (24%) 10.5 (15%) 8.0 (25%)
By Market Type:
2020 Local (1) 13.5 (26%) 10.2 (25%) 8.9 (9%) 7.0 (19%) 2020 National 5.0 8% 2.7 (17%) 1.7 (35%) 1.0 (50%) 2020 Digital(2) 1.8 9% 1.2 (3%) 1.2 33% 0.8 17%
% of Total Booked 2019 81% 76% 85% 75%
Note: Pacings are calculated as radio ads booked as of
a specific date for each future month (subject to cancellations) in FY20 and presented as a dollar amount as well as a percentage of the amount booked by the same date in FY19. The information above compares pacings as of September 21, 2020
with pacings as of September 21, 2019 with the exception of 2020 Digital .
Source: Company pacings
(1) Local includes Regional. (2) Compares pacings as of September 16, 2020 with pacings as of September 16, 2019.
Beasley Broadcast Group // Investor Presentation 24
|
|
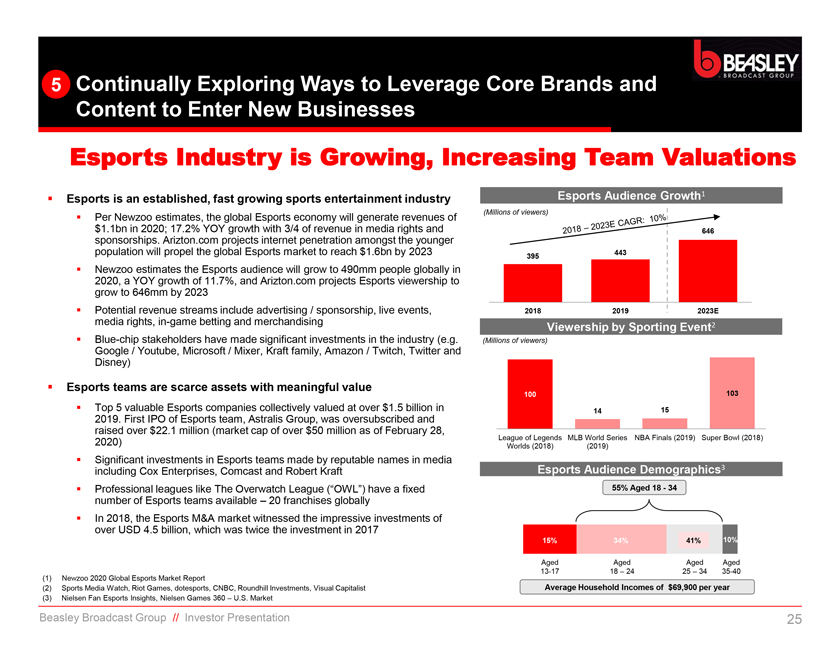
5 Continually Exploring Ways to Leverage Core Brands and Content to Enter New Businesses
Esports Industry is Growing, Increasing Team Valuations
◾ Esports is an established,
fast growing sports entertainment industry
◾ Per Newzoo estimates, the global Esports economy will generate revenues of
$1.1bn in 2020; 17.2% YOY growth with 3/4 of revenue in media rights and sponsorships. Arizton.com projects internet penetration amongst the younger population will propel the
global Esports market to reach $1.6bn by 2023 ◾ Newzoo estimates the Esports audience will grow to 490mm people globally in 2020, a YOY growth of 11.7%, and Arizton.com projects Esports viewership to grow to 646mm by 2023 ◾ Potential
revenue streams include advertising / sponsorship, live events, media rights, in-game betting and merchandising ◾ Blue-chip stakeholders have made significant investments in the industry (e.g.
Google / Youtube, Microsoft / Mixer, Kraft family, Amazon / Twitch, Twitter and Disney)
◾ Esports teams are scarce assets with meaningful value
◾ Top 5 valuable Esports
companies collectively valued at over $1.5 billion in 2019. First IPO of Esports team, Astralis Group, was oversubscribed and raised over $22.1 million (market cap of over $50 million as of February 28, 2020) ◾ Significant
investments in Esports teams made by reputable names in media including Cox Enterprises, Comcast and Robert Kraft
◾ Professional leagues like The Overwatch
League (“OWL”) have a fixed number of Esports teams available – 20 franchises globally ◾ In 2018, the Esports M&A market witnessed the impressive investments of over USD 4.5 billion, which was twice the investment in
2017
(1) Newzoo 2020 Global Esports Market Report
(2)
Sports Media Watch, Riot Games, dotesports, CNBC, Roundhill Investments, Visual Capitalist (3) Nielsen Fan Esports Insights, Nielsen Games 360 – U.S. Market
Beasley Broadcast Group // Investor Presentation
Esports Audience Growth1
(Millions of viewers)
646
443 395
2018 2019 2023E
Viewership by Sporting Event2
(Millions of viewers)
100 103
14 15
League of Legends MLB World Series NBA Finals (2019) Super Bowl (2018) Worlds (2018) (2019)
Esports Audience Demographics3
55% Aged 18—34
15% 34% 41% 10% 7%
Aged Aged Aged Aged
13-17 18 – 24 25 – 34 35-40
Average Household Incomes of $69,900 per year
|
|
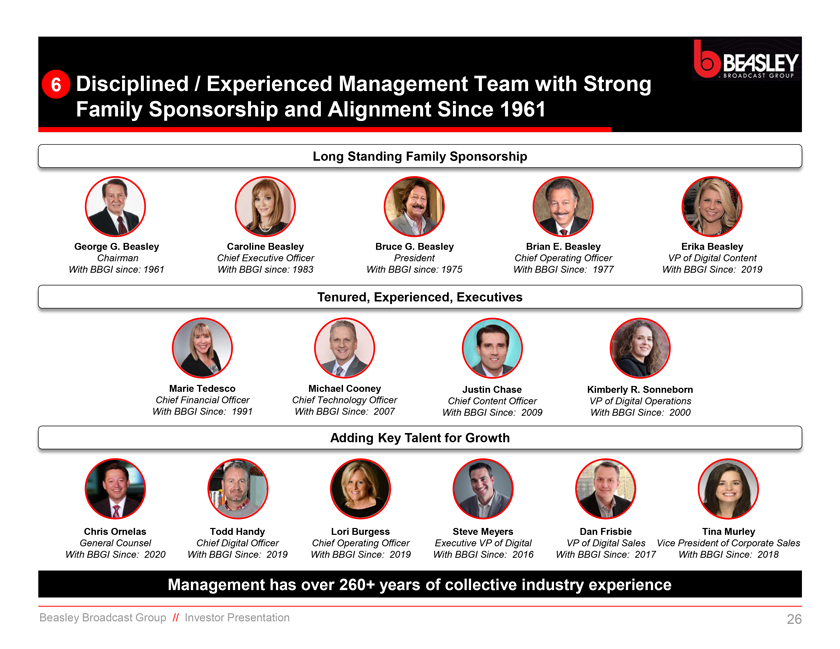
6 Disciplined / Experienced Management Team with Strong Family Sponsorship and Alignment Since 1961
George G. Beasley Caroline Beasley Bruce G. Beasley Brian E. Beasley Erika Beasley
Chairman Chief Executive Officer President Chief Operating Officer VP of Digital Content
With BBGI since: 1961 With BBGI since: 1983 With BBGI since: 1975 With BBGI Since: 1977 With BBGI Since: 2019
Tenured, Experienced, Executives
Marie Tedesco Michael Cooney Justin Chase Kimberly R.
Sonneborn
Chief Financial Officer Chief Technology Officer Chief Content Officer VP of Digital Operations With BBGI Since: 1991 With BBGI Since: 2007 With BBGI
Since: 2009 With BBGI Since: 2000
Adding Key Talent for Growth
Chris Ornelas
Todd Handy Lori Burgess Steve Meyers Dan Frisbie Tina Murley
General Counsel Chief Digital Officer Chief Operating Officer Executive VP of Digital VP of Digital
Sales Vice President of Corporate Sales With BBGI Since: 2020 With BBGI Since: 2019 With BBGI Since: 2019 With BBGI Since: 2016 With BBGI Since: 2017 With BBGI Since: 2018
Management has over 260+ years of collective industry experience
Beasley Broadcast Group //
Investor Presentation
|
|
Beasley Key Credit Highlights
1 Stable Industry
Dynamics
2 Leading Market Positions; Station Market Shares Outperform Footprints due to Strong Engagement with Brands and Content
3 Diversified Revenue Mix in Core Radio Business
4 Recent Advertiser Demand and Revenue Pacing
Reflects Recovery Underway from COVID Disruption
5 Continually Exploring Ways to Leverage Core Brands and Content to Enter New Businesses
6 Disciplined / Experienced Management Team with Strong Family Sponsorship and Alignment Since 1961 (260+ Years of Combined Experience with Beasley)
Beasley Broadcast Group // Investor Presentation 27
|
|

III. Financial Overview
|
|
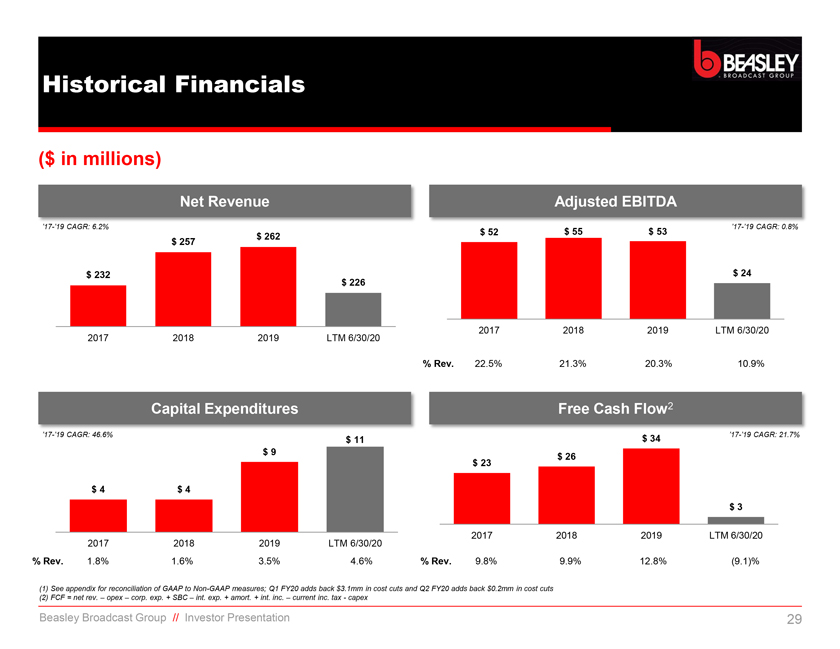
Historical Financials
($ in millions)
Net Revenue Adjusted EBITDA
’17-’19 CAGR:
6.2% ’17-’19 CAGR: 0.8%
$ 52 $ 55 $ 53 $ 262 $ 257
$ 232 $ 24 $ 226
2017 2018 2019 LTM 6/30/20 2017 2018 2019 LTM 6/30/20
% Rev. 22.5% 21.3% 20.3% 10.9%
Capital Expenditures Free Cash Flow2
’17-’19 CAGR: 46.6% $ 34 ’17-’19 CAGR: 21.7%
$ 11 $ 9 $ 26 $ 23
$ 4 $ 4 $ 3
2017 2018 2019 LTM 6/30/20 2017 2018 2019 LTM 6/30/20
% Rev. 1.8% 1.6% 3.5% 4.6% % Rev. 9.8%
9.9% 12.8% (9.1)%
(1) See appendix for reconciliation of GAAP to Non-GAAP measures; Q1 FY20 adds back $3.1mm in cost cuts
and Q2 FY20 adds back $0.2mm in cost cuts (2) FCF = net rev. – opex – corp. exp. + SBC – int. exp. + amort. + int. inc. – current inc. tax—capex
Beasley Broadcast Group // Investor Presentation 29
|
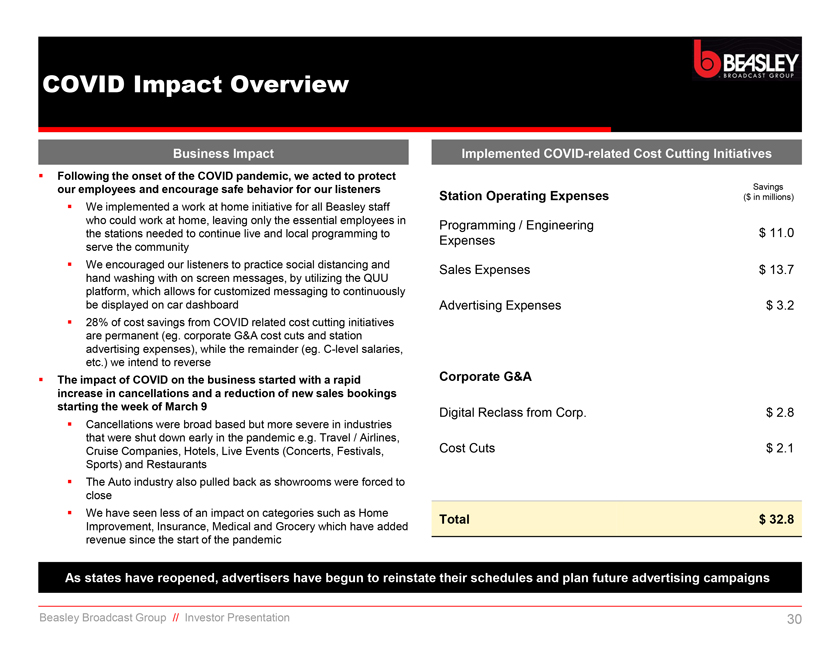
COVID Impact Overvie Business Impact Following the onset of the COVID pandemic, we acted to protect our employees and encourage safe behavior for our listeners We implemented a work at home initiative for all Beasley staff who could work at home, leaving only the essential employees in the stations needed to continue live and local programming to serve the community We encouraged our listeners to practice social distancing and hand washing with on screen messages, by utilizing the QUU platform, which allows for customized messaging to continuously be displayed on car dashboard 28% of cost savings from COVID related cost cutting initiatives are permanent (eg. corporate G&A cost cuts and station advertising expenses), while the remainder (eg. C-level salaries, etc.) we intend to reverse The impact of COVID on the business started with a rapid increase in cancellations and a reduction of new sales bookings starting the week of March 9 Cancellations were broad based but more severe in industries that were shut down early in the pandemic e.g. Travel / Airlines, Cruise Companies, Hotels, Live Events (Concerts, Festivals, Sports) and Restaurants The Auto industry also pulled back as showrooms were forced to close We have seen less of an impact on categories such as Home Improvement, Insurance, Medical and Grocery which have added revenue since the start of the pandemic Implemented COVID-related Cost Cutting Initiatives Savings Station Operating Expenses ($ in millions) Programming / Engineering $ 11.0 Expenses Sales Expenses $ 13.7 Advertising Expenses $ 3.2 Corporate G&A Digital Reclass from Corp. $ 2.8 Cost Cuts $ 2.1 Total $ 32.8 As states have reopened, advertisers have begun to reinstate their schedules and plan future advertising campaigns Beasley Broadcast Group // Investor Presentation 30
|
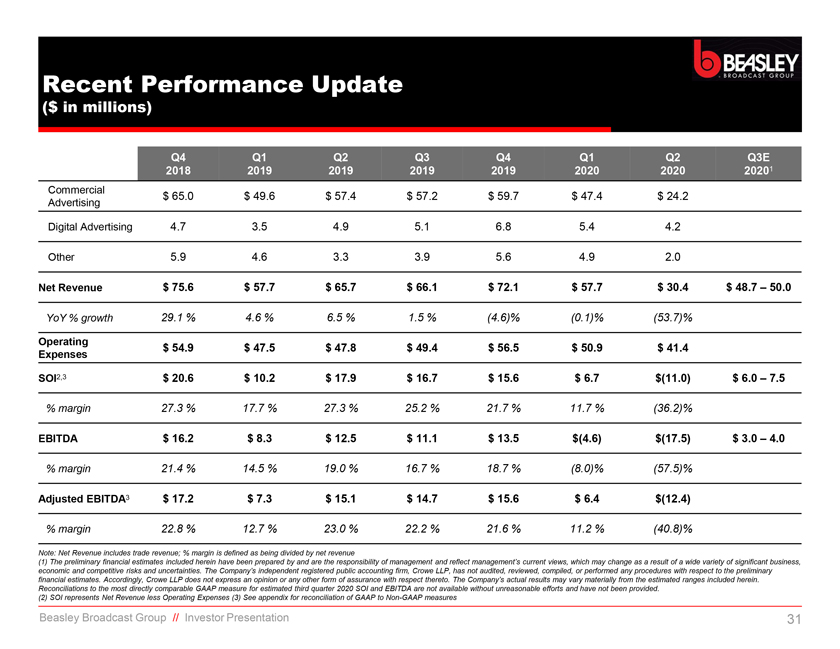
R Recent Performance Update ($ in millions) Q4 Q1 Q2 Q3 Q4 Q1 Q2 Q3E 2018 2019 2019 2019 2019 2020 2020 20201 Commercial $ 65.0 $ 49.6 $ 57.4 $ 57.2 $ 59.7 $ 47.4 $ 24.2 Advertising Digital Advertising 4.7 3.5 4.9 5.1 6.8 5.4 4.2 Other 5.9 4.6 3.3 3.9 5.6 4.9 2.0 Net Revenue $ 75.6 $ 57.7 $ 65.7 $ 66.1 $ 72.1 $ 57.7 $ 30.4 $ 48.7 – 50.0 YoY % growth 29.1 % 4.6 % 6.5 % 1.5 % (4.6)% (0.1)% (53.7)% Operating $ 54.9 $ 47.5 $ 47.8 $ 49.4 $ 56.5 $ 50.9 $ 41.4 Expenses SOI2,3 $ 20.6 $ 10.2 $ 17.9 $ 16.7 $ 15.6 $ 6.7 $(11.0) $ 6.0 – 7.5 % margin 27.3 % 17.7 % 27.3 % 25.2 % 21.7 % 11.7 % (36.2)% EBITDA $ 16.2 $ 8.3 $ 12.5 $ 11.1 $ 13.5 $(4.6) $(17.5) $ 3.0 – 4.0 % margin 21.4 % 14.5 % 19.0 % 16.7 % 18.7 % (8.0)% (57.5)% Adjusted EBITDA3 $ 17.2 $ 7.3 $ 15.1 $ 14.7 $ 15.6 $ 6.4 $(12.4) % margin 22.8 % 12.7 % 23.0 % 22.2 % 21.6 % 11.2 % (40.8)% Note: Net Revenue includes trade revenue; % margin is defined as being divided by net revenue (1) The preliminary financial estimates included herein have been prepared by and are the responsibility of management and reflect management’s current views, which may change as a result of a wide variety of significant business, economic and competitive risks and uncertainties. The Company’s independent registered public accounting firm, Crowe LLP, has not audited, reviewed, compiled, or performed any procedures with respect to the preliminary financial estimates. Accordingly, Crowe LLP does not express an opinion or any other form of assurance with respect thereto. The Company’s actual results may vary materially from the estimated ranges included herein. Reconciliations to the most directly comparable GAAP measure for estimated third quarter 2020 SOI and EBITDA are not available without unreasonable efforts and have not been provided. (2) SOI represents Net Revenue less Operating Expenses (3) See appendix for reconciliation of GAAP to Non-GAAP measures Beasley Broadcast Group // Investor Presentation 31
|
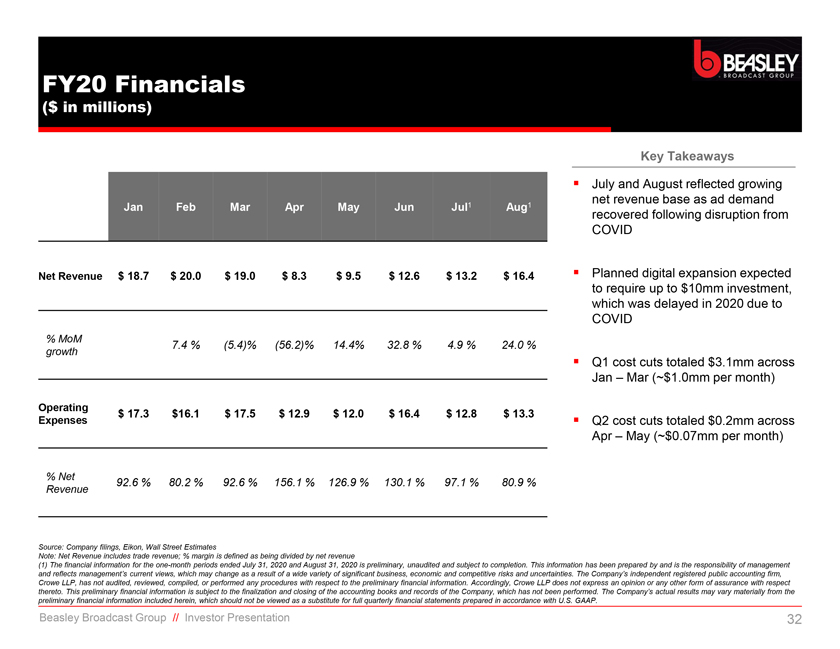
FY20 Financials ($ in millions) Key Takeaways July and August reflected growing net revenue base as ad demand recovered following disruption from COVID Planned digital expansion expected to require up to $10mm investment, which was delayed in 2020 due to COVID Q1 cost cuts totaled $3.1mm across Jan – Mar (~$1.0mm per month) Q2 cost cuts totaled $0.2mm across Apr – May (~$0.07mm per month) Source: Company filings, Eikon, Wall Street Estimates Note: Net Revenue includes trade revenue; % margin is defined as being divided by net revenue (1) The financial information for the one-month periods ended July 31, 2020 and August 31, 2020 is preliminary, unaudited and subject to completion. This information has been prepared by and is the responsibility of management and reflects management’s current views, which may change as a result of a wide variety of significant business, economic and competitive risks and uncertainties. The Company’s independent registered public accounting firm, Crowe LLP, has not audited, reviewed, compiled, or performed any procedures with respect to the preliminary financial information. Accordingly, Crowe LLP does not express an opinion or any other form of assurance with respect thereto. This preliminary financial information is subject to the finalization and closing of the accounting books and records of the Company, which has not been performed. The Company’s actual results may vary materially from the preliminary financial information included herein, which should not be viewed as a substitute for full quarterly financial statements prepared in accordance with U.S. GAAP. Beasley Broadcast Group // Investor Presentation 32
|
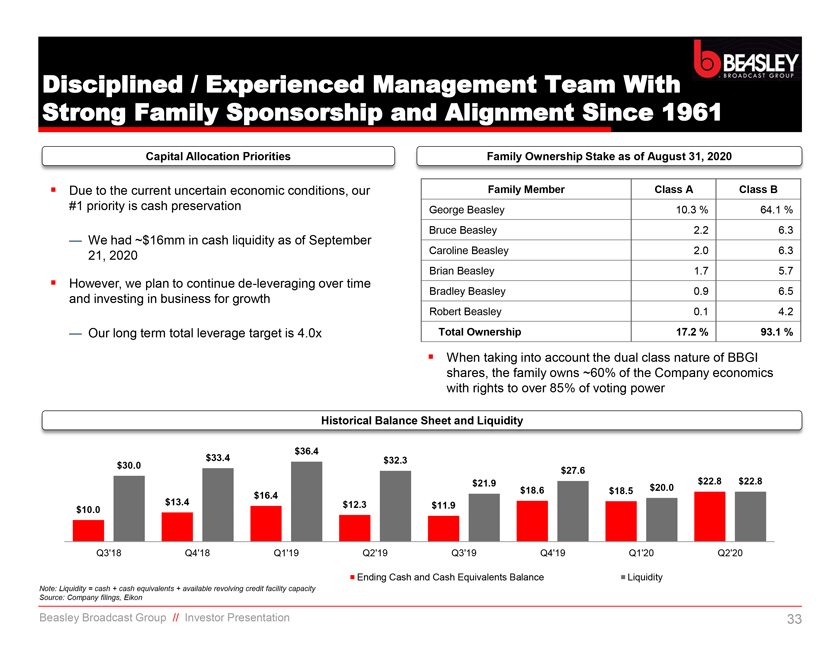
Disciplined / Experienced Management Team With Strong Family Sponsorship and Alignment Since 1961 Capital Allocation Priorities Family Ownership Stake as of August 31, 2020 Due to the current uncertain economic conditions, our Family Member Class A Class B #1 priority is cash preservation George Beasley 10.3 % 64.1 % — We had ~$16mm in cash liquidity as of September Bruce Beasley 2.2 6.3 21, 2020 Caroline Beasley 2.0 6.3 Brian Beasley 1.7 5.7 However, we plan to continue de-leveraging over time Bradley Beasley 0.9 6.5 and investing in business for growth Robert Beasley 0.1 4.2 — Our long term total leverage target is 4.0x Total Ownership 17.2 % 93.1 % When taking into account the dual class nature of BBGI shares, the family owns ~60% of the Company economics with rights to over 85% of voting power Historical Balance Sheet and Liquidity $36.4 $33.4 $32.3 $30.0 $27.6 $21.9 $22.8 $22.8 $16.4 $18.6 $18.5 $20.0 $13.4 $12.3 $11.9 $10.0 Q3’18 Q4’18 Q1’19 Q2’19 Q3’19 Q4’19 Q1’20 Q2’20 Ending Cash and Cash Equivalents Balance Liquidity Note: Liquidity = cash + cash equivalents + available revolving credit facility capacity Source: Company filings, Eikon Beasley Broadcast Group // Investor Presentation 33

|
IV. Appendix
|
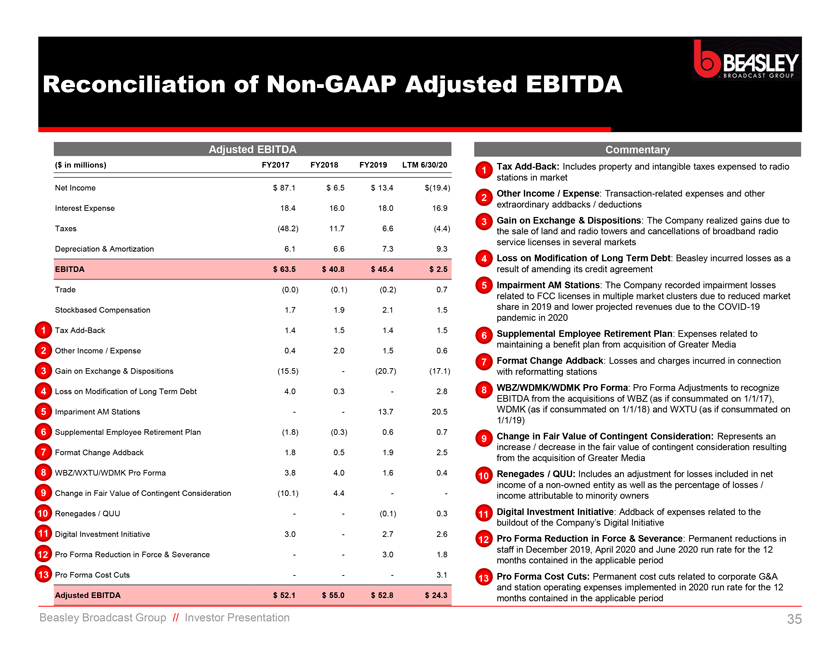
Reconciliation of Non-GAAP Adjusted EBITDA
Adjusted
EBITDA
($ in millions) FY2017 FY2018 FY2019 LTM 6/30/20
Net Income $ 87.1 $
6.5 $ 13.4 $(19.4) Interest Expense 18.4 16.0 18.0 16.9 Taxes (48.2) 11.7 6.6 (4.4) Depreciation & Amortization 6.1 6.6 7.3 9.3
EBITDA $ 63.5 $ 40.8 $ 45.4 $
2.5
Trade (0.0) (0.1) (0.2) 0.7
Stockbased Compensation 1.7 1.9 2.1 1.5
1 Tax Add-Back 1.4 1.5 1.4 1.5
2 Other Income / Expense 0.4 2.0 1.5 0.6
3 Gain on Exchange & Dispositions (15.5) - (20.7) (17.1)
4 Loss on
Modification of Long Term Debt 4.0 0.3 - 2.8
5 Impariment AM Stations 13.7 20.5
6 Supplemental Employee Retirement Plan (1.8) (0.3) 0.6 0.7
7 Format Change
Addback 1.8 0.5 1.9 2.5
8 WBZ/WXTU/WDMK Pro Forma 3.8 4.0 1.6 0.4
9 Change in
Fair Value of Contingent Consideration (10.1) 4.4
10 Renegades / QUU - (0.1) 0.3
11 Digital Investment Initiative 3.0 2.7 2.6
12 Pro Forma Reduction in Force & Severance
3.0 1.8
13 Pro Forma Cost Cuts- 3.1
Adjusted EBITDA $ 52.1 $ 55.0 $ 52.8 $
24.3
Commentary
1 • Tax Add-Back: Includes property and intangible taxes
expensed to radio stations in market 2 • Other Income / Expense: Transaction-related expenses and other extraordinary addbacks / deductions 3 • Gain on Exchange & Dispositions: The Company realized gains due to the sale of land and
radio towers and cancellations of broadband radio service licenses in several markets
4 • Loss on Modification of Long Term Debt: Beasley incurred losses as a
result of amending its credit agreement 5 • Impairment AM Stations: The Company recorded impairment losses related to FCC licenses in multiple market clusters due to reduced market share in 2019 and lower projected revenues due to the COVID-19
pandemic in 2020
6 • Supplemental Employee Retirement Plan: Expenses related to maintaining a benefit plan from acquisition of Greater Media 7 • Format
Change Addback: Losses and charges incurred in connection with reformatting stations 8 • WBZ/WDMK/WDMK Pro Forma: Pro Forma Adjustments to recognize EBITDA from the acquisitions of WBZ (as if consummated on 1/1/17), WDMK (as if consummated on
1/1/18) and WXTU (as if consummated on 1/1/19)
9 • Change in Fair Value of Contingent Consideration: Represents an increase / decrease in the fair value of
contingent consideration resulting from the acquisition of Greater Media
10 • Renegades / QUU: Includes an adjustment for losses included in net income of a
non-owned entity as well as the percentage of losses / income attributable to minority owners
11 • Digital Investment Initiative: Addback of expenses related
to the buildout of the Company’s Digital Initiative
12 • Pro Forma Reduction in Force & Severance: Permanent reductions in staff in December 2019,
April 2020 and June 2020 run rate for the 12 months contained in the applicable period
13 • Pro Forma Cost Cuts: Permanent cost cuts related to corporate
G&A and station operating expenses implemented in 2020 run rate for the 12 months contained in the applicable periodBeasley Broadcast Group // Investor Presentation
|
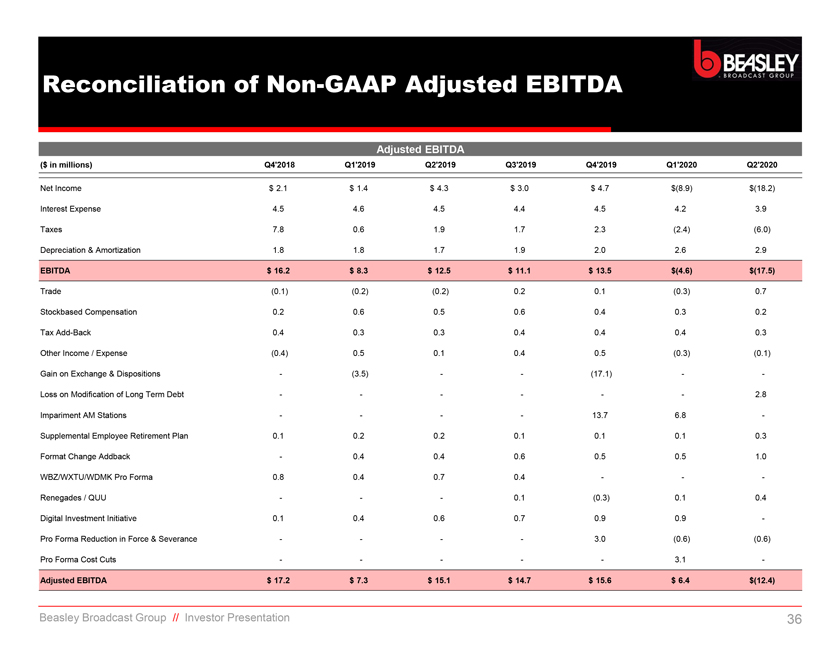
Reconciliation of Non-GAAP Adjusted EBITDA
Adjusted
EBITDA
($ in millions) Q4’2018 Q1’2019 Q2’2019 Q3’2019 Q4’2019 Q1’2020 Q2’2020
Net Income $ 2.1 $ 1.4 $ 4.3 $ 3.0 $ 4.7 $(8.9) $(18.2) Interest Expense 4.5 4.6 4.5 4.4 4.5 4.2 3.9 Taxes 7.8 0.6 1.9 1.7 2.3 (2.4) (6.0) Depreciation & Amortization 1.8 1.8
1.7 1.9 2.0 2.6 2.9
EBITDA $ 16.2 $ 8.3 $ 12.5 $ 11.1 $ 13.5 $(4.6) $(17.5)
Trade (0.1) (0.2) (0.2) 0.2 0.1 (0.3) 0.7 Stockbased Compensation 0.2 0.6 0.5 0.6 0.4 0.3 0.2 Tax Add-Back 0.4 0.3 0.3 0.4 0.4 0.4 0.3 Other Income / Expense (0.4)
0.5 0.1 0.4 0.5 (0.3) (0.1) Gain on Exchange & Dispositions - (3.5) - - (17.1) - -Loss on Modification of Long Term Debt - - - - - - 2.8 Impariment AM Stations - - - - 13.7 6.8 -Supplemental Employee Retirement Plan 0.1 0.2 0.2 0.1 0.1 0.1 0.3
Format Change Addback - 0.4 0.4 0.6 0.5 0.5 1.0 WBZ/WXTU/WDMK Pro Forma 0.8 0.4 0.7 0.4 - - -Renegades / QUU - - - 0.1 (0.3) 0.1 0.4 Digital Investment Initiative 0.1 0.4 0.6 0.7 0.9 0.9 -Pro Forma Reduction in Force & Severance - - - - 3.0
(0.6) (0.6) Pro Forma Cost Cuts - - - - - 3.1 -
Adjusted EBITDA $ 17.2 $ 7.3 $ 15.1 $ 14.7 $ 15.6 $ 6.4 $(12.4)
Beasley Broadcast Group // Investor Presentation
|
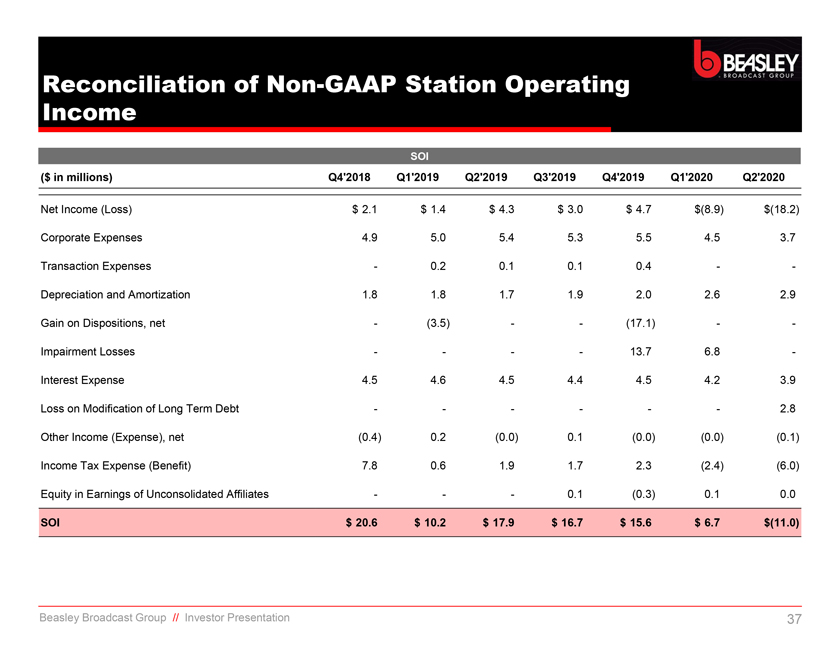
Reconciliation of Non-GAAP Station Operating
Income
SOI
($ in millions) Q4’2018 Q1’2019 Q2’2019 Q3’2019
Q4’2019 Q1’2020 Q2’2020
Net Income (Loss) $ 2.1 $ 1.4 $ 4.3 $ 3.0 $ 4.7 $(8.9) $(18.2) Corporate Expenses 4.9 5.0 5.4 5.3 5.5 4.5 3.7 Transaction
Expenses - 0.2 0.1 0.1 0.4 - -Depreciation and Amortization 1.8 1.8 1.7 1.9 2.0 2.6 2.9 Gain on Dispositions, net - (3.5) - - (17.1) - -Impairment Losses - - - - 13.7 6.8 -Interest Expense 4.5 4.6 4.5 4.4 4.5 4.2 3.9 Loss on Modification of Long
Term Debt - - - - - - 2.8 Other Income (Expense), net (0.4) 0.2 (0.0) 0.1 (0.0) (0.0) (0.1) Income Tax Expense (Benefit) 7.8 0.6 1.9 1.7 2.3 (2.4) (6.0) Equity in Earnings of Unconsolidated Affiliates - - - 0.1 (0.3) 0.1 0.0
SOI $ 20.6 $ 10.2 $ 17.9 $ 16.7 $ 15.6 $ 6.7 $(11.0)
Beasley Broadcast Group // Investor
Presentation
|
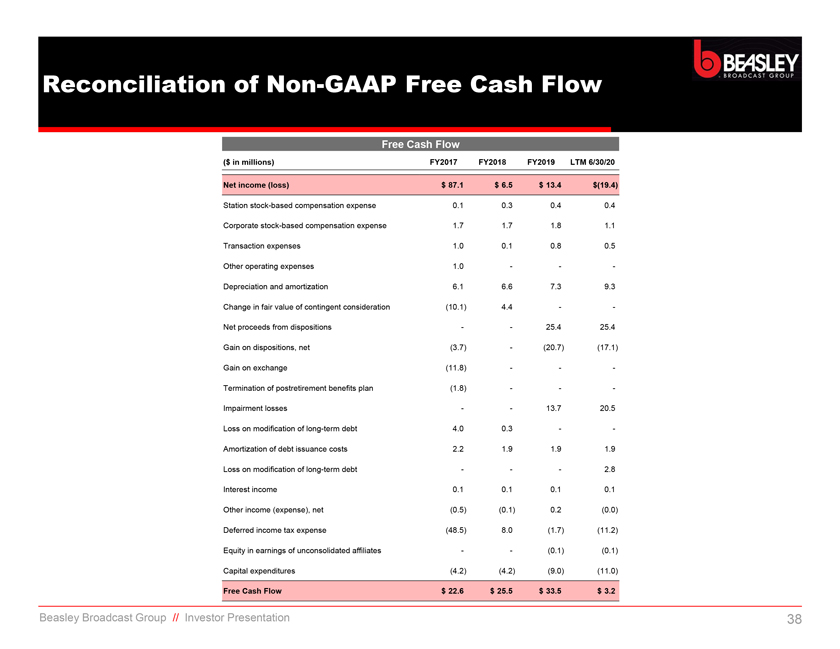
Reconciliation of Non-GAAP Free Cash Flow
Free Cash
Flow
($ in millions) FY2017 FY2018 FY2019 LTM 6/30/20
Net income (loss) $
87.1 $ 6.5 $ 13.4 $(19.4)
Station stock-based compensation expense 0.1 0.3 0.4 0.4 Corporate stock-based compensation expense 1.7 1.7 1.8 1.1 Transaction expenses
1.0 0.1 0.8 0.5 Other operating expenses 1.0 - - -Depreciation and amortization 6.1 6.6 7.3 9.3 Change in fair value of contingent consideration (10.1) 4.4 - -Net proceeds from dispositions - - 25.4 25.4 Gain on dispositions, net (3.7) - (20.7)
(17.1) Gain on exchange (11.8) - - -Termination of postretirement benefits plan (1.8) - - -Impairment losses - - 13.7 20.5 Loss on modification of long-term debt 4.0 0.3 - -Amortization of debt issuance costs 2.2 1.9 1.9 1.9 Loss on modification of
long-term debt - - - 2.8 Interest income 0.1 0.1 0.1 0.1 Other income (expense), net (0.5) (0.1) 0.2 (0.0) Deferred income tax expense (48.5) 8.0 (1.7) (11.2) Equity in earnings of unconsolidated affiliates - - (0.1) (0.1) Capital expenditures (4.2)
(4.2) (9.0) (11.0)
Free Cash Flow $ 22.6 $ 25.5 $ 33.5 $ 3.2
Beasley
Broadcast Group // Investor Presentation