Attached files
| file | filename |
|---|---|
| 8-K - 8-K - METLIFE INC | a8-kxbrltaggedcoverpag.htm |

Exhibit 99.1 Acquisition of Versant Health Compelling Strategic Combination with MetLife Group Benefits September 17, 2020

Cautionary Statement on Forward-Looking Statements The forward-looking statements in this presentation, such as “2021,” “ability,” “achievable,” “anticipated,” ”become,” “believe,” “can,” “connect,” “create,” “deliver,” “drive,” ”enter,” “expand,” “expect,” “future,” “grow,” “maintaining,” ”opportunity,” “outlook,” “plan,” “positioned,” “potential,” “prepare,” “projected,” “remain,” “target,” “to be,” and “will” are based on assumptions and expectations that involve risks and uncertainties, including the “Risk Factors” MetLife, Inc. describes in its U.S. Securities and Exchange Commission filings. MetLife’s future results could differ, and it has no obligation to correct or update any of these statements. 2

MetLife is acquiring Versant Health • Acquiring 100% of Versant Health from private investor group Transaction • Purchase price of $1.675 billion in cash • Adds established product to our industry leading Group Benefits platform Strong • MetLife will become 3rd largest U.S. vision insurer by membership Strategic Fit • Meaningful revenue synergies with MetLife • Expected to be accretive to EPS1 and free cash flow Attractive • High teens expected internal rate of return Financially • Low capital intensity and predictable underwriting • Cash on hand Financing • Expect to complete current buyback authorization by year-end 2020 • Targeted to close in Q4 2020 Timing • Subject to regulatory approvals and other closing conditions 1 Adjusted earnings per common share. 3 See Appendix for Non-GAAP financial information, definitions and/or reconciliations.

Next Horizon: Group Benefits strategic focus Enter New Adjacencies Grow Voluntary Build Group Franchise Deliver value through Expand voluntary products, Enter categories of emerging differentiated capabilities capabilities and relationships growth and value • Grow National Accounts • Enter Accident and Health • Health Savings Account • Expand Regional and Small • Expand Legal Plan offering • Pet Insurance business • Connect with top distributors • Digital Estate Planning • Invest in technology • Scale Vision Insurance 4

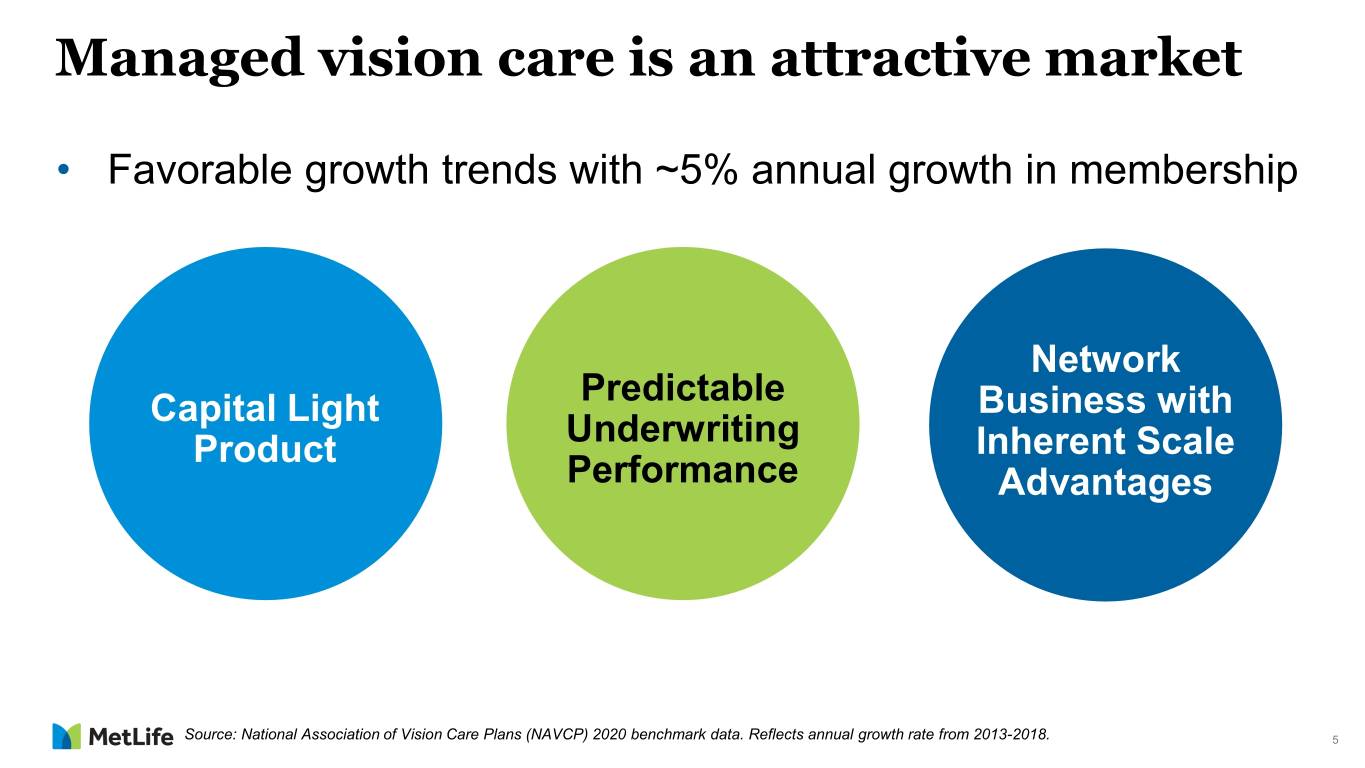
Managed vision care is an attractive market • Favorable growth trends with ~5% annual growth in membership Network Predictable Capital Light Business with Underwriting Product Inherent Scale Performance Advantages Source: National Association of Vision Care Plans (NAVCP) 2020 benchmark data. Reflects annual growth rate from 2013-2018. 5

MetLife to be third largest U.S. vision insurer Market Share1: 39% 26% 17%2 8% Key Highlights • Highly concentrated industry • Top three market position 38 Million Members • MetLife market share to 17% from 1% • High barriers to entry 1 2 Note: Membership figures as of June 2020. Remaining companies together = 10%. MetLife market share is 1% and Versant is 16% to total 17%. 6 Source: Internal analysis based on publicly available information and internal data.

Versant serves multiple markets across distribution channels Revenue1 by Business Commercial Accounts Revenue1 Government National Programs Accounts 25% 25% 75% 75% Other Commercial Commercial Accounts Accounts 1 Based on 2021 projected Adjusted Premiums, Fees and Other Revenues (PFOs). 7

Versant’s product excellence complements MetLife’s strong distribution MetLife Versant Product Group Benefits Accelerated and Pricing Distribution Revenue Growth Options Scale 8

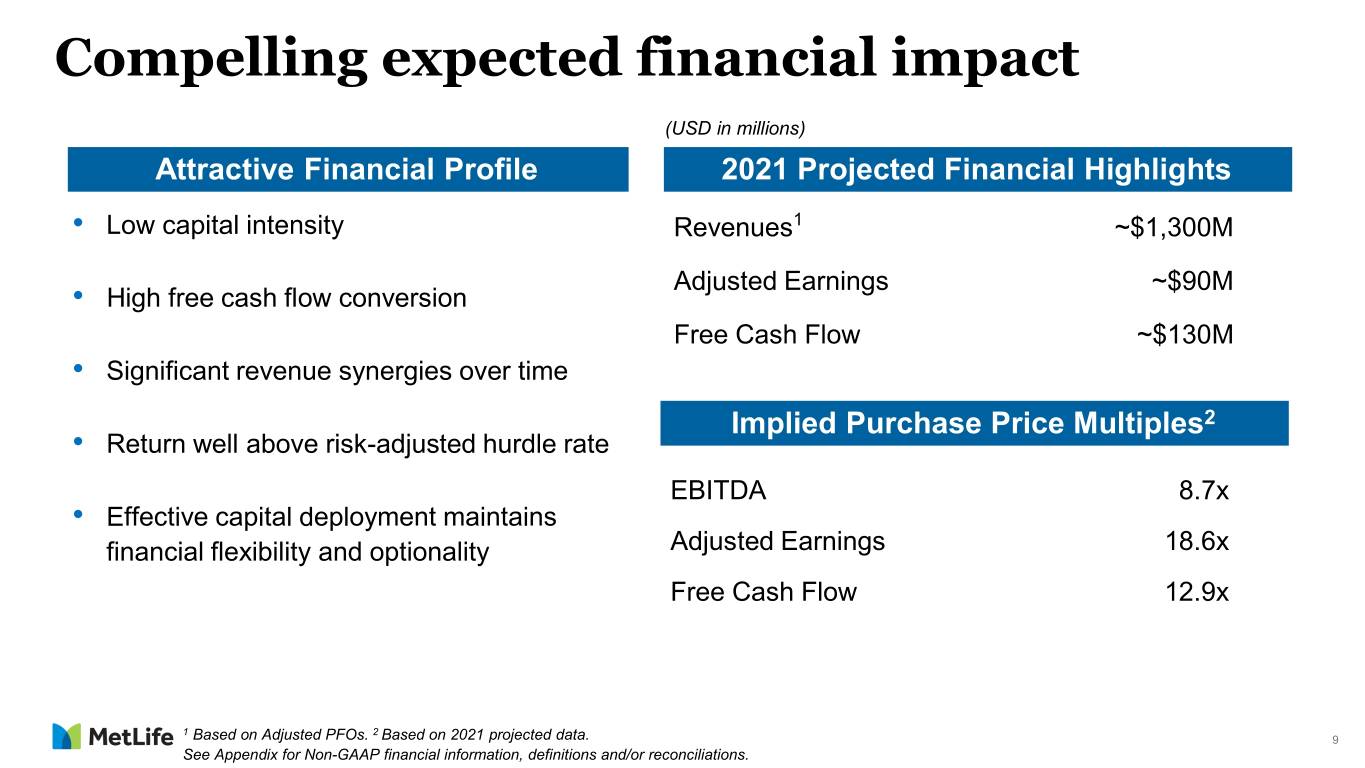
Compelling expected financial impact (USD in millions) Attractive Financial Profile 2021 Projected Financial Highlights • Low capital intensity Revenues1 ~$1,300M Adjusted Earnings ~$90M • High free cash flow conversion Free Cash Flow ~$130M • Significant revenue synergies over time Implied Purchase Price Multiples2 • Return well above risk-adjusted hurdle rate EBITDA 8.7x • Effective capital deployment maintains financial flexibility and optionality Adjusted Earnings 18.6x Free Cash Flow 12.9x 1 2 Based on Adjusted PFOs. Based on 2021 projected data. 9 See Appendix for Non-GAAP financial information, definitions and/or reconciliations.

Strong alignment with Next Horizon strategy and capital management philosophy . Fits strategically ☑ . Accelerates revenue growth ☑ . Accretive ☑ . Clears risk-adjusted hurdle rate ☑ . Compelling use of capital ☑ 10

Appendix

Explanatory Note on Non-GAAP and Other Financial Information Any references in this presentation (except in this Explanatory Note on Non-GAAP Financial Information and Reconciliations) to: Should be read as, respectively: (i) adjusted earnings; (i) adjusted earnings available to common shareholders; (ii) adjusted earnings per share; and (ii) adjusted earnings available to common shareholders per diluted common share; and (iii) premiums, fees and other revenues. (iii) adjusted premiums, fees and other revenues. In this presentation, MetLife presents certain measures of its performance on a consolidated and segment basis that are not calculated in accordance with accounting principles generally accepted in the United States of America (GAAP). Except with respect to earnings before interest, taxes, depreciation and amortization (“EBITDA”) as described below, MetLife believes that these non-GAAP financial measures enhance the understanding of MetLife’s performance by highlighting the results of operations and the underlying profitability drivers of the business. Segment-specific financial measures are calculated using only the portion of consolidated results attributable to that specific segment. The following non-GAAP financial measures should not be viewed as substitutes for the most directly comparable financial measures calculated in accordance with GAAP: Non-GAAP financial measures: Comparable GAAP financial measures: (i) adjusted earnings available to common shareholders; (i) net income (loss) available to MetLife, Inc.’s common shareholders; (ii) adjusted earnings available to common shareholders per diluted common share; (ii) net income (loss) available to MetLife, Inc.’s common shareholders per diluted common share; (iii) adjusted premiums, fees and other revenues; (iii) premiums, fees and other revenues; (iv) free cash flow of all holding companies; and (iv) MetLife, Inc. (parent company only) net cash provided by (used in) operating activities; and (v) EBITDA. (v) net income (loss). Any of these financial measures shown on a constant currency basis reflect the impact of changes in foreign currency exchange rates and are calculated using the average foreign currency exchange rates for the most recent period and applied to the comparable prior period. Reconciliations of non-GAAP measures to the most directly comparable GAAP measures are not accessible on a forward-looking basis because MetLife believes it is not possible without unreasonable effort to provide other than a range of net investment gains and losses and net derivative gains and losses, which can fluctuate significantly within or outside the range and from period to period and may have a material impact on net income (loss). 12

Explanatory Note on Non-GAAP and Other Financial Information (Continued) MetLife’s definitions of non-GAAP and other financial measures discussed in this presentation may differ from those used by other companies: Adjusted earnings and related measures • adjusted earnings; and • adjusted earnings available to common shareholders. These measures are used by management to evaluate performance and allocate resources. Consistent with GAAP guidance for segment reporting, adjusted earnings and components of, or other financial measures based on, adjusted earnings are also MetLife’s GAAP measures of segment performance. Adjusted earnings and other financial measures based on adjusted earnings are also the measures by which MetLife senior management’s and many other employees’ performance is evaluated for the purposes of determining their compensation under applicable compensation plans. Adjusted earnings and other financial measures based on adjusted earnings allow analysis of MetLife's performance relative to its Business Plan and facilitate comparisons to industry results. Adjusted earnings is defined as adjusted revenues less adjusted expenses, net of income tax. Adjusted loss is defined as negative adjusted earnings. Adjusted earnings available to common shareholders is defined as adjusted earnings less preferred stock dividends. Adjusted revenues and adjusted expenses These financial measures, along with the related adjusted premiums, fees and other revenues, focus on our primary businesses principally by excluding the impact of market volatility, which could distort trends, and revenues and costs related to non-core products and certain entities required to be consolidated under GAAP. Also, these measures exclude results of discontinued operations under GAAP and other businesses that have been or will be sold or exited by MetLife but do not meet the discontinued operations criteria under GAAP (Divested businesses). Divested businesses also include the net impact of transactions with exited businesses that have been eliminated in consolidation under GAAP and costs relating to businesses that have been or will be sold or exited by MetLife that do not meet the criteria to be included in results of discontinued operations under GAAP. In addition, for the year ended December 31, 2016, adjusted revenues and adjusted expenses exclude the financial impact of converting the Company’s Japan operations to calendar year-end reporting without retrospective application of this change to prior periods and is referred to as lag elimination. Adjusted revenues also excludes net investment gains (losses) (NIGL) and net derivative gains (losses) (NDGL). Adjusted expenses also excludes goodwill impairments. The following additional adjustments are made to revenues, in the line items indicated, in calculating adjusted revenues: • Universal life and investment-type product policy fees excludes the amortization of unearned revenue related to NIGL and NDGL (Unearned revenue adjustments) and certain variable annuity guaranteed minimum income benefits (GMIB) fees (GMIB fees); • Net investment income: (i) includes adjustments for earned income on derivatives and amortization of premium on derivatives that are hedges of investments or that are used to replicate certain investments but do not qualify for hedge accounting treatment (Investment hedge adjustments), (ii) excludes post-tax adjusted earnings adjustments relating to insurance joint ventures accounted for under the equity method, (iii) excludes certain amounts related to contractholder- directed equity securities, (iv) excludes certain amounts related to securitization entities that are variable interest entities (VIEs) consolidated under GAAP and (v) includes distributions of profits from certain other limited partnership interests that were previously accounted for under the cost method, but are now accounted for at estimated fair value, where the change in estimated fair value is recognized in NIGL under GAAP; and • Other revenues is adjusted for settlements of foreign currency earnings hedges and excludes fees received in association with services provided under transition service agreements (TSA fees). 13

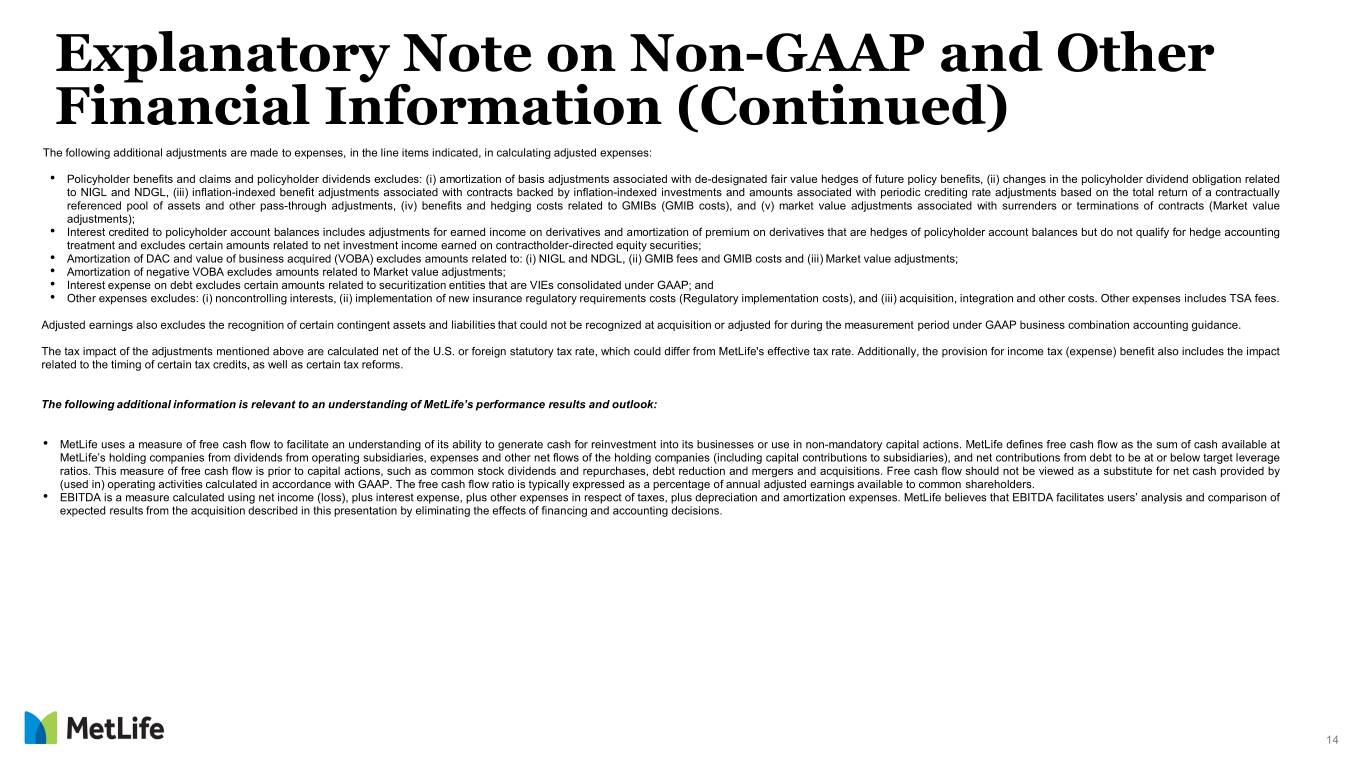
Explanatory Note on Non-GAAP and Other Financial Information (Continued) The following additional adjustments are made to expenses, in the line items indicated, in calculating adjusted expenses: • Policyholder benefits and claims and policyholder dividends excludes: (i) amortization of basis adjustments associated with de-designated fair value hedges of future policy benefits, (ii) changes in the policyholder dividend obligation related to NIGL and NDGL, (iii) inflation-indexed benefit adjustments associated with contracts backed by inflation-indexed investments and amounts associated with periodic crediting rate adjustments based on the total return of a contractually referenced pool of assets and other pass-through adjustments, (iv) benefits and hedging costs related to GMIBs (GMIB costs), and (v) market value adjustments associated with surrenders or terminations of contracts (Market value adjustments); • Interest credited to policyholder account balances includes adjustments for earned income on derivatives and amortization of premium on derivatives that are hedges of policyholder account balances but do not qualify for hedge accounting treatment and excludes certain amounts related to net investment income earned on contractholder-directed equity securities; • Amortization of DAC and value of business acquired (VOBA) excludes amounts related to: (i) NIGL and NDGL, (ii) GMIB fees and GMIB costs and (iii) Market value adjustments; • Amortization of negative VOBA excludes amounts related to Market value adjustments; • Interest expense on debt excludes certain amounts related to securitization entities that are VIEs consolidated under GAAP; and • Other expenses excludes: (i) noncontrolling interests, (ii) implementation of new insurance regulatory requirements costs (Regulatory implementation costs), and (iii) acquisition, integration and other costs. Other expenses includes TSA fees. Adjusted earnings also excludes the recognition of certain contingent assets and liabilities that could not be recognized at acquisition or adjusted for during the measurement period under GAAP business combination accounting guidance. The tax impact of the adjustments mentioned above are calculated net of the U.S. or foreign statutory tax rate, which could differ from MetLife's effective tax rate. Additionally, the provision for income tax (expense) benefit also includes the impact related to the timing of certain tax credits, as well as certain tax reforms. The following additional information is relevant to an understanding of MetLife’s performance results and outlook: • MetLife uses a measure of free cash flow to facilitate an understanding of its ability to generate cash for reinvestment into its businesses or use in non-mandatory capital actions. MetLife defines free cash flow as the sum of cash available at MetLife’s holding companies from dividends from operating subsidiaries, expenses and other net flows of the holding companies (including capital contributions to subsidiaries), and net contributions from debt to be at or below target leverage ratios. This measure of free cash flow is prior to capital actions, such as common stock dividends and repurchases, debt reduction and mergers and acquisitions. Free cash flow should not be viewed as a substitute for net cash provided by (used in) operating activities calculated in accordance with GAAP. The free cash flow ratio is typically expressed as a percentage of annual adjusted earnings available to common shareholders. • EBITDA is a measure calculated using net income (loss), plus interest expense, plus other expenses in respect of taxes, plus depreciation and amortization expenses. MetLife believes that EBITDA facilitates users’ analysis and comparison of expected results from the acquisition described in this presentation by eliminating the effects of financing and accounting decisions. 14

