Attached files
| file | filename |
|---|---|
| 8-K - FORM 8-K - International Seaways, Inc. | tm2030907d1_8k.htm |
Exhibit 99.1

International Seaways, Inc. 1 International Seaways, Inc. Pareto Energy Conference September 16 - 17, 2020

International Seaways, Inc. 2 Disclaimer Forward - Looking Statements During the course of this presentation, the Company (International Seaways, Inc. (INSW)) may make forward - looking statements or provide forward - looking information. All statements other than statements of historical facts should be considered forward - looking state ments. Some of these statements include words such as ‘‘outlook,’’ ‘‘believe,’’ ‘‘expect,’’ ‘‘potential,’’ ‘‘continue,’’ ‘‘may,’’ ‘‘will,’’ ‘‘should,’’ ‘‘could,’’ ‘‘seek,’’ ‘‘predict,’’ ‘‘intend,’’ ‘‘plan,’’ ‘‘estimate,’’ ‘‘anticipate,’’ ‘‘target,’’ ‘‘project,’’ ‘‘forecast,’’ ‘‘shall,’’ ‘‘contempl ate ’’ or the negative version of those words or other comparable words. Although they reflect INSW’s current expectations, these statements are not guarantees of future performance, but involve a number of risks, uncertainties, and assumptions which are difficult to predict. Some of the factor s t hat may cause actual outcomes and results to differ materially from those expressed in, or implied by, the forward - looking statements include, but are not necessarily limited to, vessel acquisitions, general economic conditions, competitive pressures, the nature of the Company’s ser vices and their price movements, and the ability to retain key employees. The Company does not undertake to update any forward - looking statement s as a result of future developments, new information or otherwise. Non - GAAP Financial Measures Included in this presentation are certain non - GAAP financial measures, including Time Charter Equivalent (“TCE”) revenue, EBITDA , Adjusted EBITDA, and total leverage ratios, designed to complement the financial information presented in accordance with generally ac cep ted accounting principles in the United States of America because management believes such measures are useful to investors. TCE revenues, w hic h represents shipping revenues less voyage expenses, is a measure to compare revenue generated from a voyage charter to revenue generated fro m a time charter. EBITDA represents net (loss)/income before interest expense, income taxes and depreciation and amortization expense. Ad justed EBITDA consists of EBITDA adjusted for the impact of certain items that we do not consider indicative of our ongoing operating perfo rma nce. Total leverage ratios are calculated as total debt divided by Adjusted EBITDA. We present non - GAAP measures when we believe that the a dditional information is useful and meaningful to investors. Non - GAAP financial measures do not have any standardized meaning and are ther efore unlikely to be comparable to similar measures presented by other companies. The presentation of non - GAAP financial measures is not intend ed to be a substitute for, and should not be considered in isolation from, the financial measures reported in accordance with GAAP. See App endix for a reconciliation of certain non - GAAP measures to the comparable GAAP measures. This presentation also contains estimates and other information concerning our industry that are based on industry publicatio ns, surveys and forecasts. This information involves a number of assumptions and limitations, and we have not independently verified the accu rac y or completeness of the information. Additional Information You should read the Company’s Annual Report on Form 10 - K for the year ended December 31, 2019, the Quarterly Report on Form 10 - Q for the quarters ended March 31, 2020 and June 30, 2020, and other documents the Company has filed with the SEC for additional inform ati on regarding the Company, its operations and the risks and uncertainties it faces. You may obtain these documents for free by visiting EDG AR on the SEC Web site at www.sec.gov , or from the Company’s website at www.intlseas.com .
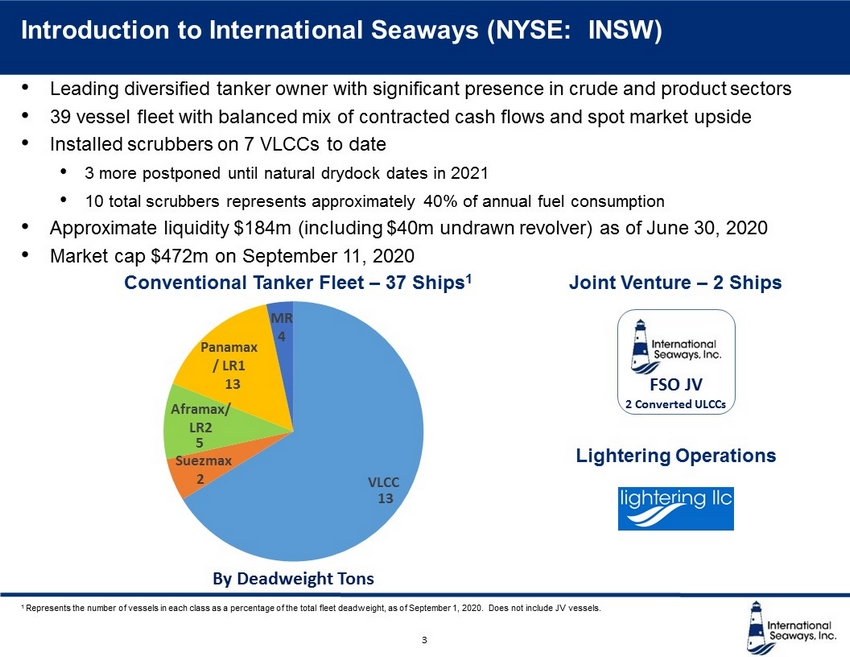
International Seaways, Inc. Introduction to International Seaways (NYSE: INSW) 1 Represents the number of vessels in each class as a percentage of the total fleet deadweight, as of September 1, 2020. Does not include JV vessels. • Leading diversified tanker owner with significant presence in crude and product sectors • 39 vessel fleet with balanced mix of contracted cash flows and spot market upside • Installed scrubbers on 7 VLCCs to date • 3 more postponed until natural drydock dates in 2021 • 10 total scrubbers represents approximately 40% of annual fuel consumption • Approximate liquidity $184m (including $40m undrawn revolver) as of June 30, 2020 • Market cap $472m on September 11, 2020 Conventional Tanker Fleet – 37 Ships 1 Joint Venture – 2 Ships FSO JV 2 Converted ULCCs VLCC Suezmax Aframax/ LR2 Panamax / LR1 MR By Deadweight Tons 13 4 13 5 2 Lightering Operations 3

International Seaways, Inc. • Best in class safety and environmental performance • Sector leading commercial pools, many with INSW ownership • New York representation in Tankers International VLCC pool • Invested $600 million, renewing fleet at bottom of cycle without issuing equity • Sold LNG joint venture for $123 million in cash • Installing total of 10 scrubbers on our modern VLCCs – 7 installed to date • Current Capital Allocation Priorities: • Deleverage • Return cash to shareholders – share repurchase and/or dividend • $30 million YTD share repurchases; another $30 million authorized Disciplined Capital Allocator Low Financial Leverage and Strong Balance Sheet Best in Class Commercial and Technical Operations Significant Operating Leverage Strong Governance and ESG Footprint • Accomplished fleet upgrade while maintaining one of the industry’s lowest leverage profiles • Refinanced $390 million of debt in January 2020, saving an additional $15 million annually • 34% Net Loan to Asset Value 1 at June 30 • Experienced management team • Majority independent and diverse board • #1 tanker company in Webber Research Governance rankings three years running • National Directors Institute Public Company Board of the Year - 2018 • 37 conventional tankers offer significant operating leverage to robust tanker market • Every $5,000 improvement in the Time Charter Equivalent daily rate (TCE) provides $67 million in incremental EBITDA and $2.38 EPS per annum • Q1 and Q2 rates earned and Q3 bookings demonstrate strong upside potential Why Invest in International Seaways? 4 1 Includes the value of INSW’s equity interest in the FSO JVs at book value, which takes into account assets and liabilities at th ose entities

International Seaways, Inc. 5 Coronavirus Update Shoreside o All New York and Houston Lightering office employees working remotely since March 16 and we will continue to evaluate our return based upon our highest priority, the safety of our staff o Full staff capabilities maintained o No delays in closing books nor SEC filings Crewing o Strict measures are in effect on all of our ships for the health and safety of our seafarers o Global travel restrictions are making crew changes exceptionally difficult, resulting in longer stays on board the vessels and at home o We are now deviating vessels where possible to facilitate crew changes Operations o There have been no material cost increases as of now o SIRE and other inspections are difficult to arrange o Transport of spare parts taking longer o Notwithstanding the above challenges, all key operations are working smoothly. Overall o Our priorities are a safe environment for our employees ashore and at sea, and the continued safe, reliable service to our energy customers COVID - 19 RESPONSE

International Seaways, Inc. ▪ International Seaways Invested $600 million at the bottom of the cycle o Two Suezmax newbuilding resales purchased for $58 million each o 2010 - built VLCC purchased for $53 million o Six VLCCs built 2016 and 2015 purchased for $434 million total o Assets materially appreciated since purchase 50 60 70 80 90 100 110 120 2010-01 2011-01 2012-01 2013-01 2014-01 2015-01 2016-01 2017-01 2018-01 2019-01 2020-01 $ millions Asset Prices Have Recovered From Lows VLCC Resale Prices Suezmax Resale Prices VLCC 5 Year Old Prices Seaways Raffles Seaways Hatteras Seaways Montauk 6 VLCC purchase Disciplined Capital Allocation: Fleet Renewal Source: Clarksons 6

International Seaways, Inc. 7 Market Update – Oil Supply, Demand and Market Implications Global Short - Term Crude in Floating Storage Source: EA Gibson, IEA Oil Demand o While the Coronavirus (COVID - 19) has negatively impacted oil demand, IEA has for the last two months increased their view of global oil demand, currently at 92.1 million b/d for 2020 and 97.4 million b/d for 2021, largely on the strength of Chinese demand. While down from the 100.0 million b/d achieved in 2019, this is still a significant increase from previous estimates Oil Supply o OPEC+ has agreed to ease production cuts, with August expected to see a 2 million b/d increase in production o US shale production under pressure from lower oil prices; EIA estimates August production to be down by 2 million b/d from its peak in March o Recent return to modest contango has led to increased demand for floating storage, supporting rates Tanker Market Implications o The combination of June OPEC+ production cuts, reduced demand for floating storage, and inventory destocking have all put negative pressure on freight rates
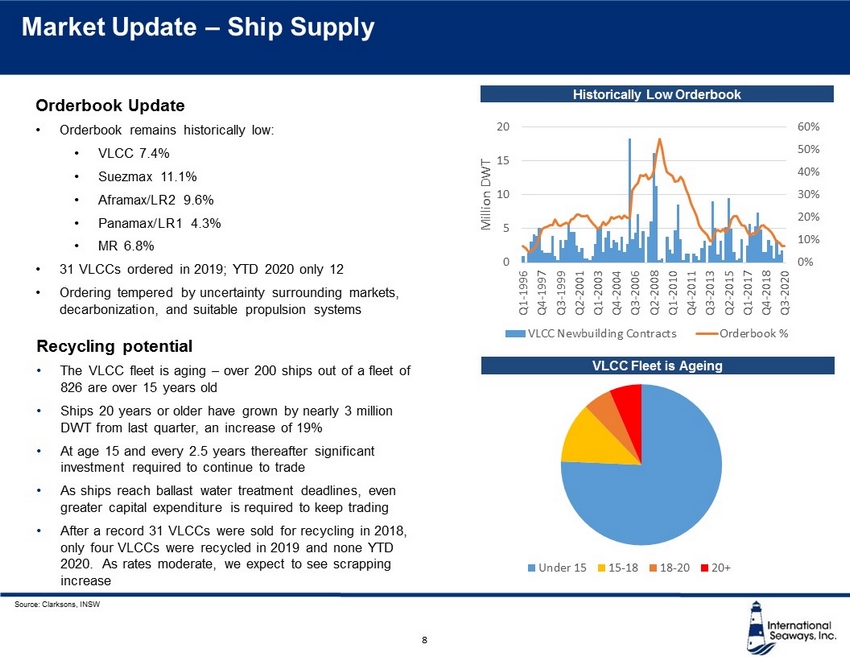
International Seaways, Inc. 8 Market Update – Ship Supply Source: Clarksons, INSW 0% 10% 20% 30% 40% 50% 60% 0 5 10 15 20 Q1-1996 Q4-1997 Q3-1999 Q2-2001 Q1-2003 Q4-2004 Q3-2006 Q2-2008 Q1-2010 Q4-2011 Q3-2013 Q2-2015 Q1-2017 Q4-2018 Q3-2020 Million DWT VLCC Newbuilding Contracts Orderbook % Under 15 15-18 18-20 20+ VLCC Fleet is Ageing Historically Low Orderbook Orderbook Update • Orderbook remains historically low: • VLCC 7.4% • Suezmax 11.1% • Aframax /LR2 9.6% • Panamax/LR1 4.3% • MR 6.8% • 31 VLCCs ordered in 2019; YTD 2020 only 12 • Ordering tempered by uncertainty surrounding markets, decarbonization , and suitable propulsion systems Recycling potential • The VLCC fleet is aging – over 200 ships out of a fleet of 826 are over 15 years old • Ships 20 years or older have grown by nearly 3 million DWT from last quarter, an increase of 19% • At age 15 and every 2.5 years thereafter significant investment required to continue to trade • As ships reach ballast water treatment deadlines, even greater capital expenditure is required to keep trading • After a record 31 VLCCs were sold for recycling in 2018, only four VLCCs were recycled in 2019 and none YTD 2020. As rates moderate, we expect to see scrapping increase

International Seaways, Inc. 9 VLCC 1 Year TC Rates 10,000 20,000 30,000 40,000 50,000 60,000 70,000 80,000 90,000 VLCC 1 Year TC (non - ECO) VLCC 1 Year TC (non-ECO) Source: Clarksons Weekly VLCC 1 Year Timecharter Rate through May 22, 2020

International Seaways, Inc. • Refinanced Term Loan B and other instruments with traditional bank debt, completes balance sheet evolution from acquisition to long term capital allocation • Lower margins and $110m debt prepayment yield savings of appr $25 million/ yr • Structured to provide capital allocation flexibility • Q3 event – repaid $40 million Transition loan in August 2020 Refinancing Brings Strong and Flexible Balance Sheet Low Cash Breakeven • Fleetwide cash breakeven $19,500/day for next 12 months before TCs and FSO • Effectively $14,600/day when factoring in VLCC time charters & JV contributions • Expected $31m drydock and $34m BWTS and Scrubber costs for 2020 Significant Operating Leverage • 37 conventional tankers • Every $5,000 improvement in the Time Charter Equivalent daily rate (TCE) provides $67 million in incremental EBITDA and $2.38 EPS annually INSW Financial Highlights Low Financial Leverage and Strong Balance Sheet • Accomplished fleet upgrade while maintaining one of the lowest leverage profiles in the tanker space • 34% Net Loan to Asset Value at June 30 (includes the value of the FSO JV) • 30% Net Debt to Capitalization at June 30 • Appr $184 million in liquidity (including $40 million undrawn revolver) at end of Q2 • Invested $600 million, renewing fleet at bottom of cycle without issuing equity • Sold LNG joint venture for $123 million in cash • Current Capital Allocation Priorities: • Deleverage • Return cash to shareholders – share repurchase and/or dividend Disciplined Capital Allocator 10
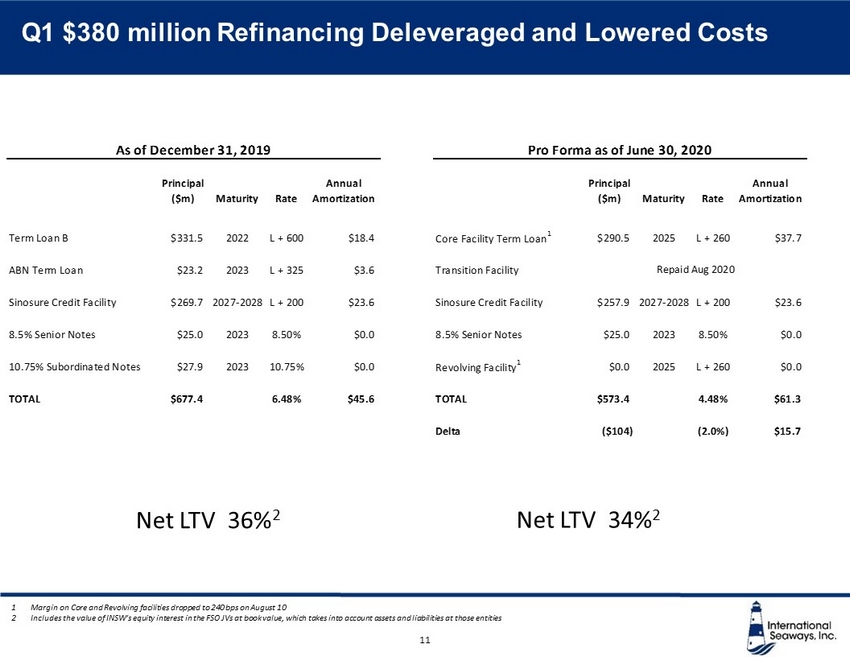
International Seaways, Inc. Q1 $380 million Refinancing Deleveraged and Lowered Costs Net LTV 36% 2 Net LTV 34% 2 Principal ($m) Maturity Rate Annual Amortization Principal ($m) Maturity Rate Annual Amortization Term Loan B $331.5 2022 L + 600 $18.4 Core Facility Term Loan 1 $290.5 2025 L + 260 $37.7 ABN Term Loan $23.2 2023 L + 325 $3.6 Transition Facility Sinosure Credit Facility $269.7 2027-2028 L + 200 $23.6 Sinosure Credit Facility $257.9 2027-2028 L + 200 $23.6 8.5% Senior Notes $25.0 2023 8.50% $0.0 8.5% Senior Notes $25.0 2023 8.50% $0.0 10.75% Subordinated Notes $27.9 2023 10.75% $0.0 Revolving Facility 1 $0.0 2025 L + 260 $0.0 TOTAL $677.4 6.48% $45.6 TOTAL $573.4 4.48% $61.3 Delta ($104) (2.0%) $15.7 As of December 31, 2019 Pro Forma as of June 30, 2020 Repaid Aug 2020 11 1 Margin on Core and Revolving facilities dropped to 240 bps on August 10 2 Includes the value of INSW’s equity interest in the FSO JVs at book value, which takes into account assets and liabilities at th ose entities

International Seaways, Inc. Lean and Scalable Model – Cash Breakevens – Last 12 Months 12 • INSW Daily OPEX excludes DDK deviation bunkers, insurance claims and one - off expenses • G&A for the Lightering segment is excluded • Vessels that have been sold are excluded • Only includes owned vessels. Two bareboat - in Aframaxes vessels have charter hire and OPEX expenses of approx. $17,700 per day • Breakevens are basis Revenue Days TCE breakeven levels allow INSW to navigate low points in the tanker cycle while providing significant operating leverage in rising markets Breakeven Rates by Sector Last Twelve Months Q2 2020 Actuals

International Seaways, Inc. Financial Summary – Q2 & Q3 Earnings Update 13 Notes: As of September 10, 2020 Overall 2020 Q2 VLCC TCE includes 261 time charter days at $67,200/day. Overall 2020Q3 VLCC TCE includes 368 time charter days at $73,300/day. Overall 2020 Q2 Panamax/LR1 TCE includes 540 time charter days at $16,300/day. Overall 2020 Q3 Panamax/LR1 TCE includes 236 time charter days booked at ap proximately $16,500/day Rates exclude average pool fees of approximately $719/day SPOT TC OVERALL TCE TCE TCE Fixed TCE Fixed TCE Fixed TCE VLCC $71,700 $67,200 $70,500 77% $40,200 100% $73,300 84% $52,400 VLCC < 15 $75,300 $73,800 $74,900 77% $44,900 100% $80,500 84% $57,700 VLCC 15+ $51,600 $51,600 $51,600 80% $23,100 100% $51,700 87% $34,600 Suezmax $49,000 --- $49,000 100% $28,700 0% $0 100% $28,700 Aframax/LR2 $30,600 --- $30,600 81% $13,300 0% $0 81% $13,300 Panamax/LR1 $31,500 $16,300 $24,500 71% $19,000 75% $16,500 72% $18,200 MR $17,200 --- $17,200 76% $15,200 0% $0 76% $15,200 2020 Q2 Actual 2020 Q3 Booked to Date SPOT TC OVERALL

International Seaways, Inc. ▪ The view from the tanker bridge is somewhat foggy – Research views on remainder of 2020 and full year 2021 rates vary widely, given differing views on the pace, extent and effect of the global oil and refined product de - stocking period. ▪ To assist analysts and potential investors with modeling and valuation assessment, we provide estimates of key INSW earnings metrics for 2021 from host Pareto Research and pro forma mid cycle rates for which we use long term spot rate averages. ▪ While we presently have significant time charter coverage above the mid - cycle rates – which are reflected in the Pareto 2021 estimates, the pro forma metrics assume all vessels are employed on spot. See Appendix for Time Charter summary. INSW Metrics and Multiples Based on Pareto and Mid - Cycle Estimates 14

International Seaways, Inc. Metrics Pareto 2021 (1) Pro Forma Mid - Cycle (2) Pareto 2022 (1) EBITDA $137mm $200mm $208mm Net Income $52mm $89mm $126mm EPS $1.86 $3.20 $4.50 Current INSW Values INSW share price $16.88 Market Capitalization $472mm Total Enterprise Value $948mm Pareto 2021 Pro Forma Mid - Cycle Pareto 2022 P/E 8.5x 5.0x 3.5x EV/EBITDA 6.7x 4.7x 4.4x (1) Source – Pareto Securities research publications – INSW does not endorse this or any other published research as a company forecast (2) Source – Management estimate based on available industry information and historical trends. For illustrative purposes – not intended to suggest an actual time frame for mid - cycle performance. Based on 27,983,771 shares outstanding Illustrative comparison of estimates for INSW EBITDA and EPS from one shipping research firm – Pareto Securities – versus theoretical estimates of INSW mid - cycle average earnings INSW Metrics and Multiples Based on Pareto and Mid - Cycle Estimates 15

International Seaways, Inc. • INSW is committed to implementing and advocating industry leading Environmental, Social and Governance practices Environmental • Commitment to minimizing risk of all forms of pollution and managing waste streams • Sustainability - linked pricing feature of INSW’s new debt facility • Active and enhanced compliance programs for IMO 2020, ballast water treatment • CEO Lois Zabrocky on the board of ITOPF, the International Tanker Owner’s Pollution Federation • NAMEPA Marine Environment Protection award, 2019 Social • International Seaways meets, and when possible, exceeds compliance with all applicable rules and regulations governing the maritime industry • Safe, healthy and secure working conditions for all employees on land and at sea, reinforced with strong safety statistics, e.g. 1.02 incidents 1 per million hours and 0.15 lost time injuries per million hours for last 12 months through October 2019 • Member of the Marine Anti - Corruption Network 1 All injuries of any severity – first aid cases, medical treatment cases, lost time injuries Strong Environmental Social & Governance Culture 16

International Seaways, Inc. Governance • Six members of Board of Directors fully independent • Split non - Executive Chairman and CEO • Commitment to diversity exemplified by two female Directors, one of whom is CEO • Shareholder representation on Board • Board includes former CEOs, former CFOs, and experts in shipping, compensation practices and compliance/governance • Annual election for all Board Members • Robust management and director stock ownership guidelines External Validation • Wells Fargo and Webber Research Governance Ranking: • #1 among tanker shipping companies • #2 of 56 shipping companies overall • Three years in a row: 2018, 2019, 2020 • National Directors Institute Public Company Board of the Year Strong Environmental Social & Governance Culture 17

International Seaways, Inc. 18 APPENDIX

International Seaways, Inc. Fleet Evolution Since Spin - Off 5.2 5.4 5.6 5.8 6.0 6.2 Spin-Off Dec 2016 June 30, 2020 Total DWT (millions) 6 8 10 12 14 Spin-Off Dec 2016 June 30, 2020 Average Age 40 45 50 55 60 65 Spin-Off Dec 2016 June 30, 2020 Total Ton - Years 1 Basis DWT x remaining life of fleet (Ton - Years). 20 year life for illustrative purposes only. INSW accounting policy is 25 yea r ship life 5.5 m DWT 12.1 years 47.6 Ton - Years 6.0 m DWT 9.9 years 62.6 Ton - Years 19

International Seaways, Inc. VLCC Time Charter Details 20 2020-01 2021-01 2022-01 2023-01 Seaways McKinley Seaways Tybee Seaways Tanabe Seaways Kilimanjaro 3 Years $45,000 / day 1 Year $53,000 / day 7 Months $100,000 / day average
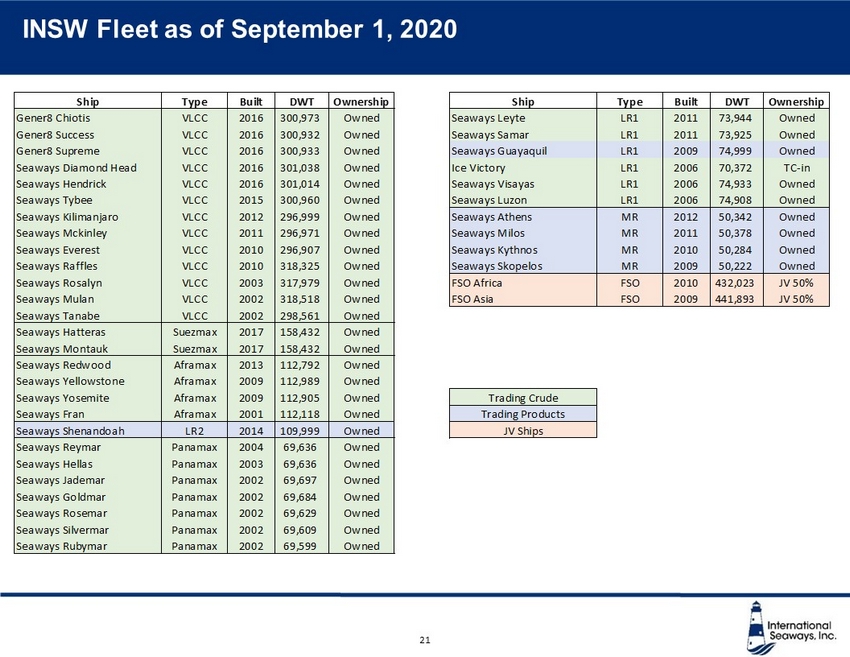
International Seaways, Inc. INSW Fleet as of September 1, 2020 21 Ship Type Built DWT Ownership Ship Type Built DWT Ownership Gener8 Chiotis VLCC 2016 300,973 Owned Seaways Leyte LR1 2011 73,944 Owned Gener8 Success VLCC 2016 300,932 Owned Seaways Samar LR1 2011 73,925 Owned Gener8 Supreme VLCC 2016 300,933 Owned Seaways Guayaquil LR1 2009 74,999 Owned Seaways Diamond Head VLCC 2016 301,038 Owned Ice Victory LR1 2006 70,372 TC-in Seaways Hendrick VLCC 2016 301,014 Owned Seaways Visayas LR1 2006 74,933 Owned Seaways Tybee VLCC 2015 300,960 Owned Seaways Luzon LR1 2006 74,908 Owned Seaways Kilimanjaro VLCC 2012 296,999 Owned Seaways Athens MR 2012 50,342 Owned Seaways Mckinley VLCC 2011 296,971 Owned Seaways Milos MR 2011 50,378 Owned Seaways Everest VLCC 2010 296,907 Owned Seaways Kythnos MR 2010 50,284 Owned Seaways Raffles VLCC 2010 318,325 Owned Seaways Skopelos MR 2009 50,222 Owned Seaways Rosalyn VLCC 2003 317,979 Owned FSO Africa FSO 2010 432,023 JV 50% Seaways Mulan VLCC 2002 318,518 Owned FSO Asia FSO 2009 441,893 JV 50% Seaways Tanabe VLCC 2002 298,561 Owned Seaways Hatteras Suezmax 2017 158,432 Owned Seaways Montauk Suezmax 2017 158,432 Owned Seaways Redwood Aframax 2013 112,792 Owned Seaways Yellowstone Aframax 2009 112,989 Owned Seaways Yosemite Aframax 2009 112,905 Owned Trading Crude Seaways Fran Aframax 2001 112,118 Owned Trading Products Seaways Shenandoah LR2 2014 109,999 Owned JV Ships Seaways Reymar Panamax 2004 69,636 Owned Seaways Hellas Panamax 2003 69,636 Owned Seaways Jademar Panamax 2002 69,697 Owned Seaways Goldmar Panamax 2002 69,684 Owned Seaways Rosemar Panamax 2002 69,629 Owned Seaways Silvermar Panamax 2002 69,609 Owned Seaways Rubymar Panamax 2002 69,599 Owned

International Seaways, Inc. Pro Forma Mid - Cycle Net Income 89 Income tax provision/(benefit) 0 Interest expense 29 Depreciation and amortization 82 EBITDA 200 EBITDA Reconciliation ($ millions) 22 Source – Management estimate based on available industry information and historical trends. For illustrative purposes – not intended to suggest an actual time frame for mid - cycle performance.