Attached files
| file | filename |
|---|---|
| 8-K - 8-K - EMERSON ELECTRIC CO | fy2020orders8-kseptrel.htm |

Exhibit 99.1 Emerson Orders Update September 16, 2020 Forward-Looking and Cautionary Statements in these slides that are not strictly historical may be “forward-looking” statements, which involve risks and uncertainties, and Emerson undertakes no obligation to update any such statements to reflect later developments. These risks and uncertainties include the scope, duration and ultimate impact of the COVID-19 pandemic as well as economic and currency conditions, market demand, including related to the pandemic and oil and gas price declines and volatility, pricing, protection of intellectual property, cybersecurity, tariffs, competitive and technological factors, among others, as set forth in the Company's most recent Annual Report on Form 10-K and subsequent reports filed with the SEC. Underlying orders discussed herein exclude the impact of currency translation. 1

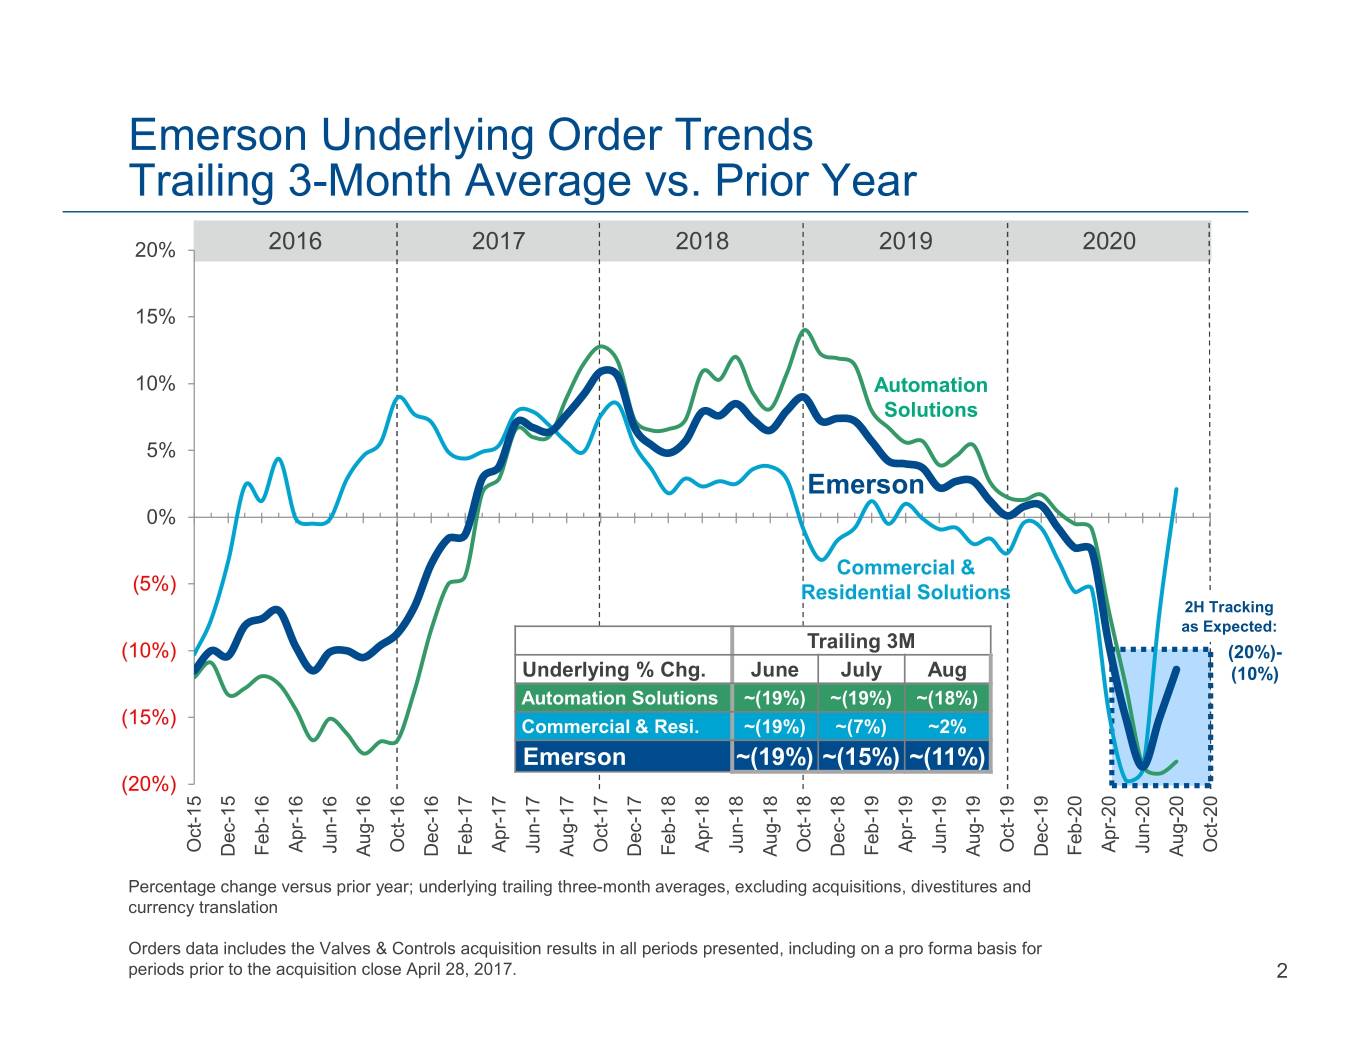
Emerson Underlying Order Trends Trailing 3-Month Average vs. Prior Year 20% 2016 2017 2018 2019 2020 15% 10% Automation Solutions 5% Emerson 0% Commercial & (5%) Residential Solutions 2H Tracking as Expected: Trailing 3M (10%) (20%)- Underlying % Chg. June July Aug (10%) Automation Solutions ~(19%) ~(19%) ~(18%) (15%) Commercial & Resi. ~(19%) ~(7%) ~2% Emerson ~(19%) ~(15%) ~(11%) (20%) Oct-15 Apr-16 Oct-16 Apr-17 Oct-17 Apr-18 Oct-18 Apr-19 Oct-19 Apr-20 Oct-20 Jun-16 Jun-17 Jun-18 Jun-19 Jun-20 Feb-16 Feb-17 Feb-18 Feb-19 Feb-20 Dec-15 Aug-16 Dec-16 Aug-17 Dec-17 Aug-18 Dec-18 Aug-19 Dec-19 Aug-20 Percentage change versus prior year; underlying trailing three-month averages, excluding acquisitions, divestitures and currency translation Orders data includes the Valves & Controls acquisition results in all periods presented, including on a pro forma basis for periods prior to the acquisition close April 28, 2017. 2

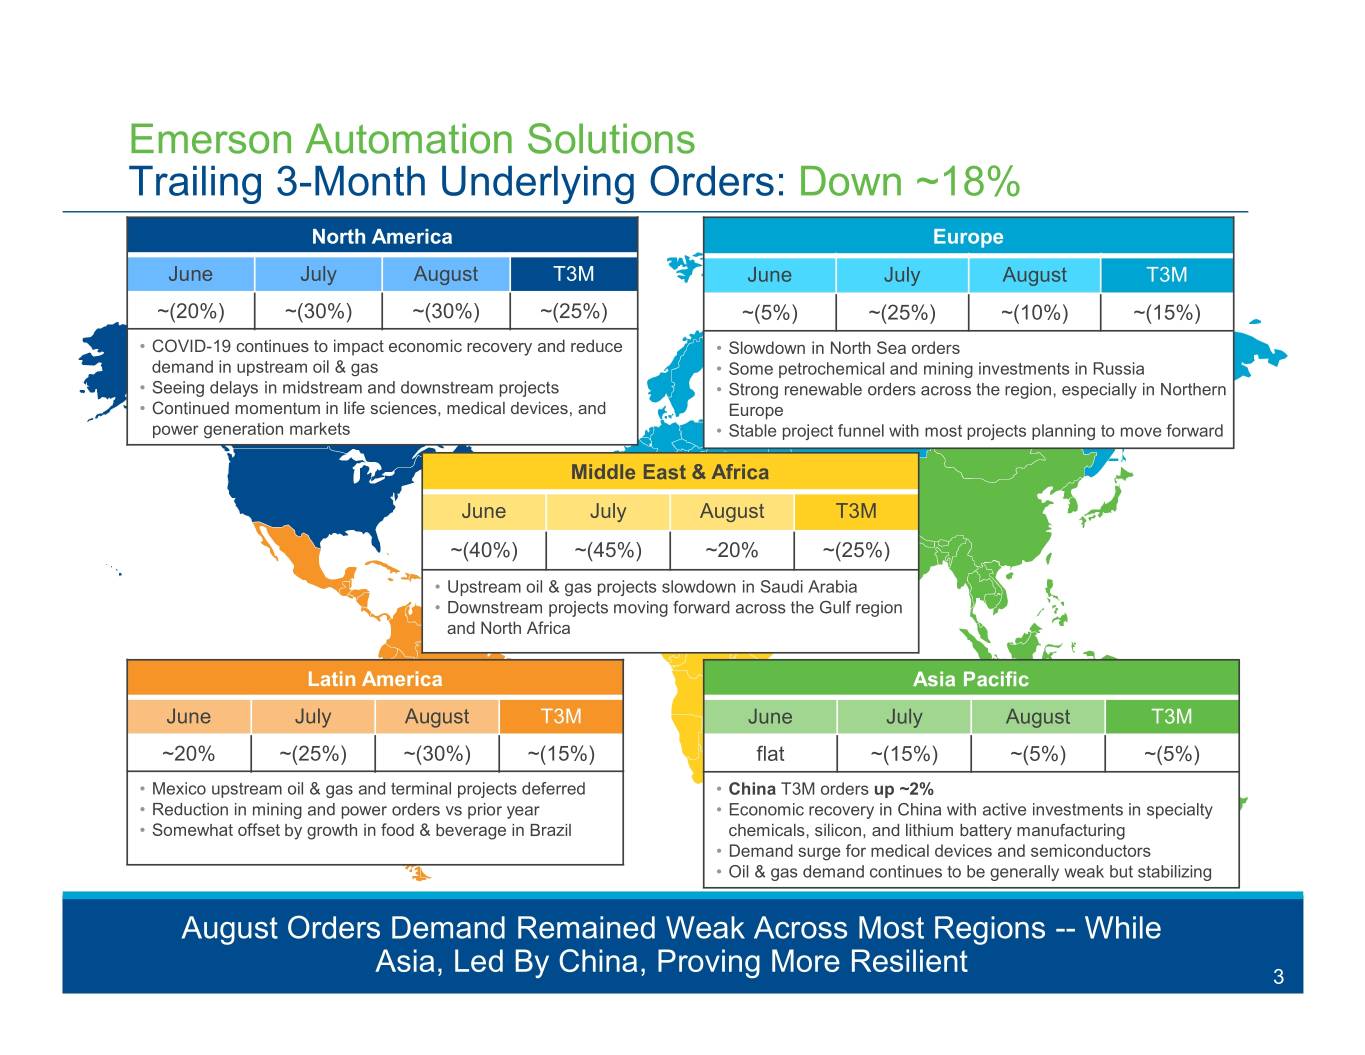
Emerson Automation Solutions Trailing 3-Month Underlying Orders: Down ~18% North America Europe June July August T3M June July August T3M ~(20%) ~(30%) ~(30%) ~(25%) ~(5%) ~(25%) ~(10%) ~(15%) • COVID-19 continues to impact economic recovery and reduce • Slowdown in North Sea orders demand in upstream oil & gas • Some petrochemical and mining investments in Russia • Seeing delays in midstream and downstream projects • Strong renewable orders across the region, especially in Northern • Continued momentum in life sciences, medical devices, and Europe power generation markets • Stable project funnel with most projects planning to move forward Middle East & Africa June July August T3M ~(40%) ~(45%) ~20% ~(25%) • Upstream oil & gas projects slowdown in Saudi Arabia • Downstream projects moving forward across the Gulf region and North Africa Latin America Asia Pacific June July August T3M June July August T3M ~20% ~(25%) ~(30%) ~(15%) flat ~(15%) ~(5%) ~(5%) • Mexico upstream oil & gas and terminal projects deferred • China T3M orders up ~2% • Reduction in mining and power orders vs prior year • Economic recovery in China with active investments in specialty • Somewhat offset by growth in food & beverage in Brazil chemicals, silicon, and lithium battery manufacturing • Demand surge for medical devices and semiconductors • Oil & gas demand continues to be generally weak but stabilizing August Orders Demand Remained Weak Across Most Regions -- While Asia, Led By China, Proving More Resilient 33

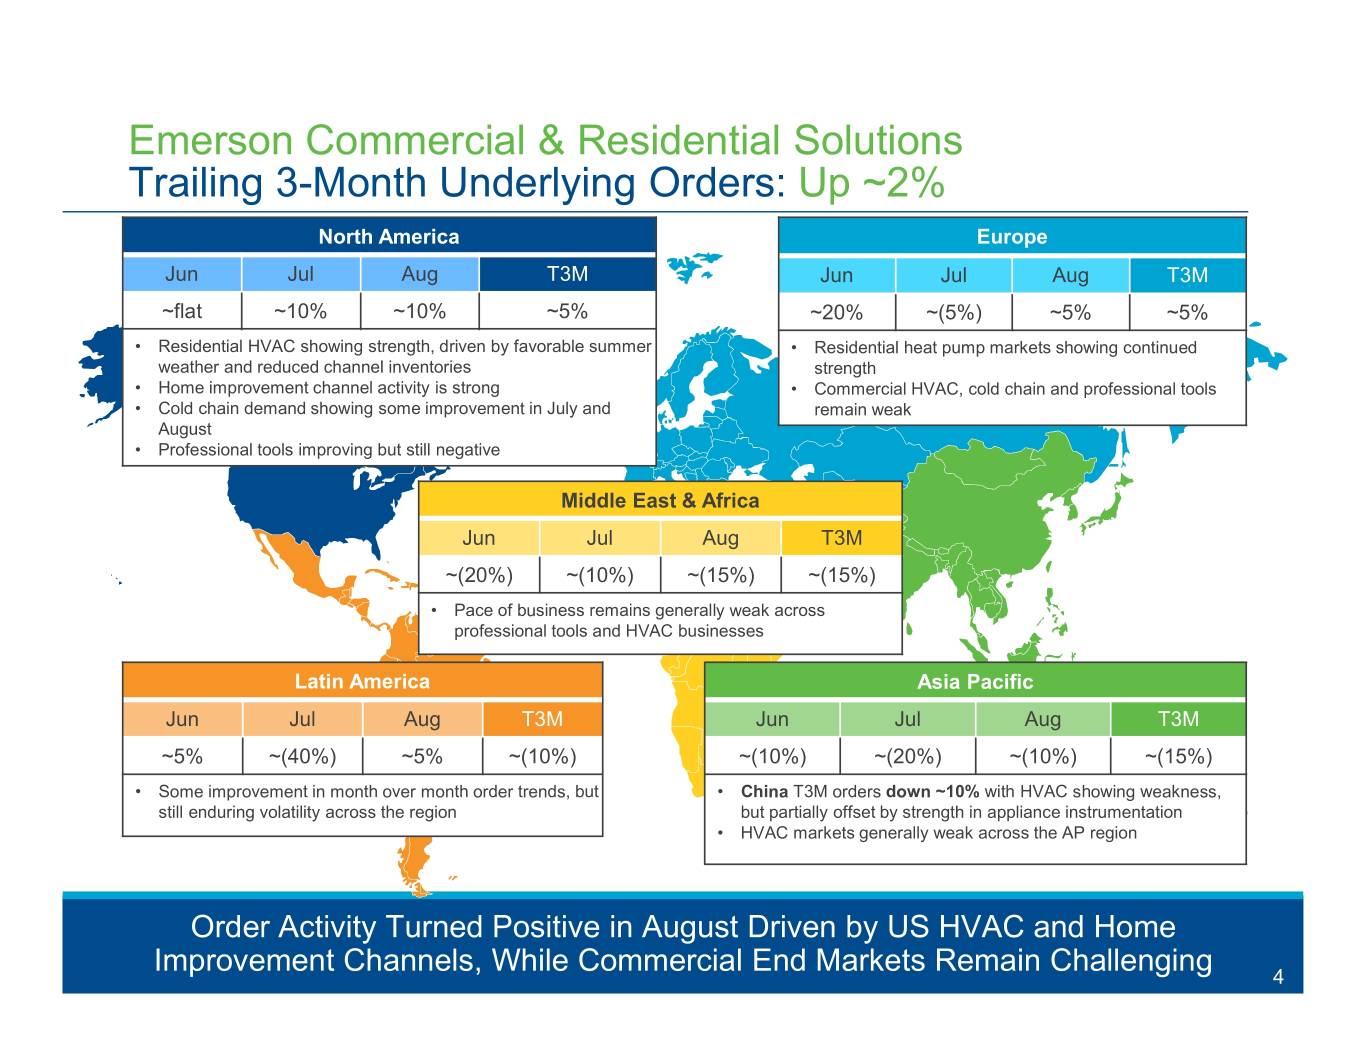
Emerson Commercial & Residential Solutions Trailing 3-Month Underlying Orders: Up ~2% North America Europe Jun Jul Aug T3M Jun Jul Aug T3M ~flat ~10% ~10% ~5% ~20% ~(5%) ~5% ~5% • Residential HVAC showing strength, driven by favorable summer • Residential heat pump markets showing continued weather and reduced channel inventories strength • Home improvement channel activity is strong • Commercial HVAC, cold chain and professional tools • Cold chain demand showing some improvement in July and remain weak August • Professional tools improving but still negative Middle East & Africa Jun Jul Aug T3M ~(20%) ~(10%) ~(15%) ~(15%) • Pace of business remains generally weak across professional tools and HVAC businesses Latin America Asia Pacific Jun Jul Aug T3M Jun Jul Aug T3M ~5% ~(40%) ~5% ~(10%) ~(10%) ~(20%) ~(10%) ~(15%) • Some improvement in month over month order trends, but • China T3M orders down ~10% with HVAC showing weakness, still enduring volatility across the region but partially offset by strength in appliance instrumentation • HVAC markets generally weak across the AP region Order Activity Turned Positive in August Driven by US HVAC and Home Improvement Channels, While Commercial End Markets Remain Challenging 44
