Attached files
| file | filename |
|---|---|
| 8-K - 8-K - TPG RE Finance Trust, Inc. | d64795d8k.htm |

BofA Securities 2020 Virtual Global Real Estate Conference September 15, 2020BofA Securities 2020 Virtual Global Real Estate Conference September 15, 2020
Forward Looking Statements This presentation contains, and our officers and representatives may make, “forward‐looking statements” within the meaning of Section 27A of the Securities Act of 1933, as amended, and Section 21E of the Securities Exchange Act of 1934, as amended, which reflect our current views with respect to, among other things, our operations and financial performance. You can identify these forward‐looking statements by the use of words such as “outlook,” “believe,” “expect,” “potential,” “continue,” “may,” “should,” “seek,” “approximately,” “predict,” “intend,” “will,” “plan,” “estimate,” “anticipate,” the negative version of these words, other comparable words or other statements that do not relate strictly to historical or factual matters. By their nature, forward‐looking statements speak only as of the date they are made, are not statements of historical fact or guarantees of future performance and are subject to risks, uncertainties, assumptions or changes in circumstances that are difficult to predict or quantify. Our expectations, beliefs and projections are expressed in good faith, and we believethere is a reasonable basis for them. However, there can be no assurance that our expectations, beliefs and projections will occur or be achieved, and actual results may vary materially from what is expressed in or indicated by the forward‐looking statements. There are a number of risks, uncertainties and other important factors that could cause our actual results to differ materially from the forward‐looking statements contained in or made in connection with this presentation. Such risks and uncertainties include, but are not limited to, the following: § The general political, economic and competitive conditions in the marketsin which we invest; § The level and volatility of prevailing interest rates and credit spreads; § Adverse changes in the real estate and real estate capital markets; § General volatility of the securities markets in which we participate; § Changes in our business, investment strategies or target assets; § Difficulty in obtaining financing or raising capital; § Reductions in the yield on our investments and increases in the cost of our financing; § Adverse legislative or regulatory developments, including with respect to tax laws; § Acts of God such as hurricanes, floods, earthquakes, wildfires, mudslides, volcanic eruptions, and other natural disasters, acts of war and/or terrorism and other events that may cause unanticipated and uninsured performance declines and/or losses to us or the owners and operators of the real estate securing our investments; § The ultimate geographic spread, severity and duration of pandemics such as the recent outbreak of novel coronavirus (“COVID‐19”), actions that may be taken by governmental authorities to contain or address the impact of such pandemics, and the potential negative impacts of such pandemics on the global economy and our financial condition and results of operations; § Changes in the availability of attractive loan and other investment opportunities, whether they are due to competition, regulation or otherwise; § Deterioration in the performance of properties securing our investments that may cause deterioration in the performance of our investments, adversely impact certain of our financing arrangements and our liquidity, and potentially expose us to principal losses on our investments; § Defaults by borrowers in paying debt service on outstanding indebtedness; § The adequacy of collateral securing our investments and declines in the fair value of our investments; § Adverse developments in the availability of desirable investment opportunities; § Difficulty in successfully managing our growth, including integrating new assets into our existing systems; § The cost of operating our platform, including, but not limited to, the cost of operating a real estate investment platform and the cost of operating as a publicly traded company; § The availability of qualified personnel and our relationship with our Manager; § The potential unavailability of the London Interbank Offered Rate (“LIBOR”) after December 31, 2021; § Conflicts with TPG and its affiliates, including our Manager, the personnel of TPG providing services to us, including our officers, and certain funds managed by TPG; § Our qualification as a real estate investment trust for U.S. federal income tax purposes and our ability to maintain our exemption or exclusion from registration under the Investment Company Act of 1940, as amended; and § Authoritative U.S. GAAP or policy changes from such standard‐setting bodies such as the Financial Accounting Standards Board, the Securities and Exchange Commission, the Internal Revenue Service, the New York Stock Exchange and other authorities that we are subject to, as well as their counterparts in any foreign jurisdictions where we might do business. There may be other risks, uncertainties or factors that may cause our actual results to differ materially from the forward‐looking statements contained in or made in connection with this presentation, including risks, uncertainties and factors disclosed under the heading “Risk Factors” contained in Part I, Item 1A in our Annual Report on Form 10‐K for the year ended December 31, 2019 and in Part II, Item 1A in our Quarterly Report on Form 10‐Q for the quarterly period ended June 30, 2020 and under the heading “Management’s Discussion and Analysis of Financial Condition and Results of Operations” in Part I, Item 2 in our Quarterly Report on Form 10‐Q for the quarterly period ended June 30, 2020, as the same may be updated from time to time by our future filings under the Securities Exchange Act of 1934, as amended. You should evaluate all forward‐looking statements contained in or made in connection with this presentation in the context of these risks, uncertainties and other factors. Although we believe that the expectations reflected in the forward‐looking statements are reasonable, we cannot guarantee future results, levels of activity, performance, or achievements. We caution you that the risks, uncertainties and other factors referenced above may not contain all of the risks, uncertainties and other factors that are important to you. In addition,wecannot assure youthatwewillrealizethe results, benefits or developments that we expect or anticipate or, even if substantially realized, that they will result in the consequences or affect us or our business in the way expected. All forward‐looking statements contained in or made in connection with this presentation apply only as of the date made and are expressly qualified in their entirety by the cautionary statements included in this presentation and in the documents we file with the Securities and Exchange Commission. We undertake no obligation to publicly update or revise any forward‐looking statements to reflect subsequent events or circumstances, except as required by law. TRTX Presentation | BOA Securities 2020 Virtual Global RE Conference | September 15, 2020 2Forward Looking Statements This presentation contains, and our officers and representatives may make, “forward‐looking statements” within the meaning of Section 27A of the Securities Act of 1933, as amended, and Section 21E of the Securities Exchange Act of 1934, as amended, which reflect our current views with respect to, among other things, our operations and financial performance. You can identify these forward‐looking statements by the use of words such as “outlook,” “believe,” “expect,” “potential,” “continue,” “may,” “should,” “seek,” “approximately,” “predict,” “intend,” “will,” “plan,” “estimate,” “anticipate,” the negative version of these words, other comparable words or other statements that do not relate strictly to historical or factual matters. By their nature, forward‐looking statements speak only as of the date they are made, are not statements of historical fact or guarantees of future performance and are subject to risks, uncertainties, assumptions or changes in circumstances that are difficult to predict or quantify. Our expectations, beliefs and projections are expressed in good faith, and we believethere is a reasonable basis for them. However, there can be no assurance that our expectations, beliefs and projections will occur or be achieved, and actual results may vary materially from what is expressed in or indicated by the forward‐looking statements. There are a number of risks, uncertainties and other important factors that could cause our actual results to differ materially from the forward‐looking statements contained in or made in connection with this presentation. Such risks and uncertainties include, but are not limited to, the following: § The general political, economic and competitive conditions in the marketsin which we invest; § The level and volatility of prevailing interest rates and credit spreads; § Adverse changes in the real estate and real estate capital markets; § General volatility of the securities markets in which we participate; § Changes in our business, investment strategies or target assets; § Difficulty in obtaining financing or raising capital; § Reductions in the yield on our investments and increases in the cost of our financing; § Adverse legislative or regulatory developments, including with respect to tax laws; § Acts of God such as hurricanes, floods, earthquakes, wildfires, mudslides, volcanic eruptions, and other natural disasters, acts of war and/or terrorism and other events that may cause unanticipated and uninsured performance declines and/or losses to us or the owners and operators of the real estate securing our investments; § The ultimate geographic spread, severity and duration of pandemics such as the recent outbreak of novel coronavirus (“COVID‐19”), actions that may be taken by governmental authorities to contain or address the impact of such pandemics, and the potential negative impacts of such pandemics on the global economy and our financial condition and results of operations; § Changes in the availability of attractive loan and other investment opportunities, whether they are due to competition, regulation or otherwise; § Deterioration in the performance of properties securing our investments that may cause deterioration in the performance of our investments, adversely impact certain of our financing arrangements and our liquidity, and potentially expose us to principal losses on our investments; § Defaults by borrowers in paying debt service on outstanding indebtedness; § The adequacy of collateral securing our investments and declines in the fair value of our investments; § Adverse developments in the availability of desirable investment opportunities; § Difficulty in successfully managing our growth, including integrating new assets into our existing systems; § The cost of operating our platform, including, but not limited to, the cost of operating a real estate investment platform and the cost of operating as a publicly traded company; § The availability of qualified personnel and our relationship with our Manager; § The potential unavailability of the London Interbank Offered Rate (“LIBOR”) after December 31, 2021; § Conflicts with TPG and its affiliates, including our Manager, the personnel of TPG providing services to us, including our officers, and certain funds managed by TPG; § Our qualification as a real estate investment trust for U.S. federal income tax purposes and our ability to maintain our exemption or exclusion from registration under the Investment Company Act of 1940, as amended; and § Authoritative U.S. GAAP or policy changes from such standard‐setting bodies such as the Financial Accounting Standards Board, the Securities and Exchange Commission, the Internal Revenue Service, the New York Stock Exchange and other authorities that we are subject to, as well as their counterparts in any foreign jurisdictions where we might do business. There may be other risks, uncertainties or factors that may cause our actual results to differ materially from the forward‐looking statements contained in or made in connection with this presentation, including risks, uncertainties and factors disclosed under the heading “Risk Factors” contained in Part I, Item 1A in our Annual Report on Form 10‐K for the year ended December 31, 2019 and in Part II, Item 1A in our Quarterly Report on Form 10‐Q for the quarterly period ended June 30, 2020 and under the heading “Management’s Discussion and Analysis of Financial Condition and Results of Operations” in Part I, Item 2 in our Quarterly Report on Form 10‐Q for the quarterly period ended June 30, 2020, as the same may be updated from time to time by our future filings under the Securities Exchange Act of 1934, as amended. You should evaluate all forward‐looking statements contained in or made in connection with this presentation in the context of these risks, uncertainties and other factors. Although we believe that the expectations reflected in the forward‐looking statements are reasonable, we cannot guarantee future results, levels of activity, performance, or achievements. We caution you that the risks, uncertainties and other factors referenced above may not contain all of the risks, uncertainties and other factors that are important to you. In addition,wecannot assure youthatwewillrealizethe results, benefits or developments that we expect or anticipate or, even if substantially realized, that they will result in the consequences or affect us or our business in the way expected. All forward‐looking statements contained in or made in connection with this presentation apply only as of the date made and are expressly qualified in their entirety by the cautionary statements included in this presentation and in the documents we file with the Securities and Exchange Commission. We undertake no obligation to publicly update or revise any forward‐looking statements to reflect subsequent events or circumstances, except as required by law. TRTX Presentation | BOA Securities 2020 Virtual Global RE Conference | September 15, 2020 2

TPG RE Finance Trust, Inc. $5.6 billion $5.1 billion $12.4 billion 99.4% Total Outstanding Unpaid Principal Balance Loan Commitments First Mortgage Loans Loan Commitments of Loans Originated or Acquired Since December 2014 65 Loans L+3.4% 100% 65.8% Weighted Average Floating Rate Weighted Average LTV Loan Interest Rate TRTX is a leading commercial mortgage REIT targeting direct origination of floating rate, transitional first mortgages to primarily institutional borrowers Source: Company financials as of June 30,2020 TRTX Presentation | BOA Securities 2020 Virtual Global RE Conference | September 15, 2020 3TPG RE Finance Trust, Inc. $5.6 billion $5.1 billion $12.4 billion 99.4% Total Outstanding Unpaid Principal Balance Loan Commitments First Mortgage Loans Loan Commitments of Loans Originated or Acquired Since December 2014 65 Loans L+3.4% 100% 65.8% Weighted Average Floating Rate Weighted Average LTV Loan Interest Rate TRTX is a leading commercial mortgage REIT targeting direct origination of floating rate, transitional first mortgages to primarily institutional borrowers Source: Company financials as of June 30,2020 TRTX Presentation | BOA Securities 2020 Virtual Global RE Conference | September 15, 2020 3

Platform Highlights § Balance sheet lender with $5.6 billion portfolio of floating rate loans, of which 99.4% are first mortgage loans § Originated and acquired $12.4 billion of loan commitments since Scale December 2014 § Harnesses TPG’s $79 billion AUM platform, informational advantages, and enhanced access to the capital markets Experience§ Led by proven, cycle‐tested, career portfolio lenders § $50M+ transitional, floating rate loans with business plans < 24 months Focus § Assets that have/will have consistent and predictable cash flows § Loans in major US markets with experienced, well‐capitalized sponsors Risk § Emphasis on strong credit, visible cash flow, and moderate LTV Mitigation § Combined exposure to hotels and retail properties is < 14% § $86.7 million average loan size § 65.8% weighted average LTV Current Portfolio § Weighted average interest rate of L + 3.39% § Weighted average 1MOLIBOR floors of 1.67% All data as of June 30, 2020, except AUM as of December 31, 2019. Target attractive risk‐adjusted returns through selective first mortgage loan originations TRTX Presentation | BOA Securities 2020 Virtual Global RE Conference | September 15, 2020 4Platform Highlights § Balance sheet lender with $5.6 billion portfolio of floating rate loans, of which 99.4% are first mortgage loans § Originated and acquired $12.4 billion of loan commitments since Scale December 2014 § Harnesses TPG’s $79 billion AUM platform, informational advantages, and enhanced access to the capital markets Experience§ Led by proven, cycle‐tested, career portfolio lenders § $50M+ transitional, floating rate loans with business plans < 24 months Focus § Assets that have/will have consistent and predictable cash flows § Loans in major US markets with experienced, well‐capitalized sponsors Risk § Emphasis on strong credit, visible cash flow, and moderate LTV Mitigation § Combined exposure to hotels and retail properties is < 14% § $86.7 million average loan size § 65.8% weighted average LTV Current Portfolio § Weighted average interest rate of L + 3.39% § Weighted average 1MOLIBOR floors of 1.67% All data as of June 30, 2020, except AUM as of December 31, 2019. Target attractive risk‐adjusted returns through selective first mortgage loan originations TRTX Presentation | BOA Securities 2020 Virtual Global RE Conference | September 15, 2020 4

Career Balance Sheet Lenders Drive Investment Strategy Greta Guggenheim Matt Coleman Peter Smith Bob Foley Deborah Ginsberg Chief Executive Officer President Chief Investment Officer Chief Financial Officer General Counsel 30+ years of experience 20+ years of experience 25+ years of experience 30+ years of experience 15+ years of experience Select Experience Select Experience Select Experience Select Experience Select Experience Co‐Founder and CIO Chief Operating Officer Managing Director Co‐Founder, CFO and COO Principal Ladder Capital TPG Real Estate Ladder Capital Gramercy Capital Corp. Blackstone RE Debt Strategies § Leadership team has invested through multiple business cycles § Emphasis on credit quality and principal protection over yield § Constant engagement throughout the investment process § Deep, extensive relationships with owners, borrowers and brokers § 22‐person investment team supported by infrastructure of TPG Team combines lending experience and public company C‐level experience TRTX Presentation | BOA Securities 2020 Virtual Global RE Conference | September 15, 2020 5Career Balance Sheet Lenders Drive Investment Strategy Greta Guggenheim Matt Coleman Peter Smith Bob Foley Deborah Ginsberg Chief Executive Officer President Chief Investment Officer Chief Financial Officer General Counsel 30+ years of experience 20+ years of experience 25+ years of experience 30+ years of experience 15+ years of experience Select Experience Select Experience Select Experience Select Experience Select Experience Co‐Founder and CIO Chief Operating Officer Managing Director Co‐Founder, CFO and COO Principal Ladder Capital TPG Real Estate Ladder Capital Gramercy Capital Corp. Blackstone RE Debt Strategies § Leadership team has invested through multiple business cycles § Emphasis on credit quality and principal protection over yield § Constant engagement throughout the investment process § Deep, extensive relationships with owners, borrowers and brokers § 22‐person investment team supported by infrastructure of TPG Team combines lending experience and public company C‐level experience TRTX Presentation | BOA Securities 2020 Virtual Global RE Conference | September 15, 2020 5

2Q 2020 Recap 1 1 § GAAP net income and Core Earnings of $0.52 and $0.23 per share, respectively § Net Interest Income of $44.2 million, up 2.1% over the three months ended March 31, 2020 2 § Current Expected Credit Loss (CECL) : o 2Q loan loss benefit of $10.5 million Financial o Reserve at June 30, 2020 was $58.7 million, or $0.76 per share, and 104 basis points of total loan commitments § Book value of $16.55 per share at June 30, 2020, up 3.1% over March 31, 2020 th § Dividend declared of $0.20 per common share, paid on July 24 th § Series B Preferred Dividend of $2.25M paid on June 30 § Funded $62.5 million in connection with existing loans, and borrowed $23.5 million secured by these fundings § Loan repayments and sales of $119.4 million; no loan originations during the quarter § Investment portfolio was 100% loans as of June 30, 2020 § Issued $225 million of Series B 11% cumulative preferred stock with 12 million detachable warrants to Starwood Capital Group (SCG) 2Q Activity § Sold one loan for $0.85 of par, resulting in a realized loss of $13.8 million and reduction of related CECL reserve of $24.8 million § Made voluntary deleveraging payments of $157.7 million to shield us from potential credit‐based marks for defined periods § Managed loan portfolio, borrower relationships, and liquidity to mitigate the continuing effects of the COVID‐19 pandemic and protect value for TRTX and borrowers 3 § Non‐recourse, non‐mark‐to‐market financing for 52.4% of loan financing at June 30, 2020 § Cash on hand of $196.2 million, net of $23.2 million required to satisfy our financial covenants Liquidity & § $56.1 million of undrawn borrowing capacity, with ability to issue $100 million of additional preferred equity to SCG Capitalization § Extended $677.3 million of borrowings with Morgan Stanley, Goldman Sachs, and Bank of America 1 § Total loan commitments: $5.6 billion§ Weighted average LTV : 65.8% 1 § Total loan UPB: $5.1 billion§ Weighted average risk rating : 3.1 Loan § Weighted average interest rate: LIBOR + 3.39%§ Office and multifamily are our largest sectors, at 49.9% Portfolio and 22.2%, respectively; 13.7% is comprised of hotel § Weighted average LIBOR floor: 1.67% (13.1%) and retail (0.6%) 1. See Appendix for definitions, including definitions of Core Earnings (reconciliation to GAAP net income), LTV, and Loan Risk Rating. GAAP net income defined as GAAP net loss attributable to common stockholders 2. In connection with adoption on January 1, 2020 of Accounting Standards Update 2016‐13, Financial Instruments – Credit Losses (“ASU 2016‐13”, or “CECL”) 3. Includes one non‐consolidated senior interest of $132.0 million 62Q 2020 Recap 1 1 § GAAP net income and Core Earnings of $0.52 and $0.23 per share, respectively § Net Interest Income of $44.2 million, up 2.1% over the three months ended March 31, 2020 2 § Current Expected Credit Loss (CECL) : o 2Q loan loss benefit of $10.5 million Financial o Reserve at June 30, 2020 was $58.7 million, or $0.76 per share, and 104 basis points of total loan commitments § Book value of $16.55 per share at June 30, 2020, up 3.1% over March 31, 2020 th § Dividend declared of $0.20 per common share, paid on July 24 th § Series B Preferred Dividend of $2.25M paid on June 30 § Funded $62.5 million in connection with existing loans, and borrowed $23.5 million secured by these fundings § Loan repayments and sales of $119.4 million; no loan originations during the quarter § Investment portfolio was 100% loans as of June 30, 2020 § Issued $225 million of Series B 11% cumulative preferred stock with 12 million detachable warrants to Starwood Capital Group (SCG) 2Q Activity § Sold one loan for $0.85 of par, resulting in a realized loss of $13.8 million and reduction of related CECL reserve of $24.8 million § Made voluntary deleveraging payments of $157.7 million to shield us from potential credit‐based marks for defined periods § Managed loan portfolio, borrower relationships, and liquidity to mitigate the continuing effects of the COVID‐19 pandemic and protect value for TRTX and borrowers 3 § Non‐recourse, non‐mark‐to‐market financing for 52.4% of loan financing at June 30, 2020 § Cash on hand of $196.2 million, net of $23.2 million required to satisfy our financial covenants Liquidity & § $56.1 million of undrawn borrowing capacity, with ability to issue $100 million of additional preferred equity to SCG Capitalization § Extended $677.3 million of borrowings with Morgan Stanley, Goldman Sachs, and Bank of America 1 § Total loan commitments: $5.6 billion§ Weighted average LTV : 65.8% 1 § Total loan UPB: $5.1 billion§ Weighted average risk rating : 3.1 Loan § Weighted average interest rate: LIBOR + 3.39%§ Office and multifamily are our largest sectors, at 49.9% Portfolio and 22.2%, respectively; 13.7% is comprised of hotel § Weighted average LIBOR floor: 1.67% (13.1%) and retail (0.6%) 1. See Appendix for definitions, including definitions of Core Earnings (reconciliation to GAAP net income), LTV, and Loan Risk Rating. GAAP net income defined as GAAP net loss attributable to common stockholders 2. In connection with adoption on January 1, 2020 of Accounting Standards Update 2016‐13, Financial Instruments – Credit Losses (“ASU 2016‐13”, or “CECL”) 3. Includes one non‐consolidated senior interest of $132.0 million 6

2Q 2020 Loan Portfolio As of As of 1 Loan Investment Portfolio ($ in millions) June 30, 2020 March 31, 2020 QoQ Change Total Loan Commitments $5,635.3 $5,763.7 (2.2%) Loan Repayments $119.4 $300.6 (60.3%) Unpaid Principal Balance $5,055.9 $5,112.8 (1.1%) 2 Weighted Average Loan Risk Rating 3.1 3.2 ‐ Average Loan Size (by Commitment) $86.7 $87.3 (0.7%) Weighted Average Interest Rate LIBOR + 3.39% LIBOR + 3.41% (0.6%) Weighted Average LIBOR Floor 1.67% 1.66% 0.6% Weighted Average LTV 65.8% 65.7% 0.2% Loan MSA Concentrations (Top 25 / Top 10) 84.6% / 60.1% 84.8% / 60.6% (0.2%) / (0.8%) Portfolio 3 Property Type % of Portfolio, by Commitment 3/31/2020 6/30/2020 49.9% 48.7% 23.6% 22.2% 13.1% 13.1% 10.5% 10.7% 2.0% 1.6% 1.9% 1.5% 0.6% 0.6% Office Multifamily Hotel Mixed‐Use Condominium Retail Other 1. See Appendix for definitions, including definitions of LTV and Loan Risk Rating 2. Risk rating based on amortized cost 3. Property type by commitment 72Q 2020 Loan Portfolio As of As of 1 Loan Investment Portfolio ($ in millions) June 30, 2020 March 31, 2020 QoQ Change Total Loan Commitments $5,635.3 $5,763.7 (2.2%) Loan Repayments $119.4 $300.6 (60.3%) Unpaid Principal Balance $5,055.9 $5,112.8 (1.1%) 2 Weighted Average Loan Risk Rating 3.1 3.2 ‐ Average Loan Size (by Commitment) $86.7 $87.3 (0.7%) Weighted Average Interest Rate LIBOR + 3.39% LIBOR + 3.41% (0.6%) Weighted Average LIBOR Floor 1.67% 1.66% 0.6% Weighted Average LTV 65.8% 65.7% 0.2% Loan MSA Concentrations (Top 25 / Top 10) 84.6% / 60.1% 84.8% / 60.6% (0.2%) / (0.8%) Portfolio 3 Property Type % of Portfolio, by Commitment 3/31/2020 6/30/2020 49.9% 48.7% 23.6% 22.2% 13.1% 13.1% 10.5% 10.7% 2.0% 1.6% 1.9% 1.5% 0.6% 0.6% Office Multifamily Hotel Mixed‐Use Condominium Retail Other 1. See Appendix for definitions, including definitions of LTV and Loan Risk Rating 2. Risk rating based on amortized cost 3. Property type by commitment 7
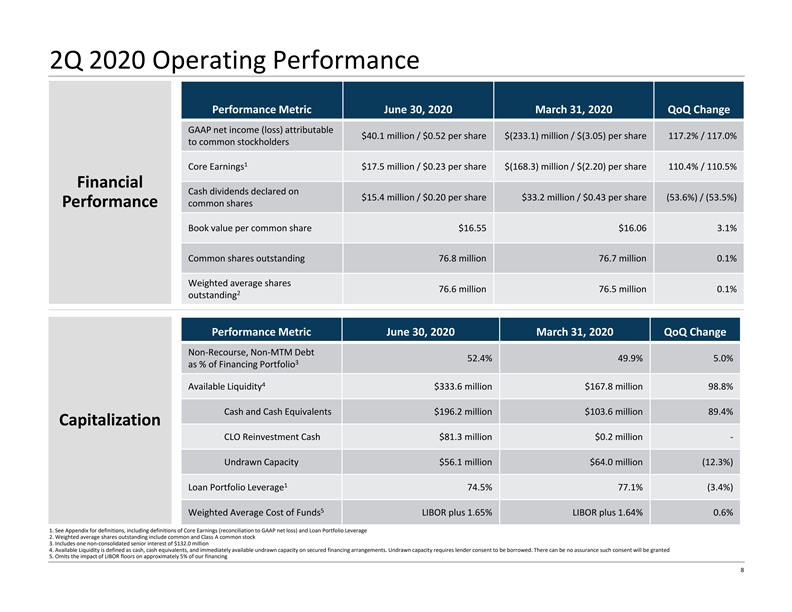
2Q 2020 Operating Performance Performance Metric June 30, 2020 March 31, 2020 QoQ Change GAAP net income (loss) attributable $40.1 million / $0.52 per share $(233.1) million / $(3.05) per share 117.2% / 117.0% to common stockholders 1 Core Earnings $17.5 million / $0.23 per share $(168.3) million / $(2.20) per share 110.4% / 110.5% Financial Cash dividends declared on $15.4 million / $0.20 per share $33.2 million / $0.43 per share (53.6%) / (53.5%) Performance common shares Book value per common share $16.55 $16.06 3.1% Common shares outstanding 76.8 million 76.7 million 0.1% Weighted average shares 76.6 million 76.5 million 0.1% 2 outstanding Performance Metric June 30, 2020 March 31, 2020 QoQ Change Non‐Recourse, Non‐MTM Debt 52.4% 49.9% 5.0% 3 as % of Financing Portfolio 4 Available Liquidity $333.6 million $167.8 million 98.8% Cash and Cash Equivalents $196.2 million $103.6 million 89.4% Capitalization CLO Reinvestment Cash $81.3 million $0.2 million ‐ Undrawn Capacity $56.1 million $64.0 million (12.3%) 1 Loan Portfolio Leverage 74.5% 77.1% (3.4%) 5 Weighted Average Cost of Funds LIBOR plus 1.65% LIBOR plus 1.64% 0.6% 1. See Appendix for definitions, including definitions of Core Earnings (reconciliation to GAAP net loss) and Loan Portfolio Leverage 2. Weighted average shares outstanding include common and Class A common stock 3. Includes one non‐consolidated senior interest of $132.0 million 4. Available Liquidity is defined as cash, cash equivalents, and immediately available undrawn capacity on secured financing arrangements. Undrawn capacity requires lender consent to be borrowed. There can be no assurance such consent will be granted 5. Omits the impact of LIBOR floors on approximately 5% of our financing 82Q 2020 Operating Performance Performance Metric June 30, 2020 March 31, 2020 QoQ Change GAAP net income (loss) attributable $40.1 million / $0.52 per share $(233.1) million / $(3.05) per share 117.2% / 117.0% to common stockholders 1 Core Earnings $17.5 million / $0.23 per share $(168.3) million / $(2.20) per share 110.4% / 110.5% Financial Cash dividends declared on $15.4 million / $0.20 per share $33.2 million / $0.43 per share (53.6%) / (53.5%) Performance common shares Book value per common share $16.55 $16.06 3.1% Common shares outstanding 76.8 million 76.7 million 0.1% Weighted average shares 76.6 million 76.5 million 0.1% 2 outstanding Performance Metric June 30, 2020 March 31, 2020 QoQ Change Non‐Recourse, Non‐MTM Debt 52.4% 49.9% 5.0% 3 as % of Financing Portfolio 4 Available Liquidity $333.6 million $167.8 million 98.8% Cash and Cash Equivalents $196.2 million $103.6 million 89.4% Capitalization CLO Reinvestment Cash $81.3 million $0.2 million ‐ Undrawn Capacity $56.1 million $64.0 million (12.3%) 1 Loan Portfolio Leverage 74.5% 77.1% (3.4%) 5 Weighted Average Cost of Funds LIBOR plus 1.65% LIBOR plus 1.64% 0.6% 1. See Appendix for definitions, including definitions of Core Earnings (reconciliation to GAAP net loss) and Loan Portfolio Leverage 2. Weighted average shares outstanding include common and Class A common stock 3. Includes one non‐consolidated senior interest of $132.0 million 4. Available Liquidity is defined as cash, cash equivalents, and immediately available undrawn capacity on secured financing arrangements. Undrawn capacity requires lender consent to be borrowed. There can be no assurance such consent will be granted 5. Omits the impact of LIBOR floors on approximately 5% of our financing 8
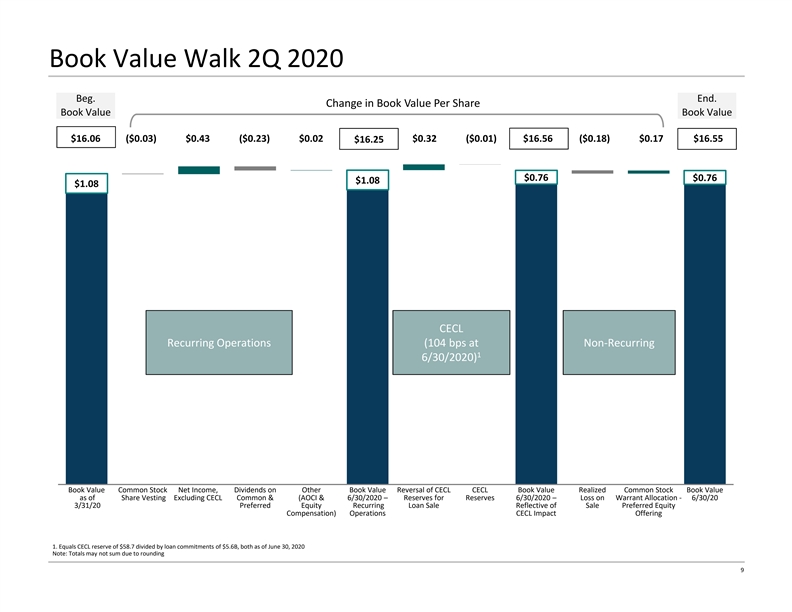
Book Value Walk 2Q 2020 Beg. End. Change in Book Value Per Share Book Value Book Value $16.06 ($0.03) $0.43 ($0.23) $0.02 $0.32 ($0.01) $16.56 ($0.18) $0.17 $16.55 $16.25 $0.76 $0.76 $1.08 $1.08 CECL Recurring Operations (104 bps at Non‐Recurring 1 6/30/2020) Book Value Common Stock Net Income, Dividends on Other Book Value Reversal of CECL CECL Book Value Realized Common Stock Book Value as of Share Vesting Excluding CECL Common & (AOCI & 6/30/2020 – Reserves for Reserves 6/30/2020 – Loss on Warrant Allocation ‐ 6/30/20 3/31/20 Preferred Equity Recurring Loan Sale Reflective of Sale Preferred Equity Compensation) Operations CECL Impact Offering 1. Equals CECL reserve of $58.7 divided by loan commitments of $5.6B, both as of June 30, 2020 Note: Totals may not sum due to rounding 9Book Value Walk 2Q 2020 Beg. End. Change in Book Value Per Share Book Value Book Value $16.06 ($0.03) $0.43 ($0.23) $0.02 $0.32 ($0.01) $16.56 ($0.18) $0.17 $16.55 $16.25 $0.76 $0.76 $1.08 $1.08 CECL Recurring Operations (104 bps at Non‐Recurring 1 6/30/2020) Book Value Common Stock Net Income, Dividends on Other Book Value Reversal of CECL CECL Book Value Realized Common Stock Book Value as of Share Vesting Excluding CECL Common & (AOCI & 6/30/2020 – Reserves for Reserves 6/30/2020 – Loss on Warrant Allocation ‐ 6/30/20 3/31/20 Preferred Equity Recurring Loan Sale Reflective of Sale Preferred Equity Compensation) Operations CECL Impact Offering 1. Equals CECL reserve of $58.7 divided by loan commitments of $5.6B, both as of June 30, 2020 Note: Totals may not sum due to rounding 9
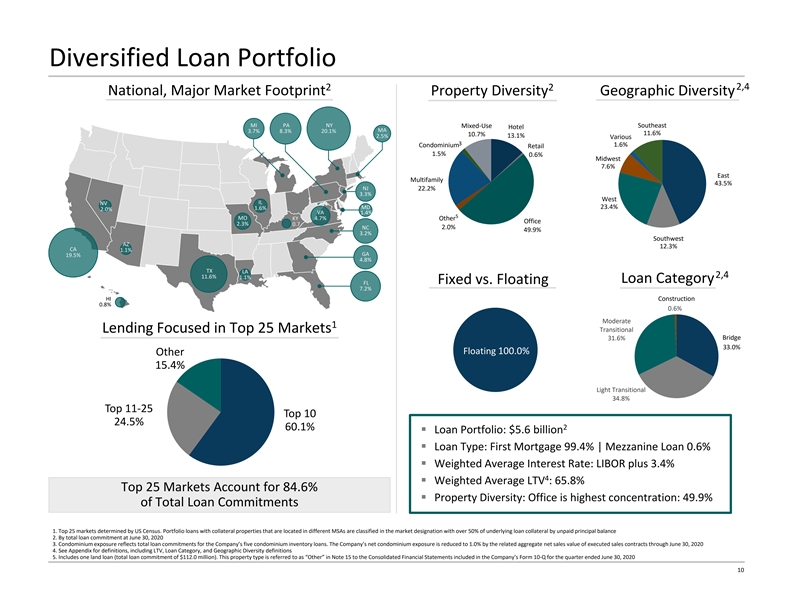
Diversified Loan Portfolio 2,4 2 2 National, Major Market Footprint Property Diversity Geographic Diversity MI PA NY Mixed‐Use Southeast Hotel MA 3.7% 8.3% 20.1% 11.6% 10.7% 2.5% 13.1% Various 3 Condominium 1.6% Retail 1.5% 0.6% Midwest 7.6% East Multifamily 43.5% NJ 22.2% 3.3% West IL NV MD 23.4% 1.6% 2.0% VA 1.4% 5 MO KY 4.7% Other Office 2.3% 0.7 2.0% NC 49.9% 3.2% Southwest AZ 12.3% CA 1.1% GA 19.5% 4.8% TX LA 11.6% 2,4 1.1% Loan Category Fixed vs. Floating FL 7.2% HI Construction 0.8% 0.6% Moderate 1 Transitional Lending Focused in Top 25 Markets 31.6% Bridge 33.0% Floating 100.0% Other 15.4% Light Transitional 34.8% Top 11‐25 Top 10 24.5% 60.1% 2 § Loan Portfolio: $5.6 billion § Loan Type: First Mortgage 99.4% | Mezzanine Loan 0.6% § Weighted Average Interest Rate: LIBOR plus 3.4% 4 § Weighted Average LTV : 65.8% Top 25 Markets Account for 84.6% § Property Diversity: Office is highest concentration: 49.9% of Total Loan Commitments 1. Top 25 markets determined by US Census. Portfolio loans with collateral properties that are located in different MSAs are classified in the market designation with over 50% of underlying loan collateral by unpaid principal balance 2. By total loan commitment at June 30, 2020 3. Condominium exposure reflects total loan commitments for the Company’s five condominium inventory loans. The Company’s net condominium exposure is reduced to 1.0% by the related aggregate net sales value of executed sales contracts through June 30, 2020 4. See Appendix for definitions, including LTV, Loan Category, and Geographic Diversity definitions 5. Includes one land loan (total loan commitment of $112.0 million). This property type is referred to as “Other” in Note 15 to the Consolidated Financial Statements included in the Company’s Form 10‐Q for the quarter ended June 30, 2020 10Diversified Loan Portfolio 2,4 2 2 National, Major Market Footprint Property Diversity Geographic Diversity MI PA NY Mixed‐Use Southeast Hotel MA 3.7% 8.3% 20.1% 11.6% 10.7% 2.5% 13.1% Various 3 Condominium 1.6% Retail 1.5% 0.6% Midwest 7.6% East Multifamily 43.5% NJ 22.2% 3.3% West IL NV MD 23.4% 1.6% 2.0% VA 1.4% 5 MO KY 4.7% Other Office 2.3% 0.7 2.0% NC 49.9% 3.2% Southwest AZ 12.3% CA 1.1% GA 19.5% 4.8% TX LA 11.6% 2,4 1.1% Loan Category Fixed vs. Floating FL 7.2% HI Construction 0.8% 0.6% Moderate 1 Transitional Lending Focused in Top 25 Markets 31.6% Bridge 33.0% Floating 100.0% Other 15.4% Light Transitional 34.8% Top 11‐25 Top 10 24.5% 60.1% 2 § Loan Portfolio: $5.6 billion § Loan Type: First Mortgage 99.4% | Mezzanine Loan 0.6% § Weighted Average Interest Rate: LIBOR plus 3.4% 4 § Weighted Average LTV : 65.8% Top 25 Markets Account for 84.6% § Property Diversity: Office is highest concentration: 49.9% of Total Loan Commitments 1. Top 25 markets determined by US Census. Portfolio loans with collateral properties that are located in different MSAs are classified in the market designation with over 50% of underlying loan collateral by unpaid principal balance 2. By total loan commitment at June 30, 2020 3. Condominium exposure reflects total loan commitments for the Company’s five condominium inventory loans. The Company’s net condominium exposure is reduced to 1.0% by the related aggregate net sales value of executed sales contracts through June 30, 2020 4. See Appendix for definitions, including LTV, Loan Category, and Geographic Diversity definitions 5. Includes one land loan (total loan commitment of $112.0 million). This property type is referred to as “Other” in Note 15 to the Consolidated Financial Statements included in the Company’s Form 10‐Q for the quarter ended June 30, 2020 10

Risk Ratings Update § Weighted average loan portfolio risk rating of 3.1 as of June 30, 2020 Risk Ratings Migration 1,2 Risk Ratings – QoQ 3.2 3.1 2.9 2.9 Risk Ratings – 6/30/2020 $ Millions Total: $5,042.1 Loan Count: 65 $3,398.5 Weighted Average Risk Rating of 3.1 June 30, Mar 31, Dec 31, Sep 30, 41 $937.0 2020 2020 2019 2019 $621.2 Beg. of Period 3.2 2.9 2.9 2.8 $85.5 $0.0 17 6 3 1234 5 Repayments/ 5.0 2.7 3.0 2.4 Sales Originations N/A 3.0 3.0 3.0 End of Period 3.1 3.2 2.9 2.9 Risk Ratings – 3/31/2020 CECL Reserve $ Millions bps of Total Loan Commitment Total: $5,096.4 Loan Count: 66 $3,534.9 144.0 Weighted Average Risk Rating 104.0 of 3.2 42 $1,032.4 $429.6 83.0 $99.5 $0.0 18 5 $58.7 34.0 3 1234 5 $19.6 1. See Appendix for a description of the Company’s Loan Risk Rating scale and definition of Loan Category 1/1/2020 3/31/2020 6/30/2020 2. By amortized cost 3. Includes a single sponsor relationship with common control of 4 loans totaling $28.1 million Note: Totals may not sum due to rounding 11Risk Ratings Update § Weighted average loan portfolio risk rating of 3.1 as of June 30, 2020 Risk Ratings Migration 1,2 Risk Ratings – QoQ 3.2 3.1 2.9 2.9 Risk Ratings – 6/30/2020 $ Millions Total: $5,042.1 Loan Count: 65 $3,398.5 Weighted Average Risk Rating of 3.1 June 30, Mar 31, Dec 31, Sep 30, 41 $937.0 2020 2020 2019 2019 $621.2 Beg. of Period 3.2 2.9 2.9 2.8 $85.5 $0.0 17 6 3 1234 5 Repayments/ 5.0 2.7 3.0 2.4 Sales Originations N/A 3.0 3.0 3.0 End of Period 3.1 3.2 2.9 2.9 Risk Ratings – 3/31/2020 CECL Reserve $ Millions bps of Total Loan Commitment Total: $5,096.4 Loan Count: 66 $3,534.9 144.0 Weighted Average Risk Rating 104.0 of 3.2 42 $1,032.4 $429.6 83.0 $99.5 $0.0 18 5 $58.7 34.0 3 1234 5 $19.6 1. See Appendix for a description of the Company’s Loan Risk Rating scale and definition of Loan Category 1/1/2020 3/31/2020 6/30/2020 2. By amortized cost 3. Includes a single sponsor relationship with common control of 4 loans totaling $28.1 million Note: Totals may not sum due to rounding 11

Financing Overview Financing Arrangements 1 § Non‐recourse, non‐mark‐to‐market financings represent 52.4% of total loan portfolio financing § Diverse set of 8 lenders providing committed secured financing arrangements § Extended $0.7 billion of borrowings with GS, BOA, and MS 4 Loan Financing² Leverage Ratio / Total TRTX Commitments Usage Available 5 5 Debt‐to‐Equity CECL Reserve Total Leverage Non‐recourse, non‐mark‐to‐market 1 loan financing of 52.4% $2,043.8M Asset‐specific $77.0M Financing 3.72x $1,856.2M $132.0M 3.61x Non‐consolidated Senior 0.23x Senior Interest $137.6M 0.23x Secured Credit 3.49x Agreement 3.00x 3.38x 2.93x 2.91x 2.91x 2.84x 2.81x 0.13x Secured Credit 0.13x 3 $1,294.7M Agreement 2.78x 2.69x $160.0M Senior Secured $62.4M Credit Agreement Collateralized Secured Loan Obligations $1,834.8 Revolving $1,718.7M Repurchase Agreements Secured Revolving Repurchase Agreements $1,072.2M $62.6 $77.0 9/30/2019 12/31/2019 3/31/2020 6/30/2020 1. Includes one non‐consolidated senior interest of $132.0 million 2. Total Financing Utilization relates only to the financing of the Company’s loan investments 3. Borrowings are 100% recourse to TPG RE Finance Trust Holdco, LLC. Facility expired on July 12, 2020 by its terms 4. Includes borrowings for loan investments 5. Excludes temporary equity; See Appendix for complete definitions, including definitions of Debt‐to‐Equity and Total Leverage Note: Totals may not sum due to rounding 12Financing Overview Financing Arrangements 1 § Non‐recourse, non‐mark‐to‐market financings represent 52.4% of total loan portfolio financing § Diverse set of 8 lenders providing committed secured financing arrangements § Extended $0.7 billion of borrowings with GS, BOA, and MS 4 Loan Financing² Leverage Ratio / Total TRTX Commitments Usage Available 5 5 Debt‐to‐Equity CECL Reserve Total Leverage Non‐recourse, non‐mark‐to‐market 1 loan financing of 52.4% $2,043.8M Asset‐specific $77.0M Financing 3.72x $1,856.2M $132.0M 3.61x Non‐consolidated Senior 0.23x Senior Interest $137.6M 0.23x Secured Credit 3.49x Agreement 3.00x 3.38x 2.93x 2.91x 2.91x 2.84x 2.81x 0.13x Secured Credit 0.13x 3 $1,294.7M Agreement 2.78x 2.69x $160.0M Senior Secured $62.4M Credit Agreement Collateralized Secured Loan Obligations $1,834.8 Revolving $1,718.7M Repurchase Agreements Secured Revolving Repurchase Agreements $1,072.2M $62.6 $77.0 9/30/2019 12/31/2019 3/31/2020 6/30/2020 1. Includes one non‐consolidated senior interest of $132.0 million 2. Total Financing Utilization relates only to the financing of the Company’s loan investments 3. Borrowings are 100% recourse to TPG RE Finance Trust Holdco, LLC. Facility expired on July 12, 2020 by its terms 4. Includes borrowings for loan investments 5. Excludes temporary equity; See Appendix for complete definitions, including definitions of Debt‐to‐Equity and Total Leverage Note: Totals may not sum due to rounding 12

Secured Financing Arrangements – Loan Investments Extended Maximum Outstanding WA Approved WA As‐Is LTV Look‐through WA Cost of 1 Maturity Capacity at 6/30/20 Advance Rate of Collateral LTV Funds Secured Repurchase 10/17/2022 $2,790.9 $1,718.7 69.2% 66.1% 45.2% 1.74% Agreements Credit Senior Secured Facility Facilities 9/29/2022 $200.0 $137.6 75.0% 73.6% 55.2% 1.75% Secured Credit 2 Agreement 7/12/2020 $160.0 $0.0 n/a n/a n/a n/a Subtotal $3,150.9 $1,856.2 69.5% 66.6% 45.8% 1.74% 3 FL‐2 6/14/2023 $795.1 $795.1 79.5% 64.3% 51.1% 1.45% Term 3 Term FL‐3 1/7/2024 $1,039.6 $1,039.6 84.5% 68.5% 57.9% 1.44% Funding Funding Asset Specific 10/9/2021 $77.0 $77.0 68.8% 42.6% 29.3% 4.15% Subtotal $1,911.8 $1,911.8 81.8% 65.5% 53.7% 1.55% Grand Total $5,062.7 $3,768.0 73.6% 65.9% 49.4% 1.65% 1. Based on As‐Is LTV. See Appendix for definition 2. Facility expired on July 12, 2020 by its terms 3. Weighted average maturity of underlying collateral assuming full extension 13Secured Financing Arrangements – Loan Investments Extended Maximum Outstanding WA Approved WA As‐Is LTV Look‐through WA Cost of 1 Maturity Capacity at 6/30/20 Advance Rate of Collateral LTV Funds Secured Repurchase 10/17/2022 $2,790.9 $1,718.7 69.2% 66.1% 45.2% 1.74% Agreements Credit Senior Secured Facility Facilities 9/29/2022 $200.0 $137.6 75.0% 73.6% 55.2% 1.75% Secured Credit 2 Agreement 7/12/2020 $160.0 $0.0 n/a n/a n/a n/a Subtotal $3,150.9 $1,856.2 69.5% 66.6% 45.8% 1.74% 3 FL‐2 6/14/2023 $795.1 $795.1 79.5% 64.3% 51.1% 1.45% Term 3 Term FL‐3 1/7/2024 $1,039.6 $1,039.6 84.5% 68.5% 57.9% 1.44% Funding Funding Asset Specific 10/9/2021 $77.0 $77.0 68.8% 42.6% 29.3% 4.15% Subtotal $1,911.8 $1,911.8 81.8% 65.5% 53.7% 1.55% Grand Total $5,062.7 $3,768.0 73.6% 65.9% 49.4% 1.65% 1. Based on As‐Is LTV. See Appendix for definition 2. Facility expired on July 12, 2020 by its terms 3. Weighted average maturity of underlying collateral assuming full extension 13
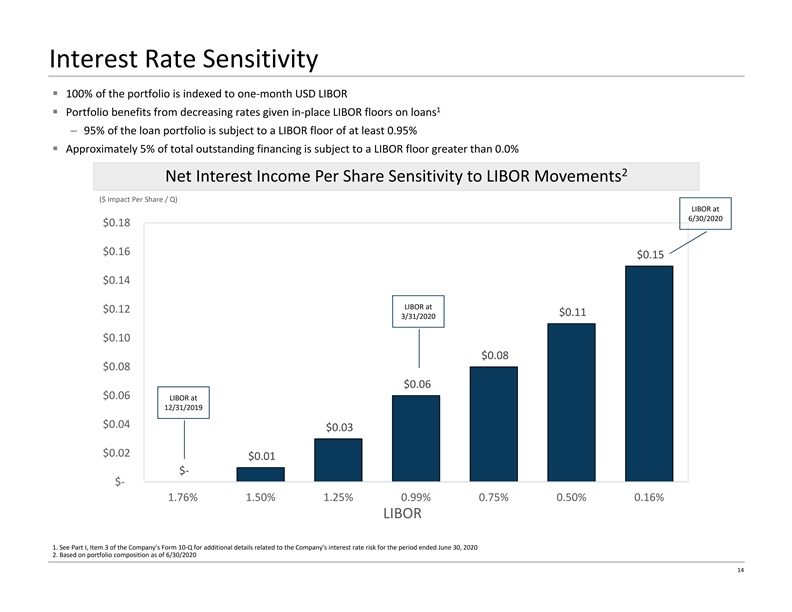
Interest Rate Sensitivity § 100% of the portfolio is indexed to one‐month USD LIBOR 1 § Portfolio benefits from decreasing rates given in‐place LIBOR floors on loans – 95% of the loan portfolio is subject to a LIBOR floor of at least 0.95% § Approximately 5% of total outstanding financing is subject to a LIBOR floor greater than 0.0% 2 Net Interest Income Per Share Sensitivity to LIBOR Movements ($ Impact Per Share / Q) LIBOR at 6/30/2020 $0.18 $0.16 $0.15 $0.14 LIBOR at $0.12 $0.11 3/31/2020 $0.10 $0.08 $0.08 $0.06 $0.06 LIBOR at 12/31/2019 $0.04 $0.03 $0.02 $0.01 $‐ $‐ 1.76% 1.50% 1.25% 0.99% 0.75% 0.50% 0.16% LIBOR 1. See Part I, Item 3 of the Company’s Form 10‐Q for additional details related to the Company’s interest rate risk for the period ended June 30, 2020 2. Based on portfolio composition as of 6/30/2020 14Interest Rate Sensitivity § 100% of the portfolio is indexed to one‐month USD LIBOR 1 § Portfolio benefits from decreasing rates given in‐place LIBOR floors on loans – 95% of the loan portfolio is subject to a LIBOR floor of at least 0.95% § Approximately 5% of total outstanding financing is subject to a LIBOR floor greater than 0.0% 2 Net Interest Income Per Share Sensitivity to LIBOR Movements ($ Impact Per Share / Q) LIBOR at 6/30/2020 $0.18 $0.16 $0.15 $0.14 LIBOR at $0.12 $0.11 3/31/2020 $0.10 $0.08 $0.08 $0.06 $0.06 LIBOR at 12/31/2019 $0.04 $0.03 $0.02 $0.01 $‐ $‐ 1.76% 1.50% 1.25% 0.99% 0.75% 0.50% 0.16% LIBOR 1. See Part I, Item 3 of the Company’s Form 10‐Q for additional details related to the Company’s interest rate risk for the period ended June 30, 2020 2. Based on portfolio composition as of 6/30/2020 14
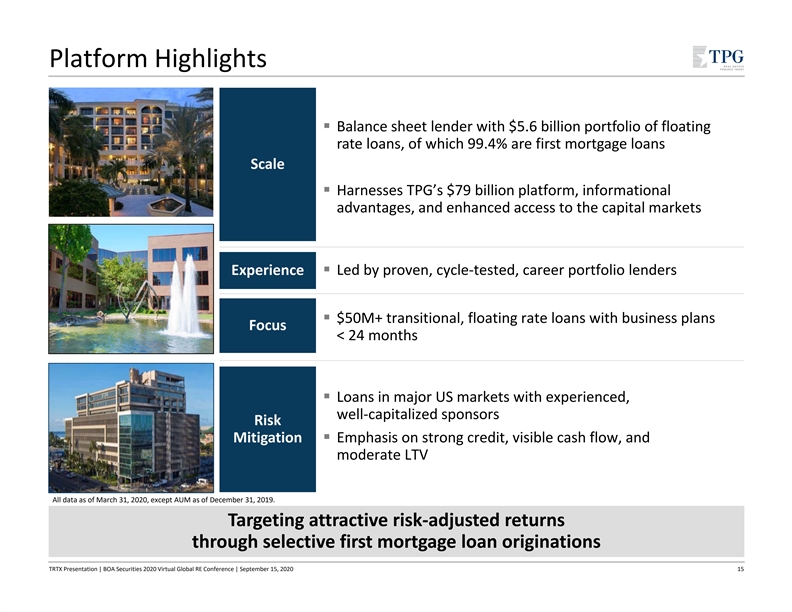
Platform Highlights § Balance sheet lender with $5.6 billion portfolio of floating rate loans, of which 99.4% are first mortgage loans Scale § Harnesses TPG’s $79 billion platform, informational advantages, and enhanced access to the capital markets Experience§ Led by proven, cycle‐tested, career portfolio lenders § $50M+ transitional, floating rate loans with business plans Focus < 24 months § Loans in major US markets with experienced, well‐capitalized sponsors Risk § Emphasis on strong credit, visible cash flow, and Mitigation moderate LTV All data as of March 31, 2020, except AUM as of December 31, 2019. Targeting attractive risk‐adjusted returns through selective first mortgage loan originations TRTX Presentation | BOA Securities 2020 Virtual Global RE Conference | September 15, 2020 15Platform Highlights § Balance sheet lender with $5.6 billion portfolio of floating rate loans, of which 99.4% are first mortgage loans Scale § Harnesses TPG’s $79 billion platform, informational advantages, and enhanced access to the capital markets Experience§ Led by proven, cycle‐tested, career portfolio lenders § $50M+ transitional, floating rate loans with business plans Focus < 24 months § Loans in major US markets with experienced, well‐capitalized sponsors Risk § Emphasis on strong credit, visible cash flow, and Mitigation moderate LTV All data as of March 31, 2020, except AUM as of December 31, 2019. Targeting attractive risk‐adjusted returns through selective first mortgage loan originations TRTX Presentation | BOA Securities 2020 Virtual Global RE Conference | September 15, 2020 15

AppendixAppendix

Portfolio Construction ($ in millions) 1 Average Loan Size Geographic Region 120.0 70.0% 100.0 60.0% 80.0 50.0% 60.0 40.0 40.0% 20.0 30.0% 0.0 FYE 2014 FYE 2015 FYE 2016 FYE 2017 FYE 2018 FYE 2019 1Q 2020 2Q 2020 20.0% Loan Portfolio Yearly Loan Originations 10.0% Portfolio‐Wide LTV 0.0% 70.0% FYE 2014 FYE 2015 FYE 2016 FYE 2017 FYE 2018 FYE 2019 1Q2020 2Q 2020 East West Midwest South Various 60.0% 3 Property Type 60.0% 50.0% FYE 2014 FYE 2015 FYE 2016 FYE 2017 FYE 2018 FYE 2019 1Q 2020 2Q 2020 50.0% LTV 2 40.0% Loan Category 60.0% 30.0% 50.0% 20.0% 40.0% 10.0% 30.0% 20.0% 0.0% 10.0% FYE 2014 FYE 2015 FYE 2016 FYE 2017 FYE 2018 FYE 2019 1Q 2020 2Q 2020 0.0% FYE 2014 FYE 2015 FYE 2016 FYE 2017 FYE 2018 FYE 2019 1Q 2020 2Q 2020 Condominium Hotel Mixed‐Use Bridge Light Transitional Office Multifamily Retail Moderate Transitional Construction 1. Loan origination amounts include loans acquired. 2. See below for definitions, including loan category definitions. 3. For clarity of presentation, excludes industrial and land, which combined is 2.0% of the portfolio Note: Amounts shown based on loan commitment per the Company’s records and related SEC filings, as applicable. During the year ended December 31, 2017, the Company refined its property type classification related to assets within its Mixed Use, Office, Retail, and Other categories. No other categories were impacted as a result of this refinement during the year ended December 31, 2017. All prior periods are presented consistent with these revisions. TRTX Presentation | BOA Securities 2020 Virtual Global RE Conference | September 15, 2020 17Portfolio Construction ($ in millions) 1 Average Loan Size Geographic Region 120.0 70.0% 100.0 60.0% 80.0 50.0% 60.0 40.0 40.0% 20.0 30.0% 0.0 FYE 2014 FYE 2015 FYE 2016 FYE 2017 FYE 2018 FYE 2019 1Q 2020 2Q 2020 20.0% Loan Portfolio Yearly Loan Originations 10.0% Portfolio‐Wide LTV 0.0% 70.0% FYE 2014 FYE 2015 FYE 2016 FYE 2017 FYE 2018 FYE 2019 1Q2020 2Q 2020 East West Midwest South Various 60.0% 3 Property Type 60.0% 50.0% FYE 2014 FYE 2015 FYE 2016 FYE 2017 FYE 2018 FYE 2019 1Q 2020 2Q 2020 50.0% LTV 2 40.0% Loan Category 60.0% 30.0% 50.0% 20.0% 40.0% 10.0% 30.0% 20.0% 0.0% 10.0% FYE 2014 FYE 2015 FYE 2016 FYE 2017 FYE 2018 FYE 2019 1Q 2020 2Q 2020 0.0% FYE 2014 FYE 2015 FYE 2016 FYE 2017 FYE 2018 FYE 2019 1Q 2020 2Q 2020 Condominium Hotel Mixed‐Use Bridge Light Transitional Office Multifamily Retail Moderate Transitional Construction 1. Loan origination amounts include loans acquired. 2. See below for definitions, including loan category definitions. 3. For clarity of presentation, excludes industrial and land, which combined is 2.0% of the portfolio Note: Amounts shown based on loan commitment per the Company’s records and related SEC filings, as applicable. During the year ended December 31, 2017, the Company refined its property type classification related to assets within its Mixed Use, Office, Retail, and Other categories. No other categories were impacted as a result of this refinement during the year ended December 31, 2017. All prior periods are presented consistent with these revisions. TRTX Presentation | BOA Securities 2020 Virtual Global RE Conference | September 15, 2020 17
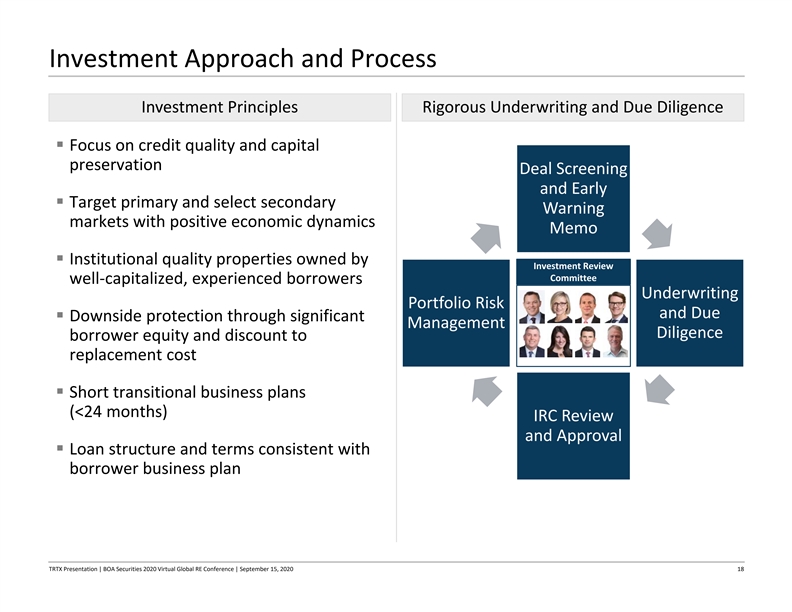
Investment Approach and Process Investment Principles Rigorous Underwriting and Due Diligence § Focus on credit quality and capital preservation Deal Screening and Early § Target primary and select secondary Warning markets with positive economic dynamics Memo § Institutional quality properties owned by Investment Review Committee well‐capitalized, experienced borrowers Underwriting Portfolio Risk and Due § Downside protection through significant Management Diligence borrower equity and discount to replacement cost § Short transitional business plans (<24 months) IRC Review and Approval § Loan structure and terms consistent with borrower business plan TRTX Presentation | BOA Securities 2020 Virtual Global RE Conference | September 15, 2020 18Investment Approach and Process Investment Principles Rigorous Underwriting and Due Diligence § Focus on credit quality and capital preservation Deal Screening and Early § Target primary and select secondary Warning markets with positive economic dynamics Memo § Institutional quality properties owned by Investment Review Committee well‐capitalized, experienced borrowers Underwriting Portfolio Risk and Due § Downside protection through significant Management Diligence borrower equity and discount to replacement cost § Short transitional business plans (<24 months) IRC Review and Approval § Loan structure and terms consistent with borrower business plan TRTX Presentation | BOA Securities 2020 Virtual Global RE Conference | September 15, 2020 18

Credit and Risk Management Credit Process Risk & Asset Management § Senior management has an average of 25 years of § Dedicated servicing and asset management team credit and underwriting experience § Maintain updated tracking and evaluation system § Bottom‐up, equity‐oriented approach to for vigilance in overall portfolio review underwriting and due diligence focused on § Direct and frequent dialogue with borrowers “all‐weather” collateral valuation, and multiple exit strategies § Rigorous oversight of portfolio with emphasis on financial, legal, and qualitative analysis § Highly structured, carefully tailored loan documents with performance hurdles and project § Internal monitoring system with quarterly milestones for downside protection risk ratings and frequent portfolio roll‐ups § Site visits and active diligence on loan collateral, § Intensive focus on the borrower to ensure TRTX plus competitive properties in local market is the first and last call § Augment in‐house underwriting and diligence § Evaluate early warning signals to anticipate with experienced third party consultants, potential performance issues engineers, and legal counsel § Implement credit‐based loan modifications due § Rigorous, multi‐stage IRC process including to COVID‐19‐induced pressures on collateral representatives from TRTX, TPG RE and TPG operating performance and loan structures § Numerous checks and balances Investment performance enhanced by rigorous credit process and integrated portfolio management TRTX Presentation | BOA Securities 2020 Virtual Global RE Conference | September 15, 2020 19Credit and Risk Management Credit Process Risk & Asset Management § Senior management has an average of 25 years of § Dedicated servicing and asset management team credit and underwriting experience § Maintain updated tracking and evaluation system § Bottom‐up, equity‐oriented approach to for vigilance in overall portfolio review underwriting and due diligence focused on § Direct and frequent dialogue with borrowers “all‐weather” collateral valuation, and multiple exit strategies § Rigorous oversight of portfolio with emphasis on financial, legal, and qualitative analysis § Highly structured, carefully tailored loan documents with performance hurdles and project § Internal monitoring system with quarterly milestones for downside protection risk ratings and frequent portfolio roll‐ups § Site visits and active diligence on loan collateral, § Intensive focus on the borrower to ensure TRTX plus competitive properties in local market is the first and last call § Augment in‐house underwriting and diligence § Evaluate early warning signals to anticipate with experienced third party consultants, potential performance issues engineers, and legal counsel § Implement credit‐based loan modifications due § Rigorous, multi‐stage IRC process including to COVID‐19‐induced pressures on collateral representatives from TRTX, TPG RE and TPG operating performance and loan structures § Numerous checks and balances Investment performance enhanced by rigorous credit process and integrated portfolio management TRTX Presentation | BOA Securities 2020 Virtual Global RE Conference | September 15, 2020 19

Strategic Capital Raise 1 Key Terms Rationale and Benefits to TRTX § Materially increased capital base and liquidity Investor P.E. Holder, LLC, an affiliate of Starwood Capital Group Global II, L.P. § Recruited as strategic investor Starwood Capital Group (“SCG”), a Series B Cumulative Redeemable Preferred Stock (“Series B Preferred Stock”, Security or “Preferred Stock”); par value per share of $0.001; liquidation preference per leading global investor in CRE with substantial experience in CRE credit share of $25.00 § Enabled voluntary deleveraging payments made on May 29 to 7 11.0% payable quarter (actual/365) on March 31, June 30, September 30 of TRTX’s secured credit facility lenders in exchange for margin Dividend and December 31. Up to 2% may be accrued and paid in additional preferred shares call holidays Series B Preferred Stock % Warrants % § Option through December 2020 to issue up to an additional $100 Initial Issuance $225.0 70% 12.0 80% million for general corporate purposes Commitment Second Issuance $50.0 15% 1.5 10% Amount Third Issuance $50.0 15% 1.5 10% Total $325.0 100% 15.0 100% Issuance Disclosure and Economics Through December 31, 2020 2 Period § Series B Preferred Stock: As follows: – Presented as temporary equity on face of balance sheet between – Prior to the second anniversary, 105% of the Preferred Stock and accrued dividends, if any, plus a make‐whole; liabilities and stockholders’ equity Call– During year 3, at 105% of the Preferred Stock and accrued dividends, if – Treated the same as common equity for purposes of calculating Provision any financial covenants of TRTX and TRTX Holdco – During year 4, at 102.5% of the Preferred Stock and accrued dividends, if any – Earns an 11% dividend that qualifies for the Dividends – Thereafter, at par and accrued dividends, if any Paid Deduction Put After the fourth anniversary, and upon certain change of control events – Reduces earnings available for distribution to common Provision shareholders by $24.75 million annually, until redeemed ($35.75 Up to 15 million detachable warrants, each convertible into one common share million if a total of $325 million of Series B Preferred Stock is Warrants of TRTX, issued in accordance with table in “Commitment Amount” above. issued) Warrant $7.50, subject to certain anti‐dilution adjustments Strike Price Warrant 5 years Term Board Seat: 1 of 7 board seats until such time as Investor holds warrants, or common shares in TRTX obtained via warrant conversion, representing less than 25% of the original amount of warrants. Todd Schuster was nominated Board Rights by Starwood Capital Group and appointed to the TRTX board in early July 2020. A second board appointment is triggered by Failure Events, including failure to pay dividend currently for two consecutive quarters, or failure to redeem the Series B Preferred Stock upon exercise of put option. 1. Additional information is accessible in TRTX’s Form 8‐K filed on May 29, 2020, and our latest Form 10‐Q filed on July 29, 2020. 2. The issuance, sale and delivery of the securities described in the rows entitled “Second Issuance” and “Third Issuance” are subject to options held by TRTX. These options expire on December 31, 2020. TRTX Presentation | BOA Securities 2020 Virtual Global RE Conference | September 15, 2020 20Strategic Capital Raise 1 Key Terms Rationale and Benefits to TRTX § Materially increased capital base and liquidity Investor P.E. Holder, LLC, an affiliate of Starwood Capital Group Global II, L.P. § Recruited as strategic investor Starwood Capital Group (“SCG”), a Series B Cumulative Redeemable Preferred Stock (“Series B Preferred Stock”, Security or “Preferred Stock”); par value per share of $0.001; liquidation preference per leading global investor in CRE with substantial experience in CRE credit share of $25.00 § Enabled voluntary deleveraging payments made on May 29 to 7 11.0% payable quarter (actual/365) on March 31, June 30, September 30 of TRTX’s secured credit facility lenders in exchange for margin Dividend and December 31. Up to 2% may be accrued and paid in additional preferred shares call holidays Series B Preferred Stock % Warrants % § Option through December 2020 to issue up to an additional $100 Initial Issuance $225.0 70% 12.0 80% million for general corporate purposes Commitment Second Issuance $50.0 15% 1.5 10% Amount Third Issuance $50.0 15% 1.5 10% Total $325.0 100% 15.0 100% Issuance Disclosure and Economics Through December 31, 2020 2 Period § Series B Preferred Stock: As follows: – Presented as temporary equity on face of balance sheet between – Prior to the second anniversary, 105% of the Preferred Stock and accrued dividends, if any, plus a make‐whole; liabilities and stockholders’ equity Call– During year 3, at 105% of the Preferred Stock and accrued dividends, if – Treated the same as common equity for purposes of calculating Provision any financial covenants of TRTX and TRTX Holdco – During year 4, at 102.5% of the Preferred Stock and accrued dividends, if any – Earns an 11% dividend that qualifies for the Dividends – Thereafter, at par and accrued dividends, if any Paid Deduction Put After the fourth anniversary, and upon certain change of control events – Reduces earnings available for distribution to common Provision shareholders by $24.75 million annually, until redeemed ($35.75 Up to 15 million detachable warrants, each convertible into one common share million if a total of $325 million of Series B Preferred Stock is Warrants of TRTX, issued in accordance with table in “Commitment Amount” above. issued) Warrant $7.50, subject to certain anti‐dilution adjustments Strike Price Warrant 5 years Term Board Seat: 1 of 7 board seats until such time as Investor holds warrants, or common shares in TRTX obtained via warrant conversion, representing less than 25% of the original amount of warrants. Todd Schuster was nominated Board Rights by Starwood Capital Group and appointed to the TRTX board in early July 2020. A second board appointment is triggered by Failure Events, including failure to pay dividend currently for two consecutive quarters, or failure to redeem the Series B Preferred Stock upon exercise of put option. 1. Additional information is accessible in TRTX’s Form 8‐K filed on May 29, 2020, and our latest Form 10‐Q filed on July 29, 2020. 2. The issuance, sale and delivery of the securities described in the rows entitled “Second Issuance” and “Third Issuance” are subject to options held by TRTX. These options expire on December 31, 2020. TRTX Presentation | BOA Securities 2020 Virtual Global RE Conference | September 15, 2020 20
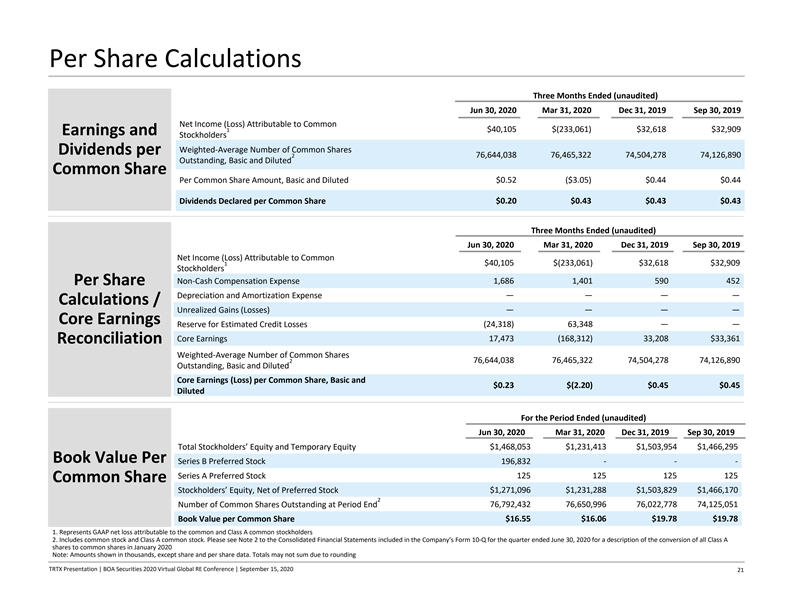
Per Share Calculations Three Months Ended (unaudited) Jun 30, 2020 Mar 31, 2020 Dec 31, 2019 Sep 30, 2019 Net Income (Loss) Attributable to Common 1 $40,105 $(233,061) $32,618 $32,909 Earnings and Stockholders Weighted‐Average Number of Common Shares Dividends per 2 76,644,038 76,465,322 74,504,278 74,126,890 Outstanding, Basic and Diluted Common Share Per Common Share Amount, Basic and Diluted $0.52 ($3.05) $0.44 $0.44 Dividends Declared per Common Share $0.20 $0.43 $0.43 $0.43 Three Months Ended (unaudited) Jun 30, 2020 Mar 31, 2020 Dec 31, 2019 Sep 30, 2019 Net Income (Loss) Attributable to Common 1 $40,105 $(233,061) $32,618 $32,909 Stockholders Non‐Cash Compensation Expense 1,686 1,401 590 452 Per Share Depreciation and Amortization Expense —— — — Calculations / Unrealized Gains (Losses) —— — — Core Earnings Reserve for Estimated Credit Losses (24,318) 63,348 — — 17,473 (168,312) 33,208 $33,361 Core Earnings Reconciliation Weighted‐Average Number of Common Shares 2 76,644,038 76,465,322 74,504,278 74,126,890 Outstanding, Basic and Diluted Core Earnings (Loss) per Common Share, Basic and $0.23 $(2.20) $0.45 $0.45 Diluted For the Period Ended (unaudited) Jun 30, 2020 Mar 31, 2020 Dec 31, 2019 Sep 30, 2019 Total Stockholders’ Equity and Temporary Equity $1,468,053 $1,231,413 $1,503,954 $1,466,295 Book Value Per Series B Preferred Stock 196,832 ‐ ‐ ‐ 125 125 125 125 Series A Preferred Stock Common Share Stockholders’ Equity, Net of Preferred Stock $1,271,096 $1,231,288 $1,503,829 $1,466,170 2 Number of Common Shares Outstanding at Period End 76,792,432 76,650,996 76,022,778 74,125,051 Book Value per Common Share $16.55 $16.06 $19.78 $19.78 1. Represents GAAP net loss attributable to the common and Class A common stockholders 2. Includes common stock and Class A common stock. Please see Note 2 to the Consolidated Financial Statements included in the Company’s Form 10‐Q for the quarter ended June 30, 2020 for a description of the conversion of all Class A shares to common shares in January 2020 Note: Amounts shown in thousands, except share and per share data. Totals may not sum due to rounding TRTX Presentation | BOA Securities 2020 Virtual Global RE Conference | September 15, 2020 21Per Share Calculations Three Months Ended (unaudited) Jun 30, 2020 Mar 31, 2020 Dec 31, 2019 Sep 30, 2019 Net Income (Loss) Attributable to Common 1 $40,105 $(233,061) $32,618 $32,909 Earnings and Stockholders Weighted‐Average Number of Common Shares Dividends per 2 76,644,038 76,465,322 74,504,278 74,126,890 Outstanding, Basic and Diluted Common Share Per Common Share Amount, Basic and Diluted $0.52 ($3.05) $0.44 $0.44 Dividends Declared per Common Share $0.20 $0.43 $0.43 $0.43 Three Months Ended (unaudited) Jun 30, 2020 Mar 31, 2020 Dec 31, 2019 Sep 30, 2019 Net Income (Loss) Attributable to Common 1 $40,105 $(233,061) $32,618 $32,909 Stockholders Non‐Cash Compensation Expense 1,686 1,401 590 452 Per Share Depreciation and Amortization Expense —— — — Calculations / Unrealized Gains (Losses) —— — — Core Earnings Reserve for Estimated Credit Losses (24,318) 63,348 — — 17,473 (168,312) 33,208 $33,361 Core Earnings Reconciliation Weighted‐Average Number of Common Shares 2 76,644,038 76,465,322 74,504,278 74,126,890 Outstanding, Basic and Diluted Core Earnings (Loss) per Common Share, Basic and $0.23 $(2.20) $0.45 $0.45 Diluted For the Period Ended (unaudited) Jun 30, 2020 Mar 31, 2020 Dec 31, 2019 Sep 30, 2019 Total Stockholders’ Equity and Temporary Equity $1,468,053 $1,231,413 $1,503,954 $1,466,295 Book Value Per Series B Preferred Stock 196,832 ‐ ‐ ‐ 125 125 125 125 Series A Preferred Stock Common Share Stockholders’ Equity, Net of Preferred Stock $1,271,096 $1,231,288 $1,503,829 $1,466,170 2 Number of Common Shares Outstanding at Period End 76,792,432 76,650,996 76,022,778 74,125,051 Book Value per Common Share $16.55 $16.06 $19.78 $19.78 1. Represents GAAP net loss attributable to the common and Class A common stockholders 2. Includes common stock and Class A common stock. Please see Note 2 to the Consolidated Financial Statements included in the Company’s Form 10‐Q for the quarter ended June 30, 2020 for a description of the conversion of all Class A shares to common shares in January 2020 Note: Amounts shown in thousands, except share and per share data. Totals may not sum due to rounding TRTX Presentation | BOA Securities 2020 Virtual Global RE Conference | September 15, 2020 21
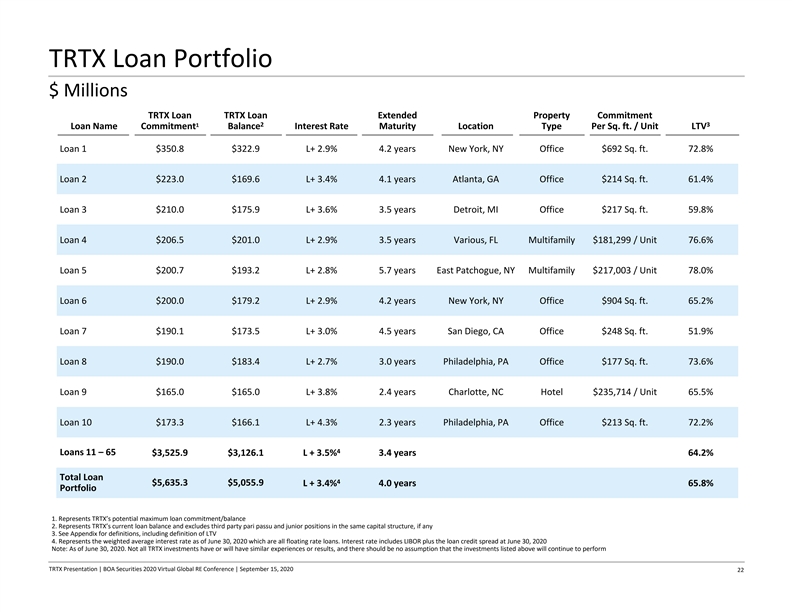
TRTX Loan Portfolio $ Millions TRTX Loan TRTX Loan Extended Property Commitment 1 2 3 Loan Name Commitment Balance Interest Rate Maturity Location Type Per Sq. ft. / Unit LTV Loan 1 $350.8 $322.9 L+ 2.9% 4.2 years New York, NY Office $692 Sq. ft. 72.8% Loan 2 $223.0 $169.6 L+ 3.4% 4.1 years Atlanta, GA Office $214 Sq. ft. 61.4% Loan 3 $210.0 $175.9 L+ 3.6% 3.5 years Detroit, MI Office $217 Sq. ft. 59.8% Loan 4 $206.5 $201.0 L+ 2.9% 3.5 years Various, FL Multifamily $181,299 / Unit 76.6% Loan 5 $200.7 $193.2 L+ 2.8% 5.7 years East Patchogue, NY Multifamily $217,003 / Unit 78.0% Loan 6 $200.0 $179.2 L+ 2.9% 4.2 years New York, NY Office $904 Sq. ft. 65.2% Loan 7 $190.1 $173.5 L+ 3.0% 4.5 years San Diego, CA Office $248 Sq. ft. 51.9% Loan 8 $190.0 $183.4 L+ 2.7% 3.0 years Philadelphia, PA Office $177 Sq. ft. 73.6% Loan 9 $165.0 $165.0 L+ 3.8% 2.4 years Charlotte, NC Hotel $235,714 / Unit 65.5% Loan 10 $173.3 $166.1 L+ 4.3% 2.3 years Philadelphia, PA Office $213 Sq. ft. 72.2% 4 Loans 11 – 65 $3,525.9 $3,126.1 L + 3.5% 3.4 years 64.2% Total Loan 4 $5,635.3 $5,055.9 L + 3.4% 4.0 years 65.8% Portfolio 1. Represents TRTX’s potential maximum loan commitment/balance 2. Represents TRTX’s current loan balance and excludes third party pari passu and junior positions in the same capital structure, if any 3. See Appendix for definitions, including definition of LTV 4. Represents the weighted average interest rate as of June 30, 2020 which are all floating rate loans. Interest rate includes LIBOR plus the loan credit spread at June 30, 2020 Note: As of June 30, 2020. Not all TRTX investments have or will have similar experiences or results, and there should be no assumption that the investments listed above will continue to perform TRTX Presentation | BOA Securities 2020 Virtual Global RE Conference | September 15, 2020 22TRTX Loan Portfolio $ Millions TRTX Loan TRTX Loan Extended Property Commitment 1 2 3 Loan Name Commitment Balance Interest Rate Maturity Location Type Per Sq. ft. / Unit LTV Loan 1 $350.8 $322.9 L+ 2.9% 4.2 years New York, NY Office $692 Sq. ft. 72.8% Loan 2 $223.0 $169.6 L+ 3.4% 4.1 years Atlanta, GA Office $214 Sq. ft. 61.4% Loan 3 $210.0 $175.9 L+ 3.6% 3.5 years Detroit, MI Office $217 Sq. ft. 59.8% Loan 4 $206.5 $201.0 L+ 2.9% 3.5 years Various, FL Multifamily $181,299 / Unit 76.6% Loan 5 $200.7 $193.2 L+ 2.8% 5.7 years East Patchogue, NY Multifamily $217,003 / Unit 78.0% Loan 6 $200.0 $179.2 L+ 2.9% 4.2 years New York, NY Office $904 Sq. ft. 65.2% Loan 7 $190.1 $173.5 L+ 3.0% 4.5 years San Diego, CA Office $248 Sq. ft. 51.9% Loan 8 $190.0 $183.4 L+ 2.7% 3.0 years Philadelphia, PA Office $177 Sq. ft. 73.6% Loan 9 $165.0 $165.0 L+ 3.8% 2.4 years Charlotte, NC Hotel $235,714 / Unit 65.5% Loan 10 $173.3 $166.1 L+ 4.3% 2.3 years Philadelphia, PA Office $213 Sq. ft. 72.2% 4 Loans 11 – 65 $3,525.9 $3,126.1 L + 3.5% 3.4 years 64.2% Total Loan 4 $5,635.3 $5,055.9 L + 3.4% 4.0 years 65.8% Portfolio 1. Represents TRTX’s potential maximum loan commitment/balance 2. Represents TRTX’s current loan balance and excludes third party pari passu and junior positions in the same capital structure, if any 3. See Appendix for definitions, including definition of LTV 4. Represents the weighted average interest rate as of June 30, 2020 which are all floating rate loans. Interest rate includes LIBOR plus the loan credit spread at June 30, 2020 Note: As of June 30, 2020. Not all TRTX investments have or will have similar experiences or results, and there should be no assumption that the investments listed above will continue to perform TRTX Presentation | BOA Securities 2020 Virtual Global RE Conference | September 15, 2020 22
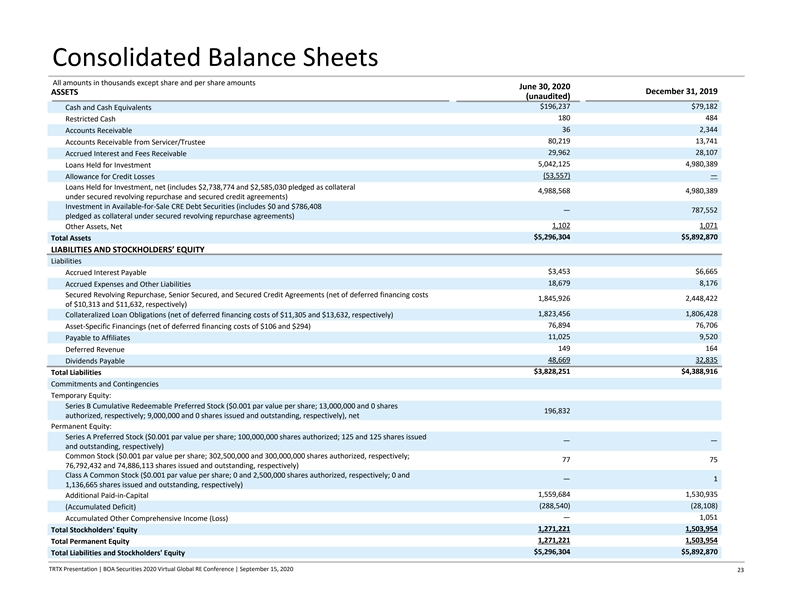
Consolidated Balance Sheets All amounts in thousands except share and per share amounts June 30, 2020 December 31, 2019 ASSETS (unaudited) $196,237 $79,182 Cash and Cash Equivalents 180 484 Restricted Cash 36 2,344 Accounts Receivable 80,219 13,741 Accounts Receivable from Servicer/Trustee 29,962 28,107 Accrued Interest and Fees Receivable 5,042,125 4,980,389 Loans Held for Investment (53,557) — Allowance for Credit Losses Loans Held for Investment, net (includes $2,738,774 and $2,585,030 pledged as collateral 4,988,568 4,980,389 under secured revolving repurchase and secured credit agreements) Investment in Available‐for‐Sale CRE Debt Securities (includes $0 and $786,408 — 787,552 pledged as collateral under secured revolving repurchase agreements) 1,102 1,071 Other Assets, Net $5,296,304 $5,892,870 Total Assets LIABILITIES AND STOCKHOLDERS’ EQUITY Liabilities $3,453 $6,665 Accrued Interest Payable 18,679 8,176 Accrued Expenses and Other Liabilities Secured Revolving Repurchase, Senior Secured, and Secured Credit Agreements (net of deferred financing costs 1,845,926 2,448,422 of $10,313 and $11,632, respectively) 1,823,456 1,806,428 Collateralized Loan Obligations (net of deferred financing costs of $11,305 and $13,632, respectively) 76,894 76,706 Asset‐Specific Financings (net of deferred financing costs of $106 and $294) 11,025 9,520 Payable to Affiliates 149 164 Deferred Revenue 48,669 32,835 Dividends Payable $3,828,251 $4,388,916 Total Liabilities Commitments and Contingencies Temporary Equity: Series B Cumulative Redeemable Preferred Stock ($0.001 par value per share; 13,000,000 and 0 shares 196,832 authorized, respectively; 9,000,000 and 0 shares issued and outstanding, respectively), net Permanent Equity: Series A Preferred Stock ($0.001 par value per share; 100,000,000 shares authorized; 125 and 125 shares issued —— and outstanding, respectively) Common Stock ($0.001 par value per share; 302,500,000 and 300,000,000 shares authorized, respectively; 77 75 76,792,432 and 74,886,113 shares issued and outstanding, respectively) Class A Common Stock ($0.001 par value per share; 0 and 2,500,000 shares authorized, respectively; 0 and —1 1,136,665 shares issued and outstanding, respectively) 1,559,684 1,530,935 Additional Paid‐in‐Capital (288,540) (28,108) (Accumulated Deficit) — 1,051 Accumulated Other Comprehensive Income (Loss) 1,271,221 1,503,954 Total Stockholders' Equity 1,271,221 1,503,954 Total Permanent Equity $5,296,304 $5,892,870 Total Liabilities and Stockholders' Equity TRTX Presentation | BOA Securities 2020 Virtual Global RE Conference | September 15, 2020 23Consolidated Balance Sheets All amounts in thousands except share and per share amounts June 30, 2020 December 31, 2019 ASSETS (unaudited) $196,237 $79,182 Cash and Cash Equivalents 180 484 Restricted Cash 36 2,344 Accounts Receivable 80,219 13,741 Accounts Receivable from Servicer/Trustee 29,962 28,107 Accrued Interest and Fees Receivable 5,042,125 4,980,389 Loans Held for Investment (53,557) — Allowance for Credit Losses Loans Held for Investment, net (includes $2,738,774 and $2,585,030 pledged as collateral 4,988,568 4,980,389 under secured revolving repurchase and secured credit agreements) Investment in Available‐for‐Sale CRE Debt Securities (includes $0 and $786,408 — 787,552 pledged as collateral under secured revolving repurchase agreements) 1,102 1,071 Other Assets, Net $5,296,304 $5,892,870 Total Assets LIABILITIES AND STOCKHOLDERS’ EQUITY Liabilities $3,453 $6,665 Accrued Interest Payable 18,679 8,176 Accrued Expenses and Other Liabilities Secured Revolving Repurchase, Senior Secured, and Secured Credit Agreements (net of deferred financing costs 1,845,926 2,448,422 of $10,313 and $11,632, respectively) 1,823,456 1,806,428 Collateralized Loan Obligations (net of deferred financing costs of $11,305 and $13,632, respectively) 76,894 76,706 Asset‐Specific Financings (net of deferred financing costs of $106 and $294) 11,025 9,520 Payable to Affiliates 149 164 Deferred Revenue 48,669 32,835 Dividends Payable $3,828,251 $4,388,916 Total Liabilities Commitments and Contingencies Temporary Equity: Series B Cumulative Redeemable Preferred Stock ($0.001 par value per share; 13,000,000 and 0 shares 196,832 authorized, respectively; 9,000,000 and 0 shares issued and outstanding, respectively), net Permanent Equity: Series A Preferred Stock ($0.001 par value per share; 100,000,000 shares authorized; 125 and 125 shares issued —— and outstanding, respectively) Common Stock ($0.001 par value per share; 302,500,000 and 300,000,000 shares authorized, respectively; 77 75 76,792,432 and 74,886,113 shares issued and outstanding, respectively) Class A Common Stock ($0.001 par value per share; 0 and 2,500,000 shares authorized, respectively; 0 and —1 1,136,665 shares issued and outstanding, respectively) 1,559,684 1,530,935 Additional Paid‐in‐Capital (288,540) (28,108) (Accumulated Deficit) — 1,051 Accumulated Other Comprehensive Income (Loss) 1,271,221 1,503,954 Total Stockholders' Equity 1,271,221 1,503,954 Total Permanent Equity $5,296,304 $5,892,870 Total Liabilities and Stockholders' Equity TRTX Presentation | BOA Securities 2020 Virtual Global RE Conference | September 15, 2020 23

Consolidated Statements of Income and Comprehensive Income All amounts in thousands except share and per share amounts (three months ended June 30 is unaudited) Three Months Ended June 30, INTEREST INCOME 2020 2019 Interest Income $70,051 $88,254 Interest Expense (25,865) (46,426) Net Interest Income 44,186 41,828 OTHER REVENUE Other Income, net 119 412 Total Other Revenue 119 412 OTHER EXPENSES Professional Fees 4,036 593 General and Administrative 860 1,041 Stock Compensation Expense 1,686 663 Servicing and Asset Management Fees 261 431 Management Fee 5,115 5,323 Incentive Management Fee — 2,048 Total Other Expenses 11,958 10,069 Securities Impairments 96 — Credit Loss Expense 10,546 — 42,989 32,171 Income (Loss) Before Income Taxes Income Tax Expense, net (61) (202) Net Income (Loss) $42,928 $31,969 Series A Preferred Stock Dividends (5) (4) Series B Cumulative Redeemable Preferred Stock Dividends (2,250) — Net Income (Loss) Attributable to TPG RE Finance Trust, Inc. $40,673 $31,965 Basic Earnings (Loss) per Common Share $0.52 $0.43 $0.52 $0.43 Diluted Earnings (Loss) per Common Share Weighted Average Number of Common Shares Outstanding Basic: 76,644,038 73,963,337 Diluted: 76,644,038 73,963,337 Dividends Declared per Common Share $0.20 $0.20 OTHER COMPREHENSIVE INCOME Net Income (Loss) $42,928 $31,969 Unrealized (Loss) Gain on Available‐for‐Sale Securities (CRE Debt Securities) (77) 3,112 Comprehensive Net Income (Loss) $42,851 $35,081 TRTX Presentation | BOA Securities 2020 Virtual Global RE Conference | September 15, 2020 24Consolidated Statements of Income and Comprehensive Income All amounts in thousands except share and per share amounts (three months ended June 30 is unaudited) Three Months Ended June 30, INTEREST INCOME 2020 2019 Interest Income $70,051 $88,254 Interest Expense (25,865) (46,426) Net Interest Income 44,186 41,828 OTHER REVENUE Other Income, net 119 412 Total Other Revenue 119 412 OTHER EXPENSES Professional Fees 4,036 593 General and Administrative 860 1,041 Stock Compensation Expense 1,686 663 Servicing and Asset Management Fees 261 431 Management Fee 5,115 5,323 Incentive Management Fee — 2,048 Total Other Expenses 11,958 10,069 Securities Impairments 96 — Credit Loss Expense 10,546 — 42,989 32,171 Income (Loss) Before Income Taxes Income Tax Expense, net (61) (202) Net Income (Loss) $42,928 $31,969 Series A Preferred Stock Dividends (5) (4) Series B Cumulative Redeemable Preferred Stock Dividends (2,250) — Net Income (Loss) Attributable to TPG RE Finance Trust, Inc. $40,673 $31,965 Basic Earnings (Loss) per Common Share $0.52 $0.43 $0.52 $0.43 Diluted Earnings (Loss) per Common Share Weighted Average Number of Common Shares Outstanding Basic: 76,644,038 73,963,337 Diluted: 76,644,038 73,963,337 Dividends Declared per Common Share $0.20 $0.20 OTHER COMPREHENSIVE INCOME Net Income (Loss) $42,928 $31,969 Unrealized (Loss) Gain on Available‐for‐Sale Securities (CRE Debt Securities) (77) 3,112 Comprehensive Net Income (Loss) $42,851 $35,081 TRTX Presentation | BOA Securities 2020 Virtual Global RE Conference | September 15, 2020 24

Consolidated Statements of Cash Flows All amounts in thousands Six Months Ended (Unaudited) Cash Flows from Operating Activities: June 30, 2020 June 30, 2019 Net Income (Loss) $(189,862) $60,381 Adjustment to Reconcile Net Income to Net Cash Provided by Operating Activities: (5,627) (7,898) Amortization and Accretion of Premiums, Discounts and Loan Origination Fees, net 6,539 9,393 Amortization of Deferred Financing Costs (550) ‐ Increase in Capitalized Accrued Interest 3,087 1,514 Stock Compensation Expense 217,170 ‐ Loss on Sales of Loans Held for Investment and CRE Debt Securities, net 39,029 ‐ Allowance for Credit Loss Expense Cash Flows Due to Changes in Operating Assets and Liabilities: 2,308 (4) Accounts Receivable (1,078) (12,224) Accrued Interest Receivable Accrued Expenses and Other Liabilities 1,414 (3,525) Accrued Interest Payable (3,212) 3,458 Payable to Affiliates 1,505 1,653 Deferred Fee Income (15) (72) (31) 315 Other Assets $70,677 $52,991 Net Cash Provided by Operating Activities Cash Flows from Investing Activities: (351,650) (1,133,817) Origination of Loans Held for Investment (123,692) (117,131) Advances on Loans Held for Investment 333,715 608,338 Principal Repayments of Loans Held for Investment 5,295 ‐ Proceeds from Sales of Loans Held for Investment (168,888) (632,267) Purchase of Available‐for‐Sale CRE Debt Securities 766,437 6,641 Sale and Principal Repayments of Available‐for‐Sale CRE Debt Securities $461,217 ($1,268,236) Net Cash (Used in) Investing Activities Cash Flows from Financing Activities: ‐ (311,672) Payments on Collateralized Loan Obligations (606,265) (807,471) Payments on Secured Financing Agreements – Loan Investments 695,250 1,746,297 Proceeds from Secured Financing Agreements – Loan Investments Payments on Secured Financing Agreements – CRE Debt Securities (824,920) (4,958) Proceeds from Secured Financing Agreements – CRE Debt Securities 132,122 550,850 Payment of Deferred Financing Costs (1,769) (3,817) Payments to Repurchase Common Stock ‐ (42) 12,895 136,532 Proceeds from Issuance of Common Stock ‐ 125 Proceeds from Issuance of Series A Preferred Stock 210,598 ‐ Proceeds from Issuance of Series B Cumulative Redeemable Preferred Stock 14,402 ‐ Proceeds from Issuance of Warrants to Purchase Common Stock (32,551) (59,649) Dividends Paid on Common Stock (284) (983) Dividends Paid on Class A Common Stock (6) (7) Dividends Paid on Series A Preferred Stock (2,250) ‐ Dividends Paid on Series B Cumulative Redeemable Preferred Stock (12,365) (188) Payment of Equity Issuance and Equity Distribution Agreement Transaction Costs ($415,143) $1,245,017 Net Cash Provided by Financing Activities 116,751 29,772 Net Change in Cash, Cash Equivalents, and Restricted Cash Cash, Cash Equivalents, and Restricted Cash at Beginning of Period 79,666 40,720 Cash, Cash Equivalents, and Restricted Cash at End of Period $196,417 $70,492 Supplemental Disclosure of Cash Flow Information: Interest Paid $60,995 $72,942 5 368 Taxes Paid Supplemental Disclosure of Non‐Cash Investing and Financing Activities: $80,205 $208,697 Principal Repayments of Loans Held for Investment Held by Servicer/Trustee, net ‐ 960 Sales and Principal Repayments of Available‐for‐Sale CRE Debt Securities Held by Servicer/Trustee, net ‐ 103 Proceeds from Secured Financing Agreements Held by Trustee 48,669 31,985 Dividends Declared, not paid 937 1,148 Change in Accrued Deferred Financing Costs (1,051) 3,218 Unrealized Gain (Loss) on Available‐for‐Sale CRE Debt Securities 3,035 309 Accrued Equity Issuance and Transaction Costs TRTX Presentation | BOA Securities 2020 Virtual Global RE Conference | September 15, 2020Consolidated Statements of Cash Flows All amounts in thousands Six Months Ended (Unaudited) Cash Flows from Operating Activities: June 30, 2020 June 30, 2019 Net Income (Loss) $(189,862) $60,381 Adjustment to Reconcile Net Income to Net Cash Provided by Operating Activities: (5,627) (7,898) Amortization and Accretion of Premiums, Discounts and Loan Origination Fees, net 6,539 9,393 Amortization of Deferred Financing Costs (550) ‐ Increase in Capitalized Accrued Interest 3,087 1,514 Stock Compensation Expense 217,170 ‐ Loss on Sales of Loans Held for Investment and CRE Debt Securities, net 39,029 ‐ Allowance for Credit Loss Expense Cash Flows Due to Changes in Operating Assets and Liabilities: 2,308 (4) Accounts Receivable (1,078) (12,224) Accrued Interest Receivable Accrued Expenses and Other Liabilities 1,414 (3,525) Accrued Interest Payable (3,212) 3,458 Payable to Affiliates 1,505 1,653 Deferred Fee Income (15) (72) (31) 315 Other Assets $70,677 $52,991 Net Cash Provided by Operating Activities Cash Flows from Investing Activities: (351,650) (1,133,817) Origination of Loans Held for Investment (123,692) (117,131) Advances on Loans Held for Investment 333,715 608,338 Principal Repayments of Loans Held for Investment 5,295 ‐ Proceeds from Sales of Loans Held for Investment (168,888) (632,267) Purchase of Available‐for‐Sale CRE Debt Securities 766,437 6,641 Sale and Principal Repayments of Available‐for‐Sale CRE Debt Securities $461,217 ($1,268,236) Net Cash (Used in) Investing Activities Cash Flows from Financing Activities: ‐ (311,672) Payments on Collateralized Loan Obligations (606,265) (807,471) Payments on Secured Financing Agreements – Loan Investments 695,250 1,746,297 Proceeds from Secured Financing Agreements – Loan Investments Payments on Secured Financing Agreements – CRE Debt Securities (824,920) (4,958) Proceeds from Secured Financing Agreements – CRE Debt Securities 132,122 550,850 Payment of Deferred Financing Costs (1,769) (3,817) Payments to Repurchase Common Stock ‐ (42) 12,895 136,532 Proceeds from Issuance of Common Stock ‐ 125 Proceeds from Issuance of Series A Preferred Stock 210,598 ‐ Proceeds from Issuance of Series B Cumulative Redeemable Preferred Stock 14,402 ‐ Proceeds from Issuance of Warrants to Purchase Common Stock (32,551) (59,649) Dividends Paid on Common Stock (284) (983) Dividends Paid on Class A Common Stock (6) (7) Dividends Paid on Series A Preferred Stock (2,250) ‐ Dividends Paid on Series B Cumulative Redeemable Preferred Stock (12,365) (188) Payment of Equity Issuance and Equity Distribution Agreement Transaction Costs ($415,143) $1,245,017 Net Cash Provided by Financing Activities 116,751 29,772 Net Change in Cash, Cash Equivalents, and Restricted Cash Cash, Cash Equivalents, and Restricted Cash at Beginning of Period 79,666 40,720 Cash, Cash Equivalents, and Restricted Cash at End of Period $196,417 $70,492 Supplemental Disclosure of Cash Flow Information: Interest Paid $60,995 $72,942 5 368 Taxes Paid Supplemental Disclosure of Non‐Cash Investing and Financing Activities: $80,205 $208,697 Principal Repayments of Loans Held for Investment Held by Servicer/Trustee, net ‐ 960 Sales and Principal Repayments of Available‐for‐Sale CRE Debt Securities Held by Servicer/Trustee, net ‐ 103 Proceeds from Secured Financing Agreements Held by Trustee 48,669 31,985 Dividends Declared, not paid 937 1,148 Change in Accrued Deferred Financing Costs (1,051) 3,218 Unrealized Gain (Loss) on Available‐for‐Sale CRE Debt Securities 3,035 309 Accrued Equity Issuance and Transaction Costs TRTX Presentation | BOA Securities 2020 Virtual Global RE Conference | September 15, 2020

Definitions § TRTX defines Asset‐Level Estimated Return on Equity (ALEROE) as a non‐discounted estimate of a loan investment’s average annual return on equity during its initial term to maturity. ALEROE is determined for each loan, on a stand‐ alone basis, using the loan’s stated credit spread, spot LIBOR rate, origination and exit fees (if any) amortized on a straight line basis, the maximum advance rate approved by our lender against the loan investment, the all‐in cost of Asset‐Level funding (including commitment fees and amortized deferred financing costs), and estimates of MG&A, asset Estimated Return management and loan servicing costs, base management fee, and incentive fee, if any. TRTX’s calculation of ALEROE for on Equity a particular loan investment assumes deferred fundings related to such investment, if any, in accordance with TRTX’s underwriting of the borrower’s business plan, and that the all‐in cost of funding for the investment is constant from origination through the initial maturity date. There can be no assurance that the actual asset‐level return on equity for a particular loan investment will equal the ALEROE for such investment § TRTX uses Core Earnings to evaluate its performance excluding the effects of certain transactions and GAAP adjustments it believes are not necessarily indicative of its current loan activity and operations. Core Earnings is a non‐ GAAP measure, which TRTX defines as GAAP net income (loss) attributable to its stockholders, including realized gains and losses not otherwise included in GAAP net income (loss), and excluding (i) non‐cash equity compensation expense, (ii) depreciation and amortization, (iii) unrealized gains (losses), including an allowance for credit losses; and (iv) certain non‐cash items. Core Earnings may also be adjusted from time to time to exclude one‐time events pursuant to changes in GAAP and certain other non‐cash charges as determined by TRTX’s Manager, subject to approval by a majority of TRTX’s independent directors. The exclusion of depreciation and amortization from the calculation of Core Earnings only applies to debt investments related to real estate to the extent TRTX forecloses upon the property or properties underlying such debt investments § TRTX believes that Core Earnings provides meaningful information to consider in addition to its net income and cash Core flow from operating activities determined in accordance with GAAP. Although pursuant to the Management Agreement Earnings TRTX calculates the incentive and base management fees due to its Manager using Core Earnings before incentive fee expense, TRTX reports Core Earnings after incentive fee expense, because TRTX believesthisisamore meaningful presentation of the economic performance of TRTX’s common stock. For additional information on the fees TRTX pays the Manager, see Note 10 to the Consolidated Financial Statements includedinTRTX’s Form10‐Q § Core Earnings does not represent net income or cash generated from operating activities and should not be considered as an alternative to GAAP net income, or an indication of TRTX’s GAAP cash flows from operations, a measure of TRTX’s liquidity, or an indication of funds available for TRTX’s cash needs. In addition, TRTX’s methodology for calculating Core Earnings may differ from the methodologies employed by other companies to calculate the same or similar supplemental performance measures, and accordingly, TRTX’s reported Core Earnings may not be comparable to the Core Earnings reported by other companies TRTX Presentation | BOA Securities 2020 Virtual Global RE Conference | September 15, 2020 26Definitions § TRTX defines Asset‐Level Estimated Return on Equity (ALEROE) as a non‐discounted estimate of a loan investment’s average annual return on equity during its initial term to maturity. ALEROE is determined for each loan, on a stand‐ alone basis, using the loan’s stated credit spread, spot LIBOR rate, origination and exit fees (if any) amortized on a straight line basis, the maximum advance rate approved by our lender against the loan investment, the all‐in cost of Asset‐Level funding (including commitment fees and amortized deferred financing costs), and estimates of MG&A, asset Estimated Return management and loan servicing costs, base management fee, and incentive fee, if any. TRTX’s calculation of ALEROE for on Equity a particular loan investment assumes deferred fundings related to such investment, if any, in accordance with TRTX’s underwriting of the borrower’s business plan, and that the all‐in cost of funding for the investment is constant from origination through the initial maturity date. There can be no assurance that the actual asset‐level return on equity for a particular loan investment will equal the ALEROE for such investment § TRTX uses Core Earnings to evaluate its performance excluding the effects of certain transactions and GAAP adjustments it believes are not necessarily indicative of its current loan activity and operations. Core Earnings is a non‐ GAAP measure, which TRTX defines as GAAP net income (loss) attributable to its stockholders, including realized gains and losses not otherwise included in GAAP net income (loss), and excluding (i) non‐cash equity compensation expense, (ii) depreciation and amortization, (iii) unrealized gains (losses), including an allowance for credit losses; and (iv) certain non‐cash items. Core Earnings may also be adjusted from time to time to exclude one‐time events pursuant to changes in GAAP and certain other non‐cash charges as determined by TRTX’s Manager, subject to approval by a majority of TRTX’s independent directors. The exclusion of depreciation and amortization from the calculation of Core Earnings only applies to debt investments related to real estate to the extent TRTX forecloses upon the property or properties underlying such debt investments § TRTX believes that Core Earnings provides meaningful information to consider in addition to its net income and cash Core flow from operating activities determined in accordance with GAAP. Although pursuant to the Management Agreement Earnings TRTX calculates the incentive and base management fees due to its Manager using Core Earnings before incentive fee expense, TRTX reports Core Earnings after incentive fee expense, because TRTX believesthisisamore meaningful presentation of the economic performance of TRTX’s common stock. For additional information on the fees TRTX pays the Manager, see Note 10 to the Consolidated Financial Statements includedinTRTX’s Form10‐Q § Core Earnings does not represent net income or cash generated from operating activities and should not be considered as an alternative to GAAP net income, or an indication of TRTX’s GAAP cash flows from operations, a measure of TRTX’s liquidity, or an indication of funds available for TRTX’s cash needs. In addition, TRTX’s methodology for calculating Core Earnings may differ from the methodologies employed by other companies to calculate the same or similar supplemental performance measures, and accordingly, TRTX’s reported Core Earnings may not be comparable to the Core Earnings reported by other companies TRTX Presentation | BOA Securities 2020 Virtual Global RE Conference | September 15, 2020 26
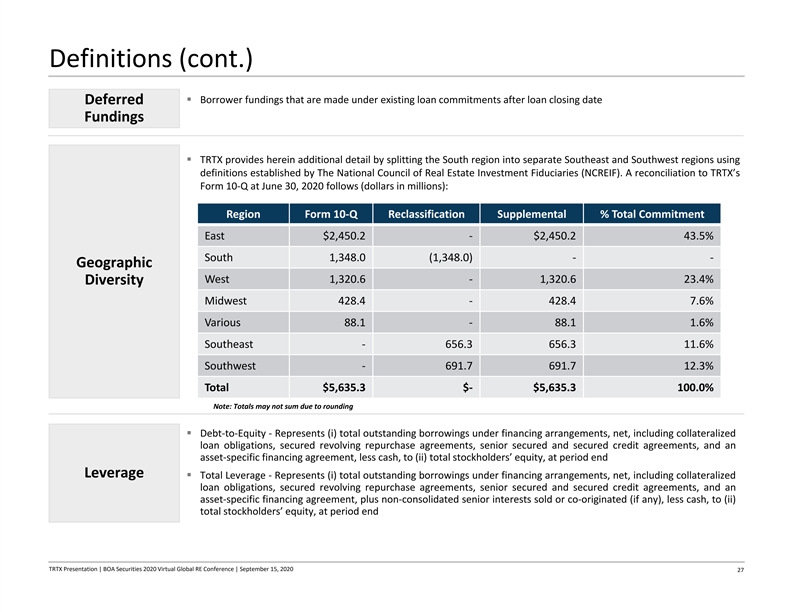
Definitions (cont.) § Borrower fundings that are made under existing loan commitments after loan closing date Deferred Fundings § TRTX provides herein additional detail by splitting the South region into separate Southeast and Southwest regions using definitions established by The National Council of Real Estate Investment Fiduciaries (NCREIF). A reconciliation to TRTX’s Form 10‐Q at June 30, 2020 follows (dollars in millions): Region Form 10‐Q Reclassification Supplemental % Total Commitment East $2,450.2 ‐ $2,450.2 43.5% South 1,348.0 (1,348.0) ‐ ‐ Geographic West 1,320.6 ‐ 1,320.6 23.4% Diversity Midwest 428.4 ‐ 428.4 7.6% Various 88.1 ‐ 88.1 1.6% Southeast ‐ 656.3 656.3 11.6% Southwest ‐ 691.7 691.7 12.3% Total $5,635.3 $‐ $5,635.3 100.0% Note: Totals may not sum due to rounding § Debt‐to‐Equity ‐ Represents (i) total outstanding borrowings under financing arrangements, net, including collateralized loan obligations, secured revolving repurchase agreements, senior secured and secured credit agreements, and an asset‐specific financing agreement, less cash, to (ii) total stockholders’ equity, at period end Leverage § Total Leverage ‐ Represents (i) total outstanding borrowings under financing arrangements, net, including collateralized loan obligations, secured revolving repurchase agreements, senior secured and secured credit agreements, and an asset‐specific financing agreement, plus non‐consolidated senior interests sold or co‐originated (if any), less cash, to (ii) total stockholders’ equity, at period end TRTX Presentation | BOA Securities 2020 Virtual Global RE Conference | September 15, 2020 27Definitions (cont.) § Borrower fundings that are made under existing loan commitments after loan closing date Deferred Fundings § TRTX provides herein additional detail by splitting the South region into separate Southeast and Southwest regions using definitions established by The National Council of Real Estate Investment Fiduciaries (NCREIF). A reconciliation to TRTX’s Form 10‐Q at June 30, 2020 follows (dollars in millions): Region Form 10‐Q Reclassification Supplemental % Total Commitment East $2,450.2 ‐ $2,450.2 43.5% South 1,348.0 (1,348.0) ‐ ‐ Geographic West 1,320.6 ‐ 1,320.6 23.4% Diversity Midwest 428.4 ‐ 428.4 7.6% Various 88.1 ‐ 88.1 1.6% Southeast ‐ 656.3 656.3 11.6% Southwest ‐ 691.7 691.7 12.3% Total $5,635.3 $‐ $5,635.3 100.0% Note: Totals may not sum due to rounding § Debt‐to‐Equity ‐ Represents (i) total outstanding borrowings under financing arrangements, net, including collateralized loan obligations, secured revolving repurchase agreements, senior secured and secured credit agreements, and an asset‐specific financing agreement, less cash, to (ii) total stockholders’ equity, at period end Leverage § Total Leverage ‐ Represents (i) total outstanding borrowings under financing arrangements, net, including collateralized loan obligations, secured revolving repurchase agreements, senior secured and secured credit agreements, and an asset‐specific financing agreement, plus non‐consolidated senior interests sold or co‐originated (if any), less cash, to (ii) total stockholders’ equity, at period end TRTX Presentation | BOA Securities 2020 Virtual Global RE Conference | September 15, 2020 27

Definitions (cont.) § Bridge/Stabilization Loan ‐ A loan with limited deferred fundings, generally less than 10% of the total loan commitment, which fundings are commonly conditioned on the borrower’s satisfaction of certain collateral performance tests. The related business plan generally involves little or no capital expenditure related to base building work (e.g., building mechanical systems, lobbies, elevators, common areas, or other amenities), with most deferred fundings related to leasing activity. The primary focus is on maintaining or improving current operating cash flow, or addressing minimal lease expirations or existing tenant vacancies. § Light Transitional Loan ‐ A transitional loan with deferred fundings ranging from 10% to 20% of the total loan commitment, which fundings are commonly conditioned on the borrower’s completion of specified improvements to the property or satisfaction of certain collateral performance tests. The related business plan is to lease existing or forecasted tenant vacancy to achieve stabilized occupancy and cash flow. Capital expenditure is primarily to fund Loan leasing commissions and tenant improvements for new tenant leases, and capital expenditure allocated to base building Category work generally does not exceed 20%. Deferred fundings may also be budgeted to fund operating deficits, or interest expense, during the period prior to stabilized occupancy. § Moderate Transitional Loan ‐ A transitional loan with deferred fundings greater than 20% of the total loan commitment, which fundings are commonly conditioned on the borrower’s completion of specified improvements to the property or satisfaction of certain collateral performance tests. The related business plan generally involves capital expenditure for base building work needed before substantial leasing activity can be achieved, followed by capital expenditure for tenant improvements and leasing commissions to achieve stabilized occupancy and cash flow. Deferred fundings may also be budgeted to fund operating deficits, or interest expense, during the period prior to stabilized occupancy. § Construction Loan ‐ A loan made to a borrower to fund the ground‐up construction of a commercial real estate property § Loan portfolio leverage is the total outstanding borrowings divided by the aggregate unpaid principal balance of the Loan Portfolio loans pledged at period end Leverage § Except for construction loans, LTV is calculated for loan originations and existing loans as the total outstanding principal balance of the loan or participation interest in a loan (plus any financing that is pari passu with or senior to such loan or participation interest), divided by the as‐is real estate value at the time of origination or acquisition of such loan or Loan‐to‐Value participation interest. For construction loans only, LTV is calculated as the total commitment amount of the loan divided by the as‐stabilized value of the real estate securing the loan. The as‐is or as‐stabilized (as applicable) value reflects our (LTV) Manager’s estimates, at the time of origination or acquisition of the loan or participation interest in a loan, of the real estate value underlying such loan or participation interests determined in accordance with our Manager’s underwriting standards and consistent with third‐party appraisals obtained by our Manager TRTX Presentation | BOA Securities 2020 Virtual Global RE Conference | September 15, 2020 28Definitions (cont.) § Bridge/Stabilization Loan ‐ A loan with limited deferred fundings, generally less than 10% of the total loan commitment, which fundings are commonly conditioned on the borrower’s satisfaction of certain collateral performance tests. The related business plan generally involves little or no capital expenditure related to base building work (e.g., building mechanical systems, lobbies, elevators, common areas, or other amenities), with most deferred fundings related to leasing activity. The primary focus is on maintaining or improving current operating cash flow, or addressing minimal lease expirations or existing tenant vacancies. § Light Transitional Loan ‐ A transitional loan with deferred fundings ranging from 10% to 20% of the total loan commitment, which fundings are commonly conditioned on the borrower’s completion of specified improvements to the property or satisfaction of certain collateral performance tests. The related business plan is to lease existing or forecasted tenant vacancy to achieve stabilized occupancy and cash flow. Capital expenditure is primarily to fund Loan leasing commissions and tenant improvements for new tenant leases, and capital expenditure allocated to base building Category work generally does not exceed 20%. Deferred fundings may also be budgeted to fund operating deficits, or interest expense, during the period prior to stabilized occupancy. § Moderate Transitional Loan ‐ A transitional loan with deferred fundings greater than 20% of the total loan commitment, which fundings are commonly conditioned on the borrower’s completion of specified improvements to the property or satisfaction of certain collateral performance tests. The related business plan generally involves capital expenditure for base building work needed before substantial leasing activity can be achieved, followed by capital expenditure for tenant improvements and leasing commissions to achieve stabilized occupancy and cash flow. Deferred fundings may also be budgeted to fund operating deficits, or interest expense, during the period prior to stabilized occupancy. § Construction Loan ‐ A loan made to a borrower to fund the ground‐up construction of a commercial real estate property § Loan portfolio leverage is the total outstanding borrowings divided by the aggregate unpaid principal balance of the Loan Portfolio loans pledged at period end Leverage § Except for construction loans, LTV is calculated for loan originations and existing loans as the total outstanding principal balance of the loan or participation interest in a loan (plus any financing that is pari passu with or senior to such loan or participation interest), divided by the as‐is real estate value at the time of origination or acquisition of such loan or Loan‐to‐Value participation interest. For construction loans only, LTV is calculated as the total commitment amount of the loan divided by the as‐stabilized value of the real estate securing the loan. The as‐is or as‐stabilized (as applicable) value reflects our (LTV) Manager’s estimates, at the time of origination or acquisition of the loan or participation interest in a loan, of the real estate value underlying such loan or participation interests determined in accordance with our Manager’s underwriting standards and consistent with third‐party appraisals obtained by our Manager TRTX Presentation | BOA Securities 2020 Virtual Global RE Conference | September 15, 2020 28
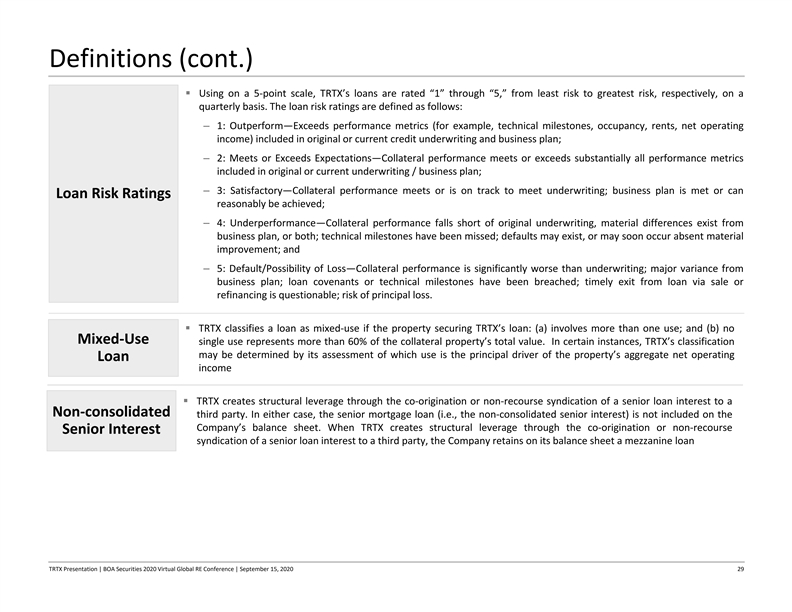
Definitions (cont.) § Using on a 5‐point scale, TRTX’s loans are rated “1” through “5,” from least risk to greatest risk, respectively, on a quarterly basis. The loan risk ratings are defined as follows: – 1: Outperform—Exceeds performance metrics (for example, technical milestones, occupancy, rents, net operating income) included in original or current credit underwriting and business plan; – 2: Meets or Exceeds Expectations—Collateral performance meets or exceeds substantially all performance metrics included in original or current underwriting / business plan; – 3: Satisfactory—Collateral performance meets or is on track to meet underwriting; business plan is met or can Loan Risk Ratings reasonably be achieved; – 4: Underperformance—Collateral performance falls short of original underwriting, material differences exist from business plan, or both; technical milestones have been missed; defaults may exist, or may soon occur absent material improvement; and – 5: Default/Possibility of Loss—Collateral performance is significantly worse than underwriting; major variance from business plan; loan covenants or technical milestones have been breached; timely exit from loan via sale or refinancing is questionable; risk of principal loss. § TRTX classifies a loan as mixed‐use if the property securing TRTX’s loan: (a) involves more than one use; and (b) no Mixed‐Use single use represents more than 60% of the collateral property’s total value. In certain instances, TRTX’s classification may be determined by its assessment of which use is the principal driver of the property’s aggregate net operating Loan income § TRTX creates structural leverage through the co‐origination or non‐recourse syndication of a senior loan interest to a Non‐consolidated third party. In either case, the senior mortgage loan (i.e., the non‐consolidated senior interest) is not included on the Company’s balance sheet. When TRTX creates structural leverage through the co‐origination or non‐recourse Senior Interest syndication of a senior loan interest to a third party, the Company retains on its balance sheet a mezzanine loan TRTX Presentation | BOA Securities 2020 Virtual Global RE Conference | September 15, 2020 29Definitions (cont.) § Using on a 5‐point scale, TRTX’s loans are rated “1” through “5,” from least risk to greatest risk, respectively, on a quarterly basis. The loan risk ratings are defined as follows: – 1: Outperform—Exceeds performance metrics (for example, technical milestones, occupancy, rents, net operating income) included in original or current credit underwriting and business plan; – 2: Meets or Exceeds Expectations—Collateral performance meets or exceeds substantially all performance metrics included in original or current underwriting / business plan; – 3: Satisfactory—Collateral performance meets or is on track to meet underwriting; business plan is met or can Loan Risk Ratings reasonably be achieved; – 4: Underperformance—Collateral performance falls short of original underwriting, material differences exist from business plan, or both; technical milestones have been missed; defaults may exist, or may soon occur absent material improvement; and – 5: Default/Possibility of Loss—Collateral performance is significantly worse than underwriting; major variance from business plan; loan covenants or technical milestones have been breached; timely exit from loan via sale or refinancing is questionable; risk of principal loss. § TRTX classifies a loan as mixed‐use if the property securing TRTX’s loan: (a) involves more than one use; and (b) no Mixed‐Use single use represents more than 60% of the collateral property’s total value. In certain instances, TRTX’s classification may be determined by its assessment of which use is the principal driver of the property’s aggregate net operating Loan income § TRTX creates structural leverage through the co‐origination or non‐recourse syndication of a senior loan interest to a Non‐consolidated third party. In either case, the senior mortgage loan (i.e., the non‐consolidated senior interest) is not included on the Company’s balance sheet. When TRTX creates structural leverage through the co‐origination or non‐recourse Senior Interest syndication of a senior loan interest to a third party, the Company retains on its balance sheet a mezzanine loan TRTX Presentation | BOA Securities 2020 Virtual Global RE Conference | September 15, 2020 29

Company Information TPG RE Finance Trust, Inc. (“TRTX” or the “Company”) is a commercial real estate finance company that focuses primarily on originating, acquiring, and managing first mortgage loans and other commercial real estate‐related debt instruments secured by institutional properties located in primary and select secondary markets in the United States. The Company is externally managed by TPG RE Finance Trust Management, L.P., a part of TPG Real Estate, which is the real estate investment platform of TPG. TPG is a global alternative asset firm with a 25‐year history and more than $[79] billion of assets under management. For more information regarding TRTX, visit www.tpgrefinance.com. Contact Information Headquarters: TPG RE Finance Trust, Inc. Investor Relations: Media Contact: 888 Seventh Avenue Bob Foley +1 (212) 405‐8500 TPG RE Finance Trust, Inc. th 35 Floor Chief Financial Officer IR@tpgrefinance.com Courtney Power New York, NY 10106 +1 (212) 430‐4111 +1 (415) 743‐1550 bfoley@tpg.com media@tpg.com New York Stock Exchange: Symbol: TRTX Analyst Coverage Citigroup JP Morgan Raymond James Arren Cyganovich Richard Shane Stephen Laws +1 (212) 816‐3733 +1 (415) 315‐6701 +1 (901) 579‐4868 Deutsche Bank JMP Securities Wells Fargo George Bahamondes Steven DeLaney Donald Fandetti +1 (212) 250‐1587 +1 (212) 906‐3517 +1 (212) 214‐8069 Transfer Agent American Stock Transfer & Trust Company, LLC +1 (800) 937‐5449 help@astfinancial.com TRTX Presentation | BOA Securities 2020 Virtual Global RE Conference | September 15, 2020 30Company Information TPG RE Finance Trust, Inc. (“TRTX” or the “Company”) is a commercial real estate finance company that focuses primarily on originating, acquiring, and managing first mortgage loans and other commercial real estate‐related debt instruments secured by institutional properties located in primary and select secondary markets in the United States. The Company is externally managed by TPG RE Finance Trust Management, L.P., a part of TPG Real Estate, which is the real estate investment platform of TPG. TPG is a global alternative asset firm with a 25‐year history and more than $[79] billion of assets under management. For more information regarding TRTX, visit www.tpgrefinance.com. Contact Information Headquarters: TPG RE Finance Trust, Inc. Investor Relations: Media Contact: 888 Seventh Avenue Bob Foley +1 (212) 405‐8500 TPG RE Finance Trust, Inc. th 35 Floor Chief Financial Officer IR@tpgrefinance.com Courtney Power New York, NY 10106 +1 (212) 430‐4111 +1 (415) 743‐1550 bfoley@tpg.com media@tpg.com New York Stock Exchange: Symbol: TRTX Analyst Coverage Citigroup JP Morgan Raymond James Arren Cyganovich Richard Shane Stephen Laws +1 (212) 816‐3733 +1 (415) 315‐6701 +1 (901) 579‐4868 Deutsche Bank JMP Securities Wells Fargo George Bahamondes Steven DeLaney Donald Fandetti +1 (212) 250‐1587 +1 (212) 906‐3517 +1 (212) 214‐8069 Transfer Agent American Stock Transfer & Trust Company, LLC +1 (800) 937‐5449 help@astfinancial.com TRTX Presentation | BOA Securities 2020 Virtual Global RE Conference | September 15, 2020 30