Attached files
| file | filename |
|---|---|
| EX-99.2 - EX-99.2 - LSC Communications, Inc. | d30811dex992.htm |
| EX-2.1 - EX-2.1 - LSC Communications, Inc. | d30811dex21.htm |
| 8-K - 8-K - LSC Communications, Inc. | d30811d8k.htm |

Exhibit 99.1 Discussion Materials August 2020 HI HIGHL GHLY Y CONF CONFIIDE DENT NTIIA AL L DR DRA AF FT T, , S SUB UBJE JECT CT T TO O ND NDA A;; S SUB UBJE JECT CT T TO O F FRE RE 4 40 08 8 A AND ND RU RUL LE ES S O OF F S SIIM MIIL LA AR R IIM MP PORT ORTExhibit 99.1 Discussion Materials August 2020 HI HIGHL GHLY Y CONF CONFIIDE DENT NTIIA AL L DR DRA AF FT T, , S SUB UBJE JECT CT T TO O ND NDA A;; S SUB UBJE JECT CT T TO O F FRE RE 4 40 08 8 A AND ND RU RUL LE ES S O OF F S SIIM MIIL LA AR R IIM MP PORT ORT

Confidentiality & Disclaimer By accepting this presentation, recipients acknowledge that they have read, understood and accepted the terms of this Disclaimer. This presentation is the property of, and contains the proprietary and confidential information of LSC Communications, Inc., and its direct and indirect subsidiaries (collectively, “LSC” or the Company ) and is being provided solely for informational purposes. Any estimates contained herein may be forward-looking in nature and involve significant elements of subjective judgment and analysis, which may or may not be correct. Forecasts and estimates regarding the Company's industry and end markets are based on third party sources, and there can be no assurance these forecasts and estimates will prove accurate in whole or in part. There can be no assurance that any of the information contained herein is reflective of future performance to any degree. No representation or warranty, express or implied, is or will be given by the Company or its affiliates, directors, officers, partners, employees, agents or advisers or any other person as to the accuracy, completeness, reasonableness or fairness of any information contained in this presentation and no responsibility or liability whatsoever is accepted for the accuracy or sufficiency thereof or for any errors, omissions or misstatements, negligent or otherwise, relating thereto. Accordingly, this presentation should not be relied upon for the purpose of evaluating the performance of the Company or for any other purpose, and neither the Company nor any of its affiliates, directors, officers, partners, employees, agents or advisers nor any other person, shall be liable for any direct, indirect or consequential liability, loss or damages suffered by any person as a result of this presentation or their reliance on any statement, estimate, target, projection or forward-looking information in or omission from this presentation and any such liability is expressly disclaimed. In all cases, interested parties should conduct their own investigation and analysis of the Company and the information contained herein. All information herein speaks only as of (1) the date hereof, in the case of information about the Company and (2) the date of such information, in the case of information from persons other than the Company. The Company does not undertake any duty to update or revise the information contained herein, publicly or otherwise. You are cautioned not to place undue reliance on the utility of the information in this presentation as a predictor of future performance, as projected financial and other information are based on estimates and assumptions that are inherently subject to various significant risks, uncertainties and other factors, many of which are beyond the Company’s control. Risks, uncertainties and other factors may cause future results to differ materially, and potentially adversely from the historical results or projections contained herein. The historical financial information in this presentation includes information that is not presented in accordance with International Financial Reporting Standards (GAAP). Non-GAAP financial measures may be considered in addition to GAAP financial information, but should not be used as substitutes for the corresponding GAAP measures. Non-GAAP measures in this presentation may be calculated in ways that are not comparable to similarly titled measures reported by other companies. This presentation is subject to the confidentiality provision set forth in the recipients’ applicable Confidentiality Agreement or Non-Disclosure Agreement. This presentation should not be considered as a recommendation by the Company or any affiliate or other person in relation to the Company, nor does it constitute an offer or invitation for the sale or purchase of the shares, assets or business of the Company and shall not form the basis of any contract. THIS PRESENTATION MAY CONTAIN MATERIAL, NON-PUBLIC INFORMATION WITHIN THE MEANING OF UNITED STATES FEDERAL SECURITIES LAWS WITH RESPECT TO THE COMPANY AND ITS SECURITIES. All amounts in this presentation are in USD unless otherwise stated. HIGHLY CONFIDENTIAL DRAFT, SUBJECT TO NDA; SUBJECT TO FRE 408 AND RULES OF SIMILAR IMPORTConfidentiality & Disclaimer By accepting this presentation, recipients acknowledge that they have read, understood and accepted the terms of this Disclaimer. This presentation is the property of, and contains the proprietary and confidential information of LSC Communications, Inc., and its direct and indirect subsidiaries (collectively, “LSC” or the Company ) and is being provided solely for informational purposes. Any estimates contained herein may be forward-looking in nature and involve significant elements of subjective judgment and analysis, which may or may not be correct. Forecasts and estimates regarding the Company's industry and end markets are based on third party sources, and there can be no assurance these forecasts and estimates will prove accurate in whole or in part. There can be no assurance that any of the information contained herein is reflective of future performance to any degree. No representation or warranty, express or implied, is or will be given by the Company or its affiliates, directors, officers, partners, employees, agents or advisers or any other person as to the accuracy, completeness, reasonableness or fairness of any information contained in this presentation and no responsibility or liability whatsoever is accepted for the accuracy or sufficiency thereof or for any errors, omissions or misstatements, negligent or otherwise, relating thereto. Accordingly, this presentation should not be relied upon for the purpose of evaluating the performance of the Company or for any other purpose, and neither the Company nor any of its affiliates, directors, officers, partners, employees, agents or advisers nor any other person, shall be liable for any direct, indirect or consequential liability, loss or damages suffered by any person as a result of this presentation or their reliance on any statement, estimate, target, projection or forward-looking information in or omission from this presentation and any such liability is expressly disclaimed. In all cases, interested parties should conduct their own investigation and analysis of the Company and the information contained herein. All information herein speaks only as of (1) the date hereof, in the case of information about the Company and (2) the date of such information, in the case of information from persons other than the Company. The Company does not undertake any duty to update or revise the information contained herein, publicly or otherwise. You are cautioned not to place undue reliance on the utility of the information in this presentation as a predictor of future performance, as projected financial and other information are based on estimates and assumptions that are inherently subject to various significant risks, uncertainties and other factors, many of which are beyond the Company’s control. Risks, uncertainties and other factors may cause future results to differ materially, and potentially adversely from the historical results or projections contained herein. The historical financial information in this presentation includes information that is not presented in accordance with International Financial Reporting Standards (GAAP). Non-GAAP financial measures may be considered in addition to GAAP financial information, but should not be used as substitutes for the corresponding GAAP measures. Non-GAAP measures in this presentation may be calculated in ways that are not comparable to similarly titled measures reported by other companies. This presentation is subject to the confidentiality provision set forth in the recipients’ applicable Confidentiality Agreement or Non-Disclosure Agreement. This presentation should not be considered as a recommendation by the Company or any affiliate or other person in relation to the Company, nor does it constitute an offer or invitation for the sale or purchase of the shares, assets or business of the Company and shall not form the basis of any contract. THIS PRESENTATION MAY CONTAIN MATERIAL, NON-PUBLIC INFORMATION WITHIN THE MEANING OF UNITED STATES FEDERAL SECURITIES LAWS WITH RESPECT TO THE COMPANY AND ITS SECURITIES. All amounts in this presentation are in USD unless otherwise stated. HIGHLY CONFIDENTIAL DRAFT, SUBJECT TO NDA; SUBJECT TO FRE 408 AND RULES OF SIMILAR IMPORT

Table of Contents + Business Update 1 + Financial Projections 2 + WholeCo A + Book B + Office Products C + Magazine, Catalog and Logistics (MCL) D + Mexico E + Appendix 3 HIGHLY CONFIDENTIAL DRAFT, SUBJECT TO NDA; SUBJECT TO FRE 408 AND RULES OF SIMILAR IMPORTTable of Contents + Business Update 1 + Financial Projections 2 + WholeCo A + Book B + Office Products C + Magazine, Catalog and Logistics (MCL) D + Mexico E + Appendix 3 HIGHLY CONFIDENTIAL DRAFT, SUBJECT TO NDA; SUBJECT TO FRE 408 AND RULES OF SIMILAR IMPORT

1 1. Business Update HIGHLY CONFIDENTIAL DRAFT, SUBJECT TO NDA; SUBJECT TO FRE 408 AND RULES OF SIMILAR IMPORT1 1. Business Update HIGHLY CONFIDENTIAL DRAFT, SUBJECT TO NDA; SUBJECT TO FRE 408 AND RULES OF SIMILAR IMPORT

LSC Communications: North American Market Leader Overview North American Platform + North American leader in traditional and digital print, print-related services and office products + Serves the needs of publishers, merchandisers and retailers + Service offering includes logistics, warehousing, fulfillment, supply chain management and e-Services + Strategically-located operations with 61 manufacturing and warehouse facilities in North America 1 Products & Services Mexico 3% F:\Word Processing\MapInf o\MapInf o Jobs\Leonard, Cole\04-09-20 Book Office Products Magazine, Catalog Mexico Corporate and Logistics Book 31% Magazine, $3.3B $116M 3,000+ Catalog and 2019 Revenue 2019 Adj. EBITDA Customers Logistics $3.3B 50% 2019 Sales 34 27 13 Office Manufacturing Warehouse Offices Products 16% Facilities Distribution Facilities Note: Facility counts exclude announced facility closures 1. Revenue mix excludes Corporate, Other and eliminations 1 HIGHLY CONFIDENTIAL DRAFT, SUBJECT TO NDA; SUBJECT TO FRE 408 AND RULES OF SIMILAR IMPORTLSC Communications: North American Market Leader Overview North American Platform + North American leader in traditional and digital print, print-related services and office products + Serves the needs of publishers, merchandisers and retailers + Service offering includes logistics, warehousing, fulfillment, supply chain management and e-Services + Strategically-located operations with 61 manufacturing and warehouse facilities in North America 1 Products & Services Mexico 3% F:\Word Processing\MapInf o\MapInf o Jobs\Leonard, Cole\04-09-20 Book Office Products Magazine, Catalog Mexico Corporate and Logistics Book 31% Magazine, $3.3B $116M 3,000+ Catalog and 2019 Revenue 2019 Adj. EBITDA Customers Logistics $3.3B 50% 2019 Sales 34 27 13 Office Manufacturing Warehouse Offices Products 16% Facilities Distribution Facilities Note: Facility counts exclude announced facility closures 1. Revenue mix excludes Corporate, Other and eliminations 1 HIGHLY CONFIDENTIAL DRAFT, SUBJECT TO NDA; SUBJECT TO FRE 408 AND RULES OF SIMILAR IMPORT

Segment Financial Overview and Outlook Adj. 1 1 1 1 EBITDA Revenue % of Total Margin % Outlook + Leadership position and steady book demand has supported stable performance and profitability 31% Book ~$1.0B ~$80M ~8% + Track record of consistent profitability expected to continue + Consistent performance driven by market-leading position and market share gains in wholesale channel and growing Office e-Commerce channel, partially offsetting ~$0.5B ~$59M ~11% Products secular headwinds 16% + Office products demand expected to remain stable + Industry headwinds have led to excess Magazine, capacity and decline in margins Catalog + Plant consolidations and disciplined cost ~$1.6B (~$13M) NA and 50% initiatives are underway to return business to profitability Logistics 3% + Consistent top-line and bottom-line performance driven by market-leading Mexico capabilities ~$91M ~$18M ~20% Note: Financial metrics exclude Corporate, Other and eliminations and potential Standalone Costs 1. Represents 2019 financials 2 HIGHLY CONFIDENTIAL DRAFT, SUBJECT TO NDA; SUBJECT TO FRE 408 AND RULES OF SIMILAR IMPORTSegment Financial Overview and Outlook Adj. 1 1 1 1 EBITDA Revenue % of Total Margin % Outlook + Leadership position and steady book demand has supported stable performance and profitability 31% Book ~$1.0B ~$80M ~8% + Track record of consistent profitability expected to continue + Consistent performance driven by market-leading position and market share gains in wholesale channel and growing Office e-Commerce channel, partially offsetting ~$0.5B ~$59M ~11% Products secular headwinds 16% + Office products demand expected to remain stable + Industry headwinds have led to excess Magazine, capacity and decline in margins Catalog + Plant consolidations and disciplined cost ~$1.6B (~$13M) NA and 50% initiatives are underway to return business to profitability Logistics 3% + Consistent top-line and bottom-line performance driven by market-leading Mexico capabilities ~$91M ~$18M ~20% Note: Financial metrics exclude Corporate, Other and eliminations and potential Standalone Costs 1. Represents 2019 financials 2 HIGHLY CONFIDENTIAL DRAFT, SUBJECT TO NDA; SUBJECT TO FRE 408 AND RULES OF SIMILAR IMPORT

COVID-19 Mitigation Plans The Company has Implemented Best-in-Class Continuity Plans to Mitigate Business Disruption from COVID-19, but Potential Risks Remain Across each of the Business Segments + Detailed Business Continuity Plans refreshed; plans have components to mitigate virus-related supply chain, labor, customer collection and facility shutdown disruption, including: + Presence of multiple facility locations across geographies that can manufacture for each major product group + Will mitigate any plant shutdowns due to localized outbreaks, which have been minimal to date + Redundancies of pre-press systems and manufacturing equipment enable customer work to be transferred to alternative plants + Robust IT disaster recovery plans in place that have been tested + Contingencies in place for key materials and supplies + Company continues to maintain open communications regarding supply chain issues and supplier contingency plans + However, sustained or renewed disruptions in U.S. and / or international economy could create material business risks + Decline in customer orders could severely impact cash flows + Company aggressively working to ensure employee safety and business continuity but has also acted decisively to reduce costs and accelerate operational restructuring plans 3 HIGHLY CONFIDENTIAL DRAFT, SUBJECT TO NDA; SUBJECT TO FRE 408 AND RULES OF SIMILAR IMPORTCOVID-19 Mitigation Plans The Company has Implemented Best-in-Class Continuity Plans to Mitigate Business Disruption from COVID-19, but Potential Risks Remain Across each of the Business Segments + Detailed Business Continuity Plans refreshed; plans have components to mitigate virus-related supply chain, labor, customer collection and facility shutdown disruption, including: + Presence of multiple facility locations across geographies that can manufacture for each major product group + Will mitigate any plant shutdowns due to localized outbreaks, which have been minimal to date + Redundancies of pre-press systems and manufacturing equipment enable customer work to be transferred to alternative plants + Robust IT disaster recovery plans in place that have been tested + Contingencies in place for key materials and supplies + Company continues to maintain open communications regarding supply chain issues and supplier contingency plans + However, sustained or renewed disruptions in U.S. and / or international economy could create material business risks + Decline in customer orders could severely impact cash flows + Company aggressively working to ensure employee safety and business continuity but has also acted decisively to reduce costs and accelerate operational restructuring plans 3 HIGHLY CONFIDENTIAL DRAFT, SUBJECT TO NDA; SUBJECT TO FRE 408 AND RULES OF SIMILAR IMPORT

COVID-19 Impact: Key Assumptions + COVID-19 pandemic is expected to impact 2020 revenues across all segments, with volumes expected to rebound in the second half of 2020 and into 2021. The below provides an overview of key assumption on the COVID-19 revenue impact in 2020 + Book: Company assumes an incremental decline of ~12% in full year 2020 revenues due to COVID-19 + Trade volumes declined initially in April/May, but have since shown growth + Education volume has been significantly impacted by the uncertainty about school openings + LSC has implemented new programs for direct-to-consumer shipments via the Amazon Seller Central and Vendor Central programs to help offset declines from disruption in distribution channels + ~80% of the volume decline attributed to COVID-19 is expected to bounce back in 2021 + Office Products: Company assumes an incremental decline of ~14% in full year 2020 revenues due to COVID-19 + The pandemic will also likely result in some shift of volume with our customers from office superstores, wholesalers and independent dealers to mass market and e-Commerce. LSC is well-positioned to gain share in e-Commerce and volumes are exceeding forecasts + Forms, filing and notetaking are expected to slowly return to normal volumes as people return to work. Binders are expected to be most impacted given uncertainty of school openings + ~75% of the volume decline attributed to COVID-19 is expected to bounce back in 2021. Envelopes has been the most resilient category and volumes are already returning to levels in-line with the prior year Note: All %s are versus a forecast pre-COVID-19; they are not versus the prior year 4 HIGHLY CONFIDENTIAL DRAFT, SUBJECT TO NDA; SUBJECT TO FRE 408 AND RULES OF SIMILAR IMPORTCOVID-19 Impact: Key Assumptions + COVID-19 pandemic is expected to impact 2020 revenues across all segments, with volumes expected to rebound in the second half of 2020 and into 2021. The below provides an overview of key assumption on the COVID-19 revenue impact in 2020 + Book: Company assumes an incremental decline of ~12% in full year 2020 revenues due to COVID-19 + Trade volumes declined initially in April/May, but have since shown growth + Education volume has been significantly impacted by the uncertainty about school openings + LSC has implemented new programs for direct-to-consumer shipments via the Amazon Seller Central and Vendor Central programs to help offset declines from disruption in distribution channels + ~80% of the volume decline attributed to COVID-19 is expected to bounce back in 2021 + Office Products: Company assumes an incremental decline of ~14% in full year 2020 revenues due to COVID-19 + The pandemic will also likely result in some shift of volume with our customers from office superstores, wholesalers and independent dealers to mass market and e-Commerce. LSC is well-positioned to gain share in e-Commerce and volumes are exceeding forecasts + Forms, filing and notetaking are expected to slowly return to normal volumes as people return to work. Binders are expected to be most impacted given uncertainty of school openings + ~75% of the volume decline attributed to COVID-19 is expected to bounce back in 2021. Envelopes has been the most resilient category and volumes are already returning to levels in-line with the prior year Note: All %s are versus a forecast pre-COVID-19; they are not versus the prior year 4 HIGHLY CONFIDENTIAL DRAFT, SUBJECT TO NDA; SUBJECT TO FRE 408 AND RULES OF SIMILAR IMPORT
COVID-19 Impact: Key Assumptions (Cont’d) + COVID-19 pandemic is expected to impact 2020 revenues across all segments, with volumes expected to rebound in the second half of 2020 and into 2021. The below provides an overview of key assumption on the COVID-19 revenue impact in 2020 + MCL: Company assumes an incremental decline of ~15% in full year 2020 revenues due to COVID-19 + Both catalog and magazine volumes expected to decline, though catalog volumes have declined more severely + Logistics / Co-Services: COVID-19 related decline expected to mirror trend across both magazines and catalogs + ~35% of the volume decline attributed to COVID-19 is expected to bounce back in 2021 Note: All %s are versus a forecast pre-COVID-19; they are not versus the prior year 5 HIGHLY CONFIDENTIAL DRAFT, SUBJECT TO NDA; SUBJECT TO FRE 408 AND RULES OF SIMILAR IMPORTCOVID-19 Impact: Key Assumptions (Cont’d) + COVID-19 pandemic is expected to impact 2020 revenues across all segments, with volumes expected to rebound in the second half of 2020 and into 2021. The below provides an overview of key assumption on the COVID-19 revenue impact in 2020 + MCL: Company assumes an incremental decline of ~15% in full year 2020 revenues due to COVID-19 + Both catalog and magazine volumes expected to decline, though catalog volumes have declined more severely + Logistics / Co-Services: COVID-19 related decline expected to mirror trend across both magazines and catalogs + ~35% of the volume decline attributed to COVID-19 is expected to bounce back in 2021 Note: All %s are versus a forecast pre-COVID-19; they are not versus the prior year 5 HIGHLY CONFIDENTIAL DRAFT, SUBJECT TO NDA; SUBJECT TO FRE 408 AND RULES OF SIMILAR IMPORT

Strategic Initiatives Robust Pipeline of Strategic Initiatives to Enhance Market Position, Improve Margins and Cash Flow and Reduce Leverage Key Initiatives + Significantly reduce footprint and excess capacity in Long-Run magazine and catalog plants Continued Plant to drive margin improvement Consolidation & + Accelerate rationalization of current footprint Optimization of Footprint + Staging of plant closures will allow flexibility if volume declines are less than expected + Company-wide cost efficiency initiatives to identify opportunities for further margin Business improvement, building on the positive trends seen in 2019 Optimization & + Company-wide efficiency undertakings projected to generate cumulative savings in excess of Efficiency Initiatives ~$200M by 2022 + Cross-functional analyses performed to evaluate customer-level profitability on an “all-in” gross margin basis Revised Pricing and + These contracts no longer cover fixed/overhead costs, primarily a result of price Contract Renewal competition and faster-than-expected volume declines, but still are positive on a Strategy to Drive marginal cost basis Increased Margins + Currently restructuring unprofitable customers through rationalization or renegotiation of contracts in addition to increasing prices for renewals 6 HIGHLY CONFIDENTIAL DRAFT, SUBJECT TO NDA; SUBJECT TO FRE 408 AND RULES OF SIMILAR IMPORTStrategic Initiatives Robust Pipeline of Strategic Initiatives to Enhance Market Position, Improve Margins and Cash Flow and Reduce Leverage Key Initiatives + Significantly reduce footprint and excess capacity in Long-Run magazine and catalog plants Continued Plant to drive margin improvement Consolidation & + Accelerate rationalization of current footprint Optimization of Footprint + Staging of plant closures will allow flexibility if volume declines are less than expected + Company-wide cost efficiency initiatives to identify opportunities for further margin Business improvement, building on the positive trends seen in 2019 Optimization & + Company-wide efficiency undertakings projected to generate cumulative savings in excess of Efficiency Initiatives ~$200M by 2022 + Cross-functional analyses performed to evaluate customer-level profitability on an “all-in” gross margin basis Revised Pricing and + These contracts no longer cover fixed/overhead costs, primarily a result of price Contract Renewal competition and faster-than-expected volume declines, but still are positive on a Strategy to Drive marginal cost basis Increased Margins + Currently restructuring unprofitable customers through rationalization or renegotiation of contracts in addition to increasing prices for renewals 6 HIGHLY CONFIDENTIAL DRAFT, SUBJECT TO NDA; SUBJECT TO FRE 408 AND RULES OF SIMILAR IMPORT

Consolidated July 2020 Results ($ in millions) Actual Forecast July Δ + On a consolidated basis, July results exceeded the revised revenue and EBITDA July July $ % forecasts as volumes continued to show Book $70.4 $75.4 ($5.0) (6.6%) month over month growth from April lows, in addition to better than expected Office Products 42.1 40.8 1.3 3.1% productivity and ongoing cost savings. Key MCL 81.0 75.3 5.7 7.5% drivers of the July MTD results vs. forecast Mexico 7.0 7.2 (0.2) (3.1%) are as follows: Corporate 0.0 - 0.0 na Other and Elims 2.2 2.7 (0.4) (16.3%) + MCL: July MTD favorable revenue and EBITDA primarily driven by Total Revenue $202.6 $201.3 $1.3 0.6% higher sales volume in Catalog and Book $5.4 $5.5 ($0.2) (2.8%) Co-Services, in addition to favorable Office Products 5.5 5.2 0.3 5.5% productivity and ongoing cost control MCL (6.9) (11.0) 4.1 37.7% measures across the Segment Mexico 1.4 1.4 0.1 6.4% + Book: July MTD revenue miss Corporate (2.7) (2.8) 0.0 0.9% primarily driven by a combination of Other and Elims 0.0 (0.3) 0.3 108.6% timing of sales and mix of work. Total Adjusted EBITDA $2.7 ($2.0) $4.7 238.8% Higher VAR per unit (favorable mix), Adj. EBITDA Margin 1.3% NA favorable cost control, and productivity mitigated EBITDA impact 7 HIGHLY CONFIDENTIAL DRAFT, SUBJECT TO NDA; SUBJECT TO FRE 408 AND RULES OF SIMILAR IMPORTConsolidated July 2020 Results ($ in millions) Actual Forecast July Δ + On a consolidated basis, July results exceeded the revised revenue and EBITDA July July $ % forecasts as volumes continued to show Book $70.4 $75.4 ($5.0) (6.6%) month over month growth from April lows, in addition to better than expected Office Products 42.1 40.8 1.3 3.1% productivity and ongoing cost savings. Key MCL 81.0 75.3 5.7 7.5% drivers of the July MTD results vs. forecast Mexico 7.0 7.2 (0.2) (3.1%) are as follows: Corporate 0.0 - 0.0 na Other and Elims 2.2 2.7 (0.4) (16.3%) + MCL: July MTD favorable revenue and EBITDA primarily driven by Total Revenue $202.6 $201.3 $1.3 0.6% higher sales volume in Catalog and Book $5.4 $5.5 ($0.2) (2.8%) Co-Services, in addition to favorable Office Products 5.5 5.2 0.3 5.5% productivity and ongoing cost control MCL (6.9) (11.0) 4.1 37.7% measures across the Segment Mexico 1.4 1.4 0.1 6.4% + Book: July MTD revenue miss Corporate (2.7) (2.8) 0.0 0.9% primarily driven by a combination of Other and Elims 0.0 (0.3) 0.3 108.6% timing of sales and mix of work. Total Adjusted EBITDA $2.7 ($2.0) $4.7 238.8% Higher VAR per unit (favorable mix), Adj. EBITDA Margin 1.3% NA favorable cost control, and productivity mitigated EBITDA impact 7 HIGHLY CONFIDENTIAL DRAFT, SUBJECT TO NDA; SUBJECT TO FRE 408 AND RULES OF SIMILAR IMPORT

Consolidated July YTD Results ($ in millions) Actual January February March April May June July July YTD Book $70.3 $62.8 $71.0 $59.7 $69.0 $69.1 $70.4 $472.4 Office Products 36.7 37.7 38.1 18.9 24.0 37.3 42.1 234.8 MCL 121.0 110.2 118.2 84.1 73.5 69.8 81.0 657.7 Mexico 8.5 6.4 7.8 4.2 5.8 6.5 7.0 46.3 Corporate 0.0 0.1 (0.1) (0.0) 0.0 0.0 0.0 0.0 Other and Elims 3.2 5.1 4.4 3.9 3.6 2.3 2.2 24.7 Total Revenue $239.8 $222.3 $239.4 $170.8 $175.8 $185.1 $202.6 $1,435.8 Book ($0.3) $0.9 $5.0 $1.8 $7.7 $7.4 $5.4 27.9 Office Products 2.9 4.6 5.0 (1.0) (0.0) 4.4 5.5 21.3 MCL (7.9) (3.0) 1.2 (9.8) (8.8) (5.9) (6.9) (41.0) Mexico 1.6 1.3 1.3 0.4 1.4 1.6 1.4 9.1 Corporate (2.1) 0.2 (2.6) (0.5) 0.6 (2.0) (2.7) (9.1) Other and Elims 0.3 0.6 0.9 0.9 0.4 (0.0) 0.0 3.0 Total Adjusted EBITDA ($5.5) $4.5 $10.9 ($8.2) $1.2 $5.6 $2.7 $11.2 Adj. EBITDA Margin NA 2.0% 4.5% NA 0.7% 3.0% 1.3% 0.8% Note: June actuals reflect ~$500k change in cash awards add back 8 HIGHLY CONFIDENTIAL DRAFT, SUBJECT TO NDA; SUBJECT TO FRE 408 AND RULES OF SIMILAR IMPORTConsolidated July YTD Results ($ in millions) Actual January February March April May June July July YTD Book $70.3 $62.8 $71.0 $59.7 $69.0 $69.1 $70.4 $472.4 Office Products 36.7 37.7 38.1 18.9 24.0 37.3 42.1 234.8 MCL 121.0 110.2 118.2 84.1 73.5 69.8 81.0 657.7 Mexico 8.5 6.4 7.8 4.2 5.8 6.5 7.0 46.3 Corporate 0.0 0.1 (0.1) (0.0) 0.0 0.0 0.0 0.0 Other and Elims 3.2 5.1 4.4 3.9 3.6 2.3 2.2 24.7 Total Revenue $239.8 $222.3 $239.4 $170.8 $175.8 $185.1 $202.6 $1,435.8 Book ($0.3) $0.9 $5.0 $1.8 $7.7 $7.4 $5.4 27.9 Office Products 2.9 4.6 5.0 (1.0) (0.0) 4.4 5.5 21.3 MCL (7.9) (3.0) 1.2 (9.8) (8.8) (5.9) (6.9) (41.0) Mexico 1.6 1.3 1.3 0.4 1.4 1.6 1.4 9.1 Corporate (2.1) 0.2 (2.6) (0.5) 0.6 (2.0) (2.7) (9.1) Other and Elims 0.3 0.6 0.9 0.9 0.4 (0.0) 0.0 3.0 Total Adjusted EBITDA ($5.5) $4.5 $10.9 ($8.2) $1.2 $5.6 $2.7 $11.2 Adj. EBITDA Margin NA 2.0% 4.5% NA 0.7% 3.0% 1.3% 0.8% Note: June actuals reflect ~$500k change in cash awards add back 8 HIGHLY CONFIDENTIAL DRAFT, SUBJECT TO NDA; SUBJECT TO FRE 408 AND RULES OF SIMILAR IMPORT

3. 2 Financial Projections HIGHLY CONFIDENTIAL DRAFT, SUBJECT TO NDA; SUBJECT TO FRE 408 AND RULES OF SIMILAR IMPORT3. 2 Financial Projections HIGHLY CONFIDENTIAL DRAFT, SUBJECT TO NDA; SUBJECT TO FRE 408 AND RULES OF SIMILAR IMPORT

A 3. WholeCo HIGHLY CONFIDENTIAL DRAFT, SUBJECT TO NDA; SUBJECT TO FRE 408 AND RULES OF SIMILAR IMPORTA 3. WholeCo HIGHLY CONFIDENTIAL DRAFT, SUBJECT TO NDA; SUBJECT TO FRE 408 AND RULES OF SIMILAR IMPORT
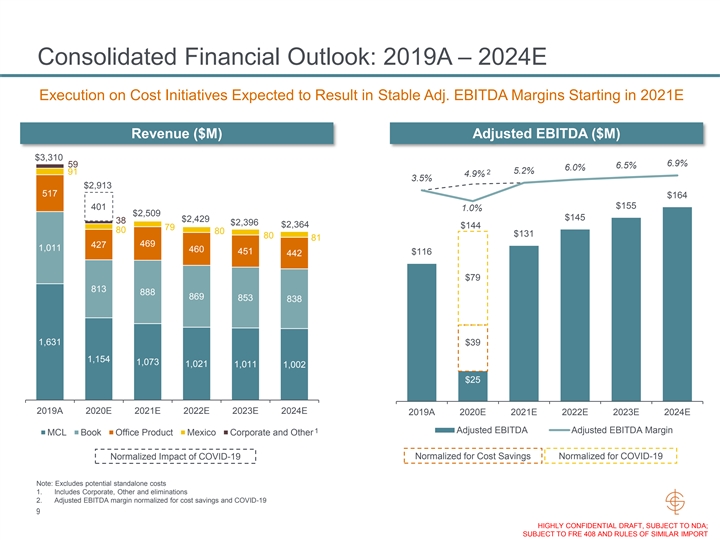
Consolidated Financial Outlook: 2019A – 2024E Execution on Cost Initiatives Expected to Result in Stable Adj. EBITDA Margins Starting in 2021E Revenue ($M) Adjusted EBITDA ($M) $3,310 6.9% 59 6.5% 6.0% 5.2% 91 2 4.9% 3.5% $2,913 517 $164 $155 401 1.0% $2,509 $145 $2,429 38 $2,396 $2,364 $144 79 80 80 $131 80 81 469 427 1,011 460 451 $116 442 $79 813 888 869 853 838 1,631 $39 1,154 1,073 1,021 1,011 1,002 $25 2019A 2020E 2021E 2022E 2023E 2024E 2019A 2020E 2021E 2022E 2023E 2024E 1 Adjusted EBITDA Adjusted EBITDA Margin MCL Book Office Product Mexico Corporate and Other Normalized for Cost Savings Normalized for COVID-19 Normalized Impact of COVID-19 Note: Excludes potential standalone costs 1. Includes Corporate, Other and eliminations 2. Adjusted EBITDA margin normalized for cost savings and COVID-19 9 HIGHLY CONFIDENTIAL DRAFT, SUBJECT TO NDA; SUBJECT TO FRE 408 AND RULES OF SIMILAR IMPORTConsolidated Financial Outlook: 2019A – 2024E Execution on Cost Initiatives Expected to Result in Stable Adj. EBITDA Margins Starting in 2021E Revenue ($M) Adjusted EBITDA ($M) $3,310 6.9% 59 6.5% 6.0% 5.2% 91 2 4.9% 3.5% $2,913 517 $164 $155 401 1.0% $2,509 $145 $2,429 38 $2,396 $2,364 $144 79 80 80 $131 80 81 469 427 1,011 460 451 $116 442 $79 813 888 869 853 838 1,631 $39 1,154 1,073 1,021 1,011 1,002 $25 2019A 2020E 2021E 2022E 2023E 2024E 2019A 2020E 2021E 2022E 2023E 2024E 1 Adjusted EBITDA Adjusted EBITDA Margin MCL Book Office Product Mexico Corporate and Other Normalized for Cost Savings Normalized for COVID-19 Normalized Impact of COVID-19 Note: Excludes potential standalone costs 1. Includes Corporate, Other and eliminations 2. Adjusted EBITDA margin normalized for cost savings and COVID-19 9 HIGHLY CONFIDENTIAL DRAFT, SUBJECT TO NDA; SUBJECT TO FRE 408 AND RULES OF SIMILAR IMPORT

2020E Pro Forma Revenue & Adj. EBITDA Summary ($ in millions) Book Office Products MCL Mexico Total Revenue $813 $427 $1,154 $80 $2,474 (+) Normalized for COVID-19 112 72 208 10 401 Adj. Normalized Revenue $925 $499 $1,362 $89 $2,875 (+) Corporate & Other 38 Adj. Consolidated Revenue $2,913 Adj. EBITDA $43 $43 ($47) $13 $52 1 (+) Normalized for Cost Savings 9 1 29 39 - (+) Normalized for COVID-19 24 16 35 4 79 Adj. Normalized EBITDA $76 $60 $17 $17 $170 (-) Net Standalone Costs (12) (4) (9) (26) - Adj. Standalone EBITDA $64 $55 $8 $17 $145 (-) Corporate & Other (26) (+) Standalone Costs 26 Adj. Consolidated EBITDA $144 1. Denotes annualized cost savings for completed or announced plant closures 10 HIGHLY CONFIDENTIAL DRAFT, SUBJECT TO NDA; SUBJECT TO FRE 408 AND RULES OF SIMILAR IMPORT 2020E 2020E2020E Pro Forma Revenue & Adj. EBITDA Summary ($ in millions) Book Office Products MCL Mexico Total Revenue $813 $427 $1,154 $80 $2,474 (+) Normalized for COVID-19 112 72 208 10 401 Adj. Normalized Revenue $925 $499 $1,362 $89 $2,875 (+) Corporate & Other 38 Adj. Consolidated Revenue $2,913 Adj. EBITDA $43 $43 ($47) $13 $52 1 (+) Normalized for Cost Savings 9 1 29 39 - (+) Normalized for COVID-19 24 16 35 4 79 Adj. Normalized EBITDA $76 $60 $17 $17 $170 (-) Net Standalone Costs (12) (4) (9) (26) - Adj. Standalone EBITDA $64 $55 $8 $17 $145 (-) Corporate & Other (26) (+) Standalone Costs 26 Adj. Consolidated EBITDA $144 1. Denotes annualized cost savings for completed or announced plant closures 10 HIGHLY CONFIDENTIAL DRAFT, SUBJECT TO NDA; SUBJECT TO FRE 408 AND RULES OF SIMILAR IMPORT 2020E 2020E

B 3. Book HIGHLY CONFIDENTIAL DRAFT, SUBJECT TO NDA; SUBJECT TO FRE 408 AND RULES OF SIMILAR IMPORTB 3. Book HIGHLY CONFIDENTIAL DRAFT, SUBJECT TO NDA; SUBJECT TO FRE 408 AND RULES OF SIMILAR IMPORT

Book | Segment Overview LSC is the Largest Book Producer and Service Provider in the U.S. Overview Key Statistics + Prints for the top 10 U.S. book publishers 1 ~$1.0B ~$80M ~8% + Serves book publishers across multiple verticals 2019 Revenue 2019 Adj. 2019 Adj. including the Trade & Specialty, K-12 Education and EBITDA EBITDA Margin Higher Education sectors + Provides end-to-end physical and digital distribution to 2 connect readers to content 500+ 6,300 24 Customers Employees Facilities + Satisfies a diverse and dynamic set of customer needs across colors, page counts, trim size, binding styles, quantities, packaging and logistics capabilities 1 2019A Revenue Breakdown + Best-in-class warehousing, distribution and fulfillment Publishing Tech capabilities coupled with embedded technology Other Trade and 3% Services 5% Specialty Procurement platforms deliver more transparency and value to <1% Publisher 1/c 39% 5% customers Services 45% Digital 21% 8% + Stable financial performance, profitability and cash flow $1.0B $1.0B Fulfillment 14% Higher Education 4/c 1. Excludes Directory; expected to be discontinued by 12/31/20 14% K-12 2. Includes Manufacturing, Distribution and Office locations that are leased and owned; 25% excludes plant closures (Philadelphia, PA) and paper warehouses 22% 11 HIGHLY CONFIDENTIAL DRAFT, SUBJECT TO NDA; SUBJECT TO FRE 408 AND RULES OF SIMILAR IMPORTBook | Segment Overview LSC is the Largest Book Producer and Service Provider in the U.S. Overview Key Statistics + Prints for the top 10 U.S. book publishers 1 ~$1.0B ~$80M ~8% + Serves book publishers across multiple verticals 2019 Revenue 2019 Adj. 2019 Adj. including the Trade & Specialty, K-12 Education and EBITDA EBITDA Margin Higher Education sectors + Provides end-to-end physical and digital distribution to 2 connect readers to content 500+ 6,300 24 Customers Employees Facilities + Satisfies a diverse and dynamic set of customer needs across colors, page counts, trim size, binding styles, quantities, packaging and logistics capabilities 1 2019A Revenue Breakdown + Best-in-class warehousing, distribution and fulfillment Publishing Tech capabilities coupled with embedded technology Other Trade and 3% Services 5% Specialty Procurement platforms deliver more transparency and value to <1% Publisher 1/c 39% 5% customers Services 45% Digital 21% 8% + Stable financial performance, profitability and cash flow $1.0B $1.0B Fulfillment 14% Higher Education 4/c 1. Excludes Directory; expected to be discontinued by 12/31/20 14% K-12 2. Includes Manufacturing, Distribution and Office locations that are leased and owned; 25% excludes plant closures (Philadelphia, PA) and paper warehouses 22% 11 HIGHLY CONFIDENTIAL DRAFT, SUBJECT TO NDA; SUBJECT TO FRE 408 AND RULES OF SIMILAR IMPORT

Book | Revenue Forecast Top-Line Revenue Expected to Stabilize Despite Secular Headwinds Commentary Revenue ($M) '19A-'24E + LSC is well-positioned to weather the secular $1,011 CAGR headwinds in physical print books due to its current 50 $925 market position, marquee customer base and ability $888 $869 to adapt to new market entrants and shift customer $853 $838 (3.7%) 112 43 213 mix 42 39 36 (6.5%) 33 + Revenue mix expected to shift towards 163 163 163 (5.2%) 163 growing Trade and Specialty sector from 182 137 ~40% of revenue in 2019 to ~50% by 2024 92 81 75 69 (12.7%) + Softness in K-12 driven by the increasing 86 adoption of digital materials by major players, 220 186 180 (5.1%) 174 169 partially offset by acquisition of new Ed-Tech 161 customer + The rise of online bookstores and book rentals is leading to a decline in demand, but 0.5% 403 402 402 401 391 offset by our market-leading customers that 351 are expected to sustain demand over the forecast period + Publisher Services expected to maintain top- 2019A 2020E 2021E 2022E 2023E 2024E line revenues Trade and Specialty K-12 2 Higher Education Publisher Services 1 Normalized Impact of COVID-19 Other 1. Includes Other manufacturing and manufacturing eliminations 2. Includes Publisher Services and eliminations as well as non-manufacturing and non-services related revenue and eliminations 12 HIGHLY CONFIDENTIAL DRAFT, SUBJECT TO NDA; SUBJECT TO FRE 408 AND RULES OF SIMILAR IMPORTBook | Revenue Forecast Top-Line Revenue Expected to Stabilize Despite Secular Headwinds Commentary Revenue ($M) '19A-'24E + LSC is well-positioned to weather the secular $1,011 CAGR headwinds in physical print books due to its current 50 $925 market position, marquee customer base and ability $888 $869 to adapt to new market entrants and shift customer $853 $838 (3.7%) 112 43 213 mix 42 39 36 (6.5%) 33 + Revenue mix expected to shift towards 163 163 163 (5.2%) 163 growing Trade and Specialty sector from 182 137 ~40% of revenue in 2019 to ~50% by 2024 92 81 75 69 (12.7%) + Softness in K-12 driven by the increasing 86 adoption of digital materials by major players, 220 186 180 (5.1%) 174 169 partially offset by acquisition of new Ed-Tech 161 customer + The rise of online bookstores and book rentals is leading to a decline in demand, but 0.5% 403 402 402 401 391 offset by our market-leading customers that 351 are expected to sustain demand over the forecast period + Publisher Services expected to maintain top- 2019A 2020E 2021E 2022E 2023E 2024E line revenues Trade and Specialty K-12 2 Higher Education Publisher Services 1 Normalized Impact of COVID-19 Other 1. Includes Other manufacturing and manufacturing eliminations 2. Includes Publisher Services and eliminations as well as non-manufacturing and non-services related revenue and eliminations 12 HIGHLY CONFIDENTIAL DRAFT, SUBJECT TO NDA; SUBJECT TO FRE 408 AND RULES OF SIMILAR IMPORT

Book | Adj. EBITDA Forecast New Technologies and a Focus on Productivity Expected to Maintain Margins Commentary Adj. EBITDA ($M) 1 7.9% 8.3% 9.0% 9.5% 10.1% 10.7% + Margins expected to remain stable as a result of $89 5.3% continued focus on improving productivity, price $86 increases, improved product mix and execution on $83 $80 $80 firm-wide initiatives to offset any expected $76 compression from volume declines + Flexible and modular platform to enable the $24 business to grow with customers and quickly adapt to shifts in demand, stabilizing margins across different volumes $9 + Company-wide initiatives expected to drive bottom- $43 line improvements + Leverage technology-driven initiatives, such as the Harvest suite and IntercepTag + Improve efficiency and utilization in warehousing and fulfillment to drive margins + Focus on pricing strategies, such as peak versus non-peak premium, to better align changing customer demand with capacity and 2019A 2020E 2021E 2022E 2023E 2024E reduce unnecessary expenditures Adjusted EBITDA Adjusted EBITDA Margin Normalized for Cost Savings Normalized for COVID-19 1. Adj. EBITDA margin normalized for cost savings and COVID-19 13 HIGHLY CONFIDENTIAL DRAFT, SUBJECT TO NDA; SUBJECT TO FRE 408 AND RULES OF SIMILAR IMPORTBook | Adj. EBITDA Forecast New Technologies and a Focus on Productivity Expected to Maintain Margins Commentary Adj. EBITDA ($M) 1 7.9% 8.3% 9.0% 9.5% 10.1% 10.7% + Margins expected to remain stable as a result of $89 5.3% continued focus on improving productivity, price $86 increases, improved product mix and execution on $83 $80 $80 firm-wide initiatives to offset any expected $76 compression from volume declines + Flexible and modular platform to enable the $24 business to grow with customers and quickly adapt to shifts in demand, stabilizing margins across different volumes $9 + Company-wide initiatives expected to drive bottom- $43 line improvements + Leverage technology-driven initiatives, such as the Harvest suite and IntercepTag + Improve efficiency and utilization in warehousing and fulfillment to drive margins + Focus on pricing strategies, such as peak versus non-peak premium, to better align changing customer demand with capacity and 2019A 2020E 2021E 2022E 2023E 2024E reduce unnecessary expenditures Adjusted EBITDA Adjusted EBITDA Margin Normalized for Cost Savings Normalized for COVID-19 1. Adj. EBITDA margin normalized for cost savings and COVID-19 13 HIGHLY CONFIDENTIAL DRAFT, SUBJECT TO NDA; SUBJECT TO FRE 408 AND RULES OF SIMILAR IMPORT

C 3. Office Products HIGHLY CONFIDENTIAL DRAFT, SUBJECT TO NDA; SUBJECT TO FRE 408 AND RULES OF SIMILAR IMPORTC 3. Office Products HIGHLY CONFIDENTIAL DRAFT, SUBJECT TO NDA; SUBJECT TO FRE 408 AND RULES OF SIMILAR IMPORT

Office Products | Segment Overview TOPS Products Overview Key Statistics + The Office Products segment of LSC Communications (“TOPS”), is an industry leader in the manufacturing of office products and stationery in ~$0.5B ~$59M ~11% North America 2019 Revenue 2019 Adj. EBITDA Adj. EBITDA Margin + TOPS offers a variety of branded and private label office products and organizational solutions in five product categories: Filing, Envelope, Binders, Note- Taking and Forms + Highly efficient manufacturing and distribution 2019 Revenue Breakdown platform alongside commitment to customers created long-standing, award-winning relationships with key Other Forms 1% office products retailers and wholesalers 9% + TOPS continuously seeks to expand its product Filing Note-Taking offerings both organically and inorganically and has a 30% 15% history of successfully integrating acquisitions + Consumer products company providing hundreds of North American-made products and market-leading, $517M recognized name brands, including: Binders 17% Envelopes 28% 14 HIGHLY CONFIDENTIAL DRAFT, SUBJECT TO NDA; SUBJECT TO FRE 408 AND RULES OF SIMILAR IMPORTOffice Products | Segment Overview TOPS Products Overview Key Statistics + The Office Products segment of LSC Communications (“TOPS”), is an industry leader in the manufacturing of office products and stationery in ~$0.5B ~$59M ~11% North America 2019 Revenue 2019 Adj. EBITDA Adj. EBITDA Margin + TOPS offers a variety of branded and private label office products and organizational solutions in five product categories: Filing, Envelope, Binders, Note- Taking and Forms + Highly efficient manufacturing and distribution 2019 Revenue Breakdown platform alongside commitment to customers created long-standing, award-winning relationships with key Other Forms 1% office products retailers and wholesalers 9% + TOPS continuously seeks to expand its product Filing Note-Taking offerings both organically and inorganically and has a 30% 15% history of successfully integrating acquisitions + Consumer products company providing hundreds of North American-made products and market-leading, $517M recognized name brands, including: Binders 17% Envelopes 28% 14 HIGHLY CONFIDENTIAL DRAFT, SUBJECT TO NDA; SUBJECT TO FRE 408 AND RULES OF SIMILAR IMPORT
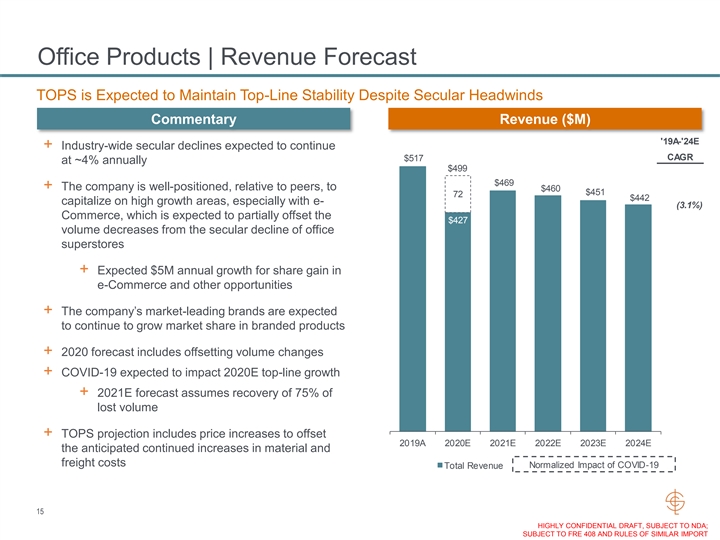
Office Products | Revenue Forecast TOPS is Expected to Maintain Top-Line Stability Despite Secular Headwinds Commentary Revenue ($M) '19A-'24E + Industry-wide secular declines expected to continue CAGR $517 at ~4% annually $499 $469 + The company is well-positioned, relative to peers, to $460 $451 72 $442 capitalize on high growth areas, especially with e- (3.1%) Commerce, which is expected to partially offset the $427 volume decreases from the secular decline of office superstores + Expected $5M annual growth for share gain in e-Commerce and other opportunities + The company’s market-leading brands are expected to continue to grow market share in branded products + 2020 forecast includes offsetting volume changes + COVID-19 expected to impact 2020E top-line growth + 2021E forecast assumes recovery of 75% of lost volume + TOPS projection includes price increases to offset 2019A 2020E 2021E 2022E 2023E 2024E the anticipated continued increases in material and freight costs Normalized Impact of COVID-19 Total Revenue 15 HIGHLY CONFIDENTIAL DRAFT, SUBJECT TO NDA; SUBJECT TO FRE 408 AND RULES OF SIMILAR IMPORTOffice Products | Revenue Forecast TOPS is Expected to Maintain Top-Line Stability Despite Secular Headwinds Commentary Revenue ($M) '19A-'24E + Industry-wide secular declines expected to continue CAGR $517 at ~4% annually $499 $469 + The company is well-positioned, relative to peers, to $460 $451 72 $442 capitalize on high growth areas, especially with e- (3.1%) Commerce, which is expected to partially offset the $427 volume decreases from the secular decline of office superstores + Expected $5M annual growth for share gain in e-Commerce and other opportunities + The company’s market-leading brands are expected to continue to grow market share in branded products + 2020 forecast includes offsetting volume changes + COVID-19 expected to impact 2020E top-line growth + 2021E forecast assumes recovery of 75% of lost volume + TOPS projection includes price increases to offset 2019A 2020E 2021E 2022E 2023E 2024E the anticipated continued increases in material and freight costs Normalized Impact of COVID-19 Total Revenue 15 HIGHLY CONFIDENTIAL DRAFT, SUBJECT TO NDA; SUBJECT TO FRE 408 AND RULES OF SIMILAR IMPORT

Office Products | Adj. EBITDA Forecast Proactive Steps are Expected to Lead to Stable Margins Over the Projection Period Commentary Adj. EBITDA ($M) 1 12.7% 12.6% 12.8% 12.7% 12.0% 11.4% + Projected to maintain stable double-digit margins over the forecast period 10.0% + Margin impacts reflect secular decline and volume adjustments at ~18% variable margin $60 $60 $59 $58 $58 rates $56 + Price increases expected to deliver ~5% $16 incremental Adj. EBITDA $1 + Plant consolidations expected to deliver cost $43 savings of $4M in 2020 and $2M in 2021 + COVID-19 impacts include both volume and productivity declines + 2021E forecast assumes recovery of 75% of lost volume and return to 100% productivity + New manufacturing and quality processes expected to drive lower cost production model, stabilizing margins in spite of general industry-wide volume declines 2019A 2020E 2021E 2022E 2023E 2024E Adjusted EBITDA Adjusted EBITDA Margin + Capex requirements are minimal given historical investment in plants and equipment Normalized for Cost Savings Normalized for COVID-19 1. Adj. EBITDA margin normalized for cost savings and COVID-19 16 HIGHLY CONFIDENTIAL DRAFT, SUBJECT TO NDA; SUBJECT TO FRE 408 AND RULES OF SIMILAR IMPORTOffice Products | Adj. EBITDA Forecast Proactive Steps are Expected to Lead to Stable Margins Over the Projection Period Commentary Adj. EBITDA ($M) 1 12.7% 12.6% 12.8% 12.7% 12.0% 11.4% + Projected to maintain stable double-digit margins over the forecast period 10.0% + Margin impacts reflect secular decline and volume adjustments at ~18% variable margin $60 $60 $59 $58 $58 rates $56 + Price increases expected to deliver ~5% $16 incremental Adj. EBITDA $1 + Plant consolidations expected to deliver cost $43 savings of $4M in 2020 and $2M in 2021 + COVID-19 impacts include both volume and productivity declines + 2021E forecast assumes recovery of 75% of lost volume and return to 100% productivity + New manufacturing and quality processes expected to drive lower cost production model, stabilizing margins in spite of general industry-wide volume declines 2019A 2020E 2021E 2022E 2023E 2024E Adjusted EBITDA Adjusted EBITDA Margin + Capex requirements are minimal given historical investment in plants and equipment Normalized for Cost Savings Normalized for COVID-19 1. Adj. EBITDA margin normalized for cost savings and COVID-19 16 HIGHLY CONFIDENTIAL DRAFT, SUBJECT TO NDA; SUBJECT TO FRE 408 AND RULES OF SIMILAR IMPORT

D 3. Magazine, Catalog and Logistics (MCL) HIGHLY CONFIDENTIAL DRAFT, SUBJECT TO NDA; SUBJECT TO FRE 408 AND RULES OF SIMILAR IMPORTD 3. Magazine, Catalog and Logistics (MCL) HIGHLY CONFIDENTIAL DRAFT, SUBJECT TO NDA; SUBJECT TO FRE 408 AND RULES OF SIMILAR IMPORT

MCL | Segment Overview Leading Producer of Magazines, Catalogs & Digital Print with a Full Suite of Value-Added Services Overview Key Statistics 2 + Print: Produces catalogs, magazines & retail inserts ~1,100 14 to customer specifications using offset, gravure or Magazine Production digital printing processes in combination with in-line Customers Facilities finishing, saddle-stitch binding or patent binding + One of the largest producers of catalogs, ~300 10 Catalog Warehouse & Distribution magazines and retail inserts in North America Customers Centers + Leader in “print-first” Short-Run, niche / enthusiast publications 28B 95% + Logistics: Supply chain management offering Pieces of Mail Distributed Of Population Reached in <2 3 Annually days includes procurement, warehousing, distribution and inventory management 2019 Revenue Breakdown + Strategically-located national footprint of 1 Other warehouse and distribution centers 6% Continuum + Logistics offering leveraged for not only our 5% Co-Services customers but also by other major printers and 6% third party customers Long Run + Cooperative Mailing Services (Co-Services): 45% ~$1.6B Differentiated co-mail services offering includes list Logistics processing and mail sortation services that optimize 21% postal costs for magazine and catalog customers Print 1. Other revenue includes Creel, Digital Lizard, Premedia, MC Other and MC eliminations 2. Reflects the current number of facilities excluding the 3 facilities that were announced to be closed as of April 2020 3. Denotes distribution time from LSC’s consolidation centers Short Run 17 17% HIGHLY CONFIDENTIAL DRAFT, SUBJECT TO NDA; SUBJECT TO FRE 408 AND RULES OF SIMILAR IMPORTMCL | Segment Overview Leading Producer of Magazines, Catalogs & Digital Print with a Full Suite of Value-Added Services Overview Key Statistics 2 + Print: Produces catalogs, magazines & retail inserts ~1,100 14 to customer specifications using offset, gravure or Magazine Production digital printing processes in combination with in-line Customers Facilities finishing, saddle-stitch binding or patent binding + One of the largest producers of catalogs, ~300 10 Catalog Warehouse & Distribution magazines and retail inserts in North America Customers Centers + Leader in “print-first” Short-Run, niche / enthusiast publications 28B 95% + Logistics: Supply chain management offering Pieces of Mail Distributed Of Population Reached in <2 3 Annually days includes procurement, warehousing, distribution and inventory management 2019 Revenue Breakdown + Strategically-located national footprint of 1 Other warehouse and distribution centers 6% Continuum + Logistics offering leveraged for not only our 5% Co-Services customers but also by other major printers and 6% third party customers Long Run + Cooperative Mailing Services (Co-Services): 45% ~$1.6B Differentiated co-mail services offering includes list Logistics processing and mail sortation services that optimize 21% postal costs for magazine and catalog customers Print 1. Other revenue includes Creel, Digital Lizard, Premedia, MC Other and MC eliminations 2. Reflects the current number of facilities excluding the 3 facilities that were announced to be closed as of April 2020 3. Denotes distribution time from LSC’s consolidation centers Short Run 17 17% HIGHLY CONFIDENTIAL DRAFT, SUBJECT TO NDA; SUBJECT TO FRE 408 AND RULES OF SIMILAR IMPORT

MCL | Revenue Forecast Revenue Forecast Reflects a Return to Stability After Plant Consolidation Commentary Revenue ($M) Proactive plant closures, further accelerated by Revenue CAGR + Significant decline in Long-Run Magazine and COVID-19 Catalog is driving company’s proactive strategic '19 - '21 '21 - '24 initiatives to i) rationalize plant capacity, which has (18.9%) (2.3%) $1,631 been accelerated by COVID-19, ii) exit unprofitable 101 customers and iii) smooth out seasonal customer 81 demand Right-sized go-forward business plan $1,362 92 + Long-Run Magazine and Catalog expected to 208 347 decline from ~45% of revenue in 2019 to $1,073 74 $1,021 $1,011 $1,002 28 ~32% by 2024 63 84 30 33 37 84 109 77 118 127 + Short-Run Magazine decline is expected to be 282 71 69 67 271 in line with secular declines 290 264 260 257 + Near-term softness in Logistics revenue driven by 218 decline in Magazine / Catalog volumes, but partially 218 206 200 194 offset by increased integration of services by cross- 729 selling Co-Services to all print customers, especially 444 375 340 330 320 in Short-Run / niche market + Long-term revenue outlook expected to stabilize in 2019A 2020E 2021E 2022E 2023E 2024E line with secular decline once the business has been 1 right-sized Long Run Short Run Logistics Co-Services Continuum Other Normalized Impact of COVID-19 1. Other revenue includes Creel, Premedia, MC Other and MC eliminations 18 HIGHLY CONFIDENTIAL DRAFT, SUBJECT TO NDA; SUBJECT TO FRE 408 AND RULES OF SIMILAR IMPORTMCL | Revenue Forecast Revenue Forecast Reflects a Return to Stability After Plant Consolidation Commentary Revenue ($M) Proactive plant closures, further accelerated by Revenue CAGR + Significant decline in Long-Run Magazine and COVID-19 Catalog is driving company’s proactive strategic '19 - '21 '21 - '24 initiatives to i) rationalize plant capacity, which has (18.9%) (2.3%) $1,631 been accelerated by COVID-19, ii) exit unprofitable 101 customers and iii) smooth out seasonal customer 81 demand Right-sized go-forward business plan $1,362 92 + Long-Run Magazine and Catalog expected to 208 347 decline from ~45% of revenue in 2019 to $1,073 74 $1,021 $1,011 $1,002 28 ~32% by 2024 63 84 30 33 37 84 109 77 118 127 + Short-Run Magazine decline is expected to be 282 71 69 67 271 in line with secular declines 290 264 260 257 + Near-term softness in Logistics revenue driven by 218 decline in Magazine / Catalog volumes, but partially 218 206 200 194 offset by increased integration of services by cross- 729 selling Co-Services to all print customers, especially 444 375 340 330 320 in Short-Run / niche market + Long-term revenue outlook expected to stabilize in 2019A 2020E 2021E 2022E 2023E 2024E line with secular decline once the business has been 1 right-sized Long Run Short Run Logistics Co-Services Continuum Other Normalized Impact of COVID-19 1. Other revenue includes Creel, Premedia, MC Other and MC eliminations 18 HIGHLY CONFIDENTIAL DRAFT, SUBJECT TO NDA; SUBJECT TO FRE 408 AND RULES OF SIMILAR IMPORT
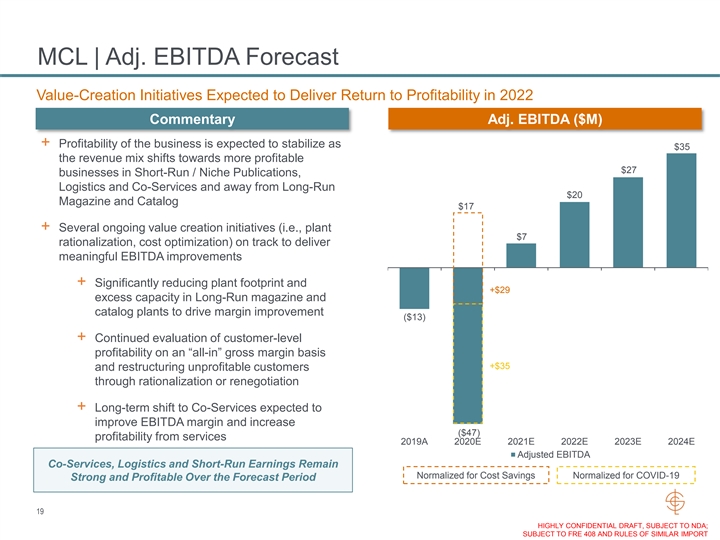
MCL | Adj. EBITDA Forecast Value-Creation Initiatives Expected to Deliver Return to Profitability in 2022 Commentary Adj. EBITDA ($M) + Profitability of the business is expected to stabilize as $35 the revenue mix shifts towards more profitable $27 businesses in Short-Run / Niche Publications, Logistics and Co-Services and away from Long-Run $20 Magazine and Catalog $17 + Several ongoing value creation initiatives (i.e., plant $7 rationalization, cost optimization) on track to deliver meaningful EBITDA improvements + Significantly reducing plant footprint and +$29 excess capacity in Long-Run magazine and catalog plants to drive margin improvement ($13) + Continued evaluation of customer-level profitability on an “all-in” gross margin basis +$35 and restructuring unprofitable customers through rationalization or renegotiation + Long-term shift to Co-Services expected to improve EBITDA margin and increase ($47) profitability from services 2019A 2020E 2021E 2022E 2023E 2024E Adjusted EBITDA Co-Services, Logistics and Short-Run Earnings Remain Normalized for Cost Savings Normalized for COVID-19 Strong and Profitable Over the Forecast Period 19 HIGHLY CONFIDENTIAL DRAFT, SUBJECT TO NDA; SUBJECT TO FRE 408 AND RULES OF SIMILAR IMPORTMCL | Adj. EBITDA Forecast Value-Creation Initiatives Expected to Deliver Return to Profitability in 2022 Commentary Adj. EBITDA ($M) + Profitability of the business is expected to stabilize as $35 the revenue mix shifts towards more profitable $27 businesses in Short-Run / Niche Publications, Logistics and Co-Services and away from Long-Run $20 Magazine and Catalog $17 + Several ongoing value creation initiatives (i.e., plant $7 rationalization, cost optimization) on track to deliver meaningful EBITDA improvements + Significantly reducing plant footprint and +$29 excess capacity in Long-Run magazine and catalog plants to drive margin improvement ($13) + Continued evaluation of customer-level profitability on an “all-in” gross margin basis +$35 and restructuring unprofitable customers through rationalization or renegotiation + Long-term shift to Co-Services expected to improve EBITDA margin and increase ($47) profitability from services 2019A 2020E 2021E 2022E 2023E 2024E Adjusted EBITDA Co-Services, Logistics and Short-Run Earnings Remain Normalized for Cost Savings Normalized for COVID-19 Strong and Profitable Over the Forecast Period 19 HIGHLY CONFIDENTIAL DRAFT, SUBJECT TO NDA; SUBJECT TO FRE 408 AND RULES OF SIMILAR IMPORT

MCL | Facilities Large Footprint to Support Customer Needs Est. Property 2 # of FTE Union Status Size (Sq. Ft.) Ownership Value ($M) Manufacturing Facilities Long Run Baraboo, WI 332 Non-Union 165,000 Leased NA Danville, KY 741 Non-Union 821,000 Owned 8.6 Lancaster, PA 1,178 Non-Union 1,503,000 Owned 18.3 Maple Grove, MN 328 Non-Union 317,000 Owned 13.0 Spartanburg, SC 380 Non-Union 910,000 Owned 13.0 Warsaw, IN 699 Non-Union 1,300,000 Owned 6.9 Short Run 3 Pontiac, IL 371 Non-Union 304,000 Owned 1.7 3 Kansas City, MO 304 Non-Union 260,000 Owned 4.1 Lebanon Junction, KY 781 Non-Union 165,630 Owned 15.3 Senatobia, MS 130 Non-Union 140,000 Owned 3.0 1 Commercial Print Las Vegas, NV (Offset) 341 Non-Union 614,000 Leased NA Las Vegas, NV (Digital) 70 Non-Union 205,618 Leased NA Mahwah, NJ (Digital) 56 Non-Union 34,308 Leased NA Hayden, ID (Digital) 19 Non-Union 4,800 Leased NA 1. Commercial Print is LSC’s acquisition of Digital Lizard, and its previous parent company Creel, which occurred in August 2017 2. As of July and August 2020 3. Estimated Property Values per Management 20 HIGHLY CONFIDENTIAL DRAFT, SUBJECT TO NDA; SUBJECT TO FRE 408 AND RULES OF SIMILAR IMPORTMCL | Facilities Large Footprint to Support Customer Needs Est. Property 2 # of FTE Union Status Size (Sq. Ft.) Ownership Value ($M) Manufacturing Facilities Long Run Baraboo, WI 332 Non-Union 165,000 Leased NA Danville, KY 741 Non-Union 821,000 Owned 8.6 Lancaster, PA 1,178 Non-Union 1,503,000 Owned 18.3 Maple Grove, MN 328 Non-Union 317,000 Owned 13.0 Spartanburg, SC 380 Non-Union 910,000 Owned 13.0 Warsaw, IN 699 Non-Union 1,300,000 Owned 6.9 Short Run 3 Pontiac, IL 371 Non-Union 304,000 Owned 1.7 3 Kansas City, MO 304 Non-Union 260,000 Owned 4.1 Lebanon Junction, KY 781 Non-Union 165,630 Owned 15.3 Senatobia, MS 130 Non-Union 140,000 Owned 3.0 1 Commercial Print Las Vegas, NV (Offset) 341 Non-Union 614,000 Leased NA Las Vegas, NV (Digital) 70 Non-Union 205,618 Leased NA Mahwah, NJ (Digital) 56 Non-Union 34,308 Leased NA Hayden, ID (Digital) 19 Non-Union 4,800 Leased NA 1. Commercial Print is LSC’s acquisition of Digital Lizard, and its previous parent company Creel, which occurred in August 2017 2. As of July and August 2020 3. Estimated Property Values per Management 20 HIGHLY CONFIDENTIAL DRAFT, SUBJECT TO NDA; SUBJECT TO FRE 408 AND RULES OF SIMILAR IMPORT

MCL | Facilities (Cont’d) Large Footprint to Support Customer Needs Est. Property # of FTE Union Status Size (Sq. Ft.) Ownership Value ($M) Warehouses Logistics Atlanta, GA 1 Non-Union 135,200 Leased NA Bolingbrook, IL 3 Non-Union 659,157 Leased NA Bolingbrook, IL 44 Non-Union 417,090 Leased NA Grapevine, TX 3 Non-Union 82,093 Leased NA Laredo, TX 1 Non-Union 10,750 Leased NA Pico Rivera, CA 10 Non-Union 160,154 Leased NA Pine Brook, NJ 8 Non-Union 41,194 Leased NA Portland, OR 8 Non-Union 54,573 Leased NA Stockton, CA 11 Non-Union 48,735 Leased NA York, PA 25 Non-Union 597,600 Leased NA 21 HIGHLY CONFIDENTIAL DRAFT, SUBJECT TO NDA; SUBJECT TO FRE 408 AND RULES OF SIMILAR IMPORTMCL | Facilities (Cont’d) Large Footprint to Support Customer Needs Est. Property # of FTE Union Status Size (Sq. Ft.) Ownership Value ($M) Warehouses Logistics Atlanta, GA 1 Non-Union 135,200 Leased NA Bolingbrook, IL 3 Non-Union 659,157 Leased NA Bolingbrook, IL 44 Non-Union 417,090 Leased NA Grapevine, TX 3 Non-Union 82,093 Leased NA Laredo, TX 1 Non-Union 10,750 Leased NA Pico Rivera, CA 10 Non-Union 160,154 Leased NA Pine Brook, NJ 8 Non-Union 41,194 Leased NA Portland, OR 8 Non-Union 54,573 Leased NA Stockton, CA 11 Non-Union 48,735 Leased NA York, PA 25 Non-Union 597,600 Leased NA 21 HIGHLY CONFIDENTIAL DRAFT, SUBJECT TO NDA; SUBJECT TO FRE 408 AND RULES OF SIMILAR IMPORT

E 3. Mexico HIGHLY CONFIDENTIAL DRAFT, SUBJECT TO NDA; SUBJECT TO FRE 408 AND RULES OF SIMILAR IMPORTE 3. Mexico HIGHLY CONFIDENTIAL DRAFT, SUBJECT TO NDA; SUBJECT TO FRE 408 AND RULES OF SIMILAR IMPORT

Mexico | Segment Overview LSC Mexico is a Standalone Low Cost, High Quality Producer of Magazine, Catalog and Books Overview Key Statistics + Mexico segment consists of three locations; two plants based in Tlalnepantla and San Juan Del Río, $91M ~20% and the headquarters also based in Tlalnepantla 2019 Revenue 2019 Adj. EBITDA Margin + The segment operates on a standalone basis managing the sales, production and collection + Segment Mix: ~380 ~1,150 2 Customers Employees Plants + Catalogs and Magazines account for 81% of revenue + One location is dedicated to printing variable data, forms and labels 2019 Revenue Breakdown + Strong customer base representing all the major ■ Commercial Printing catalog clients in Mexico + Commercial Printing + Robust financial trends: 19% + Catalogs + Magazines + Demonstrated top-line stability and earnings + Books growth $91M ■ Business & Commercial + Economically sustainable operation generating Services (BCS) earnings and paying dividends + Statements, forms, labels 81% + Digital Color Printing + In the last three years, EBITDA margins have + Direct Mail been more than 17% + Fulfillment 1. 2020E Revenue growth based on 3-year historical exchange rate of 19.5 Mexican pesos per USD 22 HIGHLY CONFIDENTIAL DRAFT, SUBJECT TO NDA; SUBJECT TO FRE 408 AND RULES OF SIMILAR IMPORTMexico | Segment Overview LSC Mexico is a Standalone Low Cost, High Quality Producer of Magazine, Catalog and Books Overview Key Statistics + Mexico segment consists of three locations; two plants based in Tlalnepantla and San Juan Del Río, $91M ~20% and the headquarters also based in Tlalnepantla 2019 Revenue 2019 Adj. EBITDA Margin + The segment operates on a standalone basis managing the sales, production and collection + Segment Mix: ~380 ~1,150 2 Customers Employees Plants + Catalogs and Magazines account for 81% of revenue + One location is dedicated to printing variable data, forms and labels 2019 Revenue Breakdown + Strong customer base representing all the major ■ Commercial Printing catalog clients in Mexico + Commercial Printing + Robust financial trends: 19% + Catalogs + Magazines + Demonstrated top-line stability and earnings + Books growth $91M ■ Business & Commercial + Economically sustainable operation generating Services (BCS) earnings and paying dividends + Statements, forms, labels 81% + Digital Color Printing + In the last three years, EBITDA margins have + Direct Mail been more than 17% + Fulfillment 1. 2020E Revenue growth based on 3-year historical exchange rate of 19.5 Mexican pesos per USD 22 HIGHLY CONFIDENTIAL DRAFT, SUBJECT TO NDA; SUBJECT TO FRE 408 AND RULES OF SIMILAR IMPORT

Mexico | Facilities Strategically-Located Facilities to Best Serve Our Customers Overview Mexico Facility Locations Tlalnepantla (Mexico City Metro Area) - HQ San Juan Del Río + 99 employees in SG&A, Finance, IT, HR and Legal roles San Juan Del Río plant + 862 employees, 642 of whom are unionized + Invoices 81% of total Mexico revenue and serves 83 clients + Main products: catalogs, magazines, books and commercial printing + Annual production capacity of 1.5B of 16S pages in 8 web presses Tlalnepantla Tlalnepantla Tlalnepantla plant (Mexico City + 186 employees, 42 of whom are unionized Metro Area) (HQ) + Invoices 19% of total Mexico revenue and serves 300 All 3 Mexico Facilities are Strategically Located clients Near Client Plants + Main products: BCS (i.e., statements, forms and labels), direct mail, digital color printing and fulfillment 23 HIGHLY CONFIDENTIAL DRAFT, SUBJECT TO NDA; SUBJECT TO FRE 408 AND RULES OF SIMILAR IMPORTMexico | Facilities Strategically-Located Facilities to Best Serve Our Customers Overview Mexico Facility Locations Tlalnepantla (Mexico City Metro Area) - HQ San Juan Del Río + 99 employees in SG&A, Finance, IT, HR and Legal roles San Juan Del Río plant + 862 employees, 642 of whom are unionized + Invoices 81% of total Mexico revenue and serves 83 clients + Main products: catalogs, magazines, books and commercial printing + Annual production capacity of 1.5B of 16S pages in 8 web presses Tlalnepantla Tlalnepantla Tlalnepantla plant (Mexico City + 186 employees, 42 of whom are unionized Metro Area) (HQ) + Invoices 19% of total Mexico revenue and serves 300 All 3 Mexico Facilities are Strategically Located clients Near Client Plants + Main products: BCS (i.e., statements, forms and labels), direct mail, digital color printing and fulfillment 23 HIGHLY CONFIDENTIAL DRAFT, SUBJECT TO NDA; SUBJECT TO FRE 408 AND RULES OF SIMILAR IMPORT
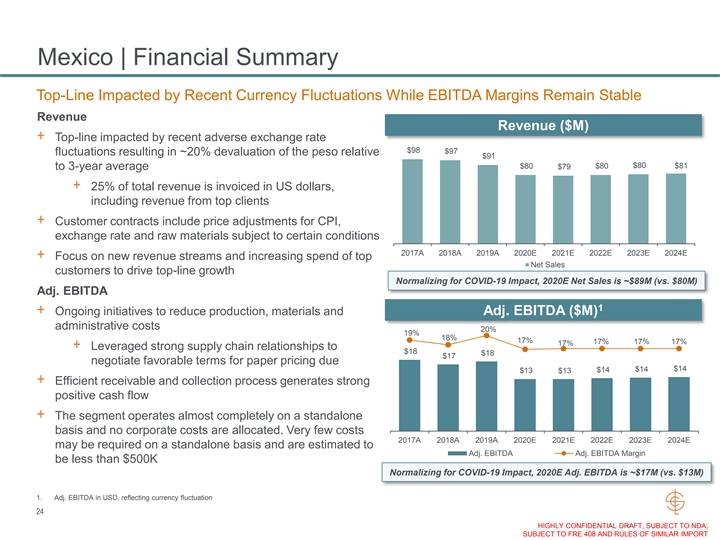
Mexico | Financial Summary Top-Line Impacted by Recent Currency Fluctuations While EBITDA Margins Remain Stable Revenue Revenue ($M) + Top-line impacted by recent adverse exchange rate $98 $97 fluctuations resulting in ~20% devaluation of the peso relative $91 $80 $81 $80 $79 $80 to 3-year average + 25% of total revenue is invoiced in US dollars, including revenue from top clients + Customer contracts include price adjustments for CPI, exchange rate and raw materials subject to certain conditions 2017A 2018A 2019A 2020E 2021E 2022E 2023E 2024E + Focus on new revenue streams and increasing spend of top Net Sales customers to drive top-line growth Normalizing for COVID-19 Impact, 2020E Net Sales is ~$89M (vs. $80M) Adj. EBITDA 1 + Ongoing initiatives to reduce production, materials and Adj. EBITDA ($M) administrative costs 20% 19% 18% 17% 17% 17% 17% 17% + Leveraged strong supply chain relationships to $18 $18 $17 negotiate favorable terms for paper pricing due $14 $14 $14 $13 $13 + Efficient receivable and collection process generates strong positive cash flow + The segment operates almost completely on a standalone basis and no corporate costs are allocated. Very few costs 2017A 2018A 2019A 2020E 2021E 2022E 2023E 2024E may be required on a standalone basis and are estimated to Adj. EBITDA Adj. EBITDA Margin be less than $500K Normalizing for COVID-19 Impact, 2020E Adj. EBITDA is ~$17M (vs. $13M) 1. Adj. EBITDA in USD, reflecting currency fluctuation 24 HIGHLY CONFIDENTIAL DRAFT, SUBJECT TO NDA; SUBJECT TO FRE 408 AND RULES OF SIMILAR IMPORTMexico | Financial Summary Top-Line Impacted by Recent Currency Fluctuations While EBITDA Margins Remain Stable Revenue Revenue ($M) + Top-line impacted by recent adverse exchange rate $98 $97 fluctuations resulting in ~20% devaluation of the peso relative $91 $80 $81 $80 $79 $80 to 3-year average + 25% of total revenue is invoiced in US dollars, including revenue from top clients + Customer contracts include price adjustments for CPI, exchange rate and raw materials subject to certain conditions 2017A 2018A 2019A 2020E 2021E 2022E 2023E 2024E + Focus on new revenue streams and increasing spend of top Net Sales customers to drive top-line growth Normalizing for COVID-19 Impact, 2020E Net Sales is ~$89M (vs. $80M) Adj. EBITDA 1 + Ongoing initiatives to reduce production, materials and Adj. EBITDA ($M) administrative costs 20% 19% 18% 17% 17% 17% 17% 17% + Leveraged strong supply chain relationships to $18 $18 $17 negotiate favorable terms for paper pricing due $14 $14 $14 $13 $13 + Efficient receivable and collection process generates strong positive cash flow + The segment operates almost completely on a standalone basis and no corporate costs are allocated. Very few costs 2017A 2018A 2019A 2020E 2021E 2022E 2023E 2024E may be required on a standalone basis and are estimated to Adj. EBITDA Adj. EBITDA Margin be less than $500K Normalizing for COVID-19 Impact, 2020E Adj. EBITDA is ~$17M (vs. $13M) 1. Adj. EBITDA in USD, reflecting currency fluctuation 24 HIGHLY CONFIDENTIAL DRAFT, SUBJECT TO NDA; SUBJECT TO FRE 408 AND RULES OF SIMILAR IMPORT

Appendix HIGHLY CONFIDENTIAL DRAFT, SUBJECT TO NDA; SUBJECT TO FRE 408 AND RULES OF SIMILAR IMPORTAppendix HIGHLY CONFIDENTIAL DRAFT, SUBJECT TO NDA; SUBJECT TO FRE 408 AND RULES OF SIMILAR IMPORT

Consolidated Financial Summary ($ in millions) 2017A 2018A 2019A 2020E 2021E 2022E 2023E 2024E Book $1,022 $1,056 $1,011 $813 $888 $869 $853 $838 Office Products 589 562 517 427 469 460 451 442 Magazine, Catalog and Logistics 1,939 1,883 1,631 1,154 1,073 1,021 1,011 1,002 Mexico 98 97 91 80 79 80 80 81 1 Corporate and Other 107 84 59 38 - - - - Total Revenue $3,756 $3,681 $3,310 $2,512 $2,509 $2,429 $2,396 $2,364 Materials ($1,450) ($1,290) ($1,185) ($850) ($888) ($870) ($857) ($845) Labor (1,040) (1,007) (958) (771) (704) (666) (651) (637) Transportation (218) (435) (356) (270) (262) (251) (253) (255) Overhead (301) (292) (290) (227) (186) (167) (157) (147) Other (128) (125) (108) (87) (89) (86) (82) (78) Cost of Sales ($3,137) ($3,149) ($2,898) ($2,204) ($2,129) ($2,041) ($2,000) ($1,963) Gross Profit $619 $532 $412 $308 $381 $389 $395 $401 Gross Margin % 16.5% 14.5% 12.4% 12.3% 15.2% 16.0% 16.5% 17.0% Selling ($52) ($50) ($49) ($42) ($40) ($38) ($37) ($37) G&A (230) (217) (219) (187) (195) (191) (189) (186) SG&A ($282) ($267) ($268) ($229) ($235) ($229) ($226) ($223) EBITDA $338 $265 $144 $79 $146 $160 $170 $178 EBITDA Margin % 9.0% 7.2% 4.4% 3.2% 5.8% 6.6% 7.1% 7.5% Non-Cash Pension Income ($46) ($49) ($36) ($41) ($41) ($41) ($41) ($41) Stock-Based Compensation 13 12 7 - - - - - Annual Incentive Compensation (0) 0 5 0 12 12 12 12 Cash Awards 2 1 2 6 6 6 6 6 LIFO Reserve Adjustment (1) (5) (6) (19) - - - - 401(k) Match Suspension - - - - 7 7 7 7 Adj. EBITDA $305 $224 $116 $25 $131 $145 $155 $164 Adj. EBITDA Margin % 8.1% 6.1% 3.5% 1.0% 5.2% 6.0% 6.5% 6.9% Memo: Adj. EBITDA Normalized for Cost Savings Initiatives $64 Adj. EBITDA Normalized for Cost Savings Initiatives & COVID-19 144 1. Includes Directory and intercompany eliminations 25 HIGHLY CONFIDENTIAL DRAFT, SUBJECT TO NDA; SUBJECT TO FRE 408 AND RULES OF SIMILAR IMPORTConsolidated Financial Summary ($ in millions) 2017A 2018A 2019A 2020E 2021E 2022E 2023E 2024E Book $1,022 $1,056 $1,011 $813 $888 $869 $853 $838 Office Products 589 562 517 427 469 460 451 442 Magazine, Catalog and Logistics 1,939 1,883 1,631 1,154 1,073 1,021 1,011 1,002 Mexico 98 97 91 80 79 80 80 81 1 Corporate and Other 107 84 59 38 - - - - Total Revenue $3,756 $3,681 $3,310 $2,512 $2,509 $2,429 $2,396 $2,364 Materials ($1,450) ($1,290) ($1,185) ($850) ($888) ($870) ($857) ($845) Labor (1,040) (1,007) (958) (771) (704) (666) (651) (637) Transportation (218) (435) (356) (270) (262) (251) (253) (255) Overhead (301) (292) (290) (227) (186) (167) (157) (147) Other (128) (125) (108) (87) (89) (86) (82) (78) Cost of Sales ($3,137) ($3,149) ($2,898) ($2,204) ($2,129) ($2,041) ($2,000) ($1,963) Gross Profit $619 $532 $412 $308 $381 $389 $395 $401 Gross Margin % 16.5% 14.5% 12.4% 12.3% 15.2% 16.0% 16.5% 17.0% Selling ($52) ($50) ($49) ($42) ($40) ($38) ($37) ($37) G&A (230) (217) (219) (187) (195) (191) (189) (186) SG&A ($282) ($267) ($268) ($229) ($235) ($229) ($226) ($223) EBITDA $338 $265 $144 $79 $146 $160 $170 $178 EBITDA Margin % 9.0% 7.2% 4.4% 3.2% 5.8% 6.6% 7.1% 7.5% Non-Cash Pension Income ($46) ($49) ($36) ($41) ($41) ($41) ($41) ($41) Stock-Based Compensation 13 12 7 - - - - - Annual Incentive Compensation (0) 0 5 0 12 12 12 12 Cash Awards 2 1 2 6 6 6 6 6 LIFO Reserve Adjustment (1) (5) (6) (19) - - - - 401(k) Match Suspension - - - - 7 7 7 7 Adj. EBITDA $305 $224 $116 $25 $131 $145 $155 $164 Adj. EBITDA Margin % 8.1% 6.1% 3.5% 1.0% 5.2% 6.0% 6.5% 6.9% Memo: Adj. EBITDA Normalized for Cost Savings Initiatives $64 Adj. EBITDA Normalized for Cost Savings Initiatives & COVID-19 144 1. Includes Directory and intercompany eliminations 25 HIGHLY CONFIDENTIAL DRAFT, SUBJECT TO NDA; SUBJECT TO FRE 408 AND RULES OF SIMILAR IMPORT
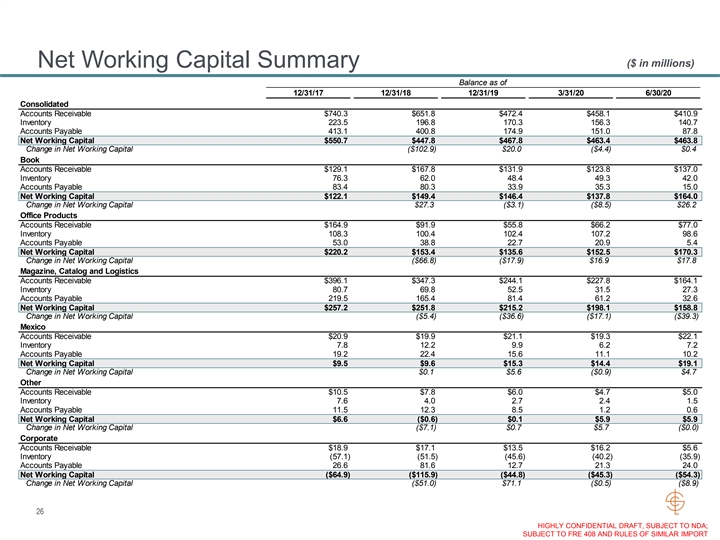
($ in millions) Net Working Capital Summary Balance as of 12/31/17 12/31/18 12/31/19 3/31/20 6/30/20 Consolidated Accounts Receivable $740.3 $651.8 $472.4 $458.1 $410.9 Inventory 223.5 196.8 170.3 156.3 140.7 Accounts Payable 413.1 400.8 174.9 151.0 87.8 Net Working Capital $550.7 $447.8 $467.8 $463.4 $463.8 Change in Net Working Capital ($102.9) $20.0 ($4.4) $0.4 Book Accounts Receivable $129.1 $167.8 $131.9 $123.8 $137.0 Inventory 76.3 62.0 48.4 49.3 42.0 Accounts Payable 83.4 80.3 33.9 35.3 15.0 Net Working Capital $122.1 $149.4 $146.4 $137.8 $164.0 Change in Net Working Capital $27.3 ($3.1) ($8.5) $26.2 Office Products Accounts Receivable $164.9 $91.9 $55.8 $66.2 $77.0 Inventory 108.3 100.4 102.4 107.2 98.6 Accounts Payable 53.0 38.8 22.7 20.9 5.4 Net Working Capital $220.2 $153.4 $135.6 $152.5 $170.3 Change in Net Working Capital ($66.8) ($17.9) $16.9 $17.8 Magazine, Catalog and Logistics Accounts Receivable $396.1 $347.3 $244.1 $227.8 $164.1 Inventory 80.7 69.8 52.5 31.5 27.3 Accounts Payable 219.5 165.4 81.4 61.2 32.6 Net Working Capital $257.2 $251.8 $215.2 $198.1 $158.8 Change in Net Working Capital ($5.4) ($36.6) ($17.1) ($39.3) Mexico Accounts Receivable $20.9 $19.9 $21.1 $19.3 $22.1 Inventory 7.8 12.2 9.9 6.2 7.2 Accounts Payable 19.2 22.4 15.6 11.1 10.2 Net Working Capital $9.5 $9.6 $15.3 $14.4 $19.1 Change in Net Working Capital $0.1 $5.6 ($0.9) $4.7 Other Accounts Receivable $10.5 $7.8 $6.0 $4.7 $5.0 Inventory 7.6 4.0 2.7 2.4 1.5 Accounts Payable 11.5 12.3 8.5 1.2 0.6 Net Working Capital $6.6 ($0.6) $0.1 $5.9 $5.9 Change in Net Working Capital ($7.1) $0.7 $5.7 ($0.0) Corporate Accounts Receivable $18.9 $17.1 $13.5 $16.2 $5.6 Inventory (57.1) (51.5) (45.6) (40.2) (35.9) Accounts Payable 26.6 81.6 12.7 21.3 24.0 Net Working Capital ($64.9) ($115.9) ($44.8) ($45.3) ($54.3) Change in Net Working Capital ($51.0) $71.1 ($0.5) ($8.9) 26 HIGHLY CONFIDENTIAL DRAFT, SUBJECT TO NDA; SUBJECT TO FRE 408 AND RULES OF SIMILAR IMPORT($ in millions) Net Working Capital Summary Balance as of 12/31/17 12/31/18 12/31/19 3/31/20 6/30/20 Consolidated Accounts Receivable $740.3 $651.8 $472.4 $458.1 $410.9 Inventory 223.5 196.8 170.3 156.3 140.7 Accounts Payable 413.1 400.8 174.9 151.0 87.8 Net Working Capital $550.7 $447.8 $467.8 $463.4 $463.8 Change in Net Working Capital ($102.9) $20.0 ($4.4) $0.4 Book Accounts Receivable $129.1 $167.8 $131.9 $123.8 $137.0 Inventory 76.3 62.0 48.4 49.3 42.0 Accounts Payable 83.4 80.3 33.9 35.3 15.0 Net Working Capital $122.1 $149.4 $146.4 $137.8 $164.0 Change in Net Working Capital $27.3 ($3.1) ($8.5) $26.2 Office Products Accounts Receivable $164.9 $91.9 $55.8 $66.2 $77.0 Inventory 108.3 100.4 102.4 107.2 98.6 Accounts Payable 53.0 38.8 22.7 20.9 5.4 Net Working Capital $220.2 $153.4 $135.6 $152.5 $170.3 Change in Net Working Capital ($66.8) ($17.9) $16.9 $17.8 Magazine, Catalog and Logistics Accounts Receivable $396.1 $347.3 $244.1 $227.8 $164.1 Inventory 80.7 69.8 52.5 31.5 27.3 Accounts Payable 219.5 165.4 81.4 61.2 32.6 Net Working Capital $257.2 $251.8 $215.2 $198.1 $158.8 Change in Net Working Capital ($5.4) ($36.6) ($17.1) ($39.3) Mexico Accounts Receivable $20.9 $19.9 $21.1 $19.3 $22.1 Inventory 7.8 12.2 9.9 6.2 7.2 Accounts Payable 19.2 22.4 15.6 11.1 10.2 Net Working Capital $9.5 $9.6 $15.3 $14.4 $19.1 Change in Net Working Capital $0.1 $5.6 ($0.9) $4.7 Other Accounts Receivable $10.5 $7.8 $6.0 $4.7 $5.0 Inventory 7.6 4.0 2.7 2.4 1.5 Accounts Payable 11.5 12.3 8.5 1.2 0.6 Net Working Capital $6.6 ($0.6) $0.1 $5.9 $5.9 Change in Net Working Capital ($7.1) $0.7 $5.7 ($0.0) Corporate Accounts Receivable $18.9 $17.1 $13.5 $16.2 $5.6 Inventory (57.1) (51.5) (45.6) (40.2) (35.9) Accounts Payable 26.6 81.6 12.7 21.3 24.0 Net Working Capital ($64.9) ($115.9) ($44.8) ($45.3) ($54.3) Change in Net Working Capital ($51.0) $71.1 ($0.5) ($8.9) 26 HIGHLY CONFIDENTIAL DRAFT, SUBJECT TO NDA; SUBJECT TO FRE 408 AND RULES OF SIMILAR IMPORT

Capital Expenditures Summary ($ in millions) 2017A Q1 2018A Q2 2018A Q3 2018A Q4 2018A 2018A Q1 2019A Q2 2019A Q3 2019A Q4 2019A 2019A Q1 2020A Q2 2020E Q3 2020E Q4 2020E 2020E 2021E 2022E 2023E 2024E Capital Expenditures by Segment Book $13 $9 $9 $6 $6 $31 $17 $7 $4 $2 $30 $4 $2 $4 $5 $15 $21 $17 $16 $16 Office Products 5 1 0 0 0 1 0 1 0 1 2 0 0 0 0 1 3 3 3 3 Magazine, Catalog and Logistics 25 8 5 7 4 25 10 12 7 6 35 6 4 7 5 22 18 12 8 8 Mexico 6 0 0 0 0 1 1 0 0 0 1 0 0 0 0 1 - - - - Other 1 0 0 0 0 0 - 0 0 - 0 - - - - - 2 1 1 1 Corporate 8 1 1 1 1 4 0 1 0 1 3 0 0 1 1 2 4 2 2 2 Total Capital Expenditures $56 $19 $16 $14 $12 $62 $28 $21 $11 $11 $71 $11 $7 $12 $11 $41 $47 $35 $30 $30 Total Capital Expenditure Breakdown Book 23.0% 47.4% 55.9% 43.0% 52.9% 49.7% 62.5% 31.1% 32.5% 22.0% 42.3% 37.3% 31.3% 33.6% 44.5% 37.1% 44.7% 48.6% 53.3% 53.3% Office Products 8.5% 2.7% 2.9% 2.4% 0.3% 2.2% 0.5% 5.2% 1.9% 6.5% 3.0% 1.4% 4.3% 1.1% 0.5% 1.5% 6.4% 8.6% 10.0% 10.0% Magazine, Catalog and Logistics 43.9% 43.5% 32.6% 46.8% 35.3% 39.8% 34.1% 56.5% 59.7% 60.7% 48.8% 57.5% 57.5% 57.7% 45.6% 54.5% 38.3% 34.3% 26.7% 26.7% Mexico 10.0% 1.5% 0.9% 0.9% 2.5% 1.4% 1.9% 2.2% 1.9% 2.0% 2.0% 0.3% 0.3% 3.2% 0.6% 1.3% 0.0% 0.0% 0.0% 0.0% Other 0.9% 0.0% 0.5% 0.2% 1.8% 0.5% 0.0% 0.6% 0.1% 0.0% 0.2% 0.0% 0.0% 0.0% 0.0% 0.0% 3.2% 2.9% 3.3% 3.3% Corporate 13.7% 4.9% 7.0% 6.7% 7.1% 6.3% 1.0% 4.5% 3.9% 8.7% 3.7% 3.5% 6.6% 4.3% 8.8% 5.6% 7.4% 5.7% 6.7% 6.7% Total Capital Expenditures 100.0% 100.0% 100.0% 100.0% 100.0% 100.0% 100.0% 100.0% 100.0% 100.0% 100.0% 100.0% 100.0% 100.0% 100.0% 100.0% 100.0% 100.0% 100.0% 100.0% 27 HIGHLY CONFIDENTIAL DRAFT, SUBJECT TO NDA; SUBJECT TO FRE 408 AND RULES OF SIMILAR IMPORTCapital Expenditures Summary ($ in millions) 2017A Q1 2018A Q2 2018A Q3 2018A Q4 2018A 2018A Q1 2019A Q2 2019A Q3 2019A Q4 2019A 2019A Q1 2020A Q2 2020E Q3 2020E Q4 2020E 2020E 2021E 2022E 2023E 2024E Capital Expenditures by Segment Book $13 $9 $9 $6 $6 $31 $17 $7 $4 $2 $30 $4 $2 $4 $5 $15 $21 $17 $16 $16 Office Products 5 1 0 0 0 1 0 1 0 1 2 0 0 0 0 1 3 3 3 3 Magazine, Catalog and Logistics 25 8 5 7 4 25 10 12 7 6 35 6 4 7 5 22 18 12 8 8 Mexico 6 0 0 0 0 1 1 0 0 0 1 0 0 0 0 1 - - - - Other 1 0 0 0 0 0 - 0 0 - 0 - - - - - 2 1 1 1 Corporate 8 1 1 1 1 4 0 1 0 1 3 0 0 1 1 2 4 2 2 2 Total Capital Expenditures $56 $19 $16 $14 $12 $62 $28 $21 $11 $11 $71 $11 $7 $12 $11 $41 $47 $35 $30 $30 Total Capital Expenditure Breakdown Book 23.0% 47.4% 55.9% 43.0% 52.9% 49.7% 62.5% 31.1% 32.5% 22.0% 42.3% 37.3% 31.3% 33.6% 44.5% 37.1% 44.7% 48.6% 53.3% 53.3% Office Products 8.5% 2.7% 2.9% 2.4% 0.3% 2.2% 0.5% 5.2% 1.9% 6.5% 3.0% 1.4% 4.3% 1.1% 0.5% 1.5% 6.4% 8.6% 10.0% 10.0% Magazine, Catalog and Logistics 43.9% 43.5% 32.6% 46.8% 35.3% 39.8% 34.1% 56.5% 59.7% 60.7% 48.8% 57.5% 57.5% 57.7% 45.6% 54.5% 38.3% 34.3% 26.7% 26.7% Mexico 10.0% 1.5% 0.9% 0.9% 2.5% 1.4% 1.9% 2.2% 1.9% 2.0% 2.0% 0.3% 0.3% 3.2% 0.6% 1.3% 0.0% 0.0% 0.0% 0.0% Other 0.9% 0.0% 0.5% 0.2% 1.8% 0.5% 0.0% 0.6% 0.1% 0.0% 0.2% 0.0% 0.0% 0.0% 0.0% 0.0% 3.2% 2.9% 3.3% 3.3% Corporate 13.7% 4.9% 7.0% 6.7% 7.1% 6.3% 1.0% 4.5% 3.9% 8.7% 3.7% 3.5% 6.6% 4.3% 8.8% 5.6% 7.4% 5.7% 6.7% 6.7% Total Capital Expenditures 100.0% 100.0% 100.0% 100.0% 100.0% 100.0% 100.0% 100.0% 100.0% 100.0% 100.0% 100.0% 100.0% 100.0% 100.0% 100.0% 100.0% 100.0% 100.0% 100.0% 27 HIGHLY CONFIDENTIAL DRAFT, SUBJECT TO NDA; SUBJECT TO FRE 408 AND RULES OF SIMILAR IMPORT

Tax Profile + Estimated 2020 Non-GAAP effective tax rate is expected to be negative, consisting of an insignificant benefit on the US loss and a provision on international income + US has a full valuation allowance and tax benefit is limited to minor refundable credits + Impact of the contemplated restructuring and/or sale transactions could be material to the estimated rate + Cash tax payments for international entities of approximately $5 million annually; no US cash income taxes expected in 2020 or 2021 + Interest expense carryforward of $137 million as of December 31, 2019 ($32 million deferred tax asset) + Other carryforwards include foreign tax credits ($10 million tax affected) and NOLs (tax affected value of $8 million states and $1 million federal) + Company is evaluating tax elections for 2019 that could generate an NOL (if carryback is available) or taxable income (to preserve foreign tax credits) + $13 million remaining US 2017 transition tax on foreign earnings, payments will be deferred into 2021 and beyond 28 HIGHLY CONFIDENTIAL DRAFT, SUBJECT TO NDA; SUBJECT TO FRE 408 AND RULES OF SIMILAR IMPORTTax Profile + Estimated 2020 Non-GAAP effective tax rate is expected to be negative, consisting of an insignificant benefit on the US loss and a provision on international income + US has a full valuation allowance and tax benefit is limited to minor refundable credits + Impact of the contemplated restructuring and/or sale transactions could be material to the estimated rate + Cash tax payments for international entities of approximately $5 million annually; no US cash income taxes expected in 2020 or 2021 + Interest expense carryforward of $137 million as of December 31, 2019 ($32 million deferred tax asset) + Other carryforwards include foreign tax credits ($10 million tax affected) and NOLs (tax affected value of $8 million states and $1 million federal) + Company is evaluating tax elections for 2019 that could generate an NOL (if carryback is available) or taxable income (to preserve foreign tax credits) + $13 million remaining US 2017 transition tax on foreign earnings, payments will be deferred into 2021 and beyond 28 HIGHLY CONFIDENTIAL DRAFT, SUBJECT TO NDA; SUBJECT TO FRE 408 AND RULES OF SIMILAR IMPORT