Attached files
| file | filename |
|---|---|
| 8-K - 8-K - HOME BANCSHARES INC | homb-8k_20200915.htm |
HOMB Office Fireside Chat 15 September 2020
Forward Looking Statement This presentation may contain forward-looking statements regarding the Company’s plans, expectations, goals and outlook for the future. Statements in this presentation that are not historical facts should be considered forward-looking statements within the meaning of the Private Securities Litigation Reform Act of 1995. Forward-looking statements of this type speak only as of the date of this presentation. By nature, forward-looking statements involve inherent risk and uncertainties. Various factors could cause actual results to differ materially from those contemplated by the forward-looking statements. These factors include, but are not limited to, the following: economic conditions, credit quality, interest rates, loan demand, disruptions and uncertainties in our business and operations as a result of the ongoing coronavirus pandemic, the ability to successfully integrate new acquisitions, legislative and regulatory changes and risks associated with current and future regulations, technological changes and cybersecurity risks, competition from other financial institutions, changes in the assumptions used in making the forward-looking statements, and other factors described in reports we file with the Securities and Exchange Commission (the “SEC”), including those factors set forth in our Annual Report on Form 10-K for the year ended December 31, 2019 filed with the SEC on February 26, 2020, and our Quarterly Report on Form 10-Q for the quarter ended June 30, 2020, filed with the SEC on August 5, 2020.
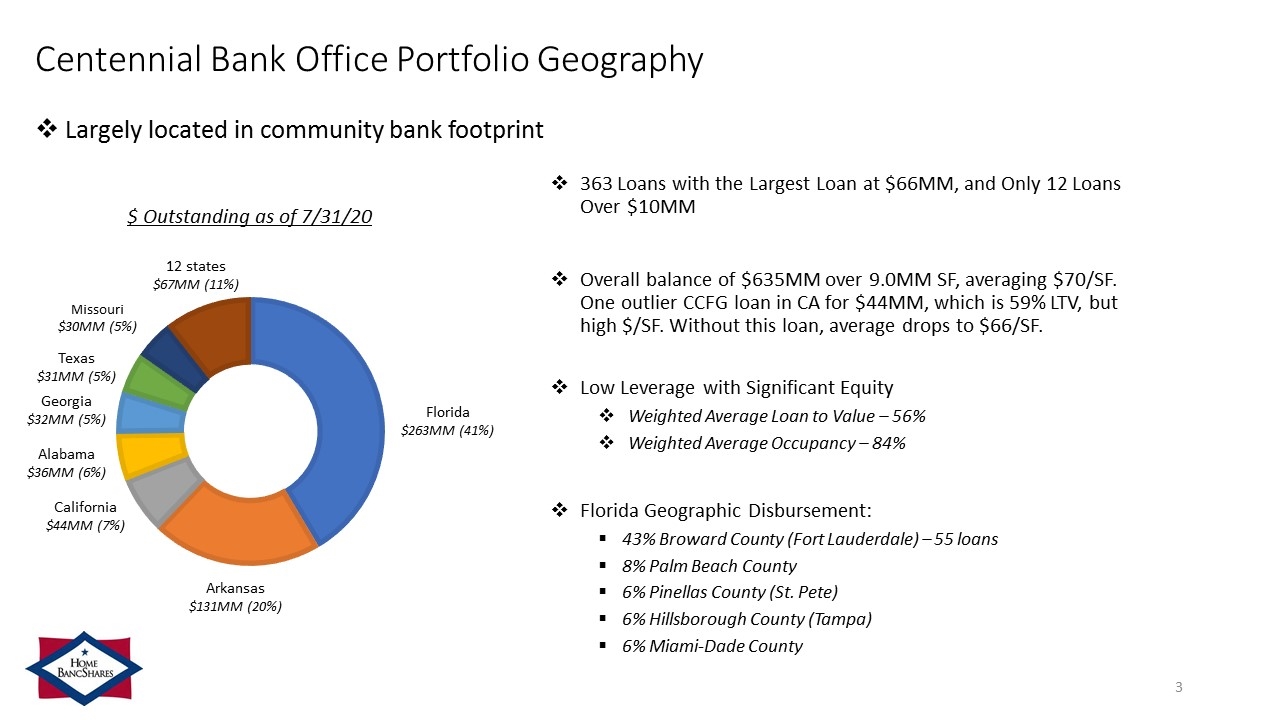
Centennial Bank Office Portfolio Geography 363 Loans with the Largest Loan at $66MM, and Only 12 Loans Over $10MM Overall balance of $635MM over 9.0MM SF, averaging $70/SF. One outlier CCFG loan in CA for $44MM, which is 59% LTV, but high $/SF. Without this loan, average drops to $66/SF. Low Leverage with Significant Equity Weighted Average Loan to Value – 56% Weighted Average Occupancy – 84% Florida Geographic Disbursement: 43% Broward County (Fort Lauderdale) – 55 loans 8% Palm Beach County 6% Pinellas County (St. Pete) 6% Hillsborough County (Tampa) 6% Miami-Dade County $ Outstanding as of 7/31/20 Texas $31MM (5%) Florida $263MM (41%) Arkansas $131MM (20%) 12 states $67MM (11%) Largely located in community bank footprint Missouri $30MM (5%) Georgia $32MM (5%) Alabama $36MM (6%) California $44MM (7%)
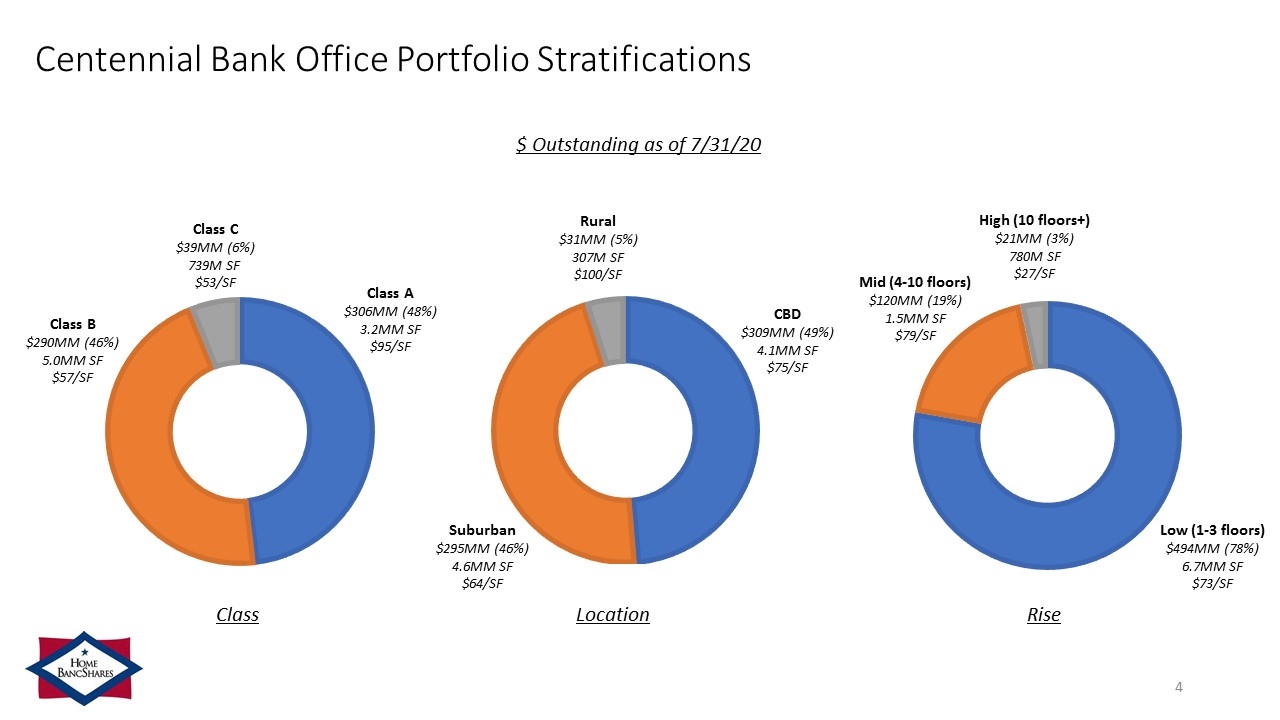
Centennial Bank Office Portfolio Stratifications $ Outstanding as of 7/31/20 Class A $306MM (48%) 3.2MM SF $95/SF Class B $290MM (46%) 5.0MM SF $57/SF Class C $39MM (6%) 739M SF $53/SF Class High (10 floors+) $21MM (3%) 780M SF $27/SF Rural $31MM (5%) 307M SF $100/SF Suburban $295MM (46%) 4.6MM SF $64/SF Location Rise CBD $309MM (49%) 4.1MM SF $75/SF Low (1-3 floors) $494MM (78%) 6.7MM SF $73/SF Mid (4-10 floors) $120MM (19%) 1.5MM SF $79/SF
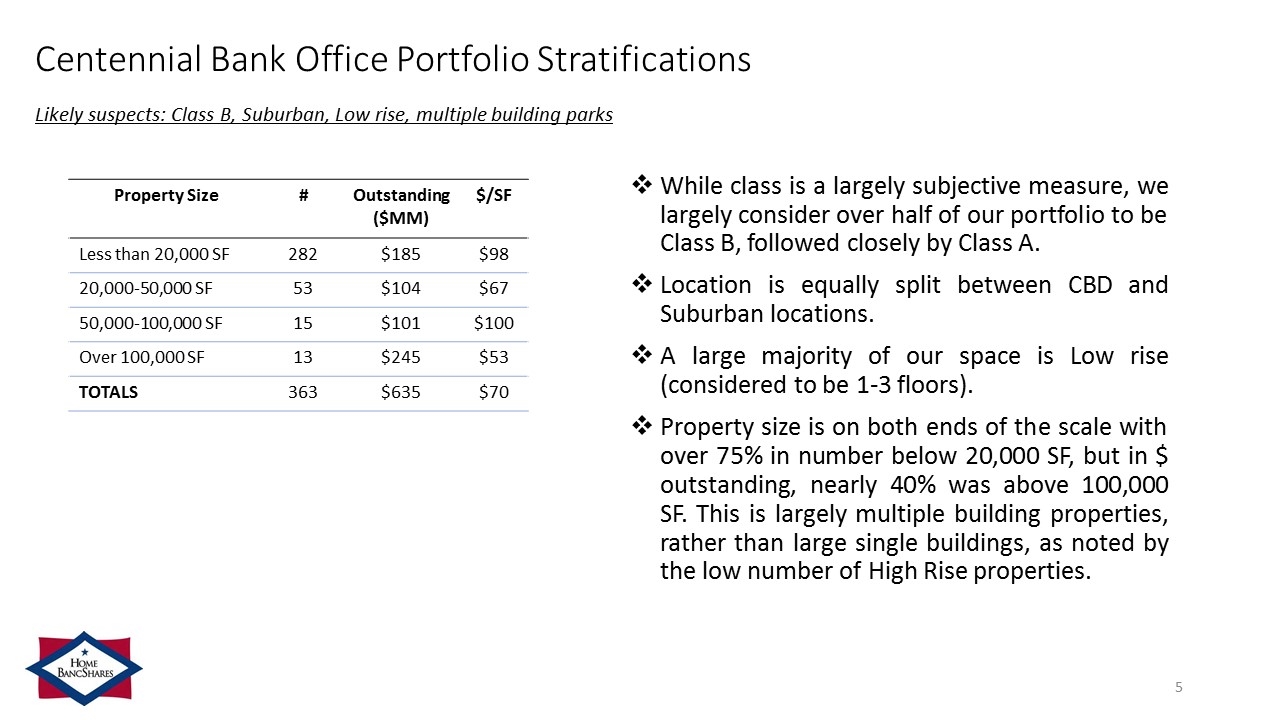
Centennial Bank Office Portfolio Stratifications Likely suspects: Class B, Suburban, Low rise, multiple building parks Property Size # Outstanding ($MM) $/SF Less than 20,000 SF 282 $185 $98 20,000-50,000 SF 53 $104 $67 50,000-100,000 SF 15 $101 $100 Over 100,000 SF 13 $245 $53 TOTALS 363 $635 $70 While class is a largely subjective measure, we largely consider over half of our portfolio to be Class B, followed closely by Class A. Location is equally split between CBD and Suburban locations. A large majority of our space is Low rise (considered to be 1-3 floors). Property size is on both ends of the scale with over 75% in number below 20,000 SF, but in $ outstanding, nearly 40% was above 100,000 SF. This is largely multiple building properties, rather than large single buildings, as noted by the low number of High Rise properties.
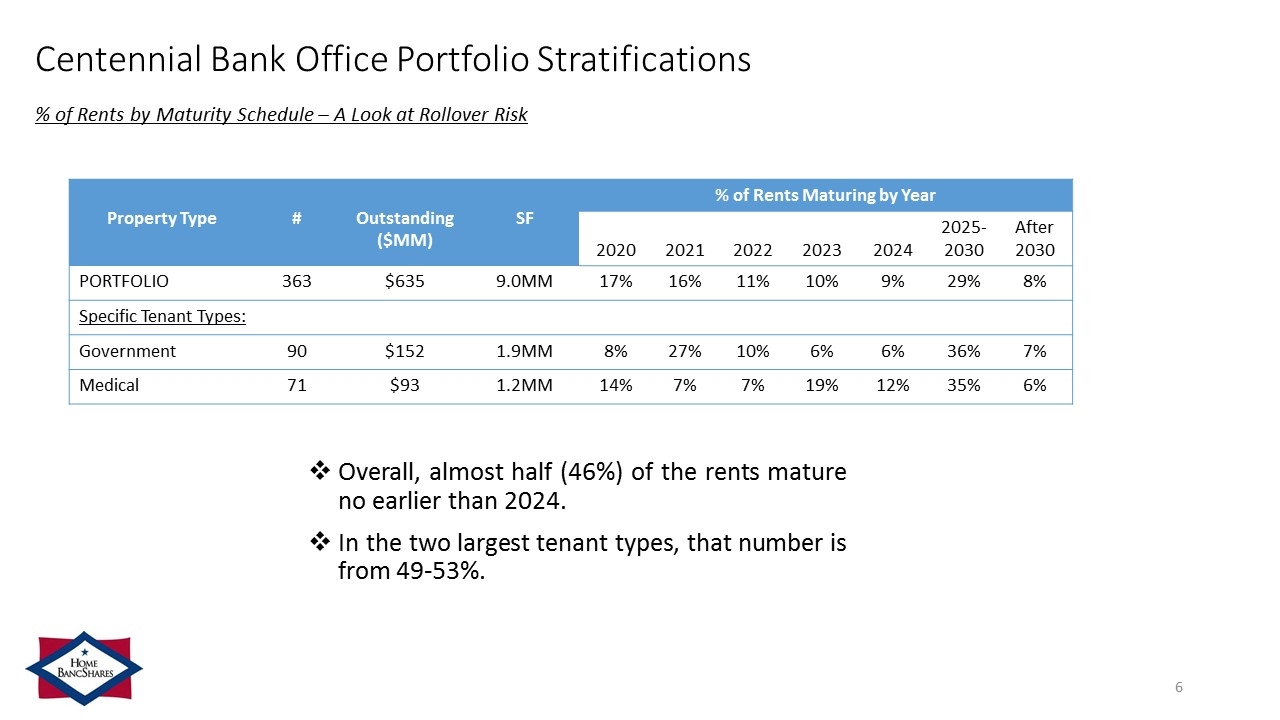
Centennial Bank Office Portfolio Stratifications % of Rents by Maturity Schedule – A Look at Rollover Risk Property Type # Outstanding ($MM) SF % of Rents Maturing by Year 2020 2021 2022 2023 2024 2025-2030 After 2030 PORTFOLIO 363 $635 9.0MM 17% 16% 11% 10% 9% 29% 8% Specific Tenant Types: Government 90 $152 1.9MM 8% 27% 10% 6% 6% 36% 7% Medical 71 $93 1.2MM 14% 7% 7% 19% 12% 35% 6% Overall, almost half (46%) of the rents mature no earlier than 2024. In the two largest tenant types, that number is from 49-53%.
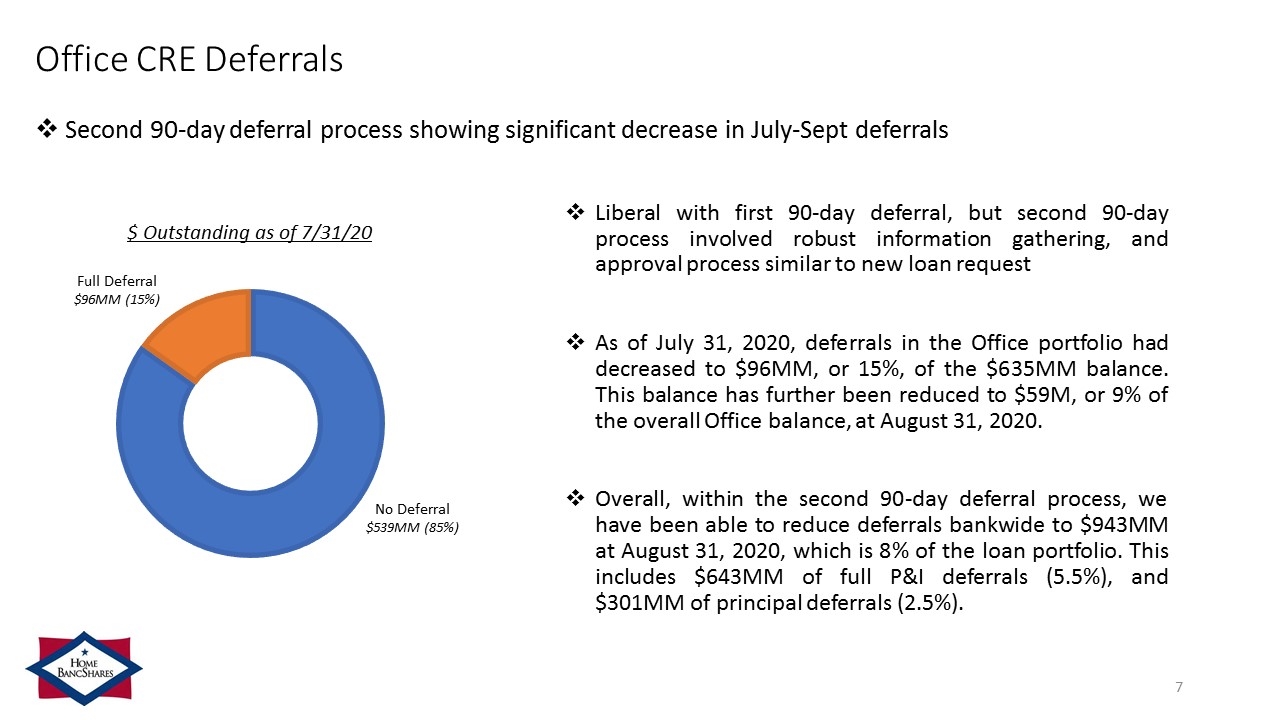
Office CRE Deferrals Liberal with first 90-day deferral, but second 90-day process involved robust information gathering, and approval process similar to new loan request As of July 31, 2020, deferrals in the Office portfolio had decreased to $96MM, or 15%, of the $635MM balance. This balance has further been reduced to $59M, or 9% of the overall Office balance, at August 31, 2020. Overall, within the second 90-day deferral process, we have been able to reduce deferrals bankwide to $943MM at August 31, 2020, which is 8% of the loan portfolio. This includes $643MM of full P&I deferrals (5.5%), and $301MM of principal deferrals (2.5%). $ Outstanding as of 7/31/20 Full Deferral $96MM (15%) No Deferral $539MM (85%) Second 90-day deferral process showing significant decrease in July-Sept deferrals
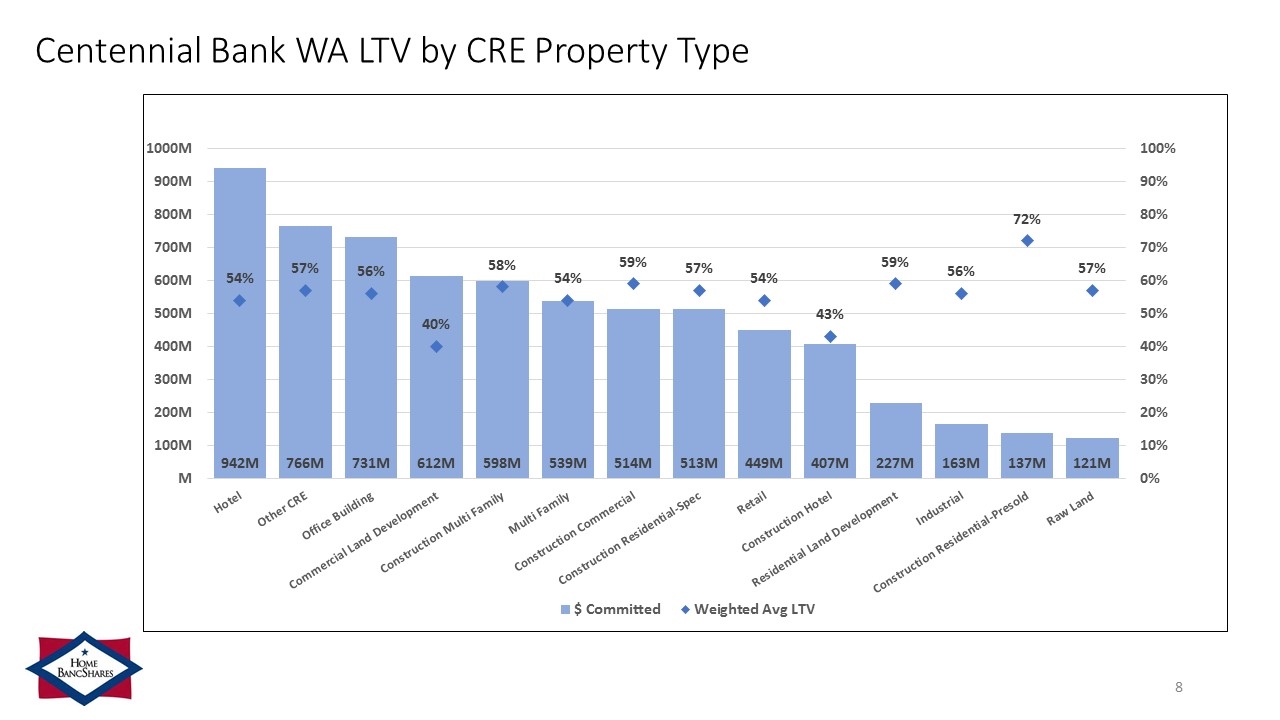
Centennial Bank WA LTV by CRE Property Type
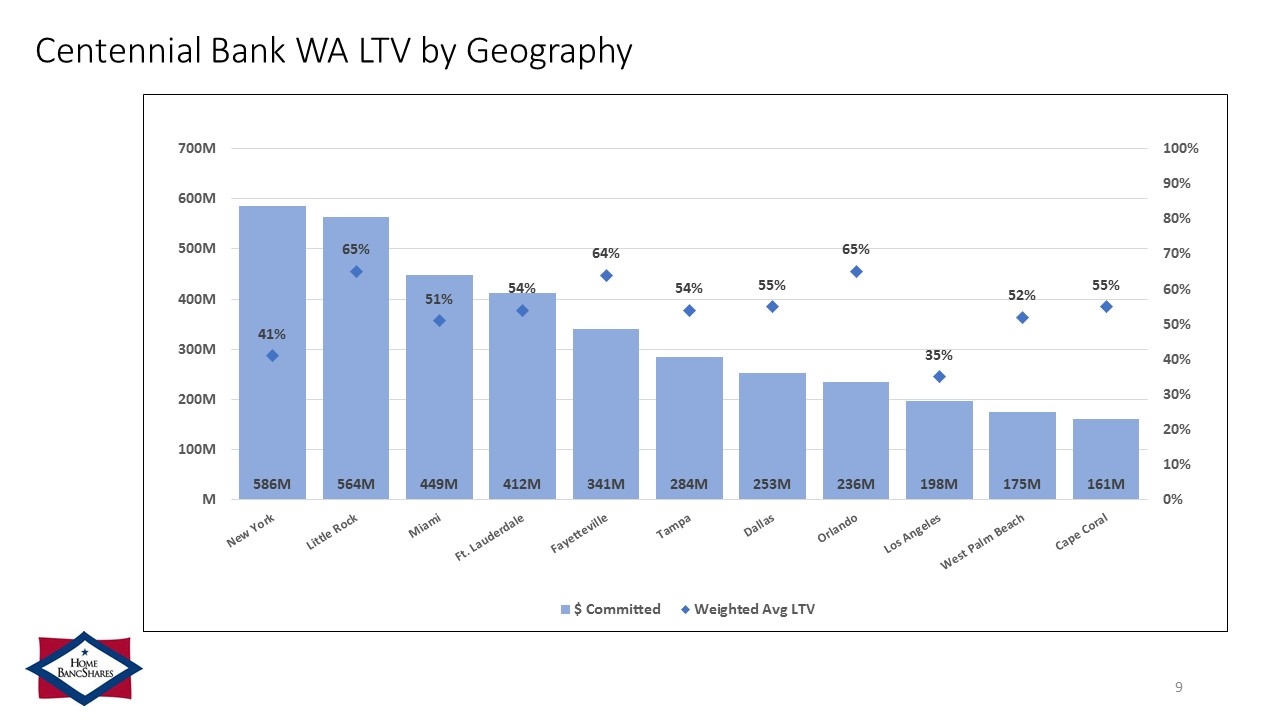
Centennial Bank WA LTV by Geography

Contact Information Corporate Headquarters Home BancShares, Inc. 719 Harkrider Street, Suite 100 P.O. Box 966 Conway, AR 72033 Financial Information Donna Townsell Director of Investor Relations (501) 328-4625 Website www.homebancshares.com
NASDAQ: HOMB | September 2020 www.homebancshares.com
