Attached files
| file | filename |
|---|---|
| EX-99.1 - EX-99.1 - Del Taco Restaurants, Inc. | tacoex99120200915.htm |
| 8-K - 8-K - Del Taco Restaurants, Inc. | taco-20200915.htm |
2
3
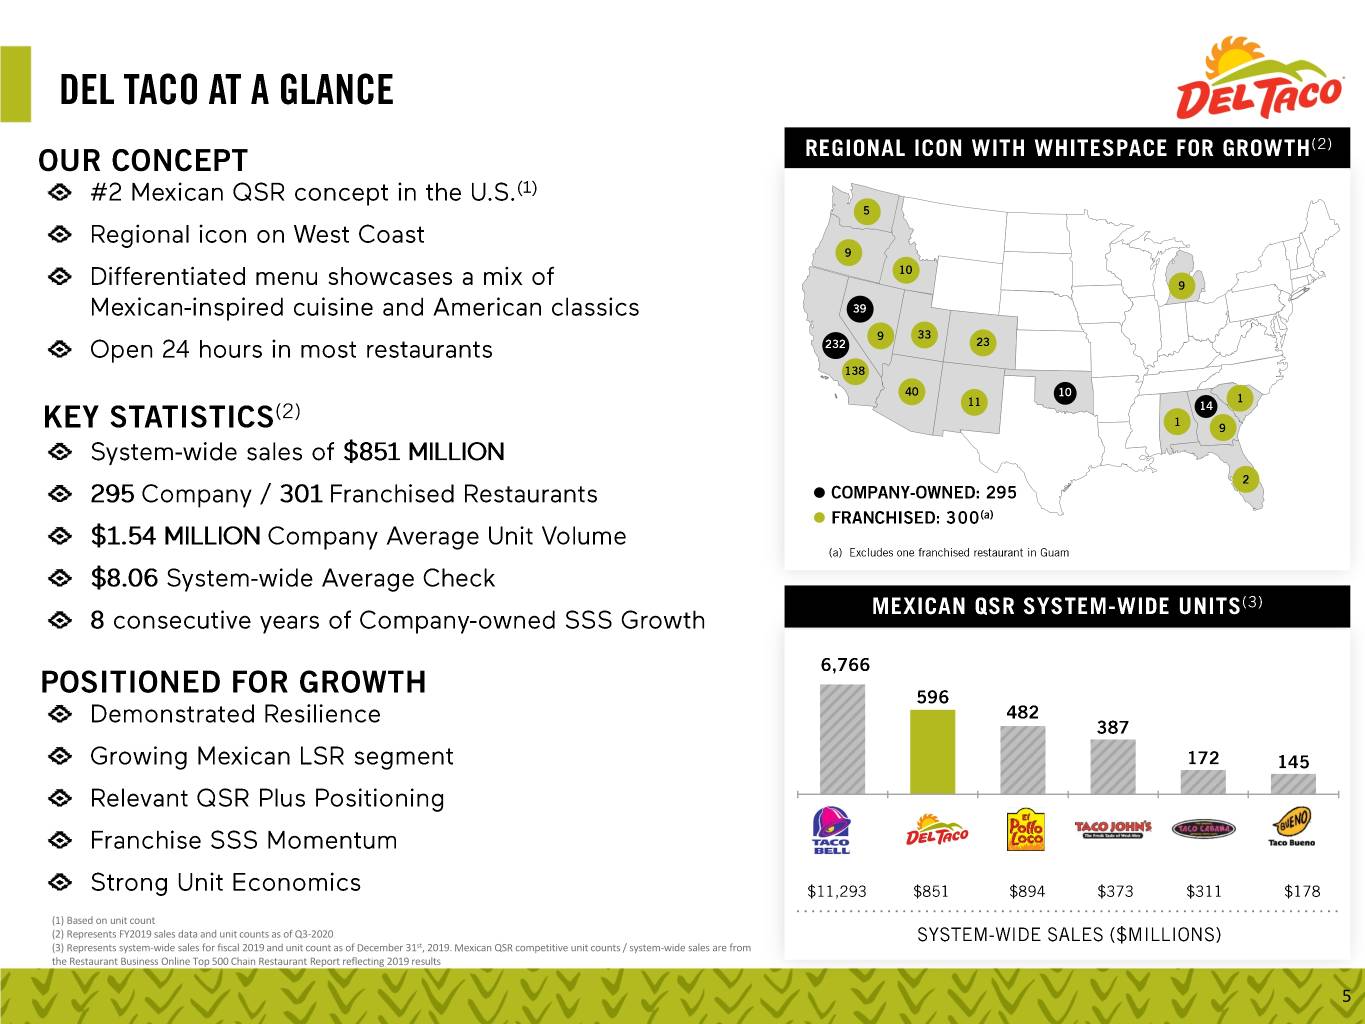
(1) Based on unit count (2) Represents FY2019 sales data and unit counts as of Q3-2020 (3) Represents system-wide sales for fiscal 2019 and unit count as of December 31st, 2019. Mexican QSR competitive unit counts / system-wide sales are from the Restaurant Business Online Top 500 Chain Restaurant Report reflecting 2019 results 5
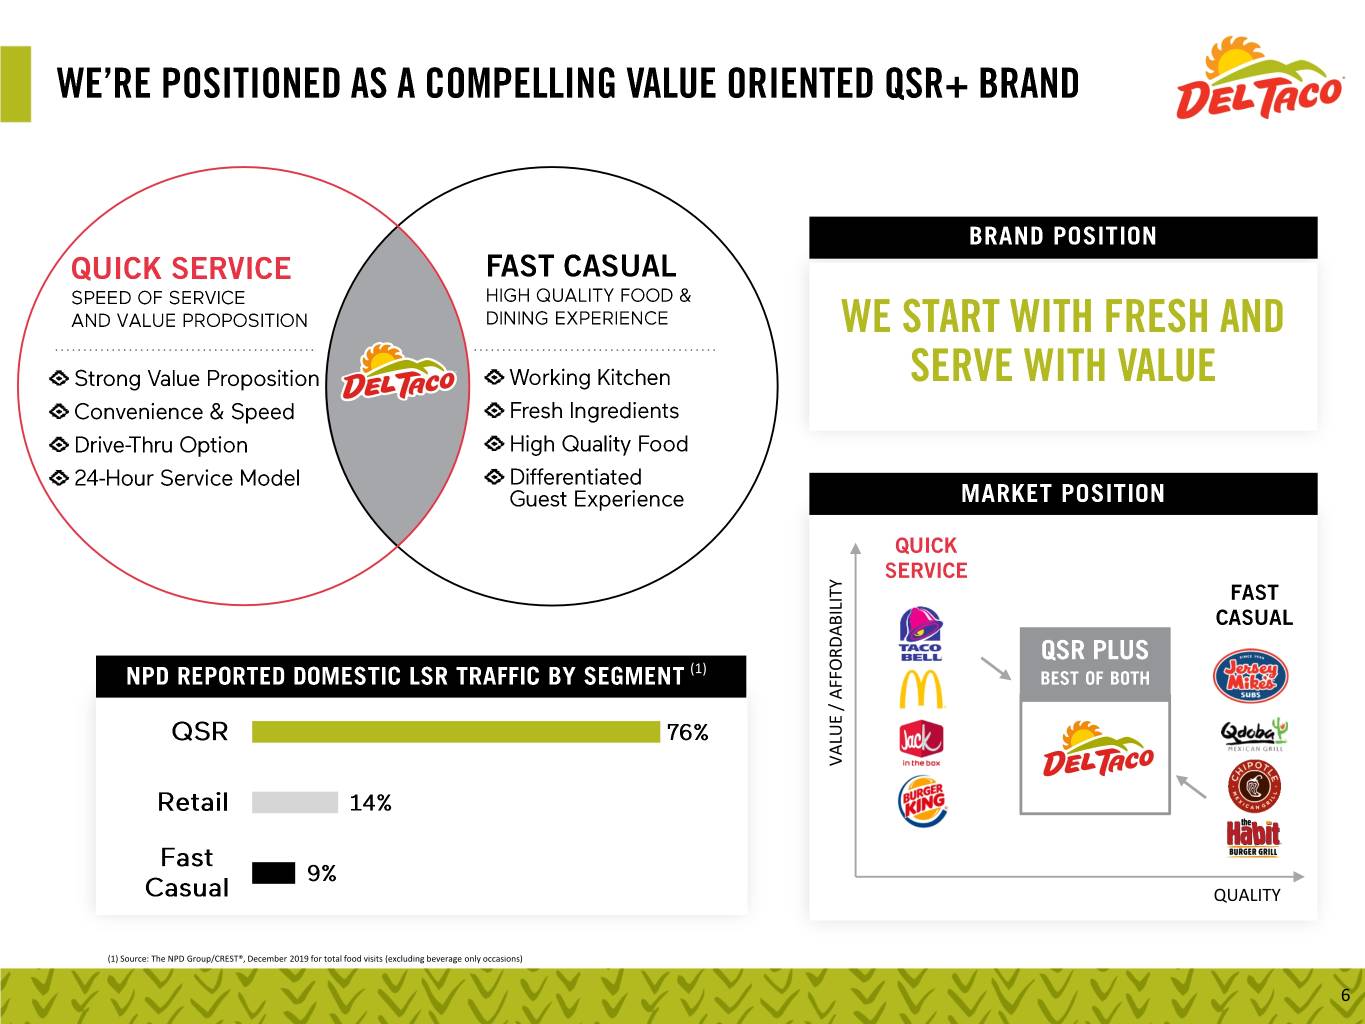
(1) VALUE /AFFORDABILITY VALUE QUALITY (1) Source: The NPD Group/CREST®, December 2019 for total food visits (excluding beverage only occasions) 6
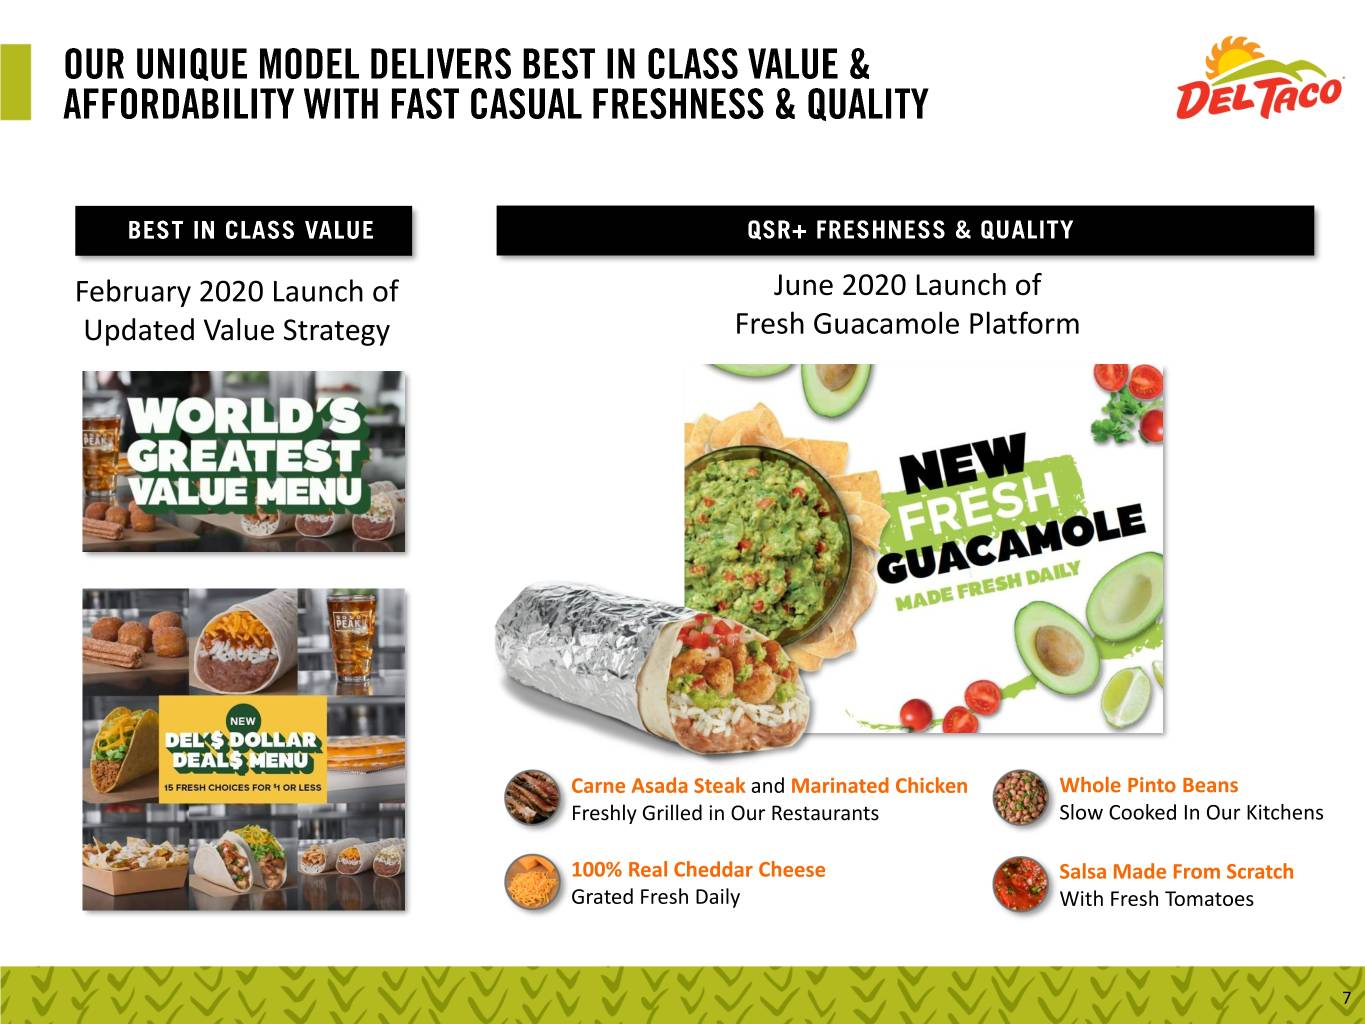
February 2020 Launch of June 2020 Launch of Updated Value Strategy Fresh Guacamole Platform Carne Asada Steak and Marinated Chicken Whole Pinto Beans Freshly Grilled in Our Restaurants Slow Cooked In Our Kitchens 100% Real Cheddar Cheese Salsa Made From Scratch Grated Fresh Daily With Fresh Tomatoes 7

8
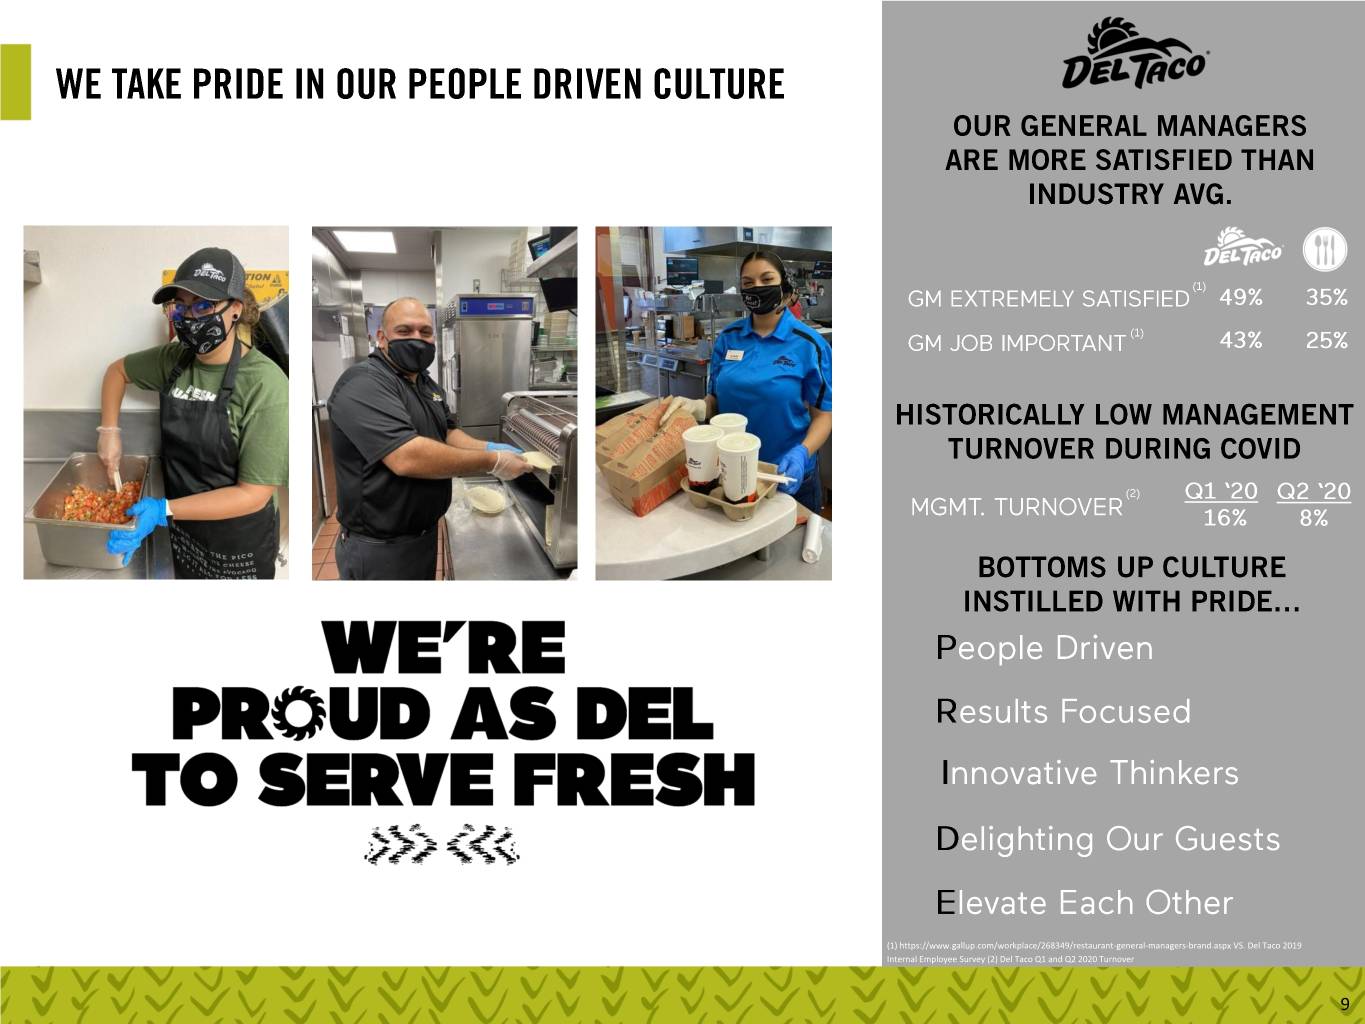
(1) https://www.gallup.com/workplace/268349/restaurant-general-managers-brand.aspx VS. Del Taco 2019 Internal Employee Survey (2) Del Taco Q1 and Q2 2020 Turnover 9
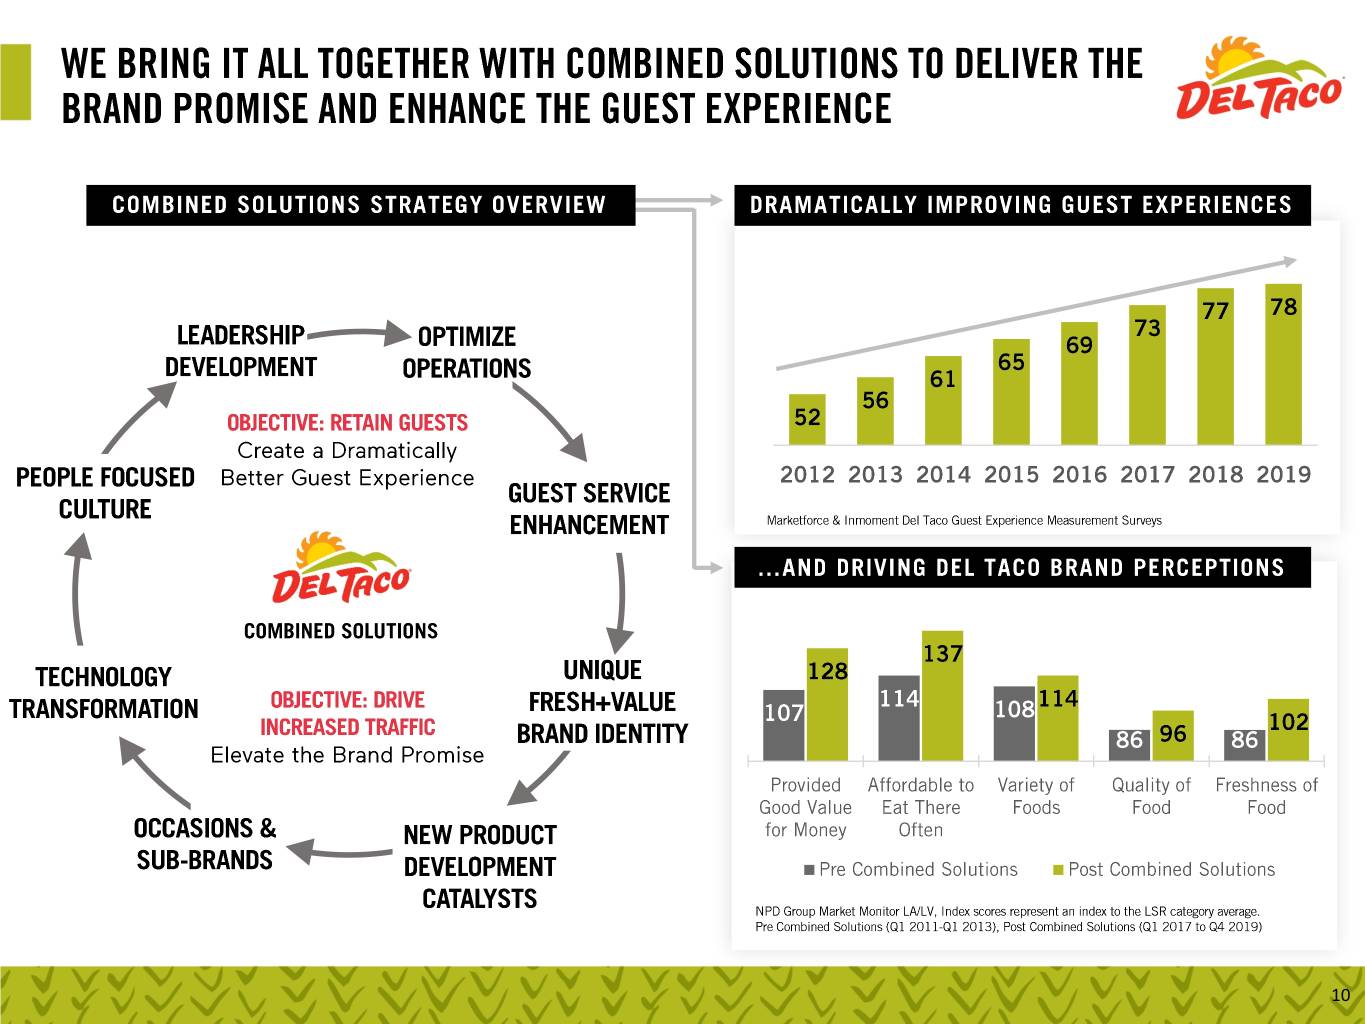
10

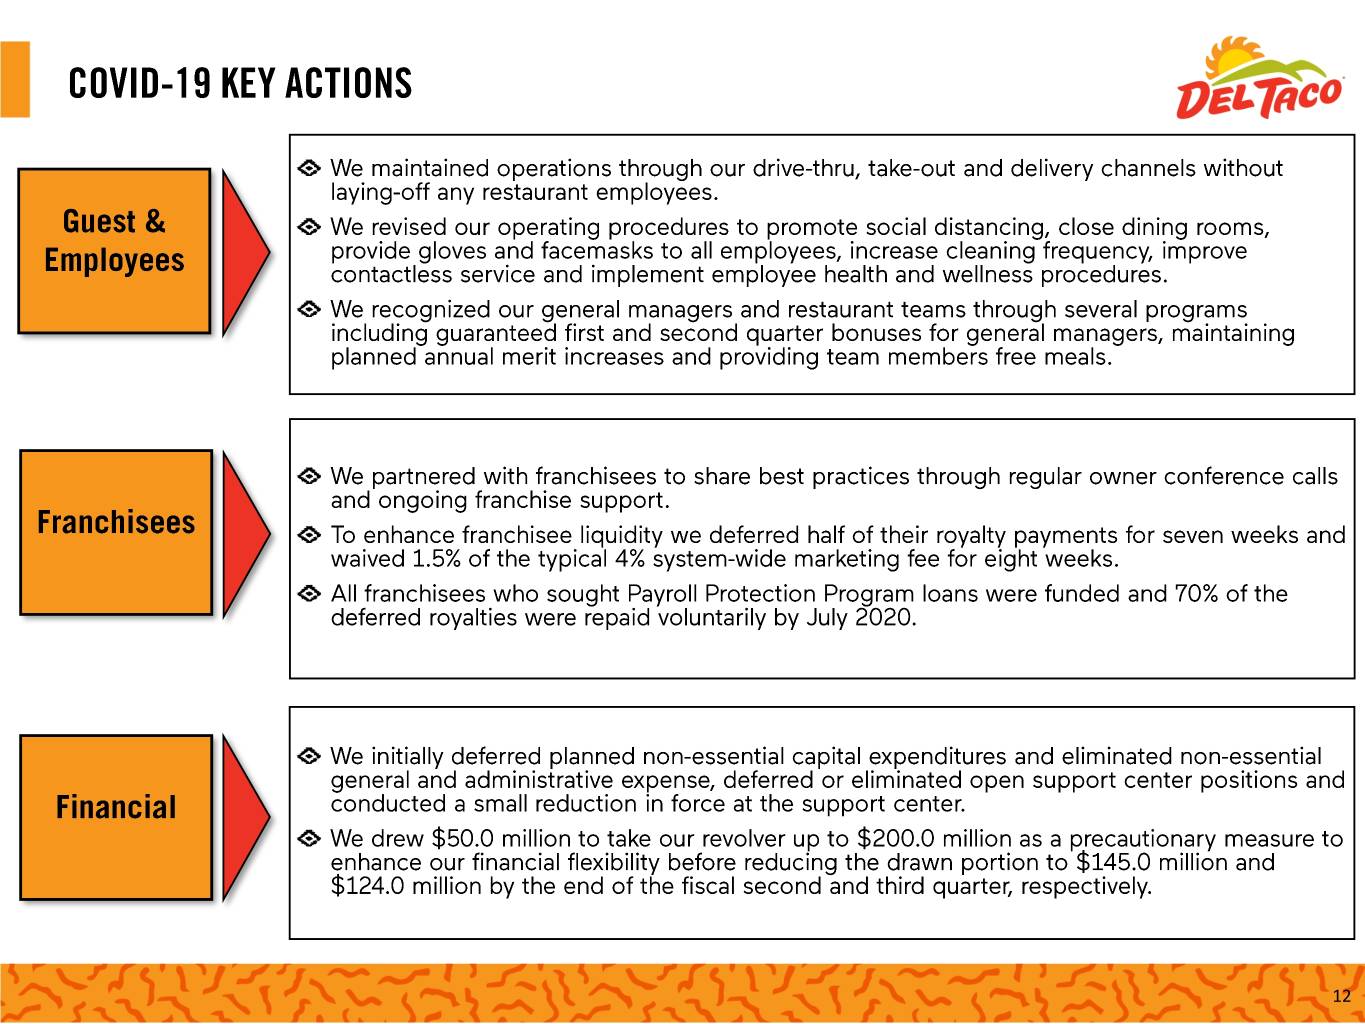
12
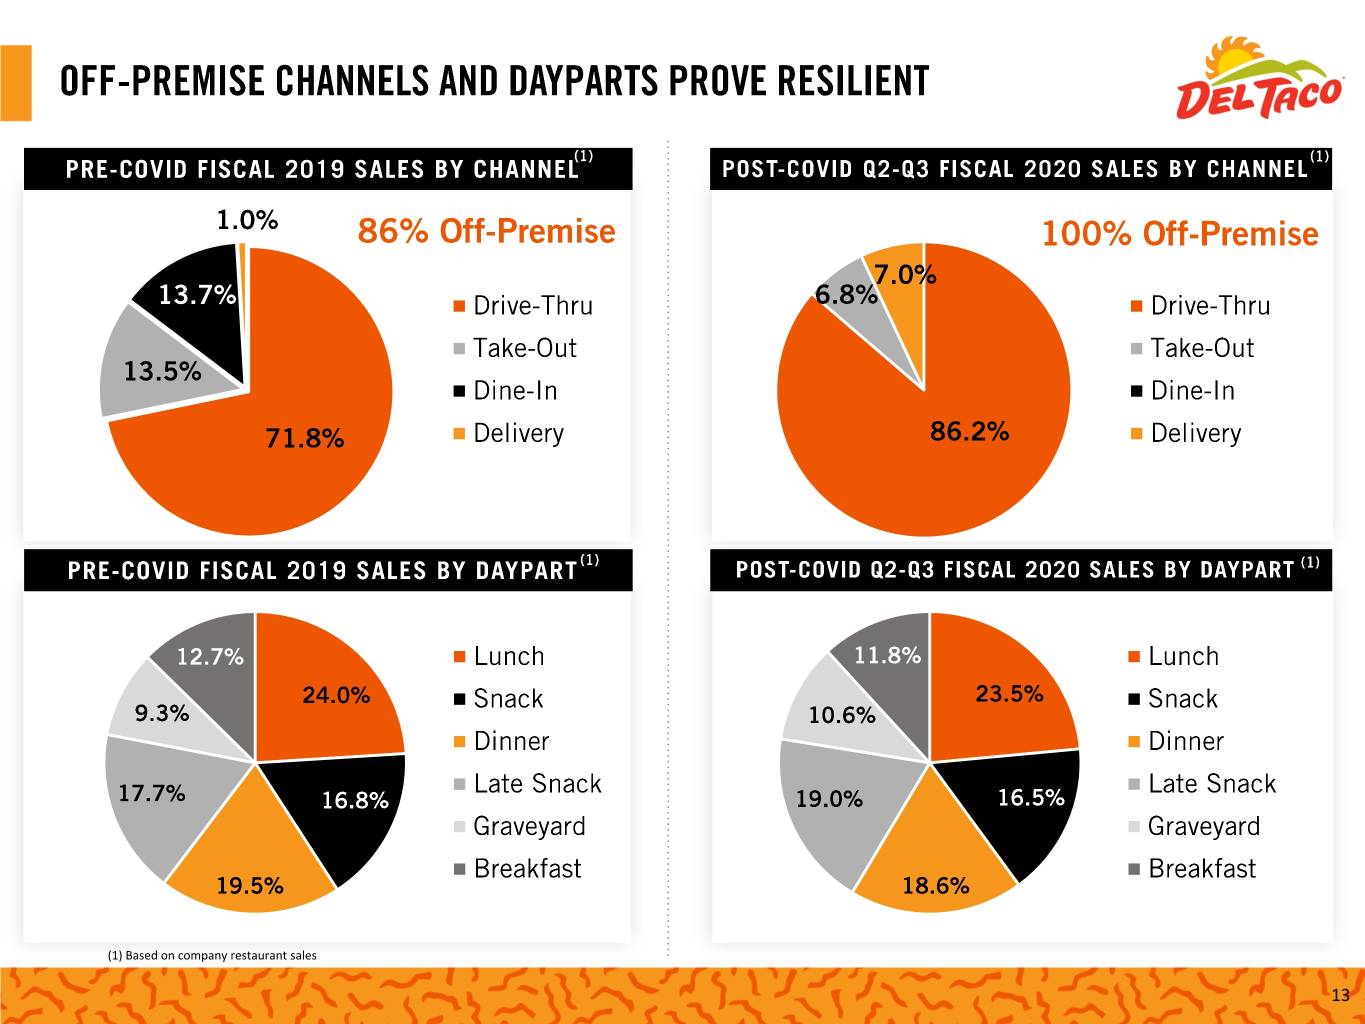
(1) Based on company restaurant sales 13
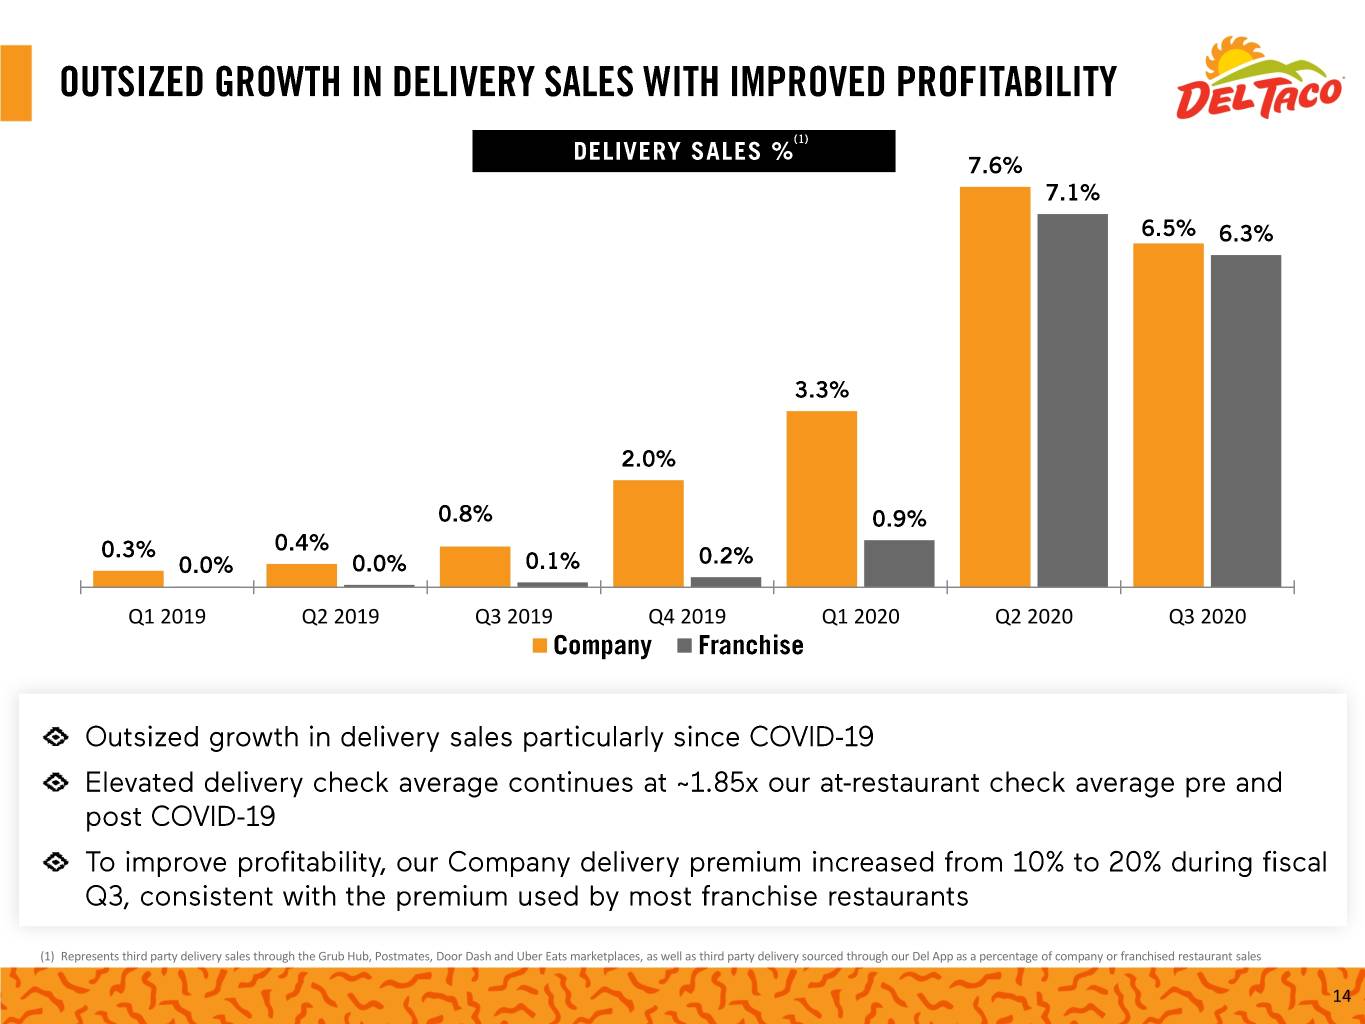
Q1 2019 Q2 2019 Q3 2019 Q4 2019 Q1 2020 Q2 2020 Q3 2020 (1) Represents third party delivery sales through the Grub Hub, Postmates, Door Dash and Uber Eats marketplaces, as well as third party delivery sourced through our Del App as a percentage of company or franchised restaurant sales 14
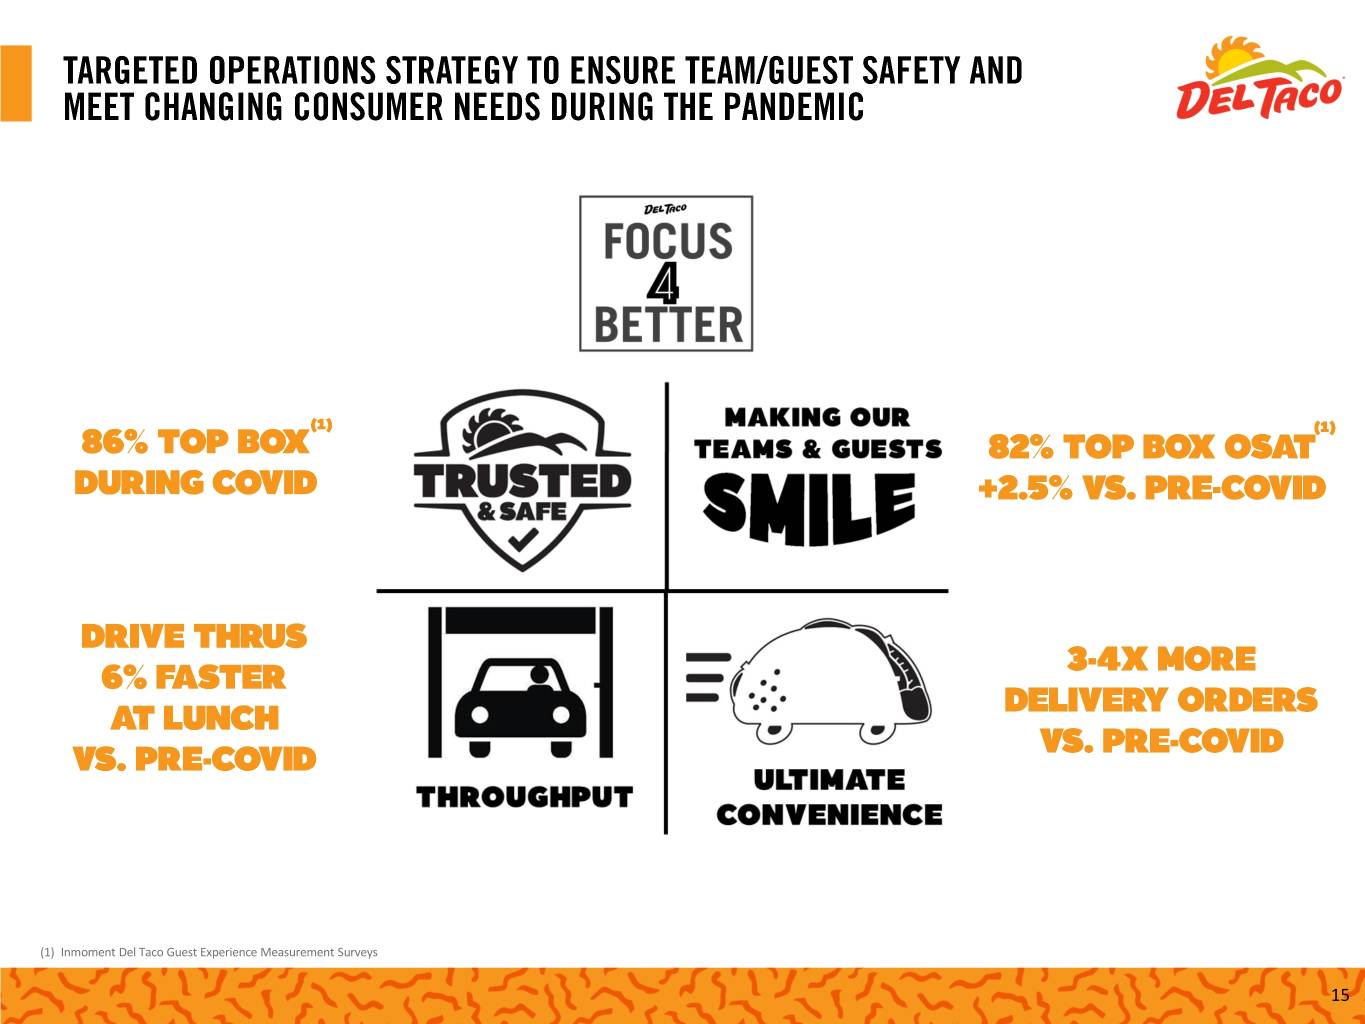
(1) Inmoment Del Taco Guest Experience Measurement Surveys 15
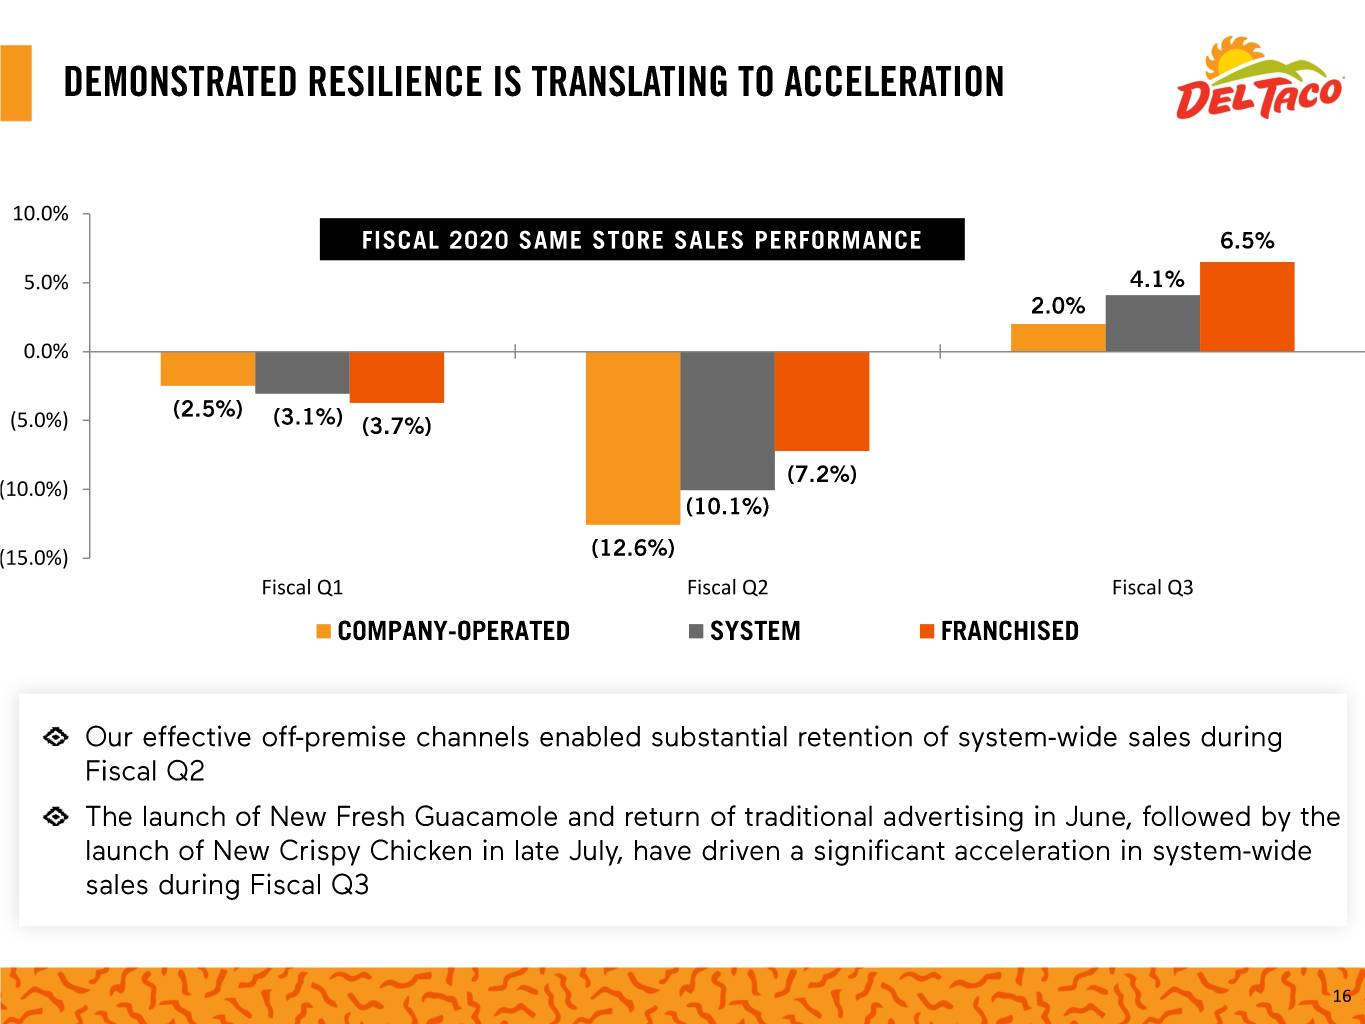
10.0% 5.0% 0.0% (5.0%) (10.0%) (15.0%) Fiscal Q1 Fiscal Q2 Fiscal Q3 16
18
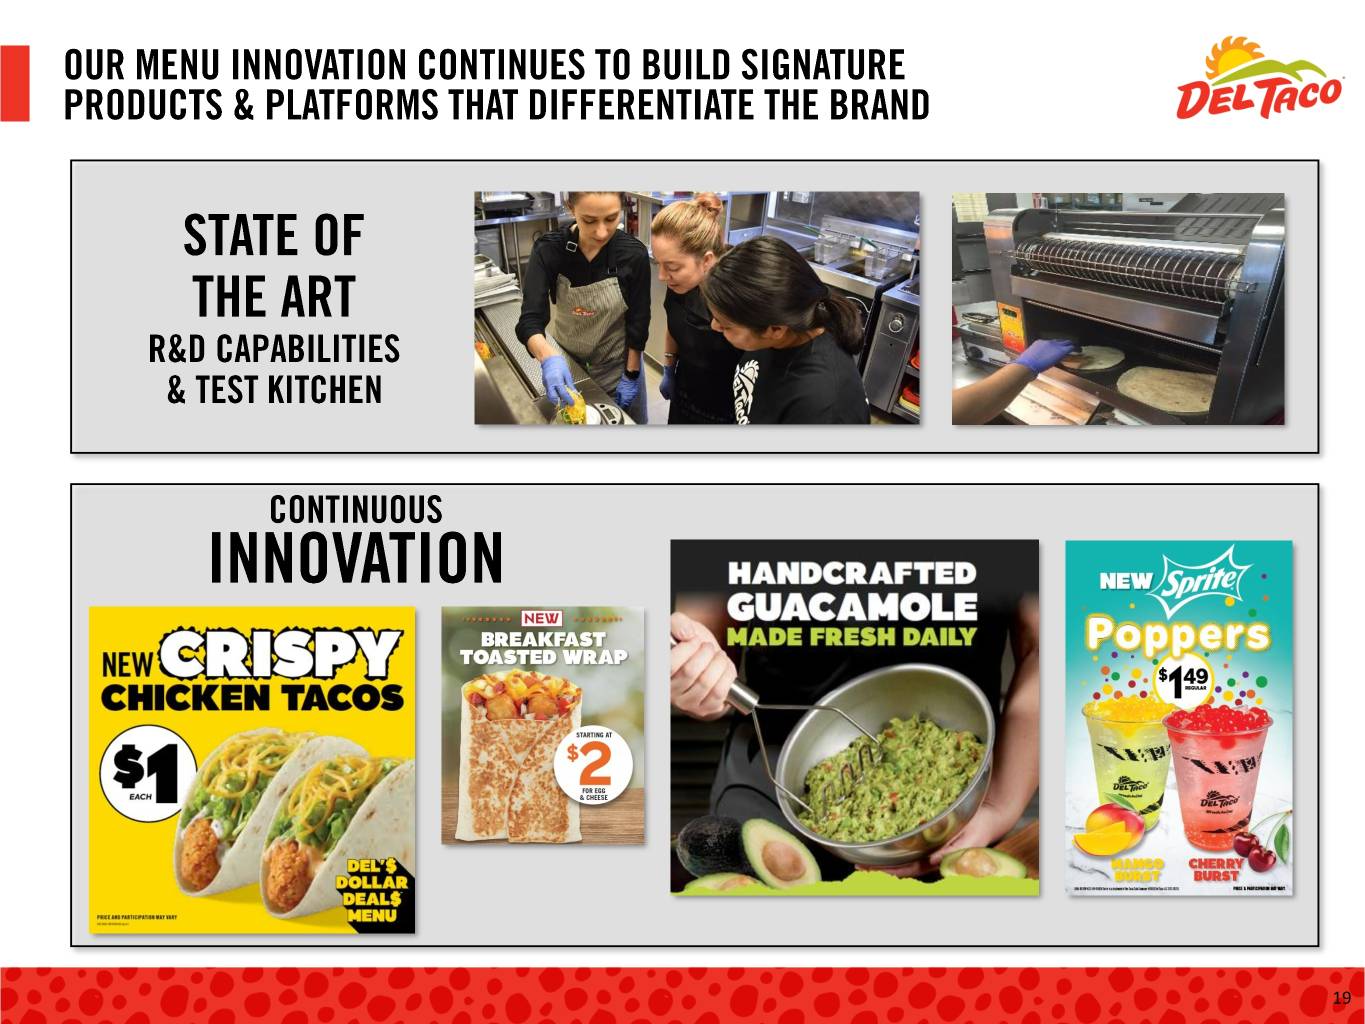
19

< $ 1 $ 5 > WIDE SPECTRUM OF OCCASIONS 20
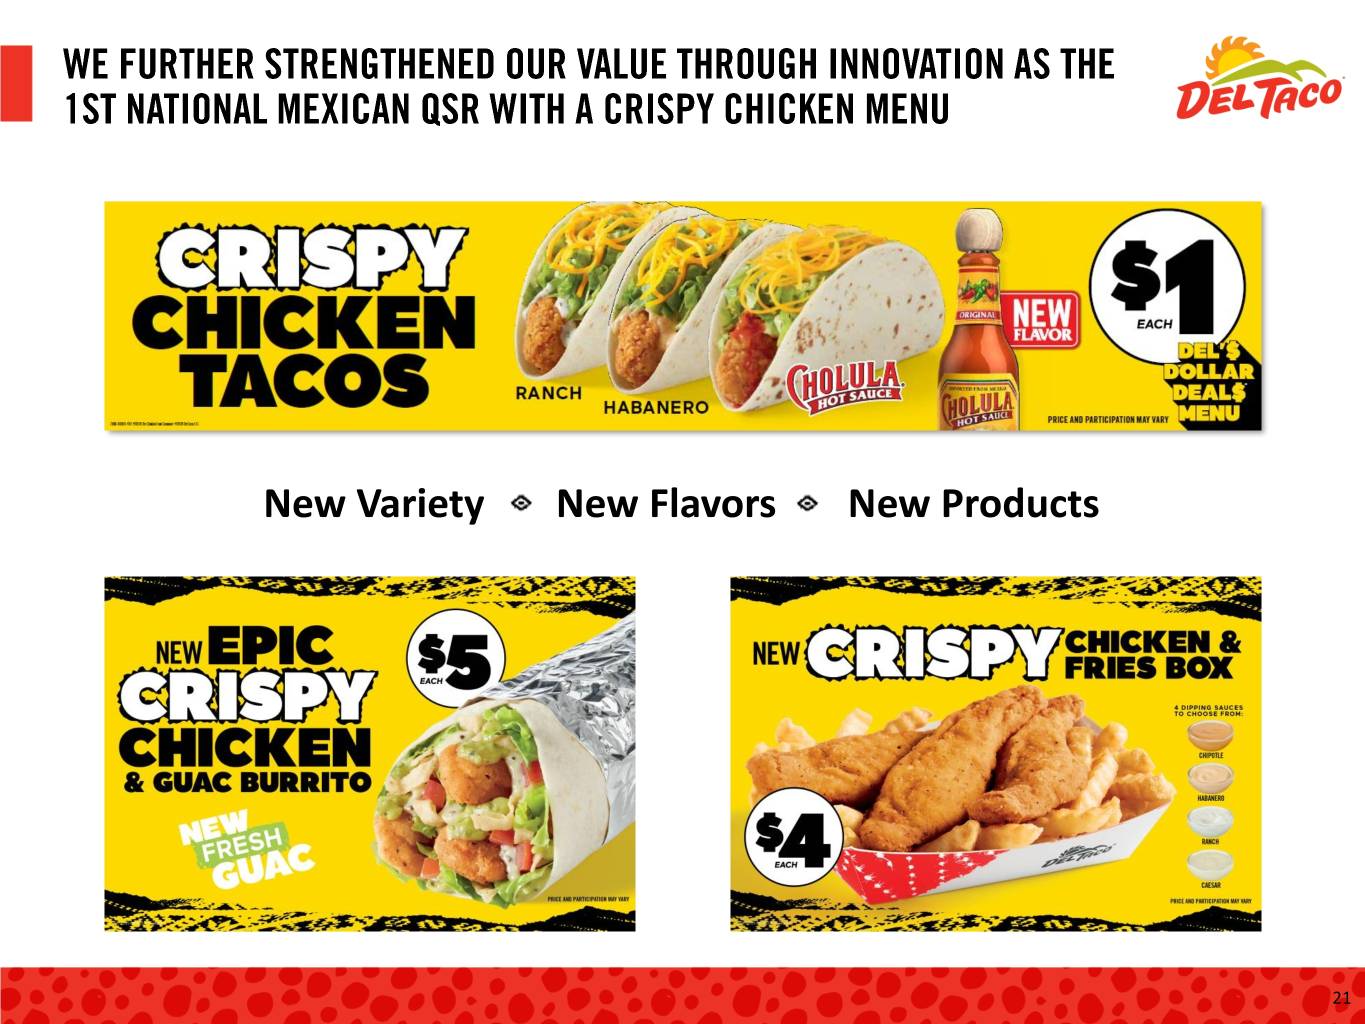
New Variety · New Flavors · New Products 21

TV · Streaming Service · Social Terrestrial & Digital PR & Social 22
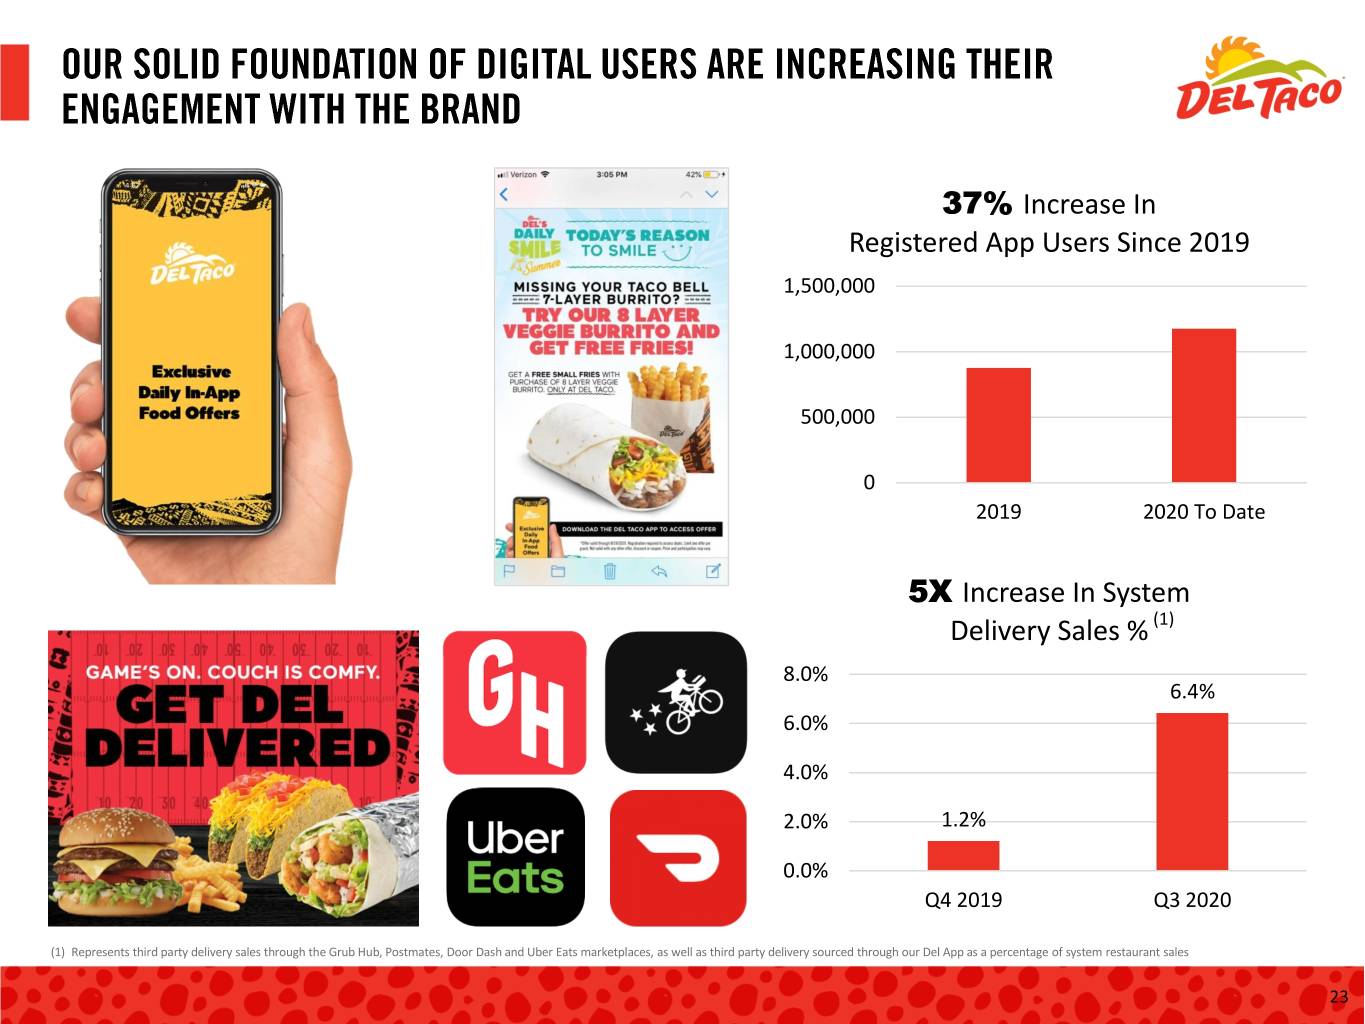
37% Increase In Registered App Users Since 2019 1,500,000 1,000,000 500,000 0 2019 2020 To Date 5X Increase In System Delivery Sales % (1) 8.0% 6.4% 6.0% 4.0% 2.0% 1.2% 0.0% Q4 2019 Q3 2020 (1) Represents third party delivery sales through the Grub Hub, Postmates, Door Dash and Uber Eats marketplaces, as well as third party delivery sourced through our Del App as a percentage of system restaurant sales 23
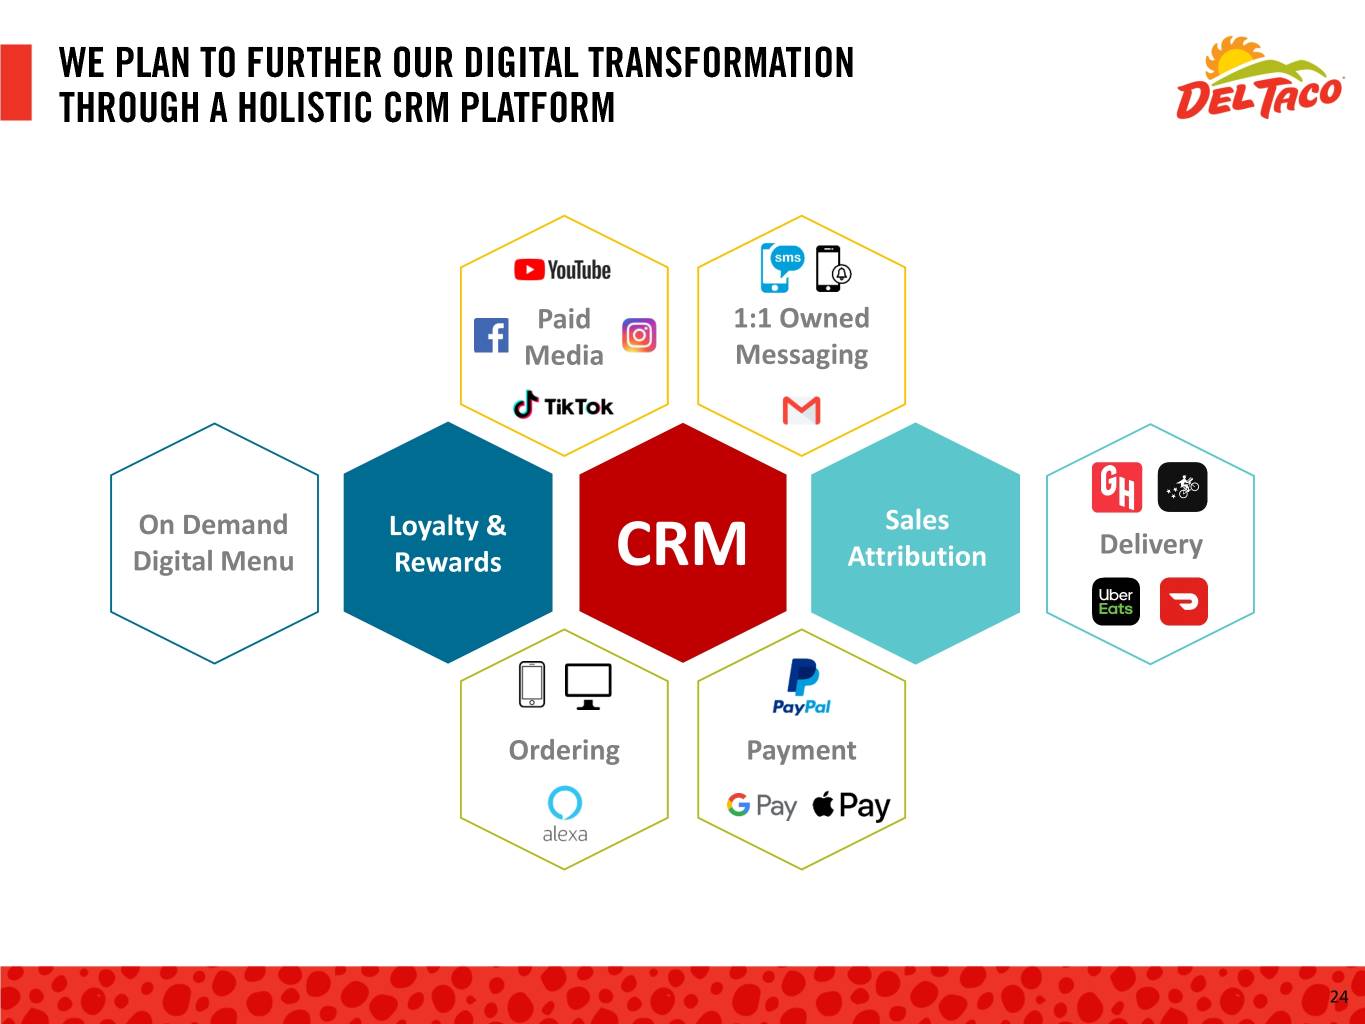
Paid 1:1 Owned Media Messaging On Demand Loyalty & Sales Delivery Digital Menu Rewards CRM Attribution Ordering Payment 24
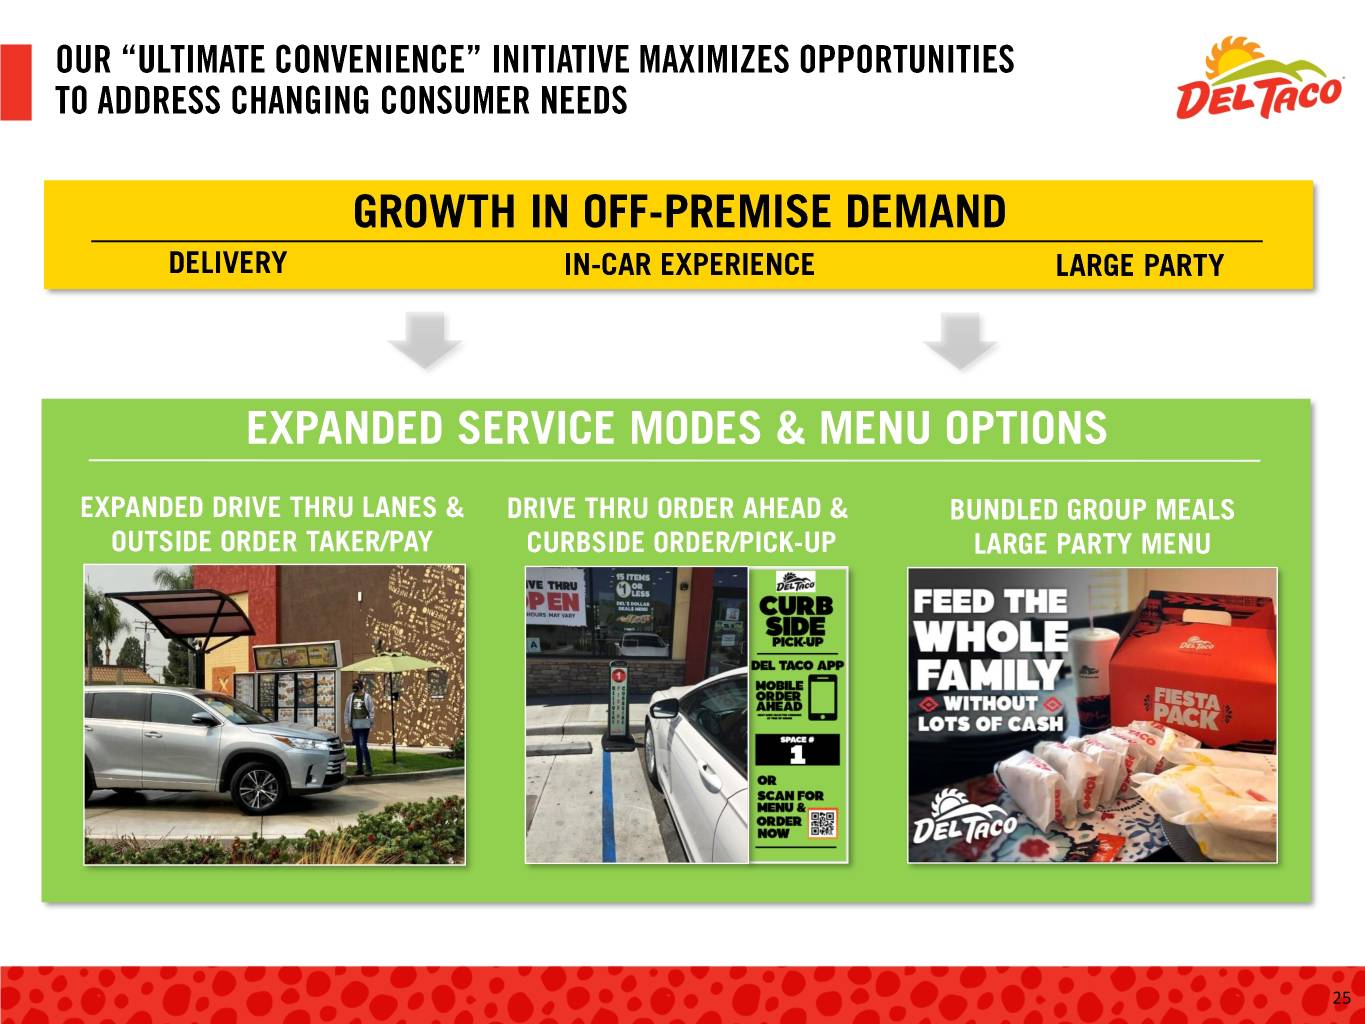
25

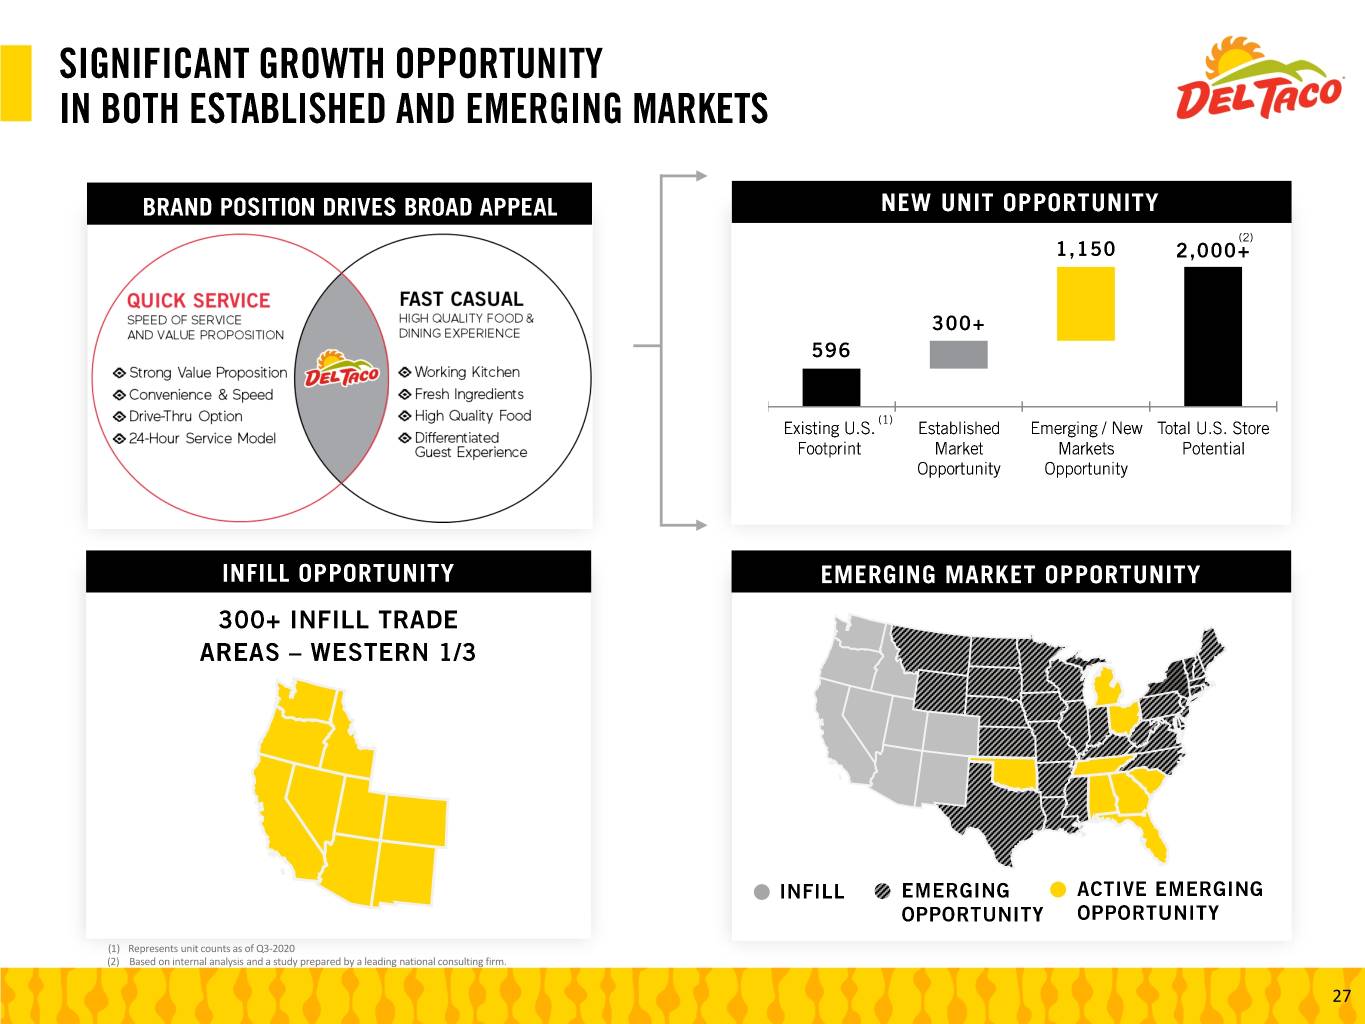
(1) Represents unit counts as of Q3-2020 (2) Based on internal analysis and a study prepared by a leading national consulting firm. 27
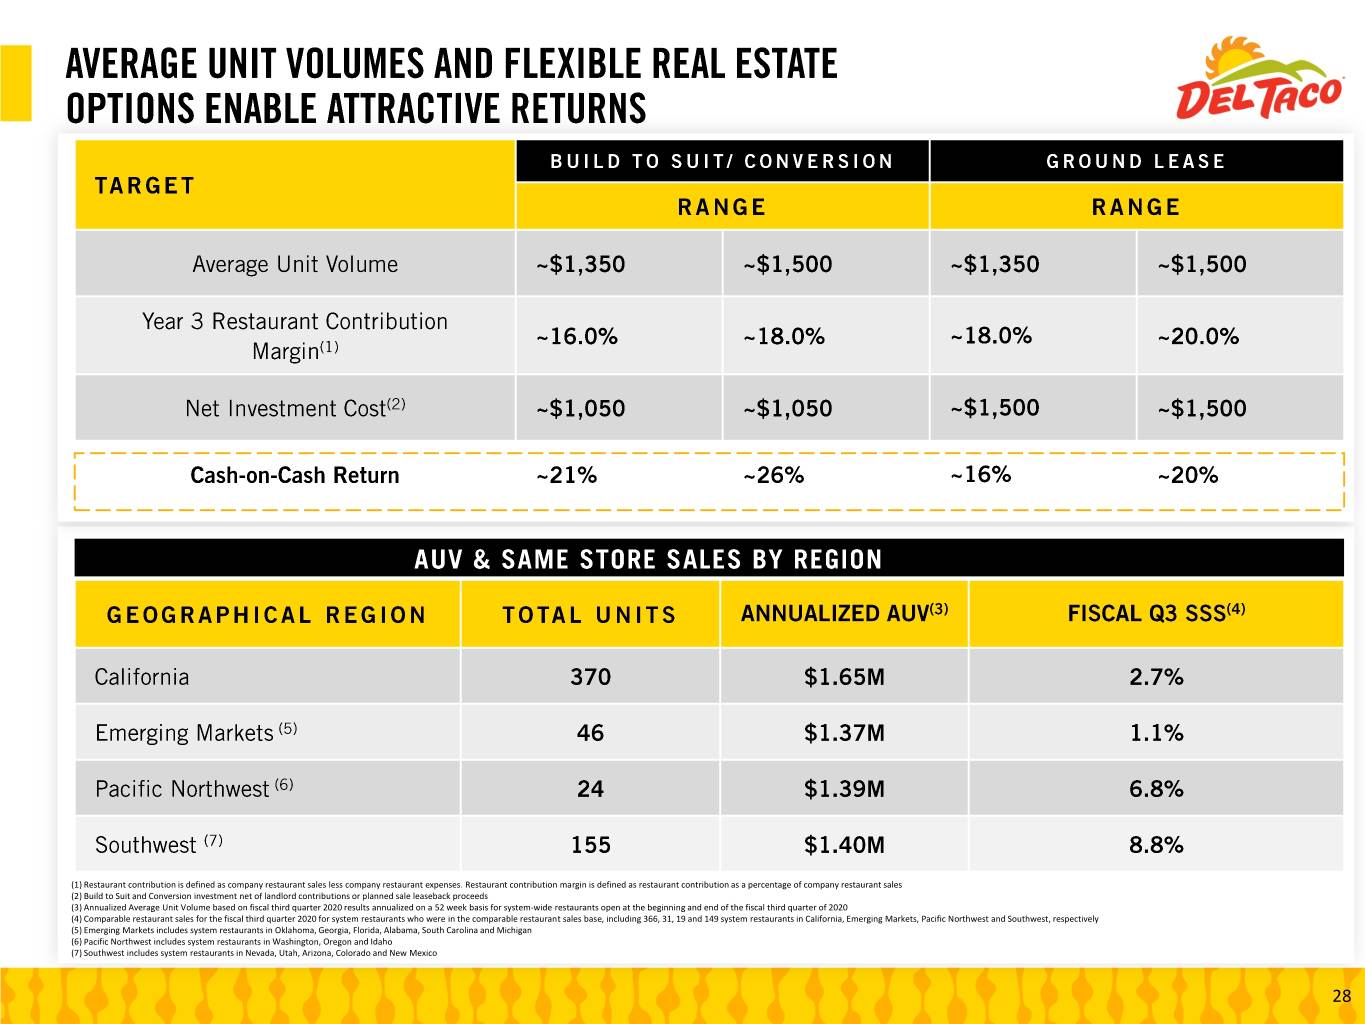
(1) Restaurant contribution is defined as company restaurant sales less company restaurant expenses. Restaurant contribution margin is defined as restaurant contribution as a percentage of company restaurant sales (2) Build to Suit and Conversion investment net of landlord contributions or planned sale leaseback proceeds (3) Annualized Average Unit Volume based on fiscal third quarter 2020 results annualized on a 52 week basis for system-wide restaurants open at the beginning and end of the fiscal third quarter of 2020 (4) Comparable restaurant sales for the fiscal third quarter 2020 for system restaurants who were in the comparable restaurant sales base, including 366, 31, 19 and 149 system restaurants in California, Emerging Markets, Pacific Northwest and Southwest, respectively (5) Emerging Markets includes system restaurants in Oklahoma, Georgia, Florida, Alabama, South Carolina and Michigan (6) Pacific Northwest includes system restaurants in Washington, Oregon and Idaho (7) Southwest includes system restaurants in Nevada, Utah, Arizona, Colorado and New Mexico 28
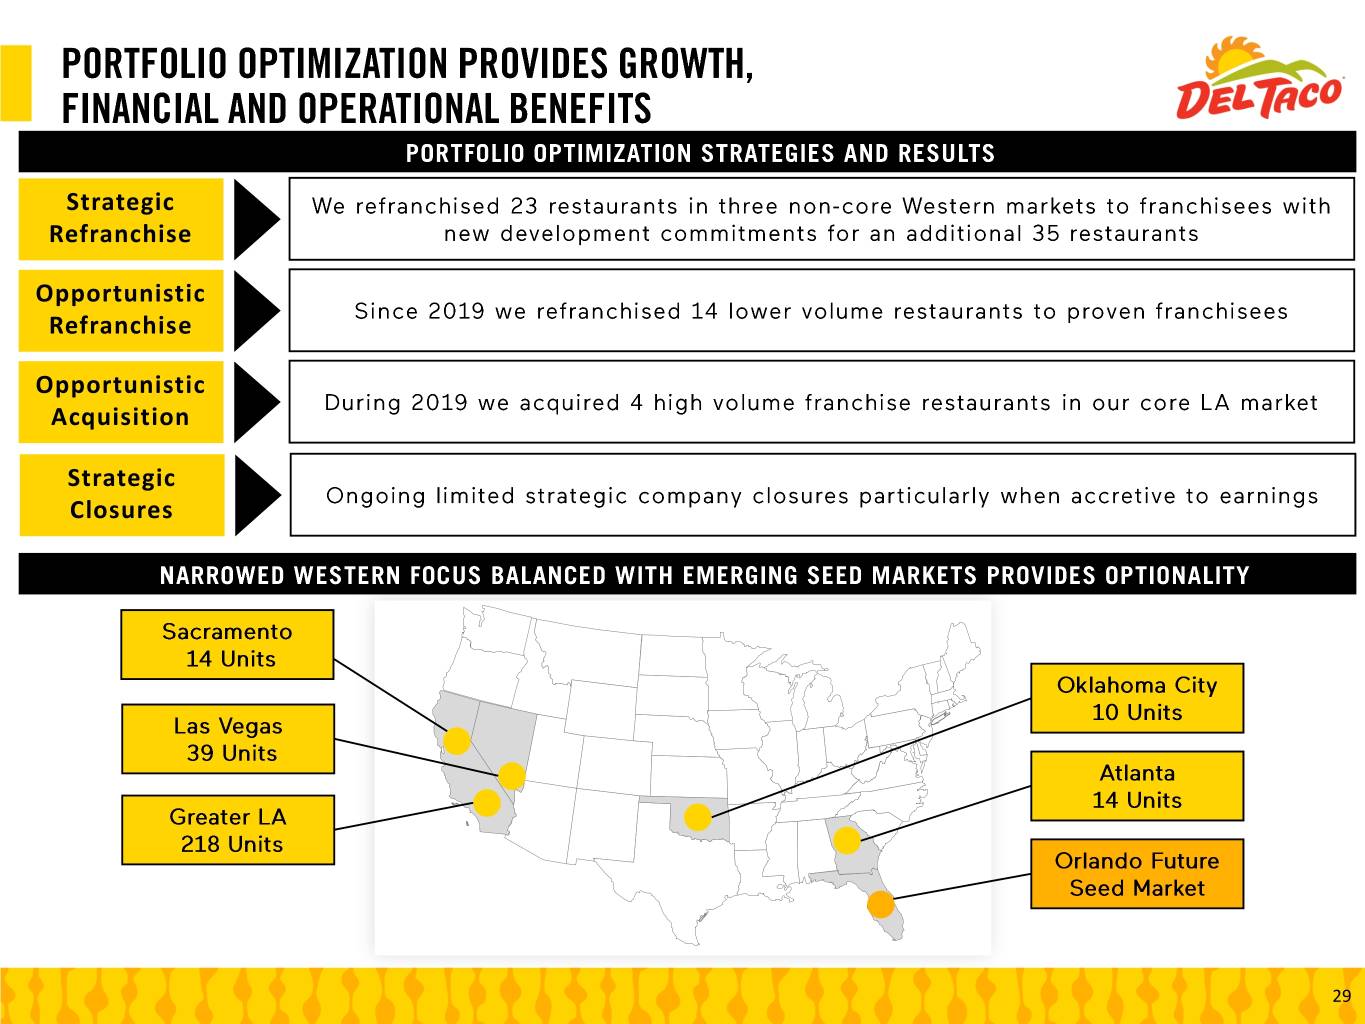
Strategic Refranchise Opportunistic Refranchise Opportunistic Acquisition Strategic Closures 29
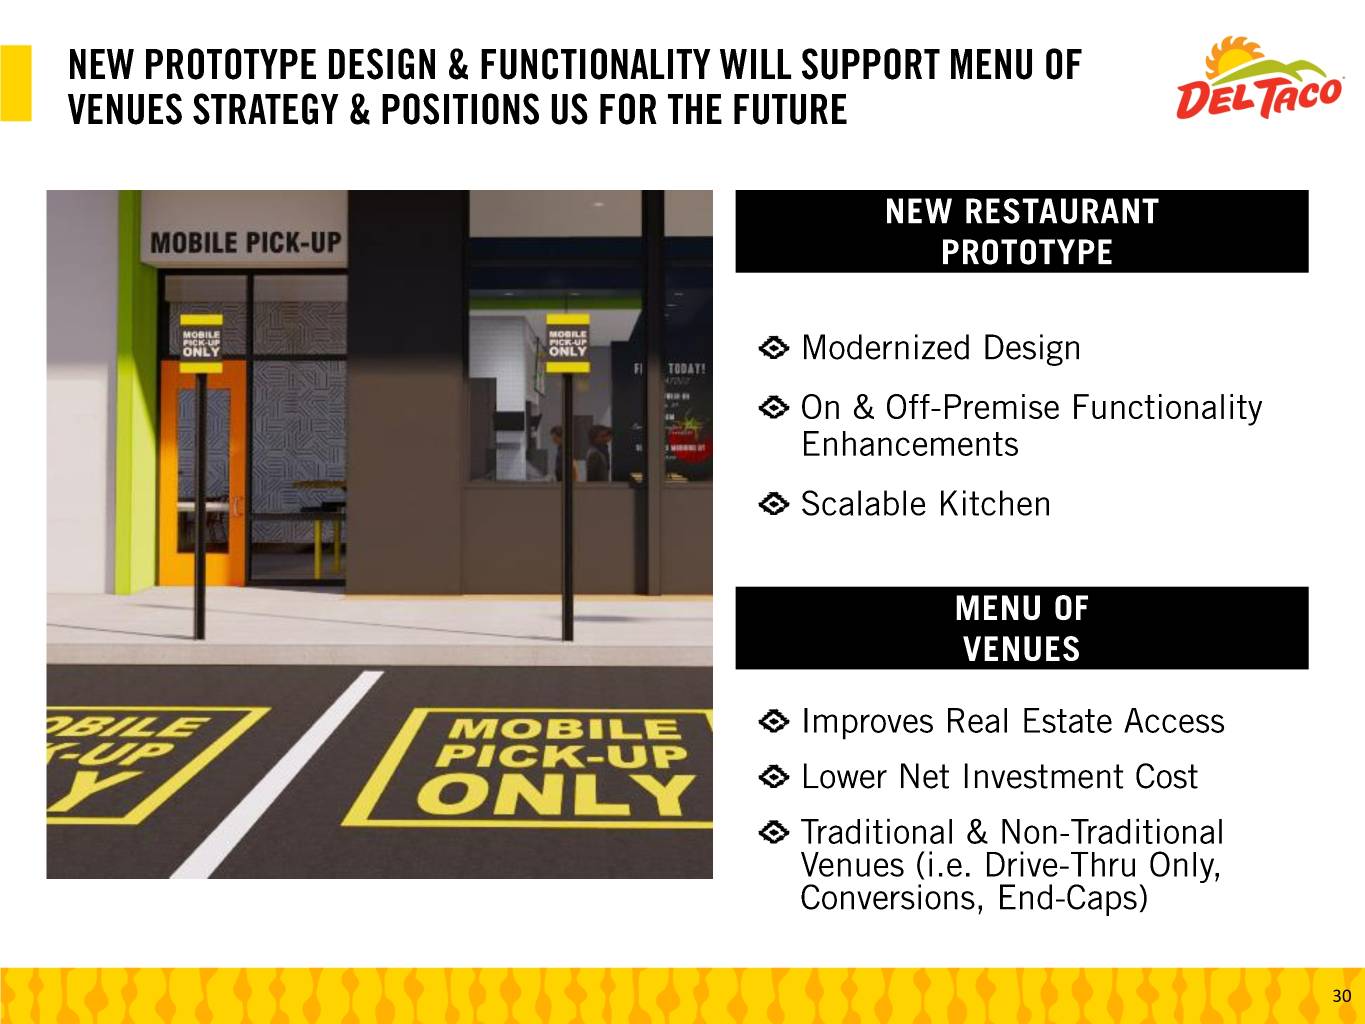
30
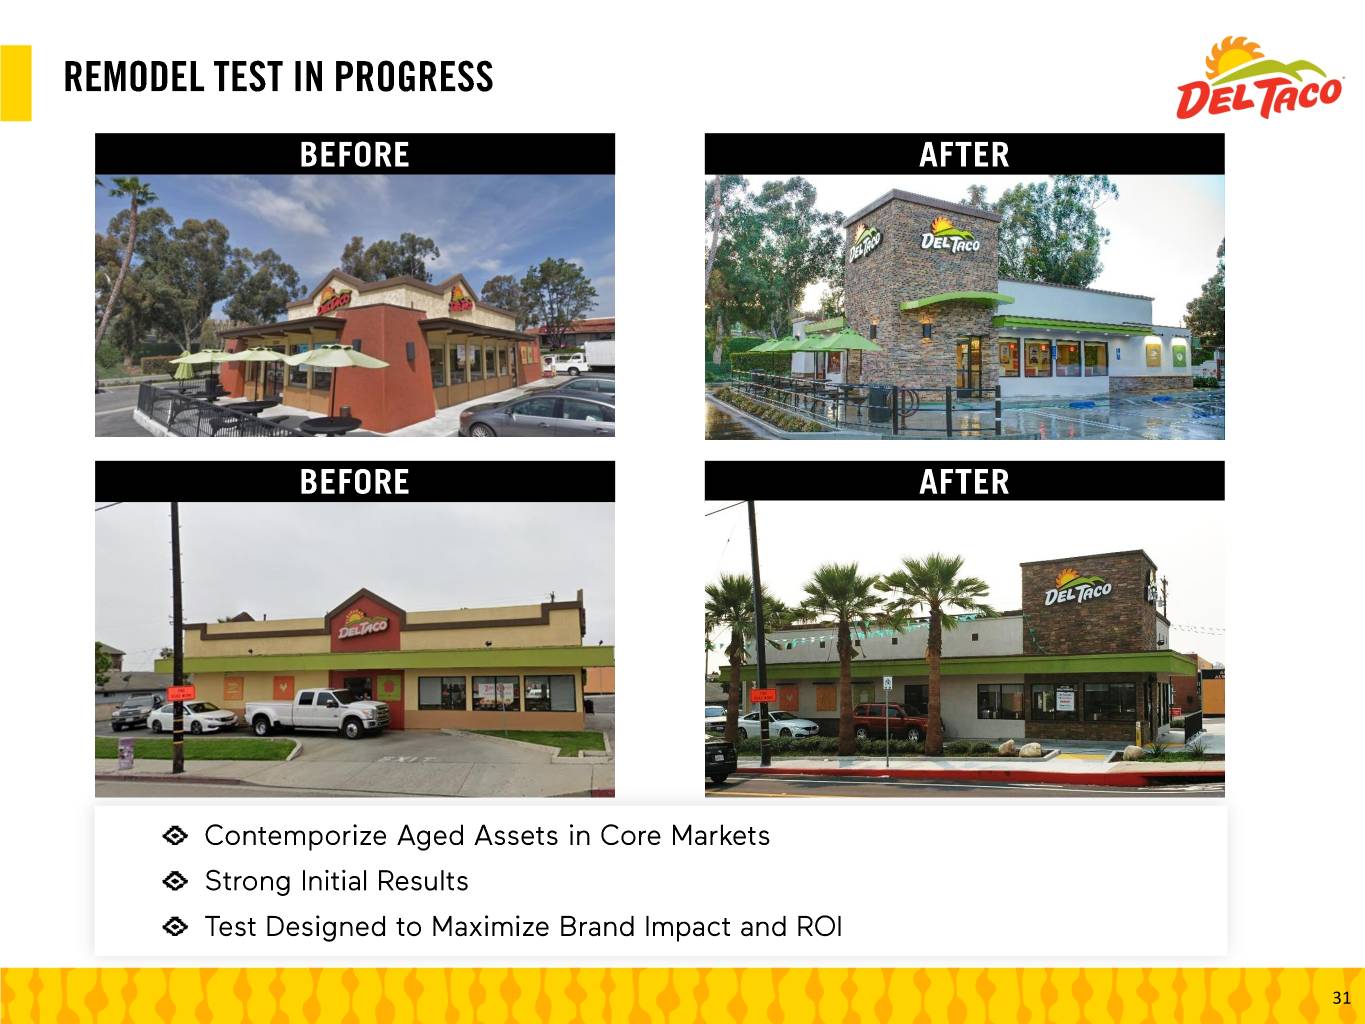
31
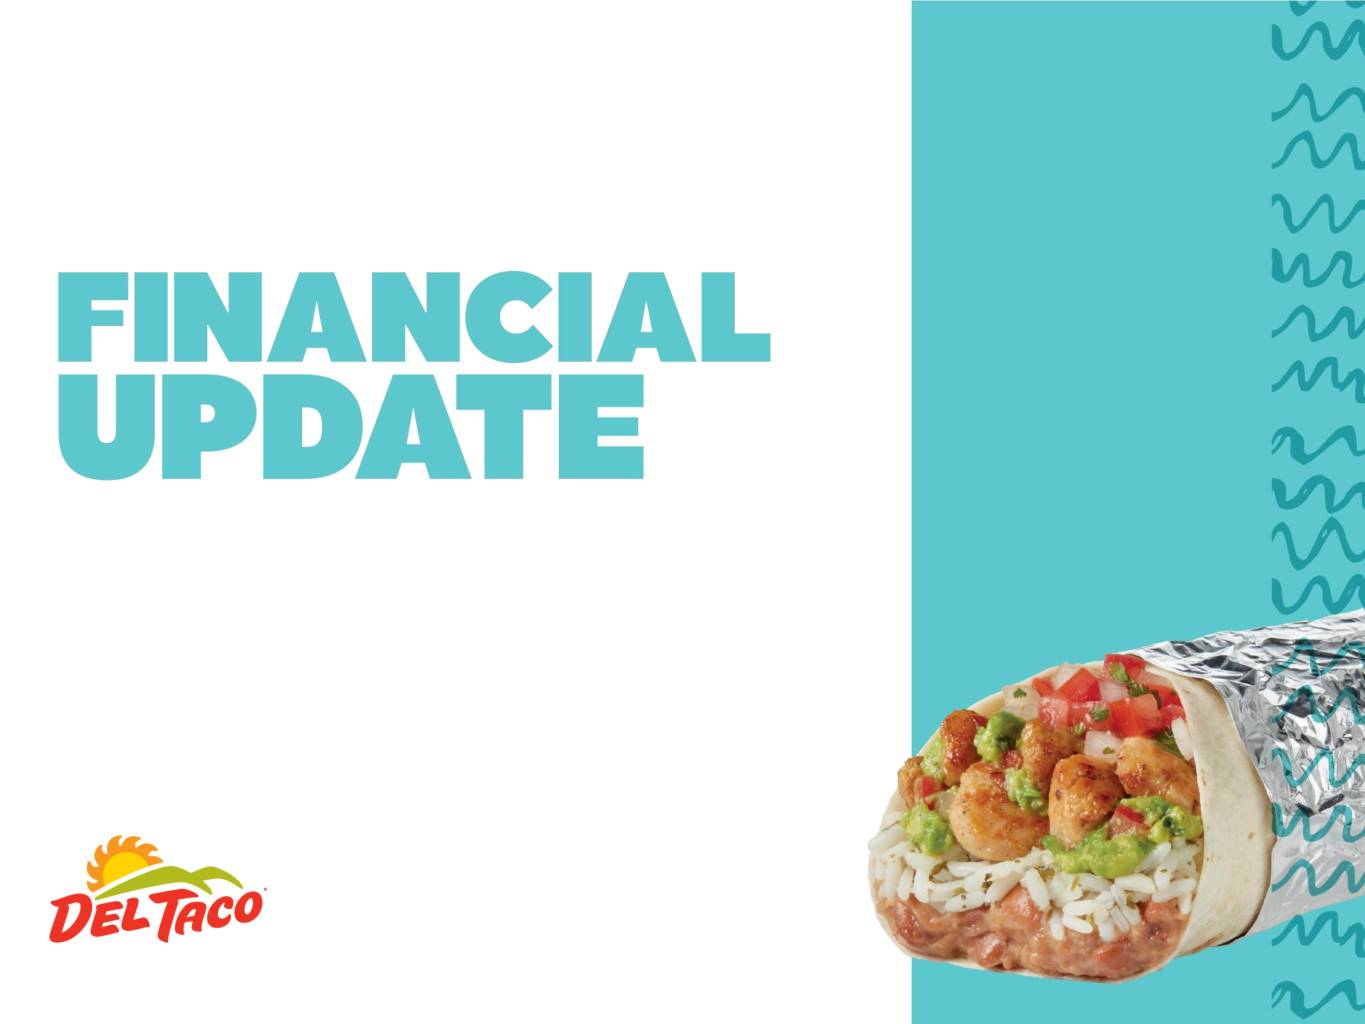
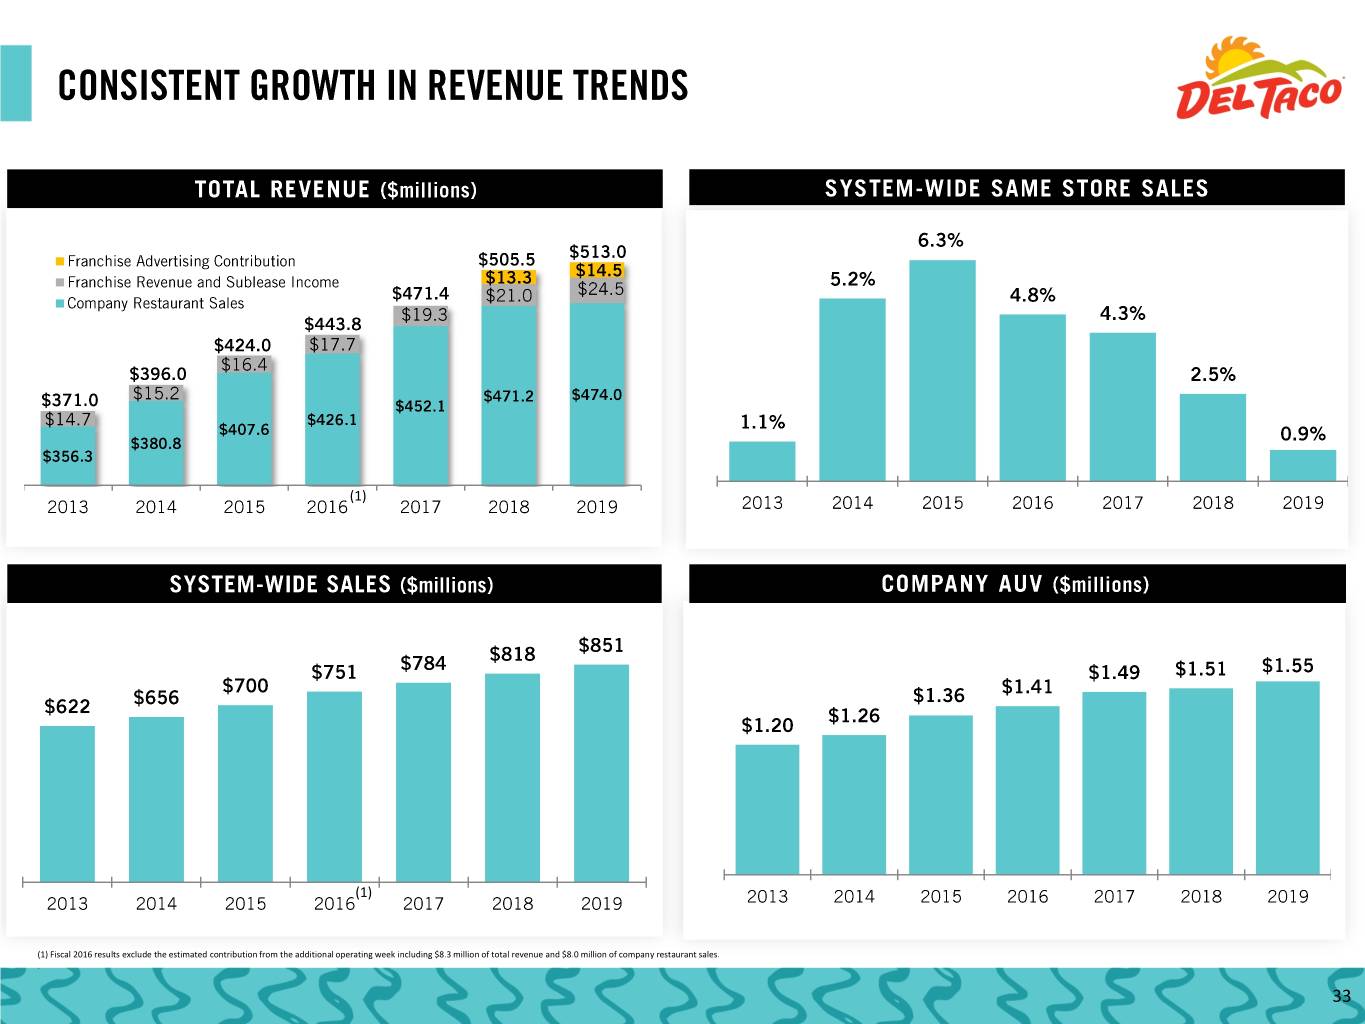
(1) (1) (1) Fiscal 2016 results exclude the estimated contribution from the additional operating week including $8.3 million of total revenue and $8.0 million of company restaurant sales. . 33

(3) (3) Company SSS 0.1% 1.8% 5.3% 6.4% 4.7% 4.0% 1.5% 0.5% CA Min Wage $8.00 $8.00 $9.00 $9.00 $10.00 $10.50 $11.00 $12.00 Food Inflation 3.7% 1.7% 1.0% 1.1% -2.2% 1.6% 0.8% 3.3% Lease Accounting (4) 0.7% (1)Restaurant contribution is defined as company restaurant sales less company restaurant expenses. Restaurant contribution margin is defined as restaurant contribution as a percentage of company restaurant sales. (2)Adjusted EBITDA represents a non-GAAP measure of financial results and reflects net income (loss) before interest expense, provision for income taxes, depreciation, amortization and items that we do not consider representative of our ongoing operating performance. (3)Fiscal 2016 results exclude the estimated contribution from the additional operating week including $8.3 million of total revenue, $8.0 million of company restaurant sales, $1.4 million of restaurant contribution and $1.1 million of Adjusted EBITDA. (4) Occupancy and other operating expenses as a percent of company restaurant sales increased approximately 70 basis points from the adoption of the new lease accounting standard 34
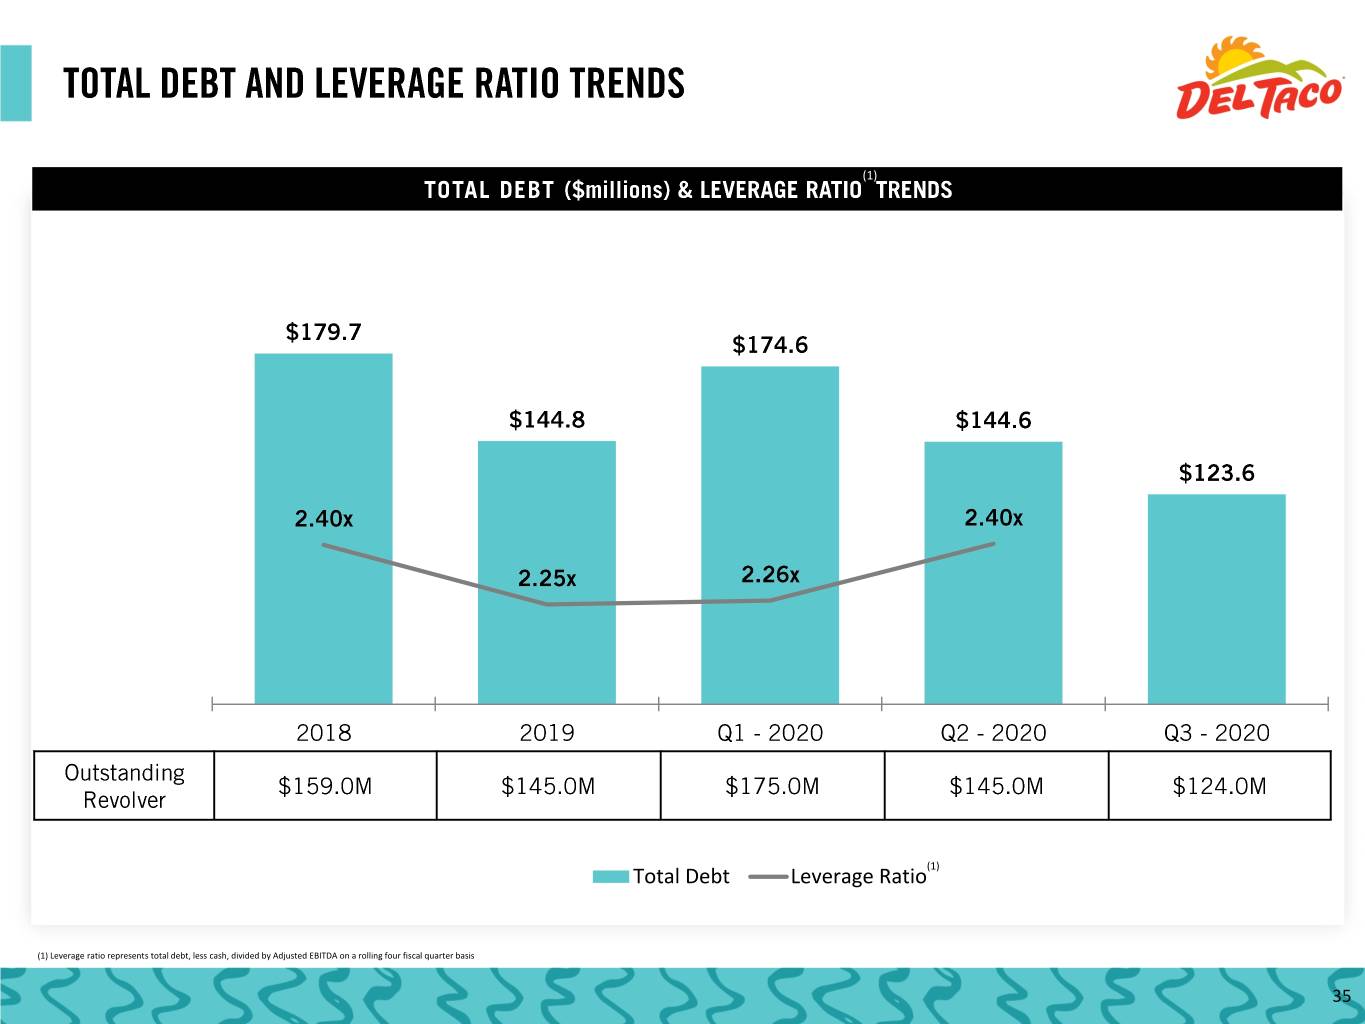
(1) Total Debt Leverage Ratio(1) (1) Leverage ratio represents total debt, less cash, divided by Adjusted EBITDA on a rolling four fiscal quarter basis 35
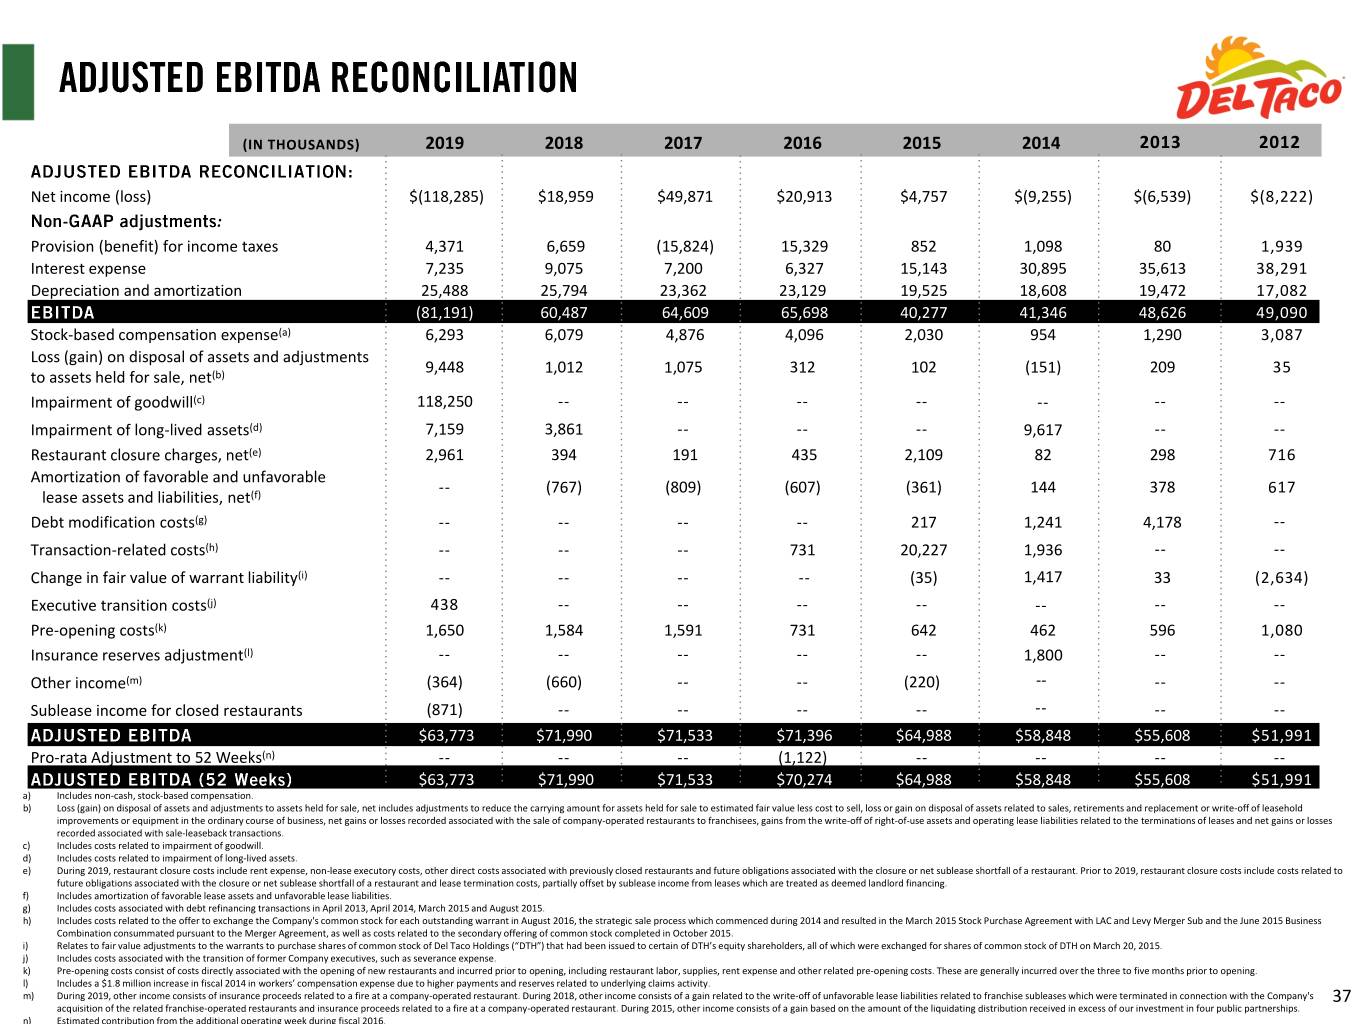
(IN THOUSANDS) 2019 2018 2017 2016 2015 2014 2013 2012 Net income (loss) $(118,285) $18,959 $49,871 $20,913 $4,757 $(9,255) $(6,539) $(8,222) : Provision (benefit) for income taxes 4,371 6,659 (15,824) 15,329 852 1,098 80 1,939 Interest expense 7,235 9,075 7,200 6,327 15,143 30,895 35,613 38,291 Depreciation and amortization 25,488 25,794 23,362 23,129 19,525 18,608 19,472 17,082 (81,191) 60,487 64,609 65,698 40,277 41,346 48,626 49,090 Stock-based compensation expense(a) 6,293 6,079 4,876 4,096 2,030 954 1,290 3,087 Loss (gain) on disposal of assets and adjustments 9,448 1,012 1,075 312 102 (151) 209 35 to assets held for sale, net(b) Impairment of goodwill(c) 118,250 -- -- -- -- -- -- -- Impairment of long-lived assets(d) 7,159 3,861 -- -- -- 9,617 -- -- Restaurant closure charges, net(e) 2,961 394 191 435 2,109 82 298 716 Amortization of favorable and unfavorable -- (767) (809) (607) (361) 144 378 617 lease assets and liabilities, net(f) Debt modification costs(g) -- -- -- -- 217 1,241 4,178 -- Transaction-related costs(h) -- -- -- 731 20,227 1,936 -- -- Change in fair value of warrant liability(i) -- -- -- -- (35) 1,417 33 (2,634) Executive transition costs(j) 438 -- -- -- -- -- -- -- Pre-opening costs(k) 1,650 1,584 1,591 731 642 462 596 1,080 Insurance reserves adjustment(l) -- -- -- -- -- 1,800 -- -- Other income(m) (364) (660) -- -- (220) -- -- -- Sublease income for closed restaurants (871) -- -- -- -- -- -- -- $63,773 $71,990 $71,533 $71,396 $64,988 $58,848 $55,608 $51,991 Pro-rata Adjustment to 52 Weeks(n) -- -- -- (1,122) -- -- -- -- $63,773 $71,990 $71,533 $70,274 $64,988 $58,848 $55,608 $51,991 a) Includes non-cash, stock-based compensation. b) Loss (gain) on disposal of assets and adjustments to assets held for sale, net includes adjustments to reduce the carrying amount for assets held for sale to estimated fair value less cost to sell, loss or gain on disposal of assets related to sales, retirements and replacement or write-off of leasehold improvements or equipment in the ordinary course of business, net gains or losses recorded associated with the sale of company-operated restaurants to franchisees, gains from the write-off of right-of-use assets and operating lease liabilities related to the terminations of leases and net gains or losses recorded associated with sale-leaseback transactions. c) Includes costs related to impairment of goodwill. d) Includes costs related to impairment of long-lived assets. e) During 2019, restaurant closure costs include rent expense, non-lease executory costs, other direct costs associated with previously closed restaurants and future obligations associated with the closure or net sublease shortfall of a restaurant. Prior to 2019, restaurant closure costs include costs related to future obligations associated with the closure or net sublease shortfall of a restaurant and lease termination costs, partially offset by sublease income from leases which are treated as deemed landlord financing. f) Includes amortization of favorable lease assets and unfavorable lease liabilities. g) Includes costs associated with debt refinancing transactions in April 2013, April 2014, March 2015 and August 2015. h) Includes costs related to the offer to exchange the Company's common stock for each outstanding warrant in August 2016, the strategic sale process which commenced during 2014 and resulted in the March 2015 Stock Purchase Agreement with LAC and Levy Merger Sub and the June 2015 Business Combination consummated pursuant to the Merger Agreement, as well as costs related to the secondary offering of common stock completed in October 2015. i) Relates to fair value adjustments to the warrants to purchase shares of common stock of Del Taco Holdings (“DTH”) that had been issued to certain of DTH’s equity shareholders, all of which were exchanged for shares of common stock of DTH on March 20, 2015. j) Includes costs associated with the transition of former Company executives, such as severance expense. k) Pre-opening costs consist of costs directly associated with the opening of new restaurants and incurred prior to opening, including restaurant labor, supplies, rent expense and other related pre-opening costs. These are generally incurred over the three to five months prior to opening. l) Includes a $1.8 million increase in fiscal 2014 in workers’ compensation expense due to higher payments and reserves related to underlying claims activity. m) During 2019, other income consists of insurance proceeds related to a fire at a company-operated restaurant. During 2018, other income consists of a gain related to the write-off of unfavorable lease liabilities related to franchise subleases which were terminated in connection with the Company's 37 acquisition of the related franchise-operated restaurants and insurance proceeds related to a fire at a company-operated restaurant. During 2015, other income consists of a gain based on the amount of the liquidating distribution received in excess of our investment in four public partnerships. n) Estimated contribution from the additional operating week during fiscal 2016.
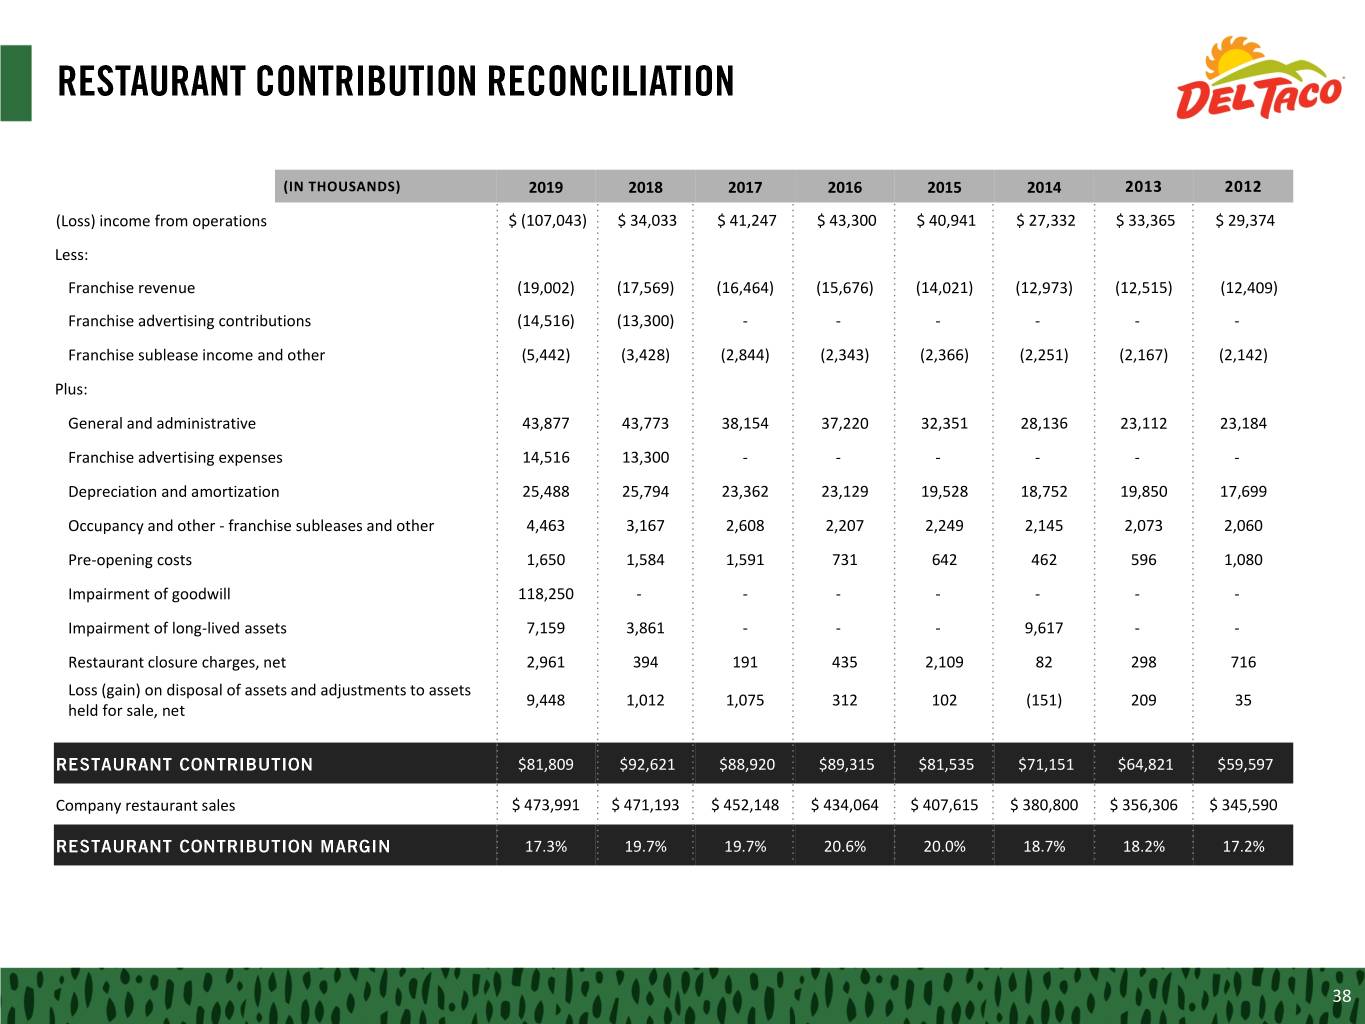
(IN THOUSANDS) 2019 2018 2017 2016 2015 2014 2013 2012 (Loss) income from operations $ (107,043) $ 34,033 $ 41,247 $ 43,300 $ 40,941 $ 27,332 $ 33,365 $ 29,374 Less: Franchise revenue (19,002) (17,569) (16,464) (15,676) (14,021) (12,973) (12,515) (12,409) Franchise advertising contributions (14,516) (13,300) - - - - - - Franchise sublease income and other (5,442) (3,428) (2,844) (2,343) (2,366) (2,251) (2,167) (2,142) Plus: General and administrative 43,877 43,773 38,154 37,220 32,351 28,136 23,112 23,184 Franchise advertising expenses 14,516 13,300 - - - - - - Depreciation and amortization 25,488 25,794 23,362 23,129 19,528 18,752 19,850 17,699 Occupancy and other - franchise subleases and other 4,463 3,167 2,608 2,207 2,249 2,145 2,073 2,060 Pre-opening costs 1,650 1,584 1,591 731 642 462 596 1,080 Impairment of goodwill 118,250 - - - - - - - Impairment of long-lived assets 7,159 3,861 - - - 9,617 - - Restaurant closure charges, net 2,961 394 191 435 2,109 82 298 716 Loss (gain) on disposal of assets and adjustments to assets 9,448 1,012 1,075 312 102 (151) 209 35 held for sale, net $81,809 $92,621 $88,920 $89,315 $81,535 $71,151 $64,821 $59,597 Company restaurant sales $ 473,991 $ 471,193 $ 452,148 $ 434,064 $ 407,615 $ 380,800 $ 356,306 $ 345,590 17.3% 19.7% 19.7% 20.6% 20.0% 18.7% 18.2% 17.2% 38
