Attached files
| file | filename |
|---|---|
| 8-K - FORM 8-K - CubeSmart | tm2030726-1_8k.htm |
Exhibit 99.1
 |
September 2020 |
 |
This presentation contains certain non-GAAP financial measures. The definitions of these terms, the reasons for their use, and reconciliations to the most directly comparable GAAP measures are included in our Earnings Release as well as the Non-GAAP Financial Measures section under the caption "Management's Discussion and Analysis of Financial Condition and Results of Operations" (or similar captions) in our quarterly reports on Forms 10-Q and 10-K, and described from time to time in the Company's filings with the SEC. Financial Measures UseofNon-G Safe Harbor Statement The forward-looking statements contained in this presentation are subject to various risks and known and unknown uncertainties. Although the Company believes the expectations reflected in such forward-looking statements are based on reasonable assumptions, there can be no assurance that the Company's expectations will be achieved. Factors which could cause the Company's actual results, performance, or achievements to differ significantly from the results, performance, or achievements expressed or implied by such statements are set forth under the captions "Item 1A. Risk Factors" and "Forward-Looking Statements" in our annual report on Form 10-K and in our quarterly reports on Form 10-Q and described from time to time in the Company's filings with the SEC. Forward-looking statements are not guarantees of performance. For forward-looking statements herein, the Company claims the protection of the safe harbor for forward-looking statements contained in the Private Securities Litigation Reform Act of 1995. The Company assumes no obligation to update or supplement forward-looking statements that become untrue because of subsequent events. |
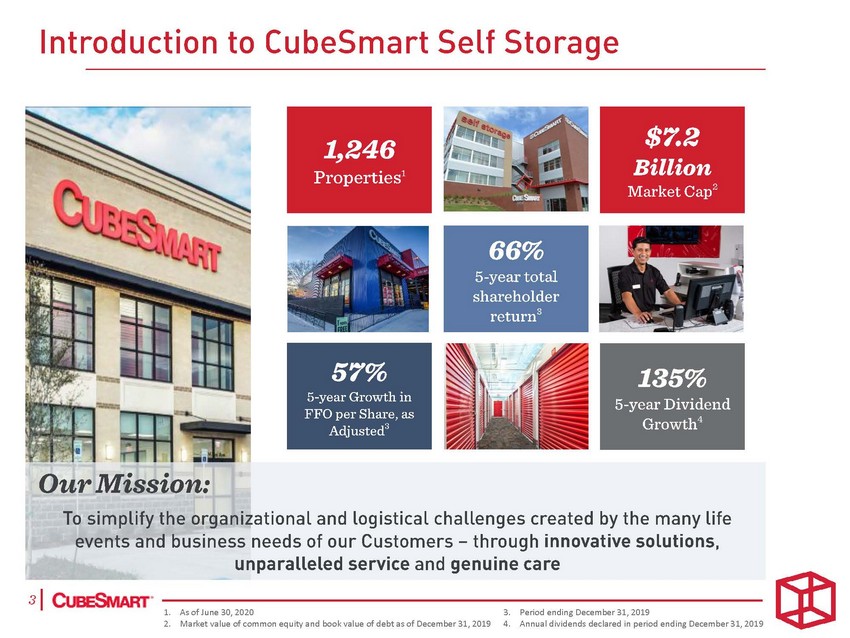 |
Introduction to CubeSmart Self Storage 2 Our Mission: To simplify the organizational and Logistical challenges created by the many Life events and business needs of our Customers-through innovative solutions, unparalleled service and genuine care JIC·--1. -As-of J-une-30,-202-0 ------------------3. -Pe-riod-end-ing-De-cem-ber-31,-201-9 -------2. Market value of common equity and book value of debt as of December 31, 2019 4. Annual dividends declared in period ending December 31,2019 $7.2 Billion MarketCap |
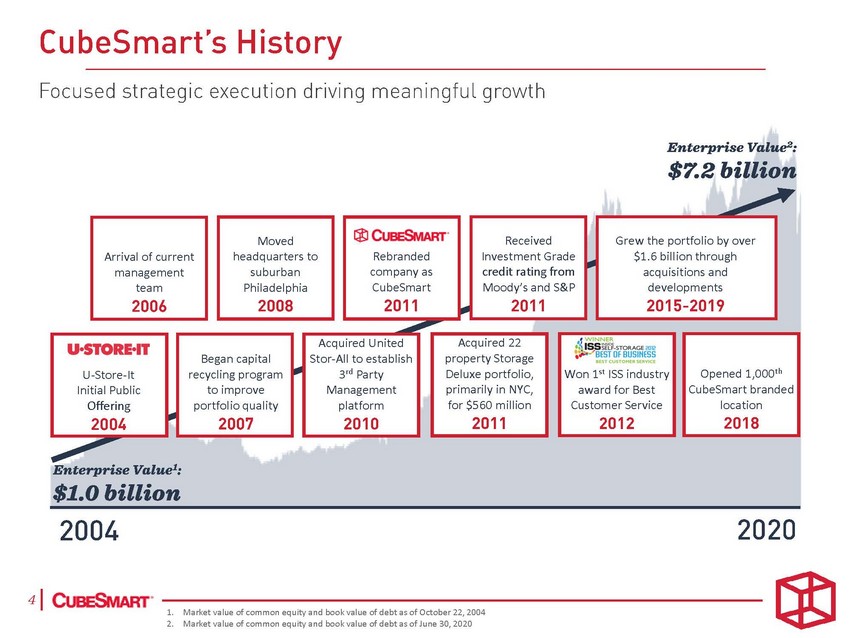 |
1. Market value of common equity and book value of debt as of October 22, 2004 2. Market value of common equity and book value of debt as of June 30, 2020 Began capital recycling program to improve portfolio quality Won 1st ISS industry award for Best Customer Service Opened 1,000th CubeSmart branded location U-Store-It Initial Public Offering Acquired United Stor-All to establish 3rd Party Management platform Acquired 22 property Storage Deluxe portfolio, primarily in NYC, for $560 million Received Investment Grade credit rating from Moody’s and S&P Rebranded company as CubeSmart Moved headquarters to suburban Philadelphia Arrival of current management team Grew the portfolio by over $1.6 billion through acquisitions and developments |
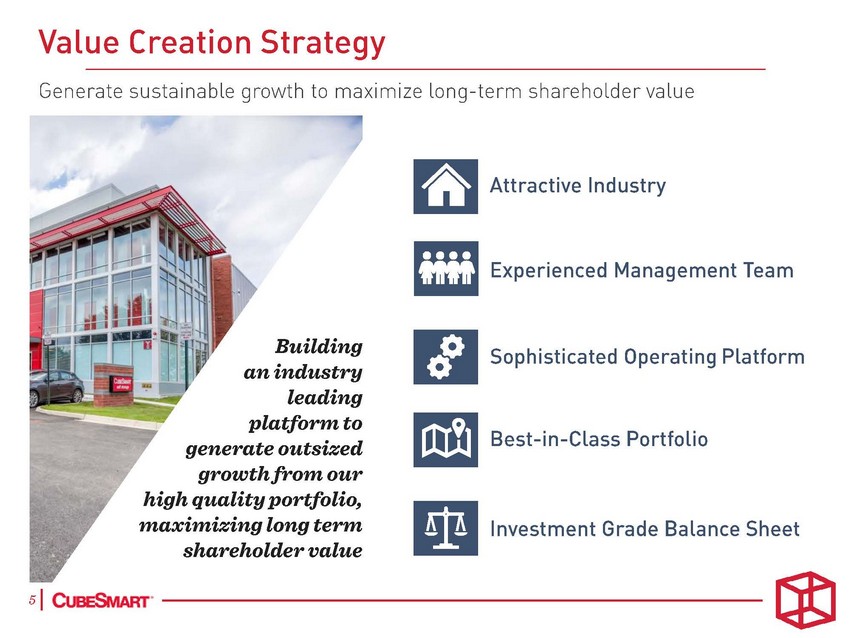 |
Value Creation Strategy Generate sustainable growth to maximize long-term shareholder value Attractive Industry =Experienced Management Team Sophisticated Operating Platform E Best-in-Class Portfolio Investment Grade Balance Sheet Building an industry leading platform to generate outsized growth from our high quality portfolio, maximizing long term shareholder value 510·------------------------------------------- |
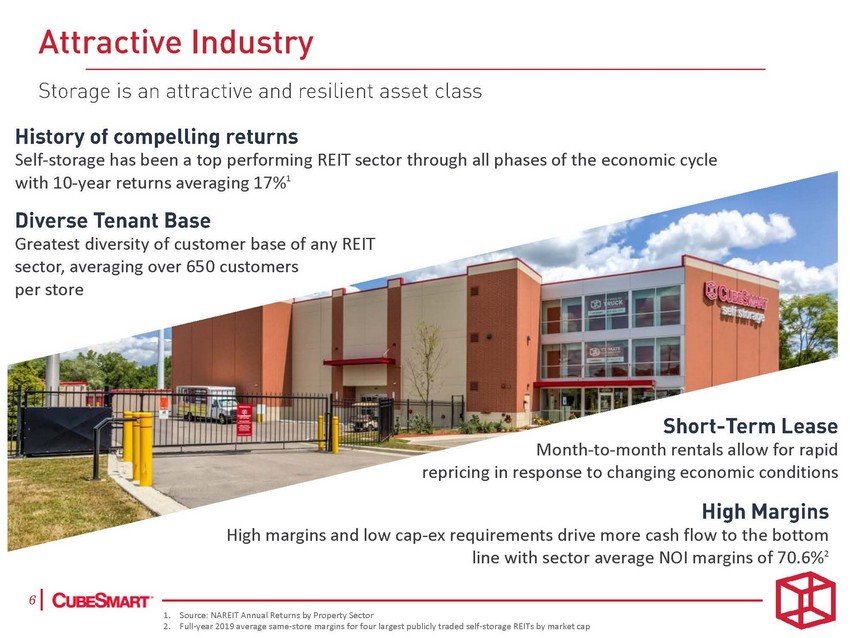 |
Self-storage has been a top performing REIT sector through all phases of the economic cycle with 10-year returns averaging 17%1 Greatest diversity of customer base of any REIT sector, averaging over 650 customers per store Month-to-month rentals allow for rapid repricing in response to changing economic conditions High margins and low cap-ex requirements drive more cash flow to the bottom line with sector average NOI margins of 70.6%2 1. Source: NAREIT Annual Returns by Property Sector 2. Full-year 2019 average same-store margins for four largest publicly traded self-storage REITs by market cap |
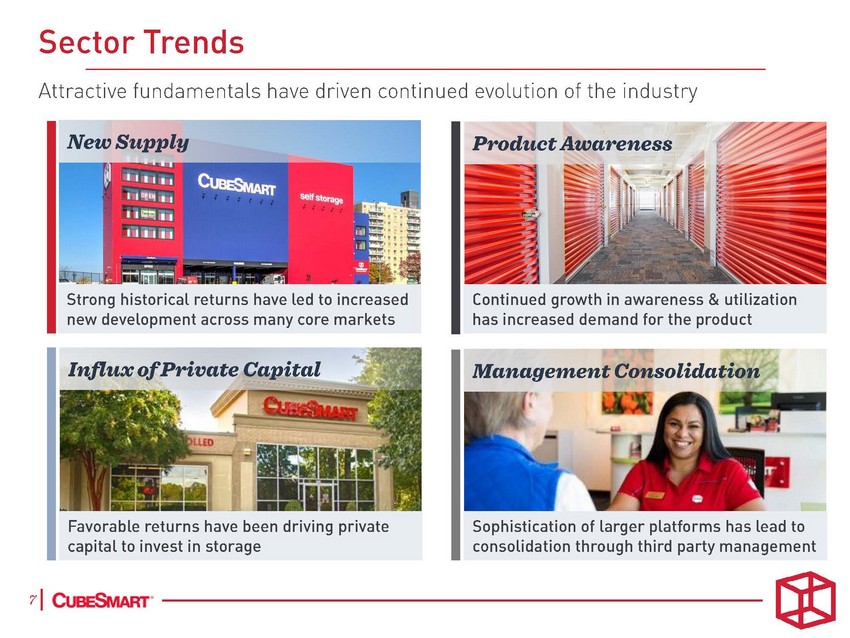 |
Sector Trends Attractive fundamentals have driven continued evolution of the industry New Supply Product Awareness Continued growth in awareness & utilization has increased demand for the product Strong historicalreturns have led to increased new development across many core markets InfluxofPrivate Capital Management Consolidation Favorable returns have been driving private capitalto invest in storage Sophistication of larger platforms has lead to consolidation through third party management 710·------------------------------------------- |
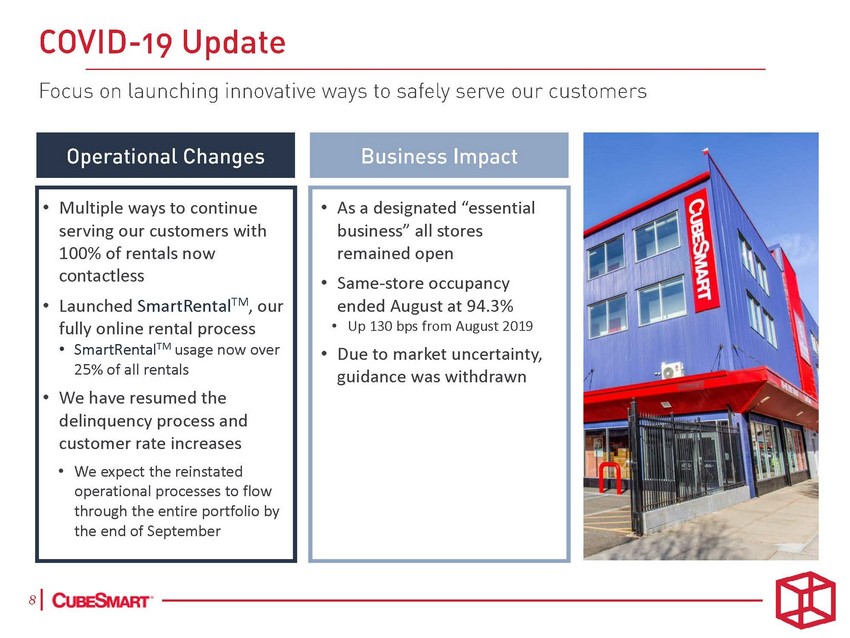 |
guidance was withdrawn • As a designated “essential business” all stores remained open • Same-store occupancy ended August at 94.3% • Up 130 bps from August 2019 • Due to market uncertainty, • Multiple ways to continue serving our customers with 100% of rentals now contactless • Launched SmartRentalTM, our fully online rental process • SmartRentalTM usage now over 25% of all rentals • We have resumed the delinquency process and customer rate increases • We expect the reinstated operational processes to flow through the entire portfolio by the end of September |
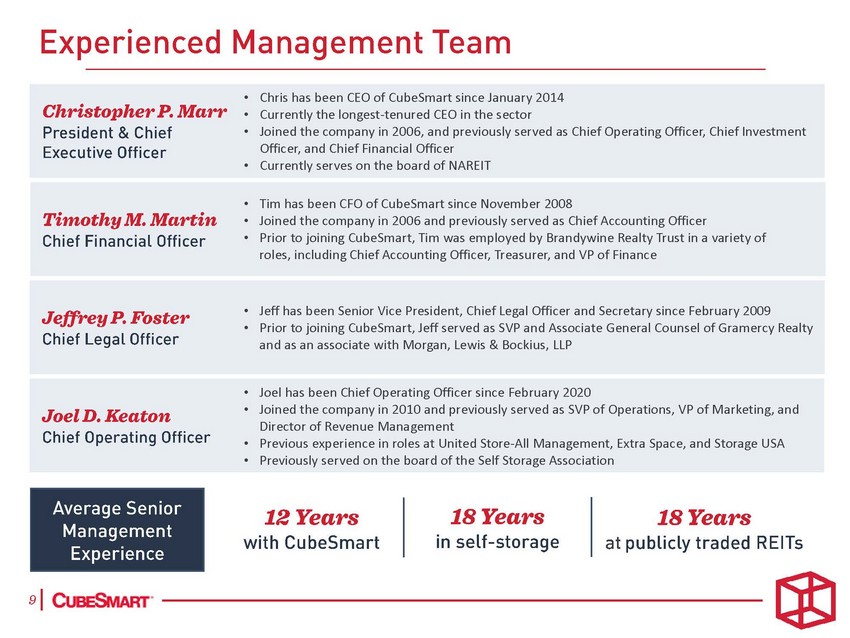 |
• Joel has been Chief Operating Officer since February 2020 • Joined the company in 2010 and previously served as SVP of Operations, VP of Marketing, and Director of Revenue Management • Previous experience in roles at United Store-All Management, Extra Space, and Storage USA • Previously served on the board of the Self Storage Association • Jeff has been Senior Vice President, Chief Legal Officer and Secretary since February 2009 • Prior to joining CubeSmart, Jeff served as SVP and Associate General Counsel of Gramercy Realty and as an associate with Morgan, Lewis & Bockius, LLP • Tim has been CFO of CubeSmart since November 2008 • Joined the company in 2006 and previously served as Chief Accounting Officer • Prior to joining CubeSmart, Tim was employed by Brandywine Realty Trust in a variety of roles, including Chief Accounting Officer, Treasurer, and VP of Finance • Chris has been CEO of CubeSmart since January 2014 • Currently the longest-tenured CEO in the sector • Joined the company in 2006, and previously served as Chief Operating Officer, Chief Investment Officer, and Chief Financial Officer • Currently serves on the board of NAREIT |
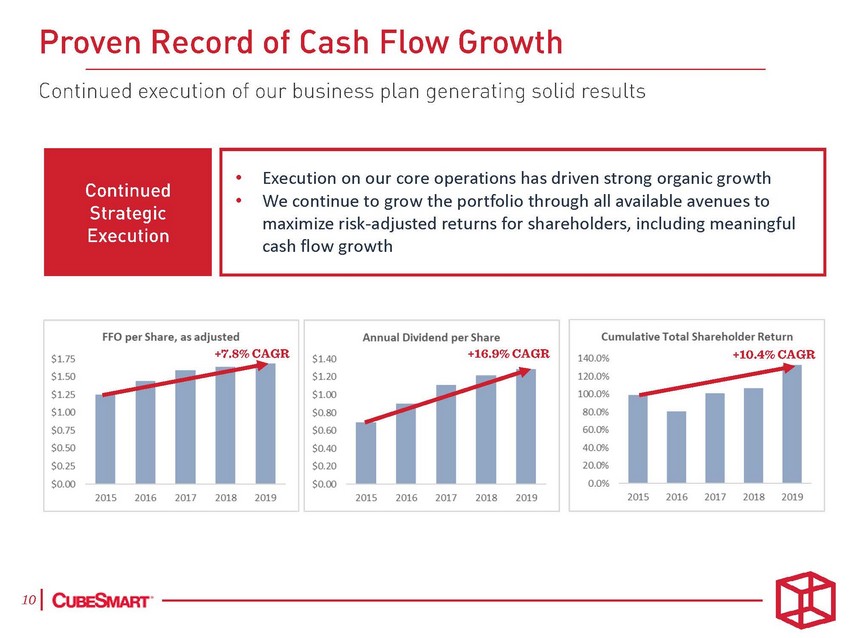 |
•Execution on our core operations has driven strong organic growth •We continue to grow the portfolio through all available avenues to maximize risk-adjusted returns for shareholders, including meaningful cash flow growth |
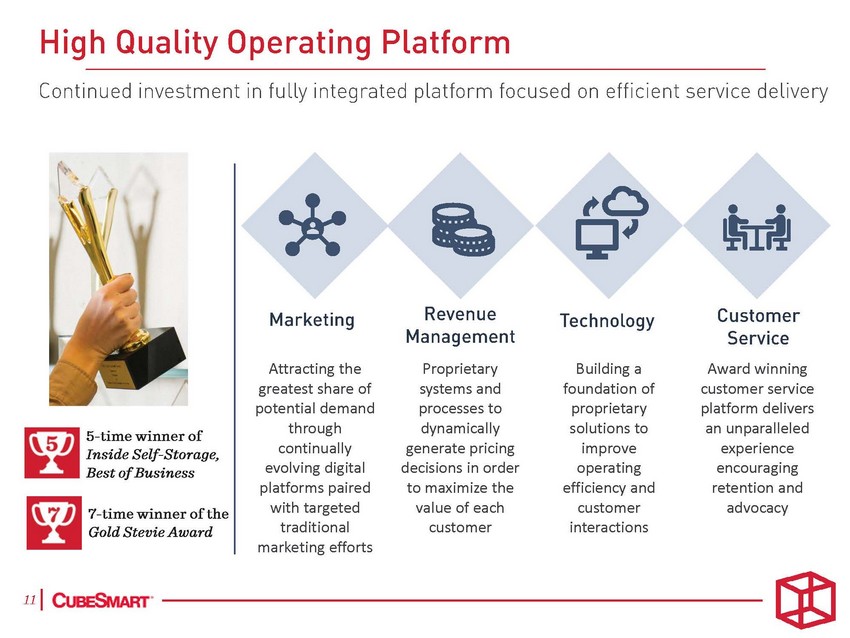 |
Attracting the greatest share of potential demand through continually evolving digital platforms paired with targeted traditional marketing efforts Proprietary systems and processes to dynamically generate pricing decisions in order to maximize the value of each customer Building a foundation of proprietary solutions to improve operating efficiency and customer interactions Award winning customer service platform delivers an unparalleled experience encouraging retention and advocacy |
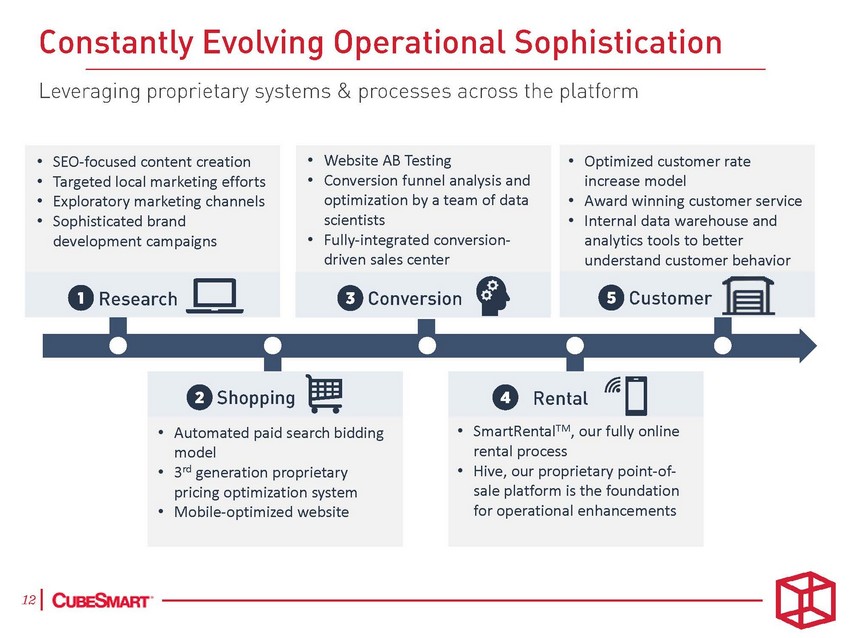 |
• SmartRentalTM, our fully online rental process • Hive, our proprietary point-of-sale platform is the foundation for operational enhancements • Automated paid search bidding model • 3rd generation proprietary pricing optimization system • Mobile-optimized website • Optimized customer rate increase model • Award winning customer service • Internal data warehouse and analytics tools to better understand customer behavior • SEO-focused content creation • Targeted local marketing efforts • Exploratory marketing channels • Sophisticated brand development campaigns • Website AB Testing • Conversion funnel analysis and optimization by a team of data scientists • Fully-integrated conversion-driven sales center |
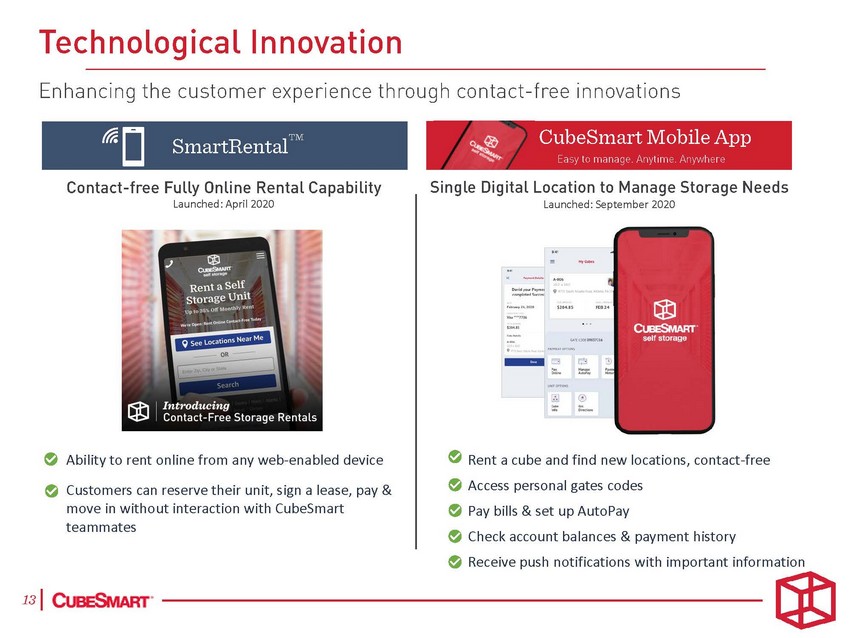 |
Launched: April 2020 Launched: September 2020 • • • • • • • Ability to rent online from any web-enabled device Customers can reserve their unit, sign a lease, pay & move in without interaction with CubeSmart teammates Rent a cube and find new locations, contact-free Access personal gates codes Pay bills & set up AutoPay Check account balances & payment history Receive push notifications with important information |
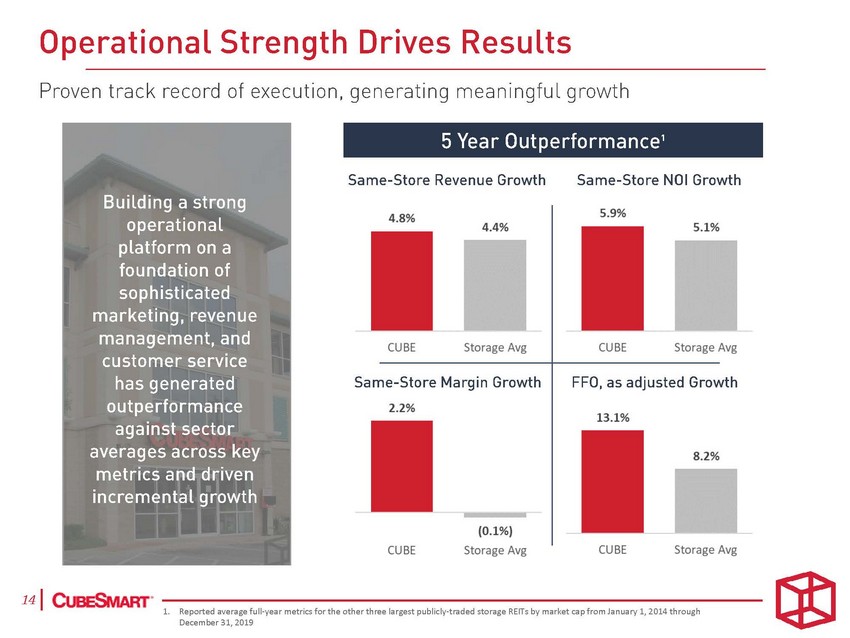 |
Operational Strength Drives Results Proven track record of execution, generating meaningful growth Same-Store Revenue Growth Same-Store NOI Growth operational management, and Avg customer service has generated Same-Store Margin Growth Growth against sector metrics and driven CUBE CUBE Storage Avg Storage Avg 1410·-1-. -Rep-ort-ed -ave-rage-ful-l-y-ear -met-rics-for-the-ot-her-thr-ee -larg-est -pub-licl-y-tr-ade-d st-ora-ge -REI-Ts b-y m-ark-et c-ap f-rom-Ja-nua-ry 1-, 2-014-thr-oug-h ----December 31,2019 4.8%4.4% CUBEStorage Avg 5.9% 5.1% CUBEStorage 2.2% (0.1%) FFO, as adjusted 13.1% 8.2% Building a strong platform on a foundation of sophisticated marketing, revenue outperformance averages across key incrementalgrowth 5 Year Outperformance, |
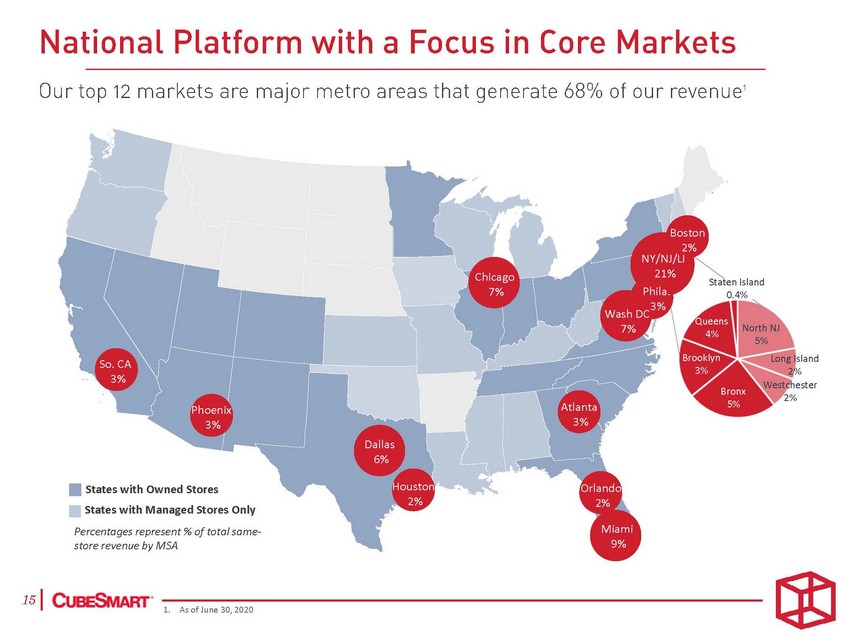 |
Boston 2% NY/NJ/LI 21% Phila. Chicago 7% Staten Island 0.4% Wash DC 3% 7% Queens 4% North NJ 5% Long Island 2% Brooklyn 3% So. CA 3% Westchester 2% Bronx 5% Atlanta 3% Phoenix 3% Dallas 6% Houston 2% Orlando 2% States with Owned Stores States with Managed Stores Only Miami 9% Percentages represent % of total same-store revenue by MSA 1. As of June 30, 2020 |
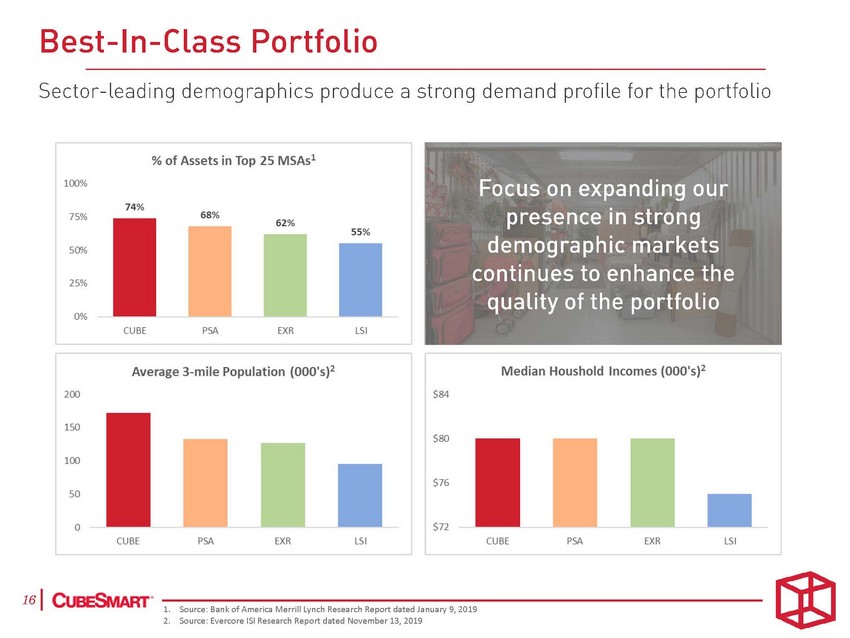 |
Best-In-Class Portfolio Sector-leading demographics produce a strong demand profile for the portfolio % of Assets in Top 25 MSAs1 Fo ng ur 100% 74% 68% 75% 62% 55% 50"/o 25% quality of the portfolio 0% PSA EXR LSI CUBE Median Houshold Incomes (OOO's)2 Average 3-mile Population (OOO's)2 200 $84 150 $80 100 $76 so $72 LSI LSI CUBE PSA EX R CUBE PSA EX R 1610·-1-. -Sou-rce-: Ba-nk -of A-me-rica-Me-rri-ll Ly-nch-Re-sea-rch-Re-port-da-ted-Jan-uar-y 9,-201-9 ---------------------2. Source: Evercore lSI Research Report dated November 13, 2019 c us on expandi presence in strong demographic markets continues to enhance the |
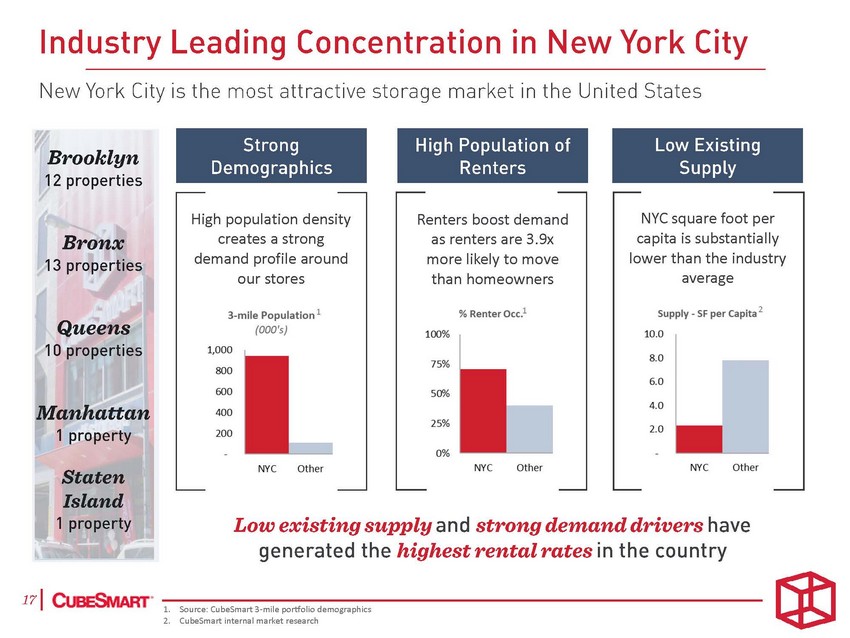 |
1. Source: CubeSmart 3-mile portfolio demographics 2. CubeSmart internal market research NYC square foot per capita is substantially lower than the industry average 2 Renters boost demand as renters are 3.9x more likely to move than homeowners 1 High population density creates a strong demand profile around our stores 1 |
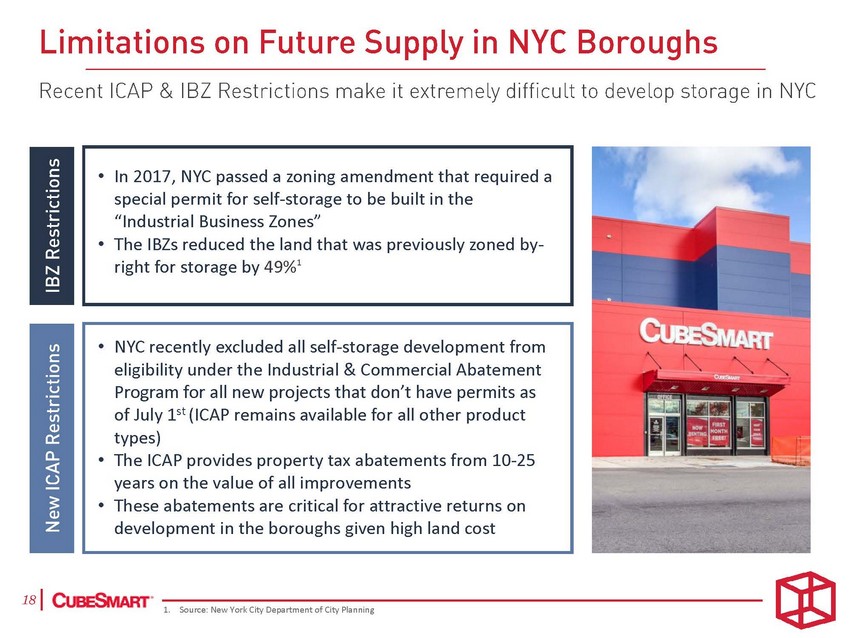 |
1. Source: New York City Department of City Planning • NYC recently excluded all self-storage development from eligibility under the Industrial & Commercial Abatement Program for all new projects that don’t have permits as of July 1st (ICAP remains available for all other product types) • The ICAP provides property tax abatements from 10-25 years on the value of all improvements • These abatements are critical for attractive returns on development in the boroughs given high land cost • In 2017, NYC passed a zoning amendment that required a special permit for self-storage to be built in the “Industrial Business Zones” • The IBZs reduced the land that was previously zoned by-right for storage by 49%1 |
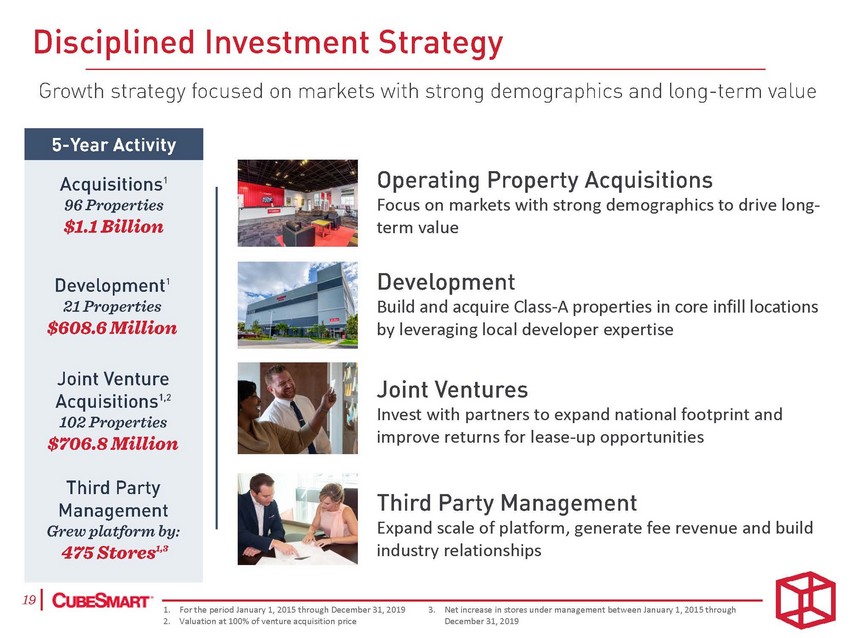 |
Focus on markets with strong demographics to drive long-term value Build and acquire Class-A properties in core infill locations by leveraging local developer expertise Invest with partners to expand national footprint and improve returns for lease-up opportunities Expand scale of platform, generate fee revenue and build industry relationships 1. For the period January 1, 2015 through December 31, 2019 2. Valuation at 100% of venture acquisition price 3. Net increase in stores under management between January 1, 2015 through December 31, 2019 |
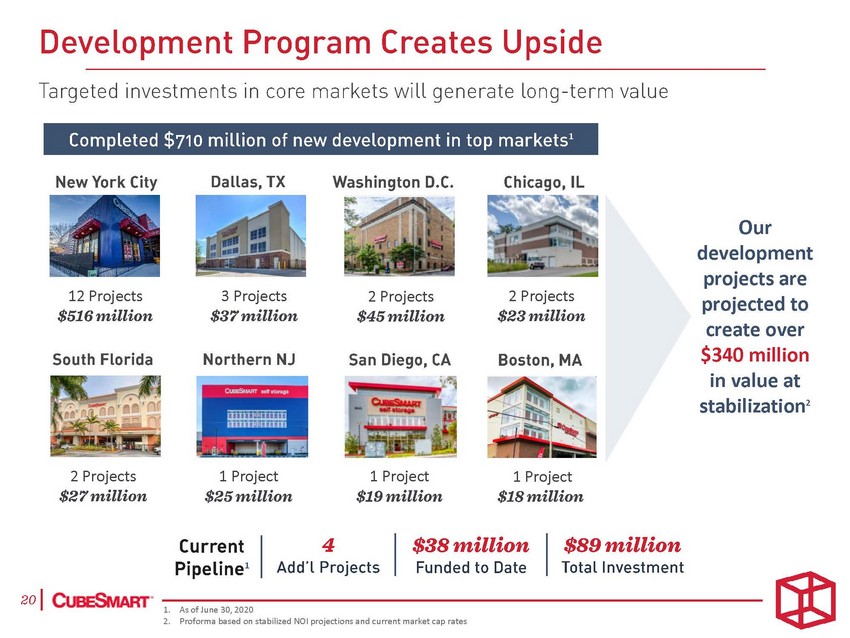 |
Our development projects are projected to create over $340 million in value at stabilization2 12 Projects 3 Projects 2 Projects 2 Projects 2 Projects 1 Project 1 Project 1 Project 1 1. As of June 30, 2020 2. Proforma based on stabilized NOI projections and current market cap rates 1 |
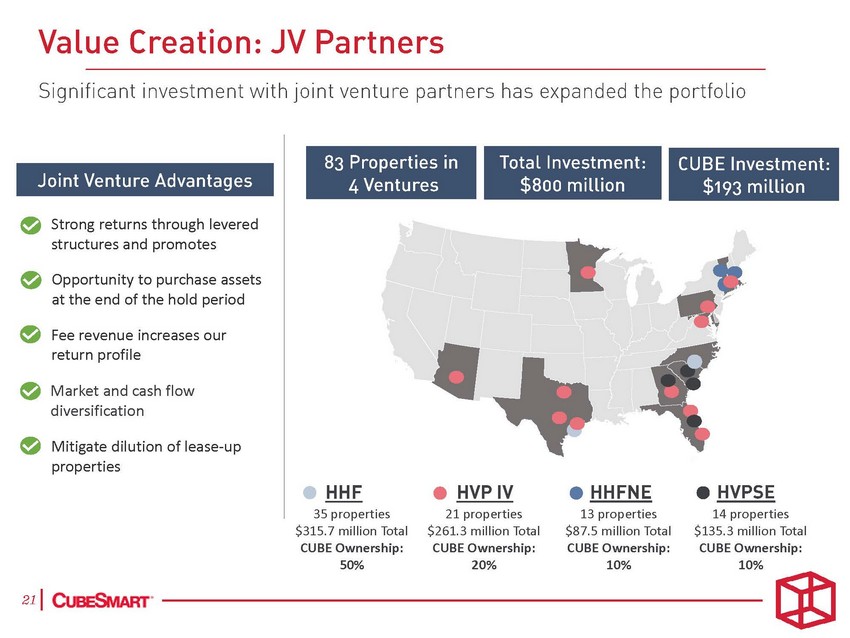 |
Strong returns through levered structures and promotes Opportunity to purchase assets at the end of the hold period Fee revenue increases our return profile Market and cash flow diversification Mitigate dilution of lease-up properties 35 properties $315.7 million Total CUBE Ownership: 50% 21 properties $261.3 million Total CUBE Ownership: 20% 13 properties $87.5 million Total CUBE Ownership: 10% 14 properties $135.3 million Total CUBE Ownership: 10% |
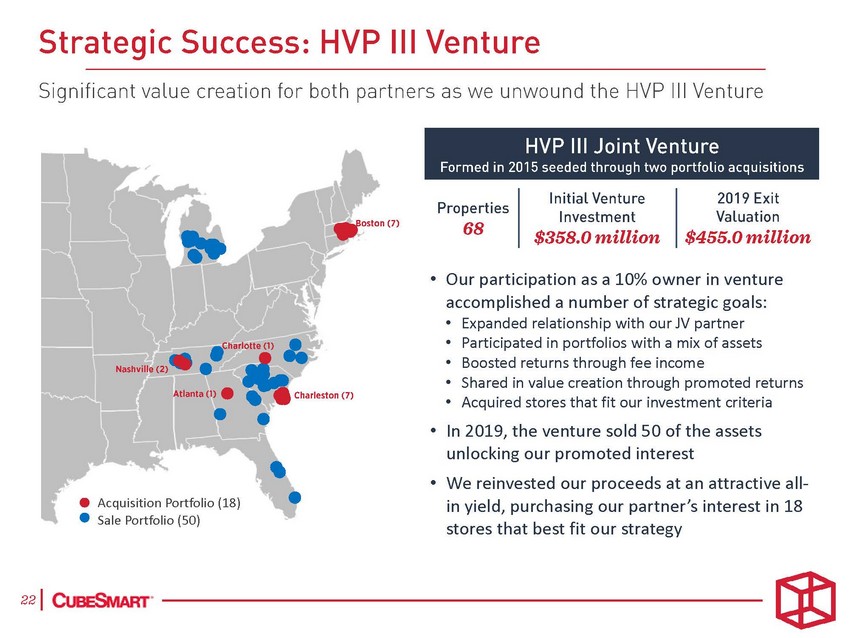 |
• Our participation as a 10% owner in venture accomplished a number of strategic goals: • • • • • Expanded relationship with our JV partner Participated in portfolios with a mix of assets Boosted returns through fee income Shared in value creation through promoted returns Acquired stores that fit our investment criteria • In 2019, the venture sold 50 of the assets unlocking our promoted interest We reinvested our proceeds at an attractive all-in yield, purchasing our partner’s interest in 18 stores that best fit our strategy • Acquisition Portfolio (18) Sale Portfolio (50) |
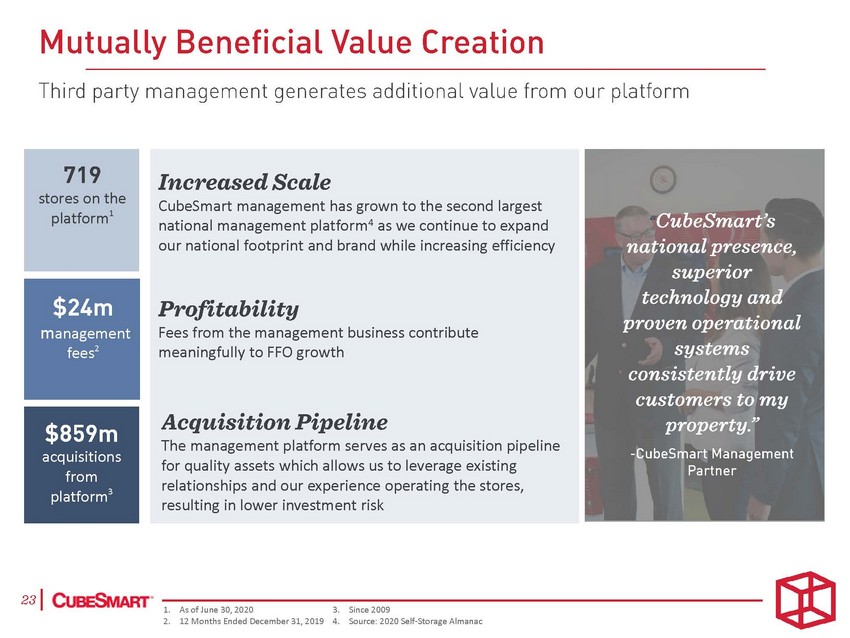 |
national management platform4 as we continue to expand from 1. As of June 30, 2020 3. Since 2009 2. 12 Months Ended December 31, 2019 4. Source: 2020 Self-Storage Almanac acquisitions platform3 ement fees2 CubeSmart management has grown to the second largest our national footprint and brand while increasing efficiency Fees from the management business contribute meaningfully to FFO growth The management platform serves as an acquisition pipeline for quality assets which allows us to leverage existing relationships and our experience operating the stores, resulting in lower investment risk stores on the platform1 |
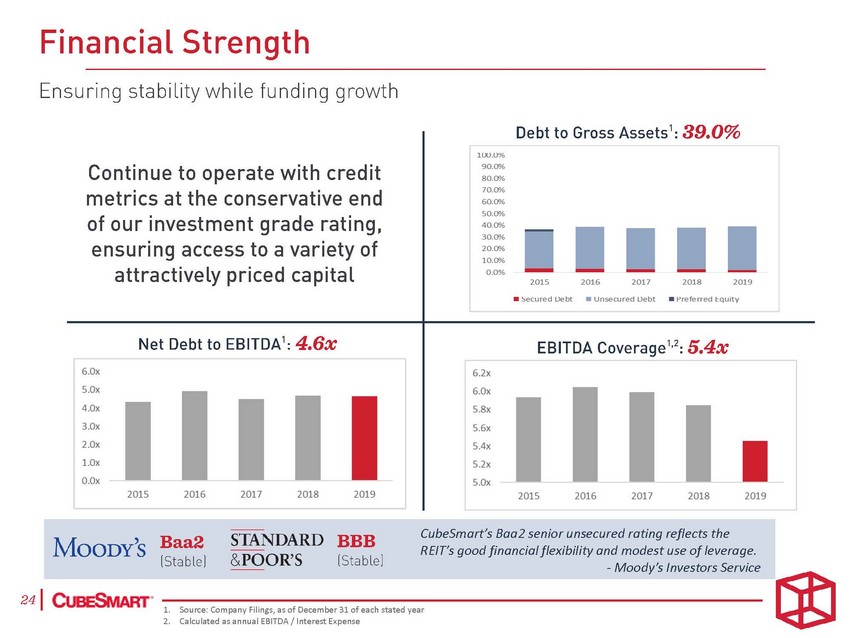 |
Financial Strength Ensuring stability while funding growth Debt to Gross Assets1 : 89.0% 80.0% 60.0% 40.0% 20.0% 2015 2016 2017 2018 2019 ' : 5.4x CubeSmart's Baa2 senior unsecured rating reflects the R EfT's good financial flexibility and modest use of leverage. -Moody's Investors Service ' Baa2 STANDARD &POOR'S BBB [Stable] MOOD Y S [Stable] 24 1 (:· -l.-Sou e:Com panyFilings,asof December3lof each statedyear-------------------------------------2. Calculated asannual EBITDA I Interest Expense Continue to operate with credit metrics at the conservative end of our investment grade rating, ensuring access to a variety of attractively priced capital 100.0% 90.0% 70.0% 50.0% 30.0% 10.0% 0.0% • ecured LJe bt •Unsecured LJebt•Preferred tquit y Net Debt to EBITDA1 : 4.6x 6.0x S.Ox 4.0x 3.0x 2.0x l.Ox O.Ox 20152016 201720182019 EBITDA Coverage1 2 6.2x 6.0x 5.8x 5.6x 5.4x 5.2x S.Ox 20152016 2017 20182019 |
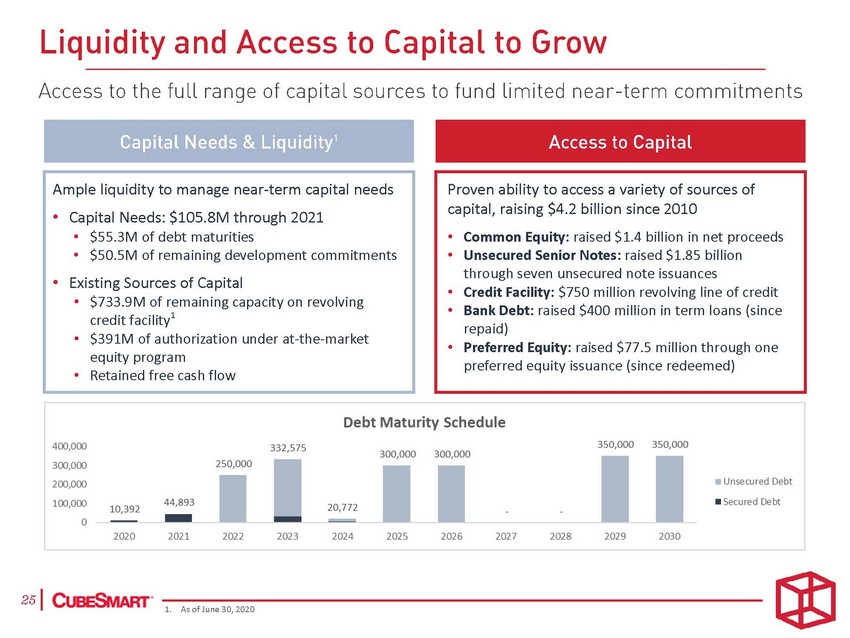 |
• $733.9M of remaining capacity on revolving • $391M of authorization under at-the-market • Retained free cash flow 1. As of June 30, 2020 Ample liquidity to manage near-term capital needs • Capital Needs: $105.8M through 2021 • $55.3M of debt maturities • $50.5M of remaining development commitments • Existing Sources of Capital credit facility1 equity program Proven ability to access a variety of sources of capital, raising $4.2 billion since 2010 • Common Equity: raised $1.4 billion in net proceeds • Unsecured Senior Notes: raised $1.85 billion through seven unsecured note issuances • Credit Facility: $750 million revolving line of credit • Bank Debt: raised $400 million in term loans (since repaid) • Preferred Equity: raised $77.5 million through one preferred equity issuance (since redeemed) |
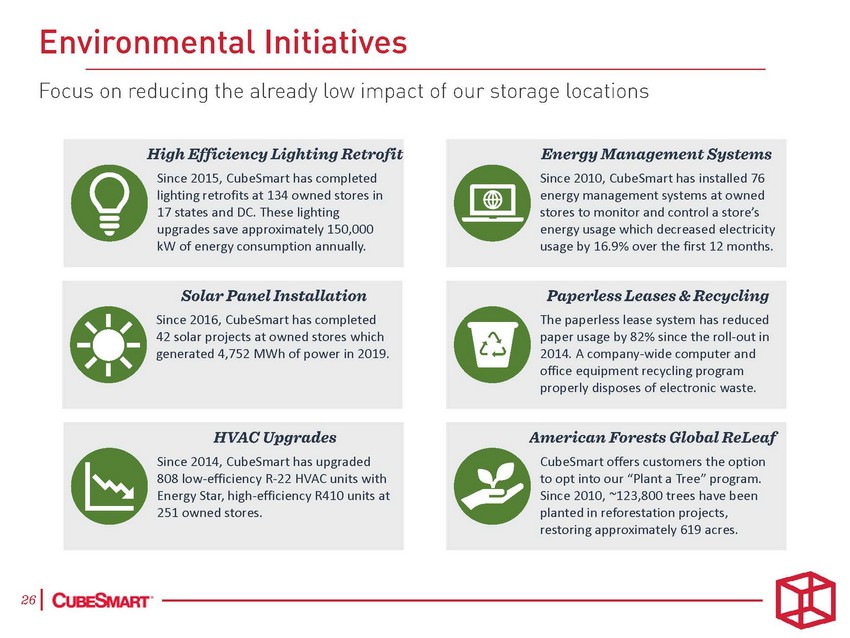 |
CubeSmart offers customers the option to opt into our “Plant a Tree” program. Since 2010, ~123,800 trees have been planted in reforestation projects, restoring approximately 619 acres. Since 2014, CubeSmart has upgraded 808 low-efficiency R-22 HVAC units with Energy Star, high-efficiency R410 units at 251 owned stores. The paperless lease system has reduced paper usage by 82% since the roll-out in 2014. A company-wide computer and office equipment recycling program properly disposes of electronic waste. Since 2016, CubeSmart has completed 42 solar projects at owned stores which generated 4,752 MWh of power in 2019. Since 2010, CubeSmart has installed 76 energy management systems at owned stores to monitor and control a store’s energy usage which decreased electricity usage by 16.9% over the first 12 months. Since 2015, CubeSmart has completed lighting retrofits at 134 owned stores in 17 states and DC. These lighting upgrades save approximately 150,000 kW of energy consumption annually. |
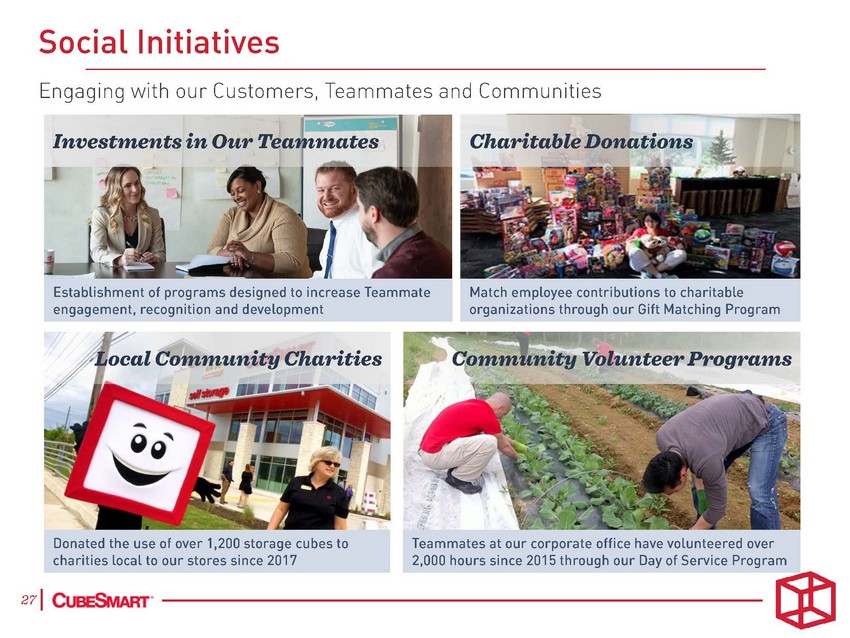 |
Social Initiatives Engaging with our Customers, Teammates and Communities Investments in Our Teammates Charitable Donations Establishment of programs designed to increase Teammate engagement, recognition and development Match employee contributions to charitable organizations through our Gift Matching Program Community Charities Donated the use of over 1,200 storage cubes to Teammates at our corporate office have volunteered over 2,000 hours since 2015 through our Day of Service Program charities localto our stores since 2017 ® 2710·---------------------------------------------- |
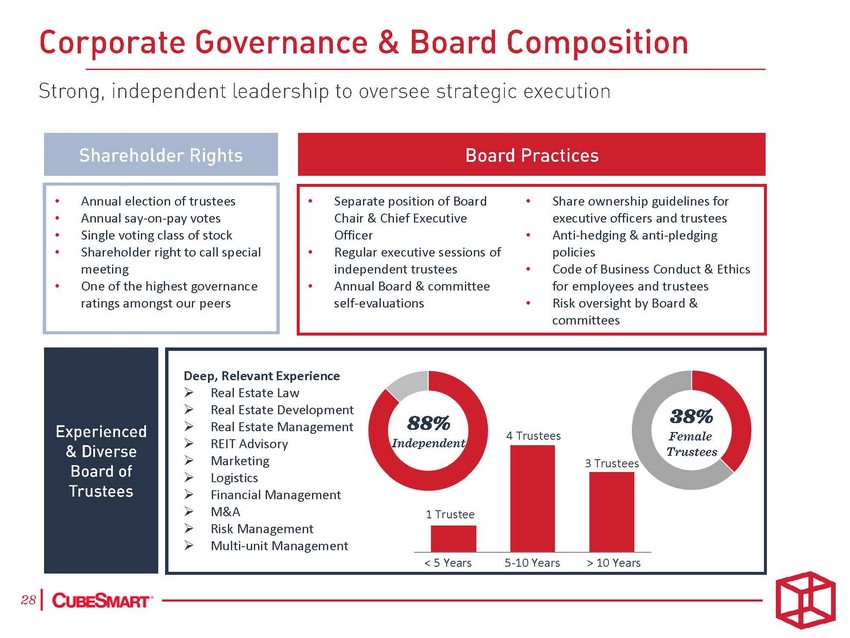 |
4 Trustees ➢ REIT Advisory Deep, Relevant Experience ➢Real Estate Law ➢Real Estate Development ➢Real Estate Management ➢Marketing3 Trustees ➢Logistics ➢Financial Management ➢M&A1 Trustee ➢Risk Management ➢Multi-unit Management < 5 Years5-10 Years> 10 Years •Annual election of trustees •Annual say-on-pay votes •Single voting class of stock •Shareholder right to call special meeting •One of the highest governance ratings amongst our peers •Separate position of Board • Share ownership guidelines for Chair & Chief Executive executive officers and trustees Officer • Anti-hedging & anti-pledging •Regular executive sessions ofpolicies independent trustees•Code of Business Conduct & Ethics •Annual Board & committeefor employees and trustees self-evaluations•Risk oversight by Board & committees |
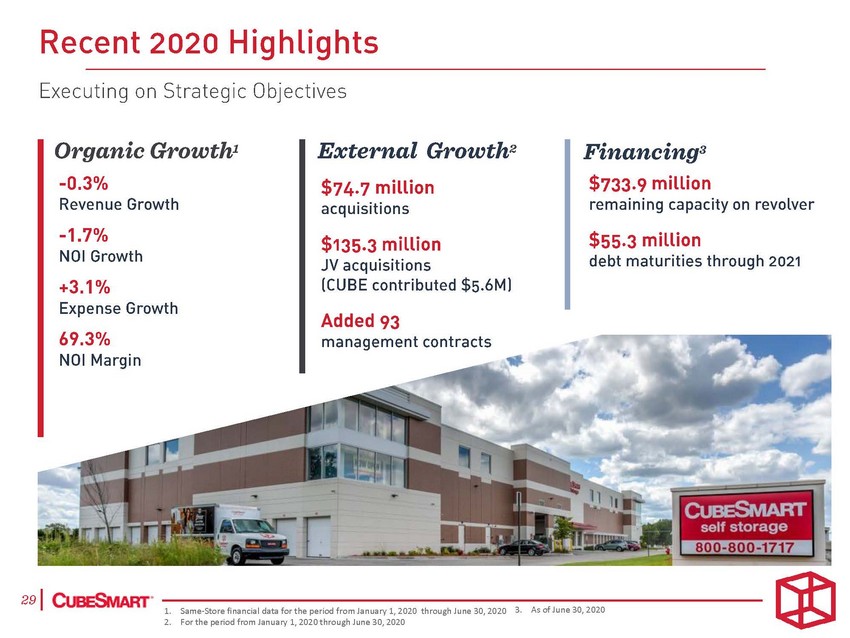 |
Recent 2020 Highlights Executing on Strategic Objectives Organic Growth1 -0.3°/o Revenue Growth -1.7°/o NOI Growth +3.1°/o Expense Growth 69.3°/o NOI Margin External Growth2 $74-7 million acquisitions Financing3 $733-9 million remaining capacity on revolver $55.3 million debt maturities through 2021 $135.3 million JV acquisitions (CUBE contributed $5.6M) Added 93 management contracts 2910·--1. -Sa-me--Sto-re fi-nan-cia-l da-ta f-or t-he p-eri-od -from-Ja-nua-ry1-,20-20-thr-oug-h J-une-30-, 20-20 -3-. 2. For the period from January 1, 2020through June 30,2020 A-s o-f Ju-ne 3-0, 2-02-0 ----------- |
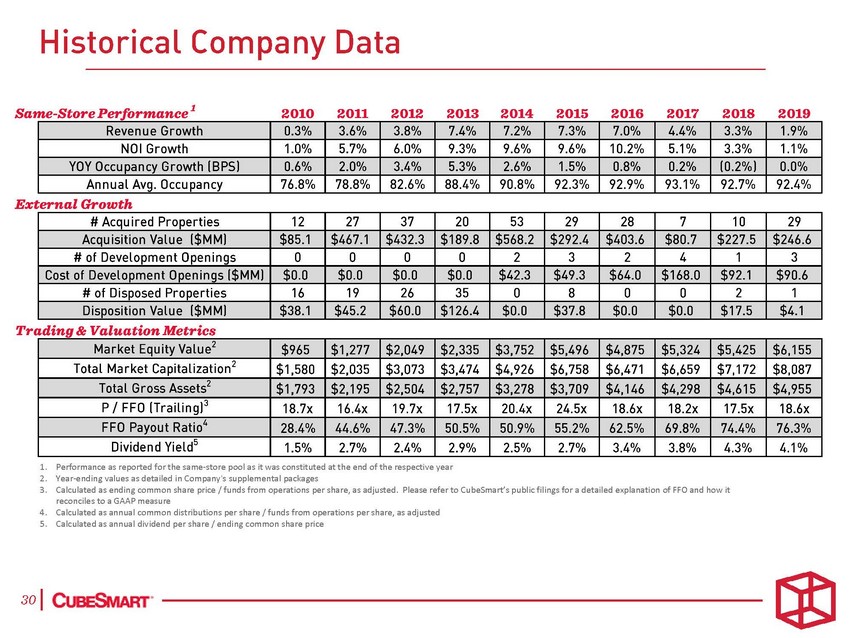 |
1. 2. 3. Performance as reported for the same-store pool as it was constituted at the end of the respective year Year-ending values as detailed in Company's supplemental packages Calculated as ending common share price / funds from operations per share, as adjusted. Please refer to CubeSmart’s public filings for a detailed explanation of FFO and how it reconciles to a GAAP measure Calculated as annual common distributions per share / funds from operations per share, as adjusted Calculated as annual dividend per share / ending common share price 4. 5. |
 |
[LOGO] |