Attached files
| file | filename |
|---|---|
| 8-K - FORM 8-K - CUBIC CORP /DE/ | tm2030734d1_8k.htm |
Exhibit 99.1

September 2020 CUBIC CORPORATION OVERVIEW

SAFE HARBOR AND DISCLOSURES 2 Cubic Corporation Overview September 2020 | This presentation contains statements that relate to future events and expectations and as such constitute forward - looking state ments within the meaning of the Private Securities Litigation Reform Act of 1995. Any statements about our expectations, beliefs, plans, objectives, assumptions or f utu re events or our future financial or operating performance are not historical and may be forward - looking. These statements are often, but not always, made through th e use of words or phrases such as “may,” “will,” “anticipate,” “estimate,” “plan,” “project,” “goal,” “continuing,” “ongoing,” “expect,” “believe,” “intend,” “ pre dict,” “potential,” “opportunity” and similar words or phrases or the negatives of these words or phrases. These statements involve estimates, assumptions and uncertainties, includ ing those discussed in the section entitled “Risk Factors” in our Annual Report on Form 10 - K for the fiscal year ended September 30, 2019 and updated in any subsequent Quar terly Reports on Form 10 - Q and other filings that we make with the Securities and Exchange Commission, that could cause actual results to differ materially fro m those expressed in these statements. Because the risk factors referred to above could cause actual results or outcomes to differ materially from those expressed i n a ny forward - looking statements made by us or on our behalf, you should not place undue reliance on any forward - looking statements. Further, any forward - looking statement speaks only as of the date on which it is made, and we undertake no obligation to update any forward - looking statement to reflect events or circumstances after the date o n which the statement is made or to reflect the occurrence of unanticipated events, or combination of factors, may cause actual results to differ materially from th ose contained in any forward - looking statements. This presentation also includes financial measures that are not prepared in accordance with U.S. generally accepted accountin g p rinciples ("GAAP"). These non - GAAP financial measures supplement our GAAP disclosures and should be considered in addition to, but not as a substitute for, the app licable GAAP measure. In addition, other companies may define these non - GAAP measures differently and, as a result, our non - GAAP measures may not be directly comparable to the non - GAAP measures of other companies. We believe that presenting our results and measures on a non - GAAP basis in conjunction with GAAP measures prov ides the most meaningful basis for comparison of our operating results across periods. Reconciliations of these non - GAAP financial measures to the most directly co mparable GAAP financial measures can be found in the Appendix to this presentation.
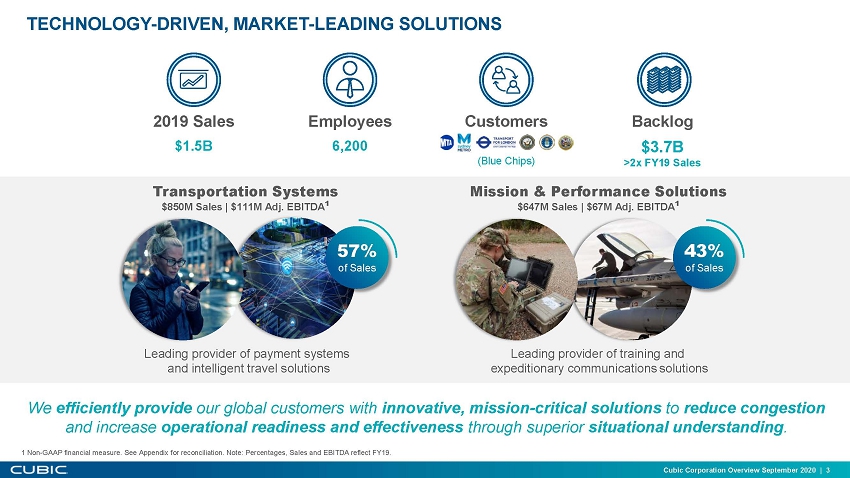
We efficiently provide our global customers with innovative, mission - critical solutions to reduce congestion and increase operational readiness and effectiveness through superior situational understanding . TECHNOLOGY - DRIVEN, MARKET - LEADING SOLUTIONS 3 2019 Sales Employees Customers Backlog $1.5B 6,200 $3.7B >2x FY19 Sales (Blue Chips) Transportation Systems $850M Sales | $111M Adj. EBITDA 1 Mission & Performance Solutions $647M Sales | $67M Adj. EBITDA 1 57% of Sales Leading provider of payment systems and intelligent travel solutions Leading provider of training and expeditionary communications solutions Cubic Corporation Overview September 2020 | 43% of Sales 1 Non - GAAP financial measure. See Appendix for reconciliation. Note: Percentages, Sales and EBITDA reflect FY19.
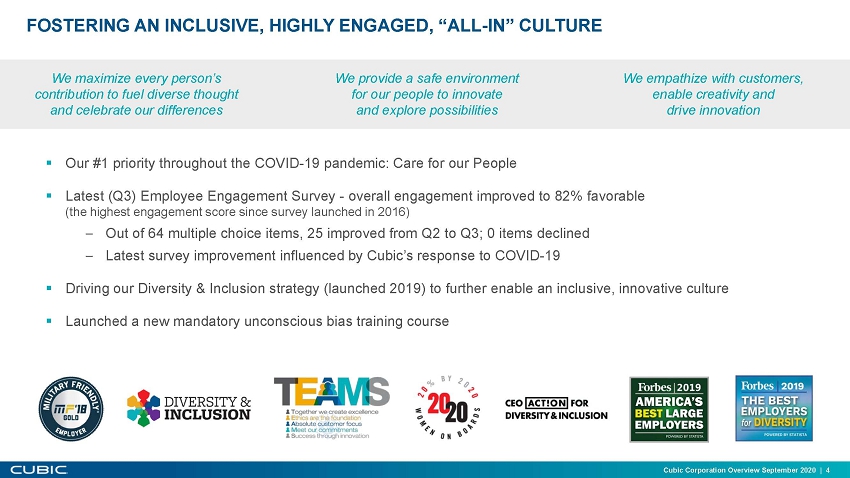
FOSTERING AN INCLUSIVE, HIGHLY ENGAGED, “ALL - IN” CULTURE 4 ▪ Our #1 priority throughout the COVID - 19 pandemic: Care for our People ▪ Latest (Q3) Employee Engagement Survey - o verall engagement improved to 82% favorable (the highest engagement score since survey launched in 2016) – Out of 64 multiple choice items, 25 improved from Q2 to Q3; 0 items declined – Latest survey improvement influenced by Cubic’s response to COVID - 19 ▪ Driving our Diversity & Inclusion strategy (launched 2019) to further enable an inclusive, innovative culture ▪ Launched a new mandatory unconscious bias training course We maximize every person’s contribution to fuel diverse thought and celebrate our differences We empathize with customers, enable creativity and drive innovation We provide a safe environment for our people to innovate and explore possibilities Cubic Corporation Overview September 2020 |

2017 2018 2019 STRONG RECENT FINANCIAL PERFORMANCE WITH MANY ACHIEVEMENTS 5 $88 $105 $147 7.9% 8.7% 9.8% 4.0% 6.0% 8.0% 10.0% 12.0% 14.0% 16.0% 18.0% 20.0% $0 $20 $40 $60 $80 $100 $120 $140 $160 2017 2018 2019 29% CAGR Adj. EBITDA 1 ($M) & Margin 1 (%) $1,108 $1,203 16% CAGR $1,496 Sales ($M) 1 Non - GAAP financial measure. See Appendix for reconciliation. RF = radio frequency. T2C2 = Transportable Tactical Command Communications. LVC - G = Live Virtual Constructive - Gaming. IDIQ = Indefinite Delivery Indef inite Quantity. Cubic Corporation Overview September 2020 | $18 $32 $53 $52 $50 1.3% 2.2% 3.5% 4.4% 3.4% 0% 2% 4% 6% 8% 10% 12% 14% 16% 18% $0 $10 $20 $30 $40 $50 $60 2015 2016 2017 2018 2019 R&D ($M) & % of Sales Major wins and progress on our strategic priorities • One Account strategy led to major fare collection awards in transportation • Advancement in revolutionizing mobile engagement, including Moovit partnership • Achieved GATR T2C2 Full Rate Production milestone; contract ceiling doubled • C4ISR mission chain strategy and investments drove key franchise program wins • Training positioned for growth in defense and new markets with LVC - G innovation Built significant backlog due to investment in innovation • 2017 - 2019 Book - to - Bill >1.3X • Backlog grew to company record of $4.1B in 2018 ($4.8B with unfunded T2C2 IDIQ) up from $2.5B in 2017 Enhanced portfolio, sharpened focus (technology - driven, market - leading) • Divested Defense Services business • Executed strategic acquisitions: ̶ Trafficware and GRIDSMART: leader in intelligent intersection management ̶ Nuvotronics : disruptive technology provider of advanced RF devices ̶ Pixia : advances our battlefield cloud strategy of processing and disseminating data - rich, actionable intelligence at the edge of the battlefield ̶ Delerrok : fare collection - as - a - service for small - and mid - market

NEXTCUBIC : EFFICIENTLY BUILDING TECHNOLOGY - DRIVEN, MARKET - LEADING BUSINES SES 6 Cubic Corporation Overview September 2020 | Strategy • Founder - centric conglomerate • Technology - driven, market - leading • Efficient, technology - driven, market - leading digital solutions provider • Few breakthroughs every decade • Innovation drives the company Business Model & Infrastructure • Internally - focused • Focused on Winning the Customer • Winning the Customer obsession • Delivering bespoke systems • Productized model/reuse across systems • Scalable products built on platforms • Hodgepodge of IT systems • SAP | GEM | Workday | Salesforce • Enhanced productivity and agility • Many silos , poor communication • Implementing One Cubic • Best - in - class operational effectiveness HR • HR focused on transactions • Strategic HR function, developing talent • Building on D&I culture to drive innovation and HR as talent engine Capital Allocation • Opportunistic • Disciplined allocation of discretionary spend • De - lever to <3.0x • Low - cost acquisitions • M&A aligned with strategy • Drive higher returns on capital Financial Characteristics • Limited ability to grow and scale • Limited focus on margins; London driving company profits • Sales growth and sustainable margins • Fixed - margin systems with long development cycles; periodic and one - time delivery • Growing as - a - service and recurring revenue with higher margins and high cash flow conversion PAST PRESENT FUTURE ( NextCubic )

Driving Efficiencies with Immediate, Impactful Actions 7 Cubic Corporation Overview September 2020 | ACHIEVING THE NEXTCUBIC VISION: NEAR - TERM OPPORTUNITIES EXECUTING DETAILED ROADMAPS TO ACHIEVE SUBSTANTIAL FINANCIAL IMP ACT • Company - wide Improvement Program Expected to Generate $50 - 75M Run - rate Incremental Adj. EBITDA by 2023 ̶ Partnered with leading consulting firm on multi - month, comprehensive operational review with an aim of driving additional performance improvement ̶ Recently launched the implementation phase to bolster margins, streamline operations and drive organic growth ̶ Program also includes significant working capital initiatives ̶ First action: combining Cubic’s defense business segments ̶ Quick - wins to be executed in 2020; ramp - up occurring 2021 - 2023 ̶ Program will further enhance employee engagement, capability and culture

NEAR - TERM OPPORTUNITY TO ENHANCE GROWTH, MARGINS AND CASH FLOW Engineering and manufacturing CTS and CMPS growth • Further optimized corporate functions • Simplified standard tasks • Enhanced controls and discipline around external support • Centralized with category - specific management and best - in - class taxonomy • Strategic sourcing/negotiations Total run rate 8 Cubic Corporation Overview September 2020 | • Run rate at end of 2023 G&A and external spend • Digital platforms • Surface transport management, including expanded geographic reach and enhanced products • Mega - city urban revenue management (leverage best - in - class position; further improve efficiency) • Integration of defense businesses • Deliver multi - domain live, virtual, constructive (LVC) training • Capitalize and grow franchise wins – execute efficiently Incremental Adj. EBITDA Opportunity • Best - in - class engineering and enhanced quality performance through optimized structure • Improved deployment/utilization of engineers • Prioritized product roadmap strategy • Manufacturing further centralized into three Centers of Excellence

ACHIEVING THE NEXTCUBIC VISION: LONGER - TERM INITATIVES DRIVING SUBSTANTIAL MID - TERM FINANCIAL IMPACT NextCubic : Driving Growth, Scale, Efficiency and Culture to Deliver Greater Customer Value and Superior Profit 9 Cubic Corporation Overview September 2020 | • Drive organic sales growth ̶ Deliver on our commitments – execute our backlog efficiently ̶ Expand beyond core markets in under - scaled key adjacencies ̶ Provide value - based solutions and expand business to sustainable, subscription - based revenue models ̶ Capitalize and grow franchise programs ̶ Expand dual technology for commercial and defense markets • Further drive margins and operating leverage ̶ Optimize engineering, G&A, external spend and manufacturing ̶ Enable competitive advantages through scale and smart investment • Improve capital efficiency with increased free cash flow ̶ Commitment to target net leverage of <3.0x ̶ Strong focus on returns on invested capital – increase ROIC to mid - teens • Enable innovation and performance through culture ̶ Leveraging our strengths: purpose, teams, integrity, diversity and inclusion ̶ Effective oversight through refreshed, purpose - built, highly engaged Board Mid to high single - digit organic sales growth CAGR Increase Adj. EBITDA margin to mid - teens Mid - term Targeted Impacts (projected results by FY25)

NEXTCUBIC : CUBIC TRANSPORTATION SYSTEMS 10 Cubic Corporation Overview September 2020 | Solving Customers’ Mobility Challenges with Innovative Solutions • Strategic Priorities to Drive Profitable Growth ̶ Digital Platform: Multi - agency TouchPass with cEMV & SagePay , enhanced mobile ticketing, including international expansion with multilingual, multicurrency and GDPR compliance ̶ Surface Transport Management (STM): Scale up STM, leverage best - in - class products and drive growth from increased demand for intersection and congestion management ̶ Mega - City Urban Revenue Management: Capitalize on leading, best - in - class position; investment to further reduce costs and deployment cycles and enriched features • Highlights of Execution Roadmap ̶ Expand and integrate multi - agency Digital platform with mobility payments; multi - modal journey planning; loyalty & rewards and complete MaaS offering integrated with Moovit ̶ Invest in reimagined/expanded sales force and marketing to facilitate national and international expansion ̶ Further integrate Trafficware /GRIDSMART to enhance cross - selling; capitalize on strong market position ̶ Redirect engineering efforts to ensure standardized, productized versions of key offerings ̶ Enhance position on contact free technologies with further enhancements in gates, validators and virtual ticket agent GDPR = General Data Protection Regulation. MaaS – Mobility as a Service.

NEXTCUBIC : CUBIC MISSION & PERFORMANCE SOLUTIONS 11 Cubic Corporation Overview September 2020 | Integrated Mission Capabilities and Performance Solutions for the Future, Multi - domain Operational Environment STIGS = Surface Training Immersive Gaming and Simulations. HCB = High Capacity Backbone. ABMS = Advanced Battle Management Sy ste m. SLATE = Secure Live Virtual Constructive Advanced Training Environment. STE = Synthetic Training Environment. FoF = Force on Force. • Strategic Priorities to Drive Profitable Growth ̶ Capitalize franchise wins and execute efficiently – STIGS, HCB, ABMS, F - 35, MQ - 25, MH - 60, Boomslang, Troposcatter ̶ Leverage differentiated SWaP and mission chain strategy – connecting the battlefield of the future from edge to edge – including high - value data exploitation, secure multi - band communications and critical enabling hardware ̶ Grow digital platforms – build on existing capabilities in data aggregation, analytics, visualization and game - based training ̶ Deliver multi - domain LVC training – next - generation air (SLATE) and ground training (STE, FoFNext ) • Highlights of Execution Roadmap ̶ Invest in critical enabling capabilities – optimize IRAD funding to highest return and growth opportunities ̶ Expand business development efforts across defense, commercial and international customer segments ̶ Integrate defense businesses to capture synergies and operational efficiencies while leveraging technical capabilities and customer relationships

ACCELERATING OUR ESG STRATEGIC PRIORITY Corporate Responsibility has Always Been a Part of Cubic’s Culture ERG = Employee Resource Group. FWA = Flexible Work Arrangement. HSE = Heath, Safety and Environment. NEO = Named Executive O ffi cer. LVC = Live Virtual Constructive. Transportation Systems: Our intelligent travel solutions enhance mobility and safety and help cities reduce the environmental and economic costs of traffic congestion Mission & Performance Solutions: Our LVC training and networked C4ISR solutions improve mission effectiveness and readiness, reduce physical footprint , and enable a safer world All Segments Support Our ESG Journey x Hired Sr. Director of Responsible Business & Sustainability x Began foundational ESG work x D&I strategy rolled out; 10 ERGs globally x Manufacturing / procurement – low or zero emission designated sites x Implemented majority voting for directors x Signatory to UN Global Compact x Conducted materiality assessment x Developed sustainability strategy x Gathering legacy data; determined KPIs x Launched D&I toolkit, resources and training x Increased Board / NEO stock ownership requirements; improvement to exec. comp. program alignment with shareholders ▪ Finalize ESG objectives and policies ▪ Initial website enhancements/updates ▪ Global COVID - 19 response ▪ Release of first Annual ESG Report ▪ Solar and EV project at corporate office ▪ General waste and water baseline assessments ▪ Implementing HSE management system ▪ Supply chain sustainability, rationalization ▪ Identify and action UN Sustainable Development Goals ▪ Achieve best - in - class ESG status 2017 signatory How LIVING ONE CUBIC 2019 2020 2021+ 12 Cubic Corporation Overview September 2020 |

01 Great market position and large backlog forms foundation for the next wave of transformation 02 NextCubic vision and roadmaps to deliver strong near - and mid - term financial performance 03 Proven innovation with opportunity to accelerate growth through scale within and beyond the core 04 Reinvigoration of shareholder mindset and an execution edge to the workforce 05 Committed to a diverse and inclusive culture, which drives innovation and collaboration across the organization STRONG RECORD OF ACHIEVEMENT, NOW DRIVING A STEP CHANGE IN VALUE CREATION WITH NEXTCUBIC 13 Cubic Corporation Overview September 2020 |

APPENDIX

15 Cubic Corporation Overview September 2020 | CONSOLIDATED ADJUSTED EBITDA RECONCILIATION CONTINUING OPERATIONS – YEARS ENDED SEPTEMBER 30, 2019, SEPTEMBE R 30, 2018, AND SEPTEMBER 30, 2017 Cubic Consolidated ($M) 2019 2018 2017 Sales $ 1,496.5 $ 1,202.9 $ 1,107.7 Net income (loss) from continuing operations attributable to Cubic $ 51.1 $ 8.1 $ (25.7) Noncontrolling interest in loss of VIE (9.8) (0.3) - Provision for income taxes 11.0 7.1 14.6 Interest expense, net 13.9 8.8 14.1 Other non-operating expense (income), net 20.0 0.7 (0.4) Operating income $ 86.2 $ 24.4 $ 2.6 Depreciation and amortization 64.7 46.6 48.0 Noncontrolling interest in EBITDA of VIE (8.9) - - Acquisition related expenses, excluding amortization 13.4 4.5 (0.2) Strategic and IT system resource planning expenses 8.3 24.1 34.4 (Gain) loss on sale of fixed assets (32.5) - 0.4 Restructuring costs 15.4 5.0 2.3 Adj. EBITDA $ 146.6 $ 104.6 $ 87.5 Adj. EBITDA Margin 9.8% 8.7% 7.9% Years Ended September 30,

16 Cubic Corporation Overview September 2020 | ADJUSTED EBITDA RECONCILIATION BY SEGMENT CONTINUING OPERATIONS – YEARS ENDED SEPTEMBER 30, 2019, SEPTEMBE R 30, 2018, AND SEPTEMBER 30, 2017 ($ In Millions) Cubic Transportation Systems 2019 2018 2017 Sales $ 849.8 $ 670.7 $ 578.6 Operating income $ 77.2 $ 60.4 $ 39.8 Depreciation and amortization 30.7 12.0 8.8 Noncontrolling interest in income of VIE (8.9) - - Acquisition related expenses, excluding amortization 8.3 0.5 (0.2) Restructuring costs 3.2 0.4 0.4 Adjusted EBITDA $ 110.5 $ 73.3 $ 48.8 Adjusted EBITDA margin 13.0% 10.9% 8.4% Cubic Mission and Performance Solutions 2019 2018 2017 Sales $ 646.7 532.2 529.1 Operating income $ 30.8 16.5 18.8 Depreciation and amortization 30.1 30.9 34.2 Acquisition related expenses, excluding amortization 5.0 3.6 (0.1) Gain on sale of fixed assets (2.0) - - Restructuring costs 3.3 1.5 0.9 Adjusted EBITDA $ 67.2 $ 52.5 $ 53.8 Adjusted EBITDA margin 10.4% 9.9% 10.2% Years Ended September 30, Years Ended September 30,