Attached files
| file | filename |
|---|---|
| 8-K - 8-K - ASSOCIATED BANC-CORP | asb-20200914.htm |

Exhibit 99.1 Associated Banc-Corp Barclays Global Financial Conference Investor Presentation SEPTEMBER 14 2020 DePere Office (Green Bay MSA) – Opened February 2019

FORWARD-LOOKING STATEMENTS Important note regarding forward-looking statements: Statements made in this presentation which are not purely historical are forward-looking statements, as defined in the Private Securities Litigation Reform Act of 1995. This includes any statements regarding management’s plans, objectives, or goals for future operations, products or services, and forecasts of its revenues, earnings, or other measures of performance. Such forward-looking statements may be identified by the use of words such as “believe,” “expect,” “anticipate,” “plan,” “estimate,” “should,” “will,” “intend,” "target," “outlook” or similar expressions. Forward-looking statements are based on current management expectations and, by their nature, are subject to risks and uncertainties. Actual results may differ materially from those contained in the forward-looking statements. These forward-looking statements include: management plans relating to the pending branch sales described herein (“pending sales”); the expected timing of the completion of the pending sales; the ability to complete the pending sales; the ability to obtain any required regulatory approvals; any statements of the plans and objectives of management for future operations, products or services; any statements of expectation or belief; projections related to certain financial results or other benefits of the pending sales; and any statements of assumptions underlying any of the foregoing. Factors which may cause actual results to differ materially from those contained in such forward-looking statements include those identified in the Company’s most recent Form 10-K and subsequent Form 10-Qs and other SEC filings, and such factors are incorporated herein by reference. Additional factors which may cause actual results of the pending sales to differ materially from those contained in forward-looking statements are the possibility that expected benefits of the pending sales may not materialize in the timeframe expected or at all, or may be more costly to achieve; the pending sales may not be timely completed, if at all; that required regulatory approvals are not obtained or other customary closing conditions are not satisfied in a timely manner or at all; reputational risks and the reaction of shareholders, customers, employees or other constituents to the pending sales; and diversion of management time on acquisition-related matters. Trademarks: All trademarks, service marks, and trade names referenced in this material are official trademarks and the property of their respective owners. Presentation: Within the charts and tables presented, certain segments, columns and rows may not sum to totals shown due to rounding. Non-GAAP Measures: This presentation includes certain non-GAAP financial measures. These non-GAAP measures are provided in addition to, and not as substitutes for, measures of our financial performance determined in accordance with GAAP. Our calculation of these non-GAAP measures may not be comparable to similarly titled measures of other companies due to potential differences between companies in the method of calculation. As a result, the use of these non-GAAP measures has limitations and should not be considered superior to, in isolation from, or as a substitute for, related GAAP measures. Reconciliations of these non-GAAP financial measures to the most directly comparable GAAP financial measures can be found at the end of this presentation. 1

OUR FRANCHISE Second Quarter 20201 Highlights and Accomplishments $36 billion of assets $25 billion of loans . Largest bank headquartered in Wisconsin4 $4 billion of equity $27 billion of deposits . Approximately 4,3005 employees, servicing 1.3 million customer accounts in 8 states and over 120 communities1 June 2020 End of Period Deposit Location3 Loan Composition2 . Wisconsin’s #1 Mortgage Lender6 Commercial Real Estate 24% Illinois 21% Affinity Programs Commercial Minnesota and 8% of checking Business Consumer ~40% accounts are Lending Wisconsin 7 36% affinity related 40% 71% 1 As of June 30, 2020. 2 Excludes loans held for sale. 3 FDIC Summary of Deposits data as of June 30, 2020. 4 Based on assets, as of June 30, 2020. 5 As of September 11, 2020. 6 The Wisconsin’s #1 Mortgage Lender and Leading Lender in the Midwest designations are based on originated, closed-end mortgage loan count, gathered from the Home Mortgage Disclosure Act data compiled annually by the Consumer Financial Protection Bureau. The results of the data were obtained through the Consumer Financial Protection Bureau Mortgage Database (HMDA), August 2020. 2 7 Affinity checking accounts as a percentage of total checking accounts, as of July 31, 2020.
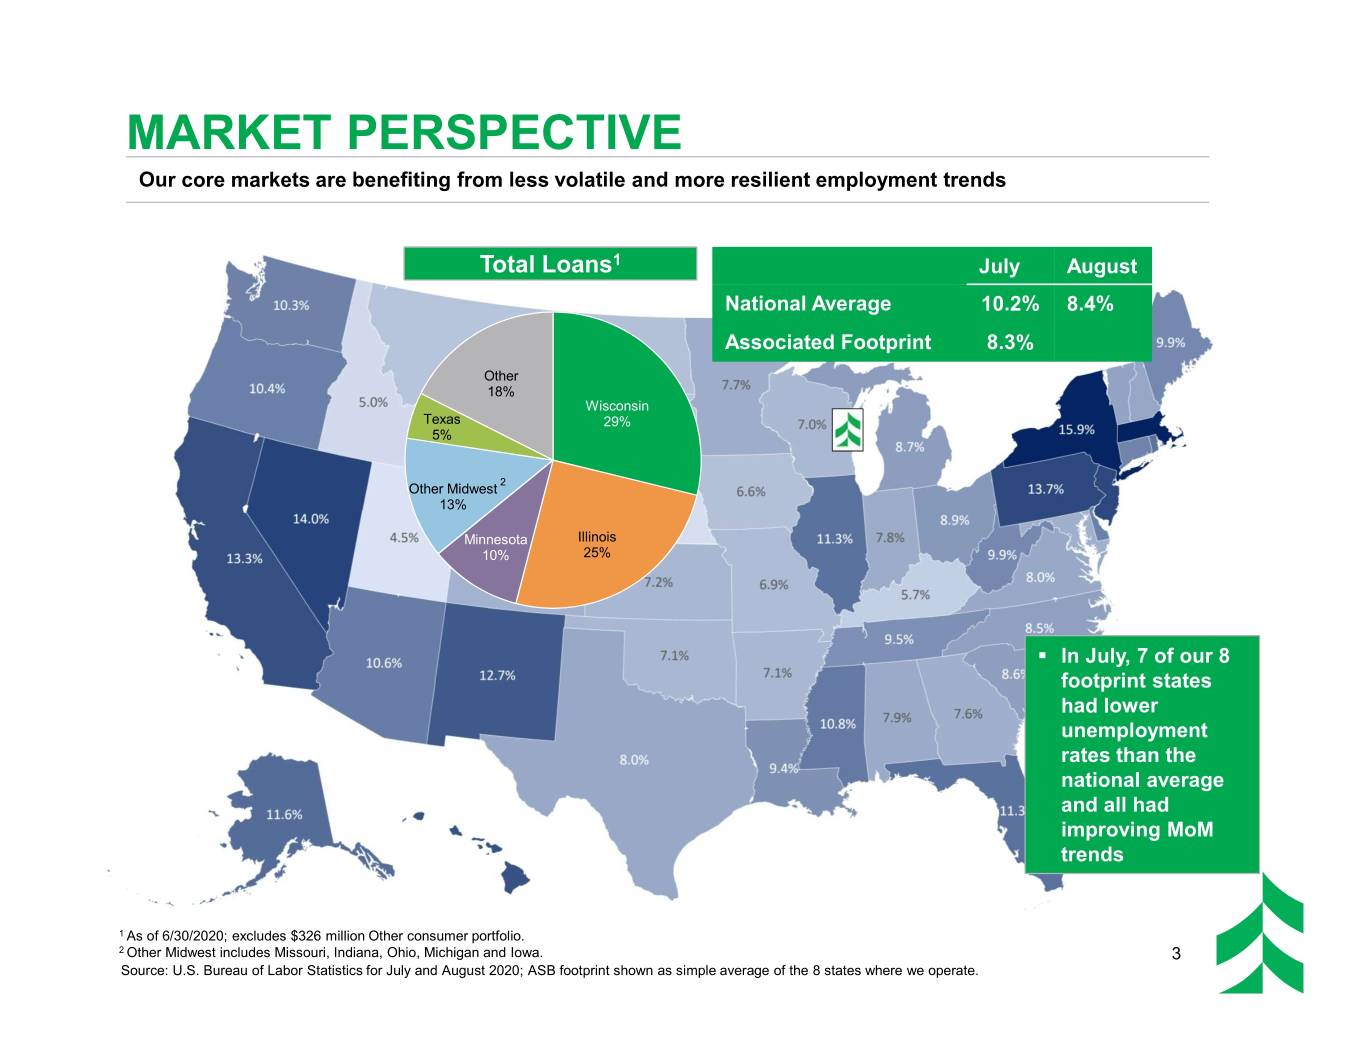
MARKET PERSPECTIVE Our core markets are benefiting from less volatile and more resilient employment trends Total Loans1 July August National Average 10.2% 8.4% Associated Footprint 8.3% Other 18% Wisconsin Texas 29% 5% 2 Other Midwest 13% Minnesota Illinois 10% 25% . In July, 7 of our 8 footprint states had lower unemployment rates than the national average and all had improving MoM trends 1 As of 6/30/2020; excludes $326 million Other consumer portfolio. 2 Other Midwest includes Missouri, Indiana, Ohio, Michigan and Iowa. 3 Source: U.S. Bureau of Labor Statistics for July and August 2020; ASB footprint shown as simple average of the 8 states where we operate.
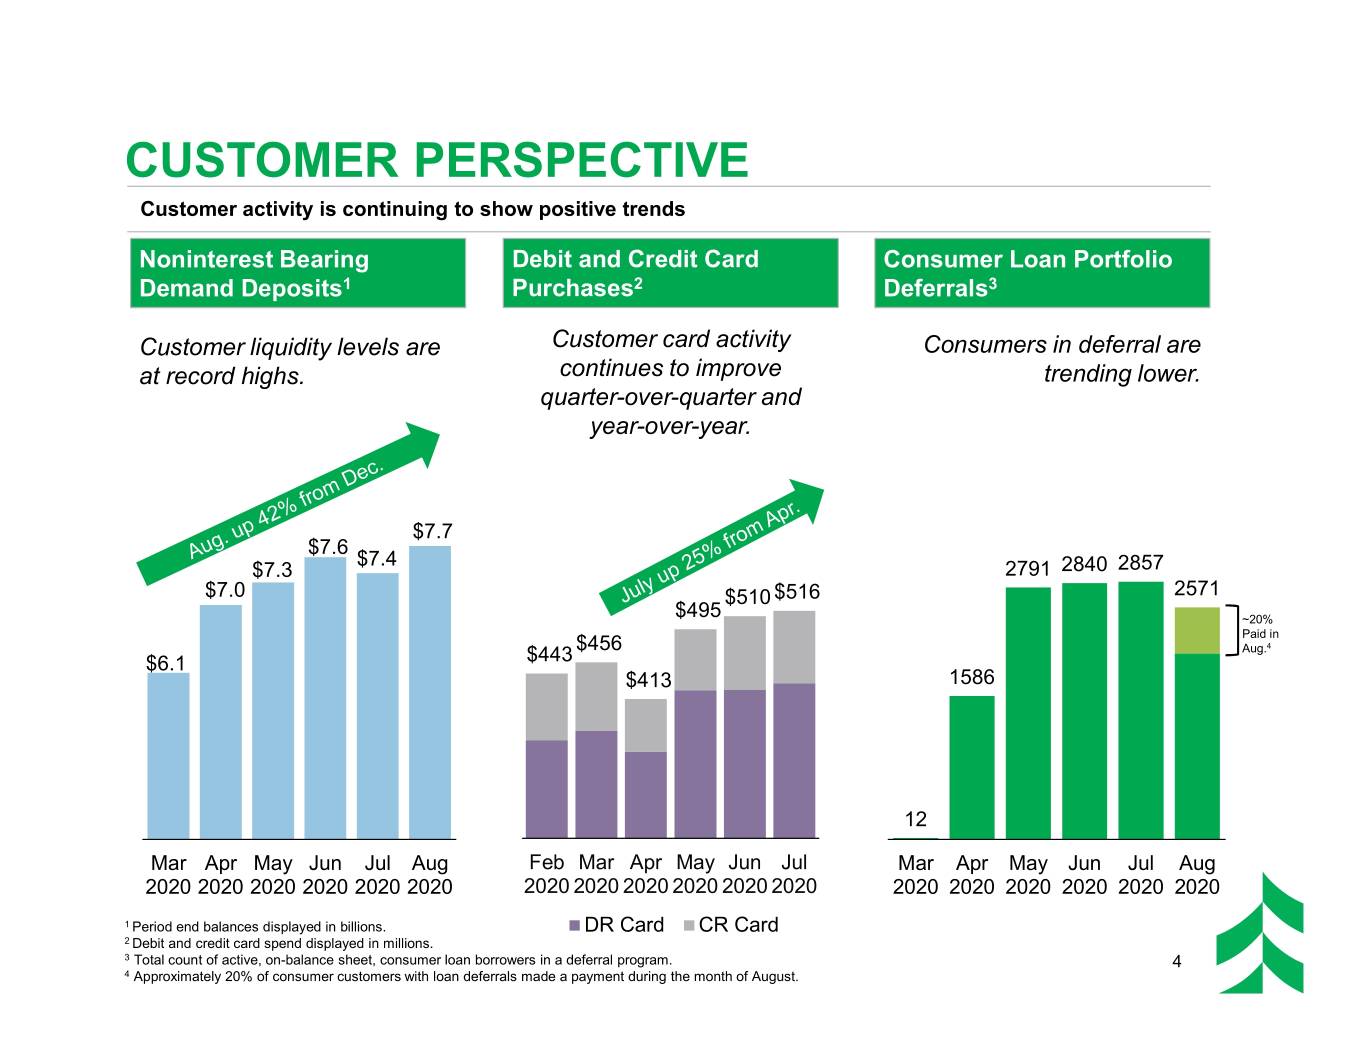
CUSTOMER PERSPECTIVE Customer activity is continuing to show positive trends Noninterest Bearing Debit and Credit Card Consumer Loan Portfolio Demand Deposits1 Purchases2 Deferrals3 Customer liquidity levels are Customer card activity Consumers in deferral are at record highs. continues to improve trending lower. quarter-over-quarter and year-over-year. $7.7 $7.6 $7.4 $7.3 2791 2840 2857 $7.0 $510 $516 2571 $495 ~20% Paid in $456 Aug.4 $6.1 $443 $413 1586 12 Mar Apr May Jun Jul Aug Feb Mar Apr May Jun Jul Mar Apr May Jun Jul Aug 2020 2020 2020 2020 2020 2020 2020 2020 2020 2020 2020 2020 2020 2020 2020 2020 2020 2020 1 Period end balances displayed in billions. DR Card CR Card 2 Debit and credit card spend displayed in millions. 3 Total count of active, on-balance sheet, consumer loan borrowers in a deferral program. 4 4 Approximately 20% of consumer customers with loan deferrals made a payment during the month of August.
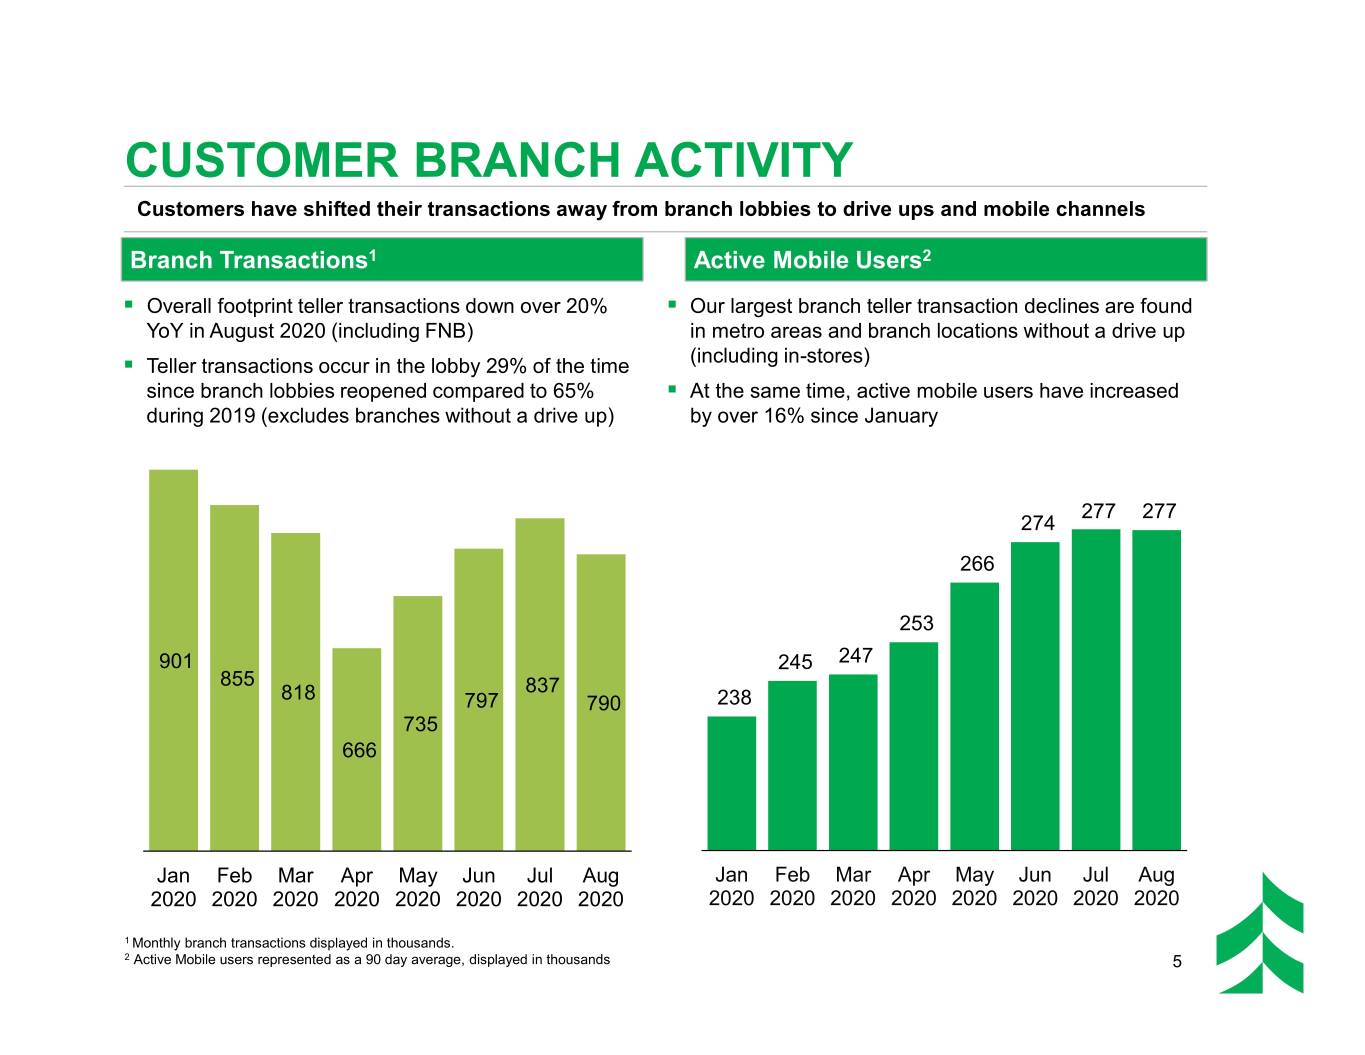
CUSTOMER BRANCH ACTIVITY Customers have shifted their transactions away from branch lobbies to drive ups and mobile channels Branch Transactions1 Active Mobile Users2 . Overall footprint teller transactions down over 20% . Our largest branch teller transaction declines are found YoY in August 2020 (including FNB) in metro areas and branch locations without a drive up (including in-stores) . Teller transactions occur in the lobby 29% of the time since branch lobbies reopened compared to 65% . At the same time, active mobile users have increased during 2019 (excludes branches without a drive up) by over 16% since January 277 277 274 266 253 901 245 247 855 818 837 797 790 238 735 666 Jan Feb Mar Apr May Jun Jul Aug Jan Feb Mar Apr May Jun Jul Aug 2020 2020 2020 2020 2020 2020 2020 2020 2020 2020 2020 2020 2020 2020 2020 2020 1 Monthly branch transactions displayed in thousands. 2 Active Mobile users represented as a 90 day average, displayed in thousands 5

Q3 2020 OPITMIZATION INITIATIVES We have several initiatives in motion which are expected to drive efficiency and lift earnings in 2021 FY 2021 Expected Initiative Details Run Rate Impact Pending sales and/or ~ $10 million expense Branch optimization consolidations of 21 reduction branches (8% of network; ~100 FTEs) Corporate, managerial, and ~ $30 million expense back office streamlining reduction Internal efficiency initiatives expected to reduce FTEs by ~200 by year end Prepaid $950 million of ~ $20 million net interest FHLB advances and income improvement FHLB liability restructuring incurred a $45 million prepayment charge Expected to drive a Q3 2020 Reorganization of our securities and net income tax benefit of real estate lending subsidiaries approximately $40 million 6

BRANCH OPTIMIZATION ACTIONS Consolidations and sales driving $10MM in annual savings and generating a net $5-7MM gain at close1 We are driving change as customer behaviors evolve Peoria . WI Branch Consolidations: Announced September 4th (14 branches, $381 million in total deposits) – Most consolidating branches are under 3 miles apart – Given past branch consolidation experience, we expect to retain approximately 80%2 of these deposits – Expected restructuring charges of $2 million in Q3 and $2 million in Q4 . Sale of Peoria branches to Morton Community Bank3 (5 branches, $208 million in total deposits, no loans) – Definitive agreement signed, expected to close in December – Receiving a 4% purchase premium on deposits transferred Southwest Wisconsin – Sale includes 6 properties . Sale of branches in SW Wisconsin to Royal Bank3 (2 branches, $56MM in total deposits, no loans) – Definitive agreement signed, expected to close in December – Receiving a 4% purchase premium from Royal Bank on Madison deposits in Prairie du Chien and Richland Center 1 Net of real estate disposition, lease terminations, branch closure, retention, and transaction expenses totaling $4-6 million; subject to regulatory approvals and notices. 2 Estimated retention over the next 12 months based on past closure experience. 3 Stephens Inc. acted as financial advisor and Howard & Howard acted as Legal Advisor to Associated on 7 these transactions.

BRANCH OPTIMIZATION TREND With these actions, we will have reduced our total branch count by 40% over the last decade 1 . Continued migration to mobile and online channels Pro forma Branch Count Trend has reduced the centricity of branches to our 279 distribution strategy 270 . Declining foot traffic in branches and customer 248 behavior shifts have created additional opportunities 238 237 236 to optimize our branch network over time 226 20 228 215 217 213 7 31 . The COVID Pandemic and new technology have only 26 17 accelerated these trends 19 . Pre-scheduled appointments are up 75% since branch lobbies reopened compared to pre- COVID levels 205 202 . The actions we’ve taken this month are expected to 185 result in a further 8% reduction of our branches by the end of the year . Collectively over the last decade, we have reduced 2 2010 2011 2012 2013 2014 2015 2016 2017 2018 2019 2020 our owned and purchased branch network by 40% (including branches acquired through acquisitions) ASB BKMU (58) HBAN (32) FNB (9) 1 Branch count at year end. 2 Projected branch count after pending branch sales and consolidations, assuming the 8 branch sales are completed in December 2020.
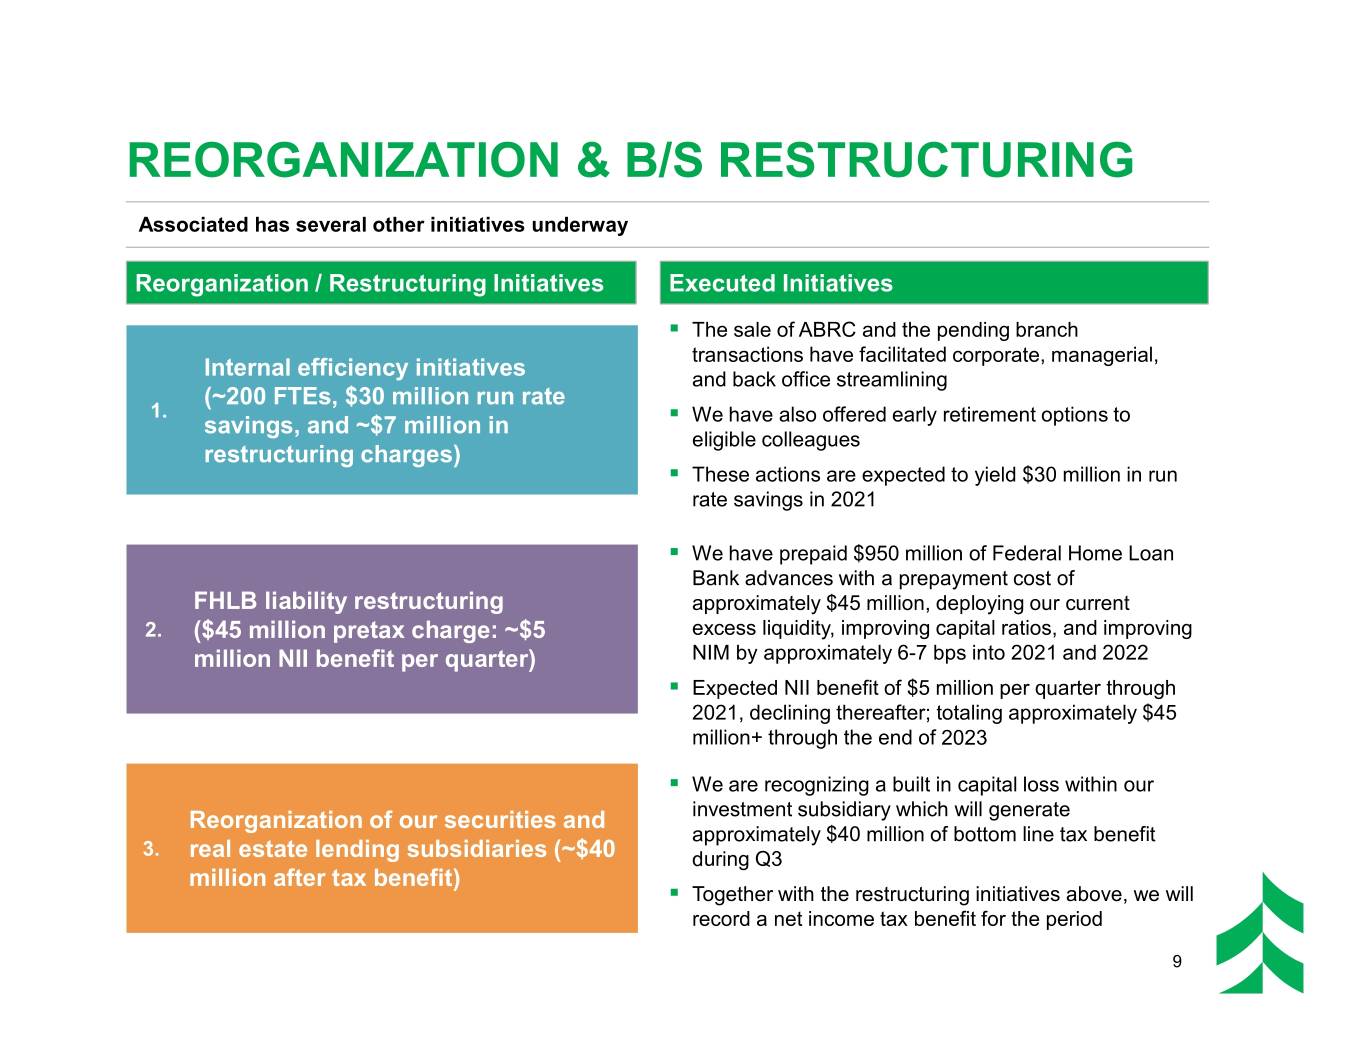
REORGANIZATION & B/S RESTRUCTURING Associated has several other initiatives underway Reorganization / Restructuring Initiatives Executed Initiatives . The sale of ABRC and the pending branch transactions have facilitated corporate, managerial, Internal efficiency initiatives and back office streamlining (~200 FTEs, $30 million run rate 1. savings, and ~$7 million in . We have also offered early retirement options to eligible colleagues restructuring charges) . These actions are expected to yield $30 million in run rate savings in 2021 . We have prepaid $950 million of Federal Home Loan Bank advances with a prepayment cost of FHLB liability restructuring approximately $45 million, deploying our current 2. ($45 million pretax charge: ~$5 excess liquidity, improving capital ratios, and improving million NII benefit per quarter) NIM by approximately 6-7 bps into 2021 and 2022 . Expected NII benefit of $5 million per quarter through 2021, declining thereafter; totaling approximately $45 million+ through the end of 2023 . We are recognizing a built in capital loss within our Reorganization of our securities and investment subsidiary which will generate approximately $40 million of bottom line tax benefit 3. real estate lending subsidiaries (~$40 during Q3 million after tax benefit) . Together with the restructuring initiatives above, we will record a net income tax benefit for the period 9
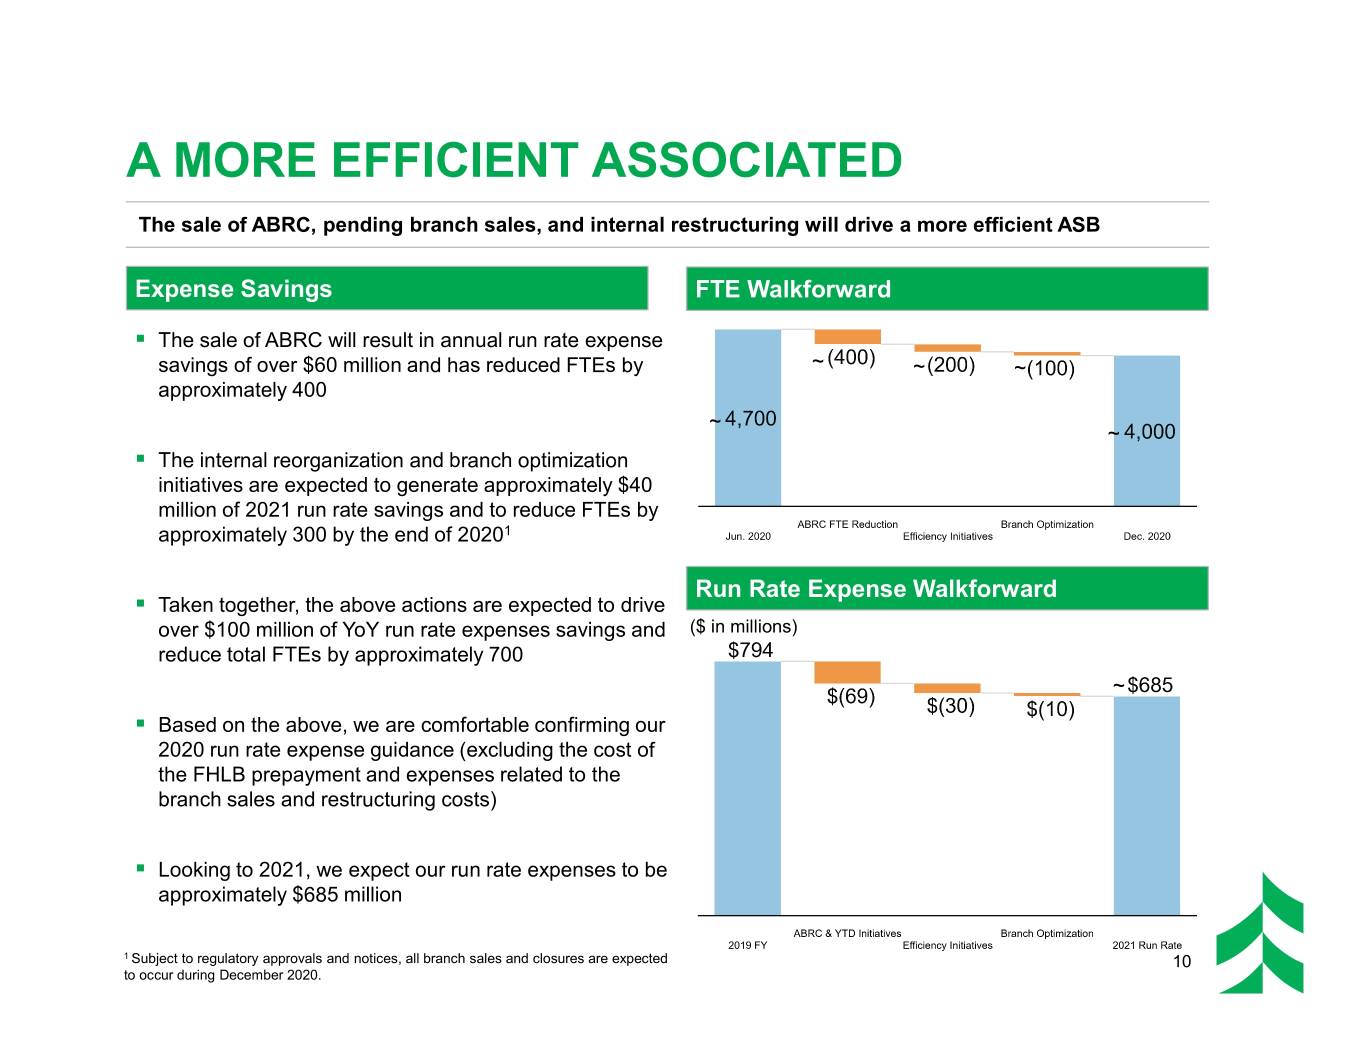
A MORE EFFICIENT ASSOCIATED The sale of ABRC, pending branch sales, and internal restructuring will drive a more efficient ASB Expense Savings FTE Walkforward . The sale of ABRC will result in annual run rate expense savings of over $60 million and has reduced FTEs by ~ ~ ~ approximately 400 ~ ~ . The internal reorganization and branch optimization initiatives are expected to generate approximately $40 million of 2021 run rate savings and to reduce FTEs by approximately 300 by the end of 20201 Run Rate Expense Walkforward . Taken together, the above actions are expected to drive over $100 million of YoY run rate expenses savings and ($ in millions) reduce total FTEs by approximately 700 ~ . Based on the above, we are comfortable confirming our 2020 run rate expense guidance (excluding the cost of the FHLB prepayment and expenses related to the branch sales and restructuring costs) . Looking to 2021, we expect our run rate expenses to be approximately $685 million 1 Subject to regulatory approvals and notices, all branch sales and closures are expected 10 to occur during December 2020.
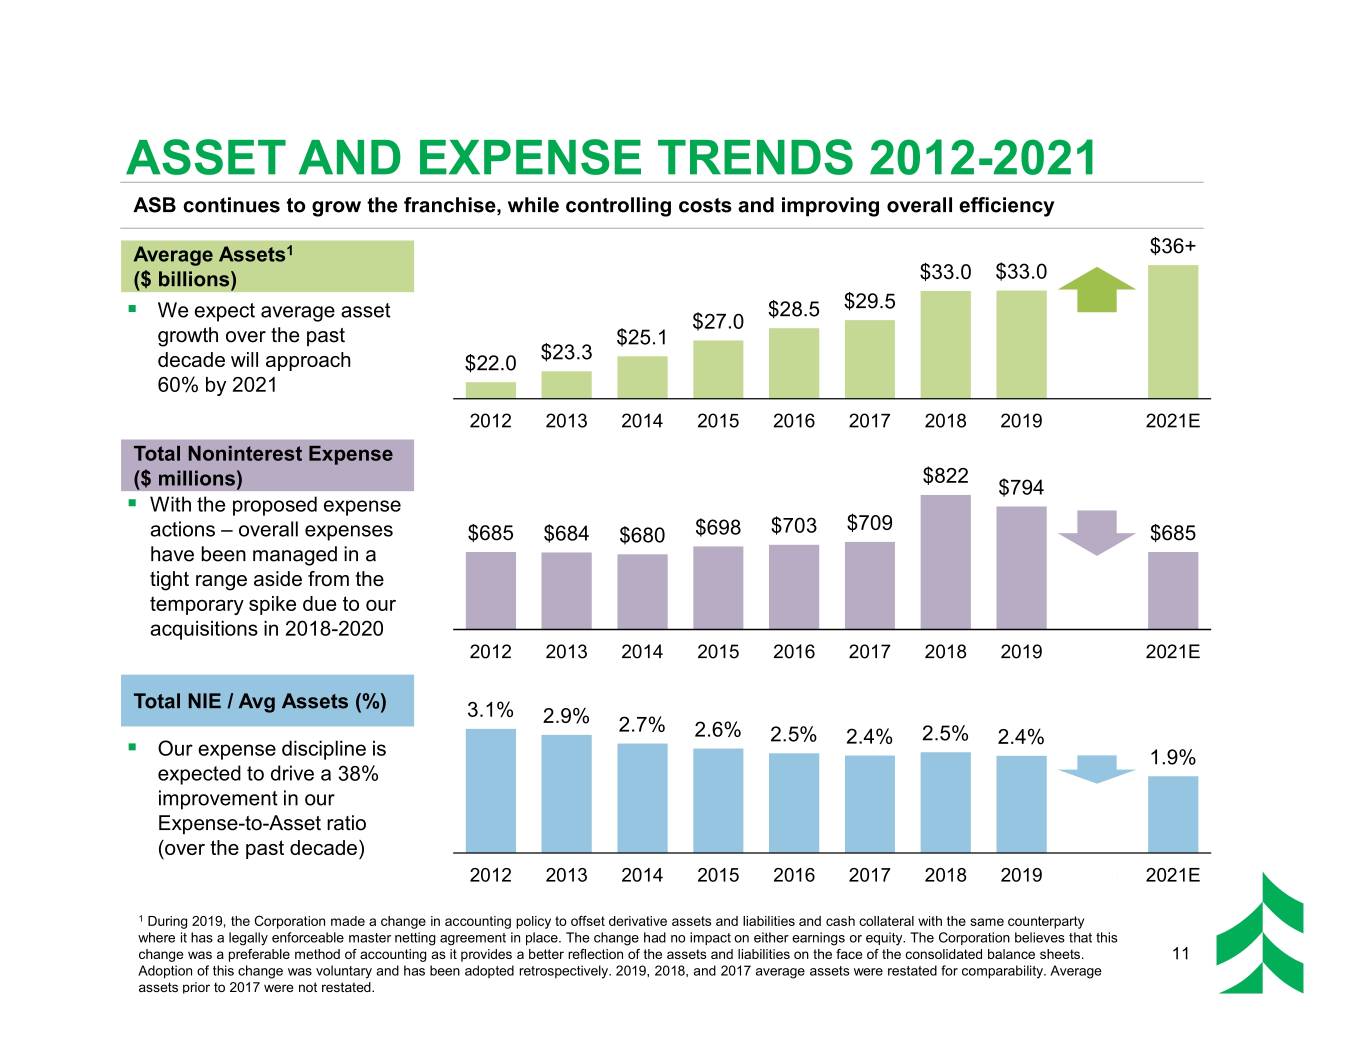
ASSET AND EXPENSE TRENDS 2012-2021 ASB continues to grow the franchise, while controlling costs and improving overall efficiency Average Assets1 $36+ ($ billions) $33.0 $33.0 . We expect average asset $28.5 $29.5 $27.0 growth over the past $25.1 $23.3 decade will approach $22.0 60% by 2021 2012 2013 2014 2015 2016 2017 2018 2019 2020 2021E Total Noninterest Expense $822 ($ millions) $794 . With the proposed expense $709 actions – overall expenses $685 $684 $680 $698 $703 $685 have been managed in a tight range aside from the temporary spike due to our acquisitions in 2018-2020 2012 2013 2014 2015 2016 2017 2018 2019 2020 2021E Total NIE / Avg Assets (%) 3.1% 2.9% 2.7% 2.6% 2.5% 2.4% 2.5% 2.4% . Our expense discipline is 1.9% expected to drive a 38% improvement in our Expense-to-Asset ratio (over the past decade) 2012 2013 2014 2015 2016 2017 2018 2019 2020 2021E 1 During 2019, the Corporation made a change in accounting policy to offset derivative assets and liabilities and cash collateral with the same counterparty where it has a legally enforceable master netting agreement in place. The change had no impact on either earnings or equity. The Corporation believes that this change was a preferable method of accounting as it provides a better reflection of the assets and liabilities on the face of the consolidated balance sheets. 11 Adoption of this change was voluntary and has been adopted retrospectively. 2019, 2018, and 2017 average assets were restated for comparability. Average assets prior to 2017 were not restated.
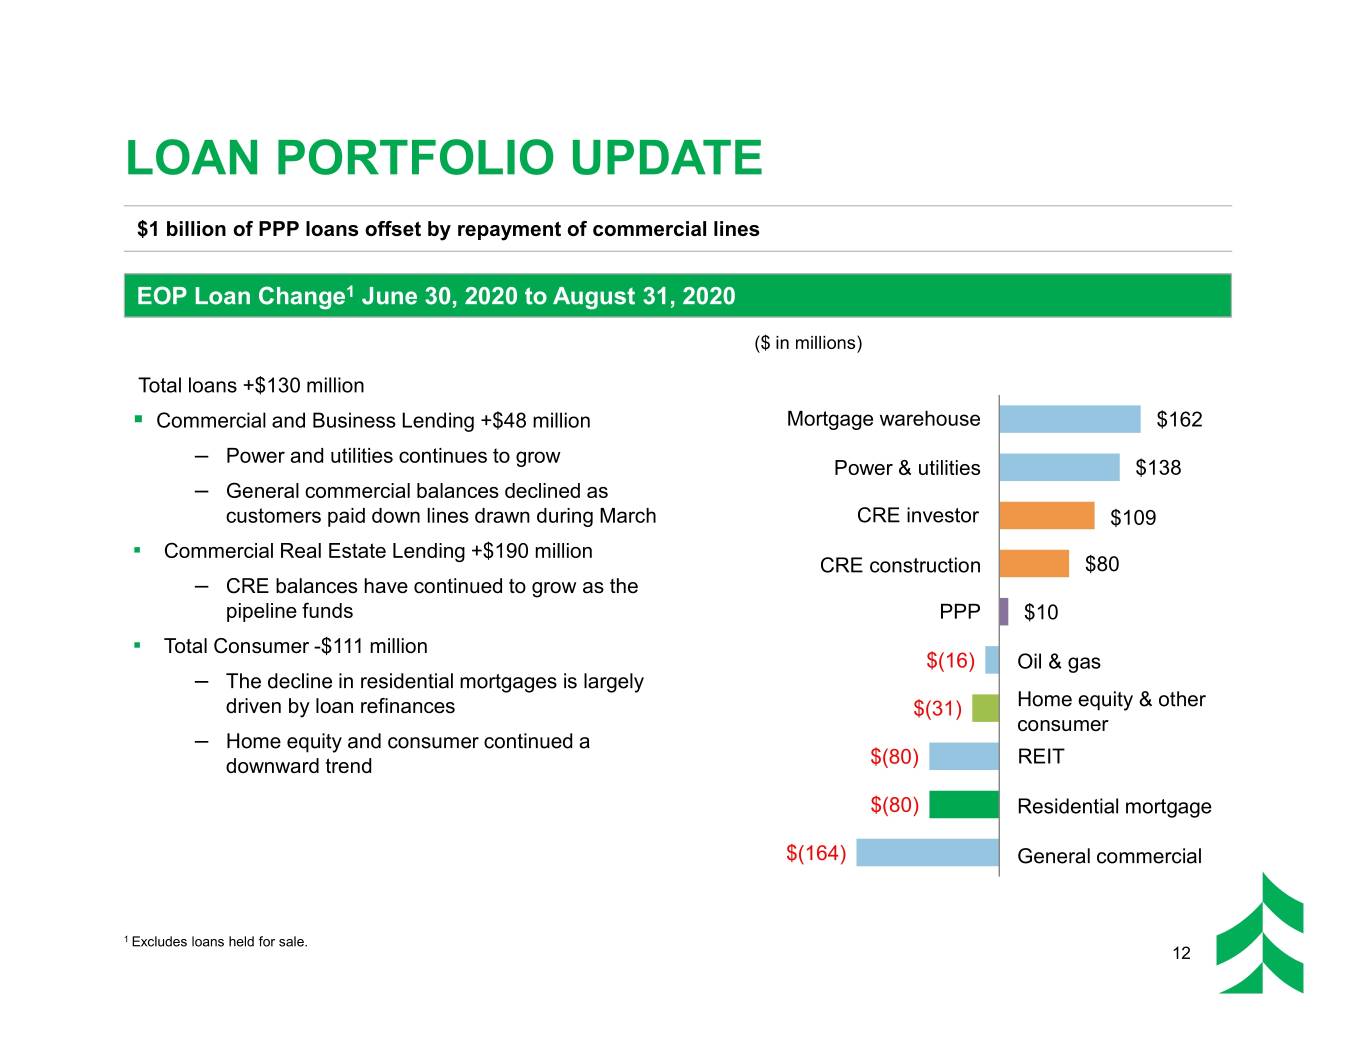
LOAN PORTFOLIO UPDATE $1 billion of PPP loans offset by repayment of commercial lines EOP Loan Change1 June 30, 2020 to August 31, 2020 ($ in millions) Total loans +$130 million . Commercial and Business Lending +$48 million Mortgage warehouse $162 – Power and utilities continues to grow Power & utilities $138 – General commercial balances declined as customers paid down lines drawn during March CRE investor $109 ▪ Commercial Real Estate Lending +$190 million CRE construction $80 – CRE balances have continued to grow as the pipeline funds PPP $10 ▪ Total Consumer -$111 million $(16) Oil & gas – The decline in residential mortgages is largely driven by loan refinances $(31) Home equity & other consumer – Home equity and consumer continued a downward trend $(80) REIT $(80) Residential mortgage $(164) General commercial 1 Excludes loans held for sale. 12

COMMERCIAL COVID-19 RELIEF UPDATE Overall commercial deferrals are down by half since June 30, 2020 Loan Deferrals & Modifications1 Deferred and Modified Loans Trend ($ in millions) ▪ 39% of commercial and business loan deferrals (by loan balance) have ended $822 ▪ 53% of CRE loan deferrals (by loan balance) have ended $393 $1 Q1 20 Q2 20 Aug 20 CRE C&BL 1 Includes completed modifications as of August 31, 2020. 13
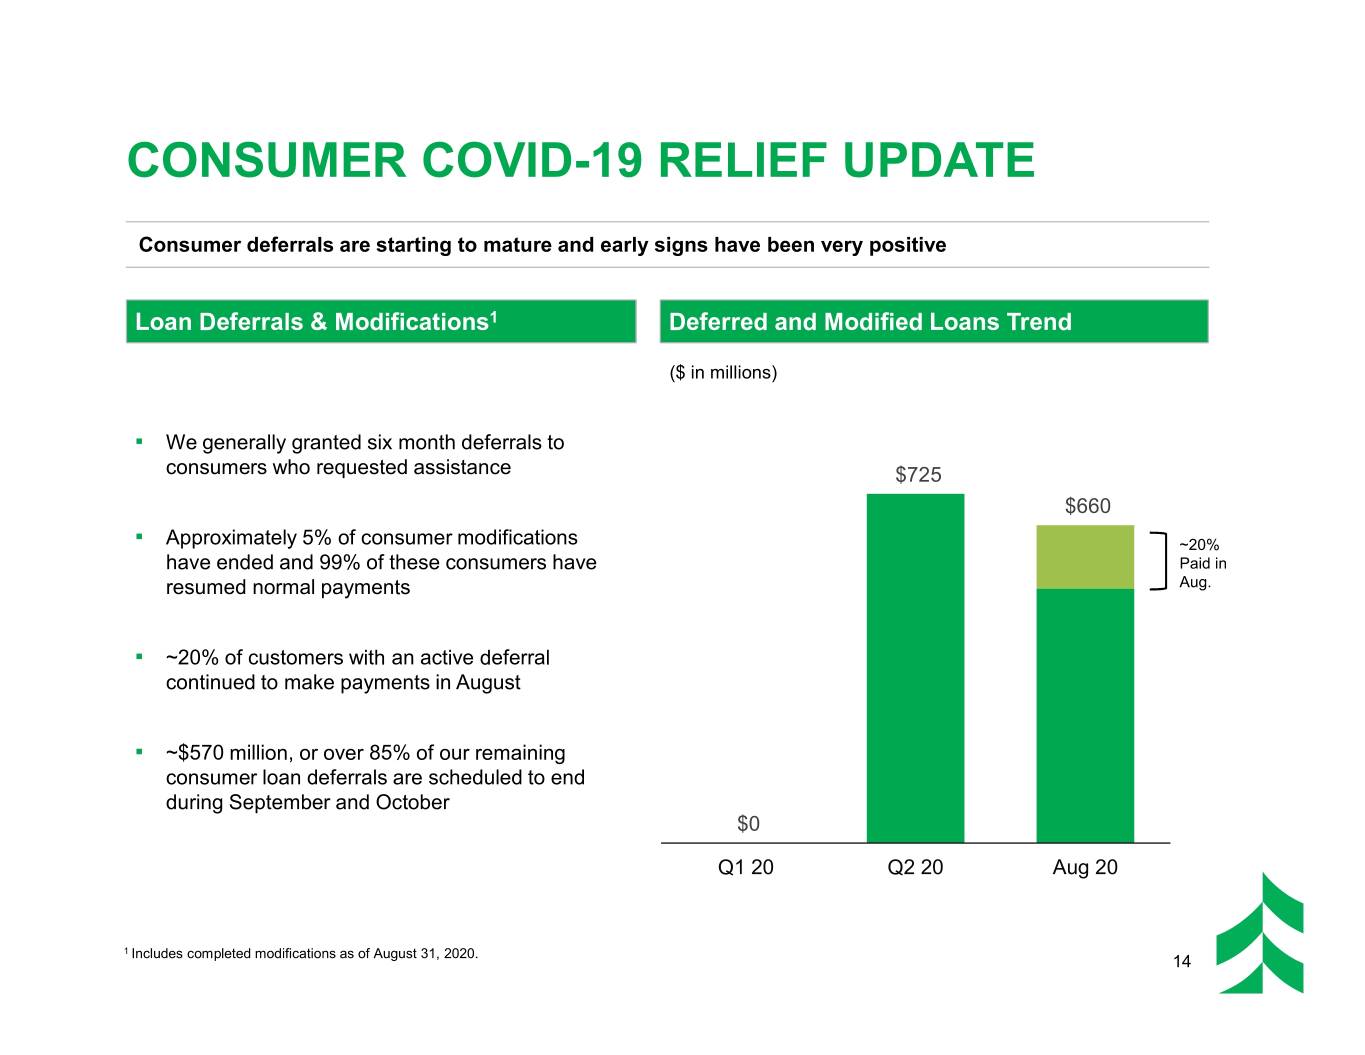
CONSUMER COVID-19 RELIEF UPDATE Consumer deferrals are starting to mature and early signs have been very positive Loan Deferrals & Modifications1 Deferred and Modified Loans Trend ($ in millions) ▪ We generally granted six month deferrals to consumers who requested assistance $725 $660 ▪ Approximately 5% of consumer modifications ~20% have ended and 99% of these consumers have Paid in resumed normal payments Aug. ▪ ~20% of customers with an active deferral continued to make payments in August ▪ ~$570 million, or over 85% of our remaining consumer loan deferrals are scheduled to end during September and October $0 Q1 20 Q2 20 Aug 20 1 Includes completed modifications as of August 31, 2020. 14
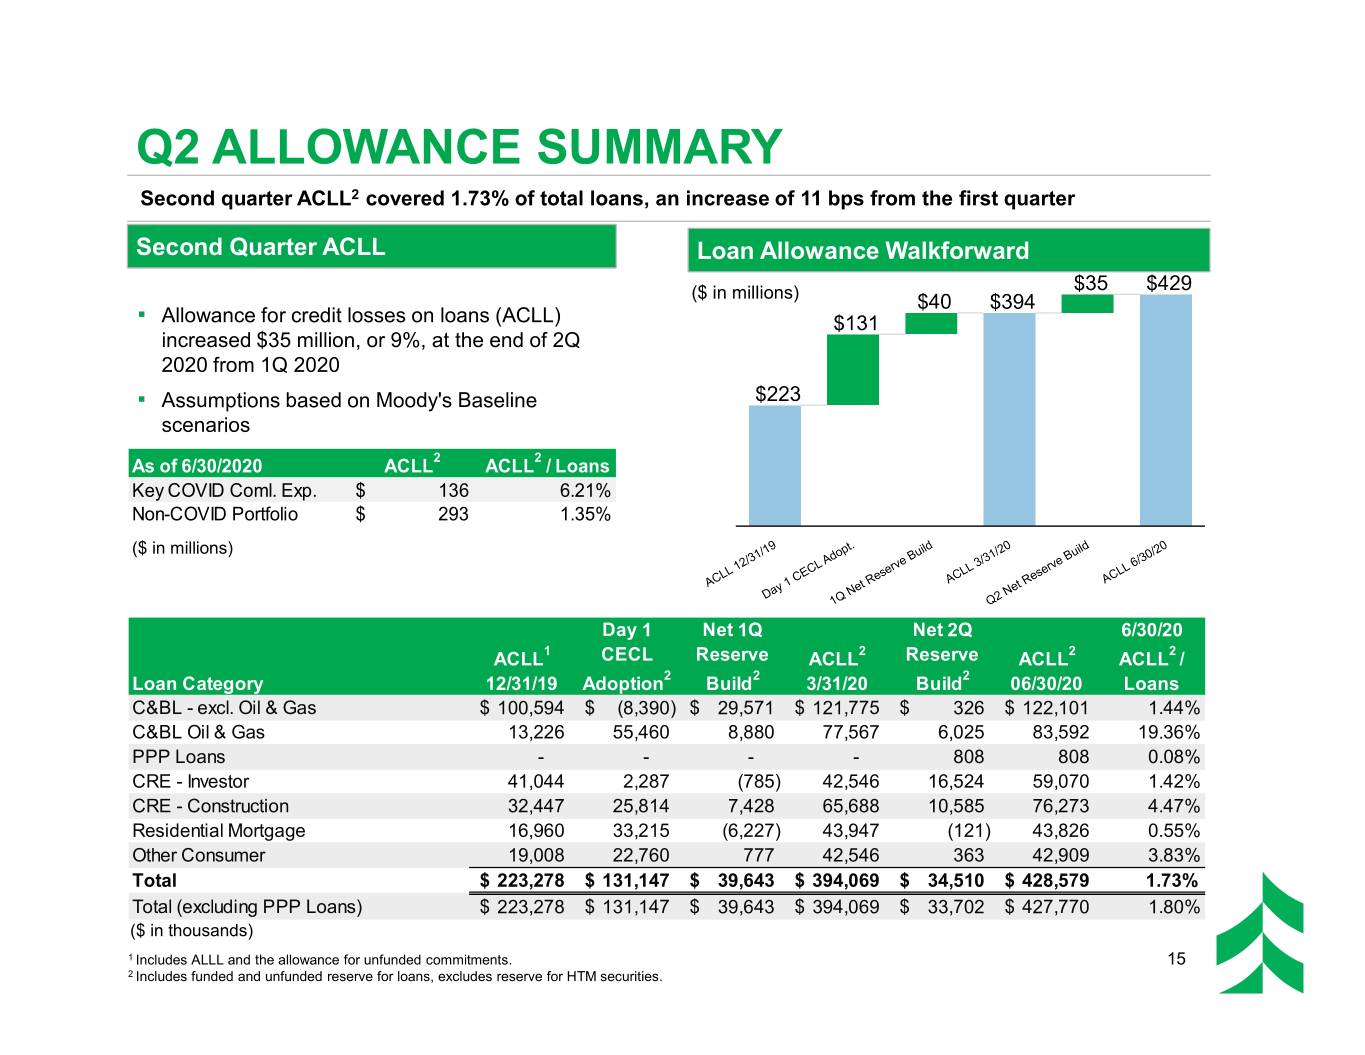
Q2 ALLOWANCE SUMMARY Second quarter ACLL2 covered 1.73% of total loans, an increase of 11 bps from the first quarter Second Quarter ACLL Loan Allowance Walkforward ($ in millions) ▪ Allowance for credit losses on loans (ACLL) increased $35 million, or 9%, at the end of 2Q 2020 from 1Q 2020 ▪ Assumptions based on Moody's Baseline scenarios As of 6/30/2020 ACLL2 ACLL2 / Loans Key COVID Coml. Exp.$ 136 6.21% Non-COVID Portfolio$ 293 1.35% ($ in millions) Day 1 Net 1Q Net 2Q 6/30/20 ACLL1 CECL Reserve ACLL2 Reserve ACLL2 ACLL2 / Loan Category 12/31/19 Adoption2 Build2 3/31/20 Build2 06/30/20 Loans C&BL - excl. Oil & Gas$ 100,594 $ (8,390) $ 29,571 $ 121,775 $ 326 $ 122,101 1.44% C&BL Oil & Gas 13,226 55,460 8,880 77,567 6,025 83,592 19.36% PPP Loans - - - - 808 808 0.08% CRE - Investor 41,044 2,287 (785) 42,546 16,524 59,070 1.42% CRE - Construction 32,447 25,814 7,428 65,688 10,585 76,273 4.47% Residential Mortgage 16,960 33,215 (6,227) 43,947 (121) 43,826 0.55% Other Consumer 19,008 22,760 777 42,546 363 42,909 3.83% Total$ 223,278 $ 131,147 $ 39,643 $ 394,069 $ 34,510 $ 428,579 1.73% Total (excluding PPP Loans)$ 223,278 $ 131,147 $ 39,643 $ 394,069 $ 33,702 $ 427,770 1.80% ($ in thousands) 1 Includes ALLL and the allowance for unfunded commitments. 15 2 Includes funded and unfunded reserve for loans, excludes reserve for HTM securities.
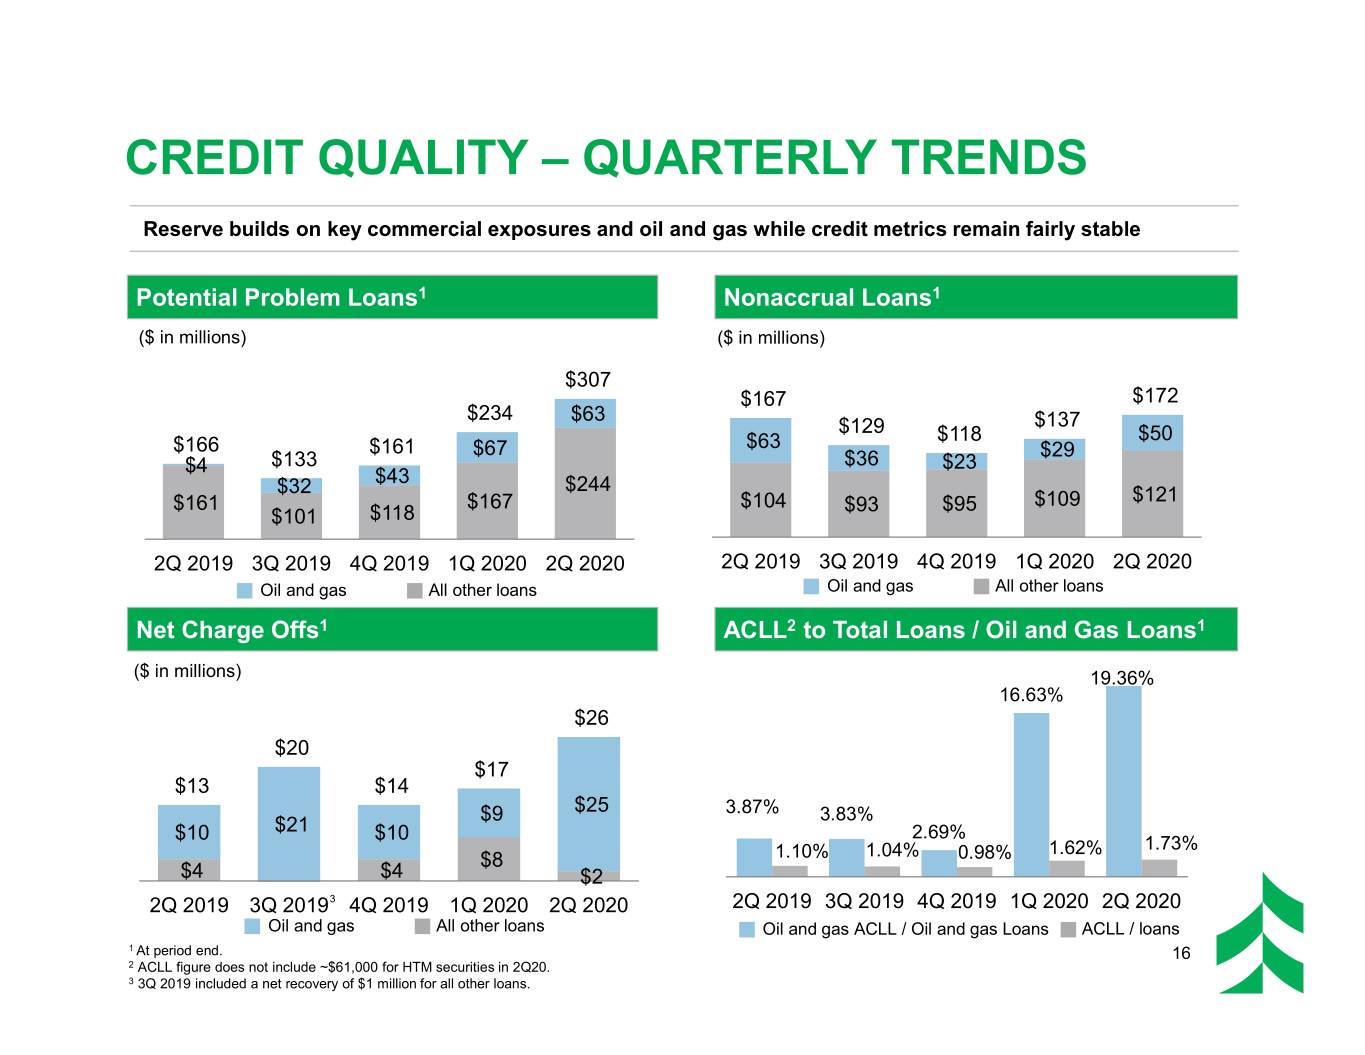
CREDIT QUALITY – QUARTERLY TRENDS Reserve builds on key commercial exposures and oil and gas while credit metrics remain fairly stable Potential Problem Loans1 Nonaccrual Loans1 ($ in millions) ($ in millions) $307 $167 $172 $234 $63 $137 $129 $118 $50 $166 $161 $67 $63 $29 $4 $133 $36 $23 $32 $43 $244 $161 $167 $104 $93 $95 $109 $121 $101 $118 2Q 2019 3Q 2019 4Q 2019 1Q 2020 2Q 2020 2Q 2019 3Q 2019 4Q 2019 1Q 2020 2Q 2020 Oil and gas All other loans Oil and gas All other loans Net Charge Offs1 ACLL2 to Total Loans / Oil and Gas Loans1 ($ in millions) 19.36% 16.63% $26 $20 $17 $13 $14 $9 $25 3.87% 3.83% $10 $21 $10 2.69% 1.62% 1.73% $8 1.10% 1.04% 0.98% $4 $4 $2 2Q 2019 3Q 20193 4Q 2019 1Q 2020 2Q 2020 2Q 2019 3Q 2019 4Q 2019 1Q 2020 2Q 2020 Oil and gas All other loans Oil and gas ACLL / Oil and gas Loans ACLL / loans 1 At period end. 16 2 ACLL figure does not include ~$61,000 for HTM securities in 2Q20. 3 3Q 2019 included a net recovery of $1 million for all other loans.
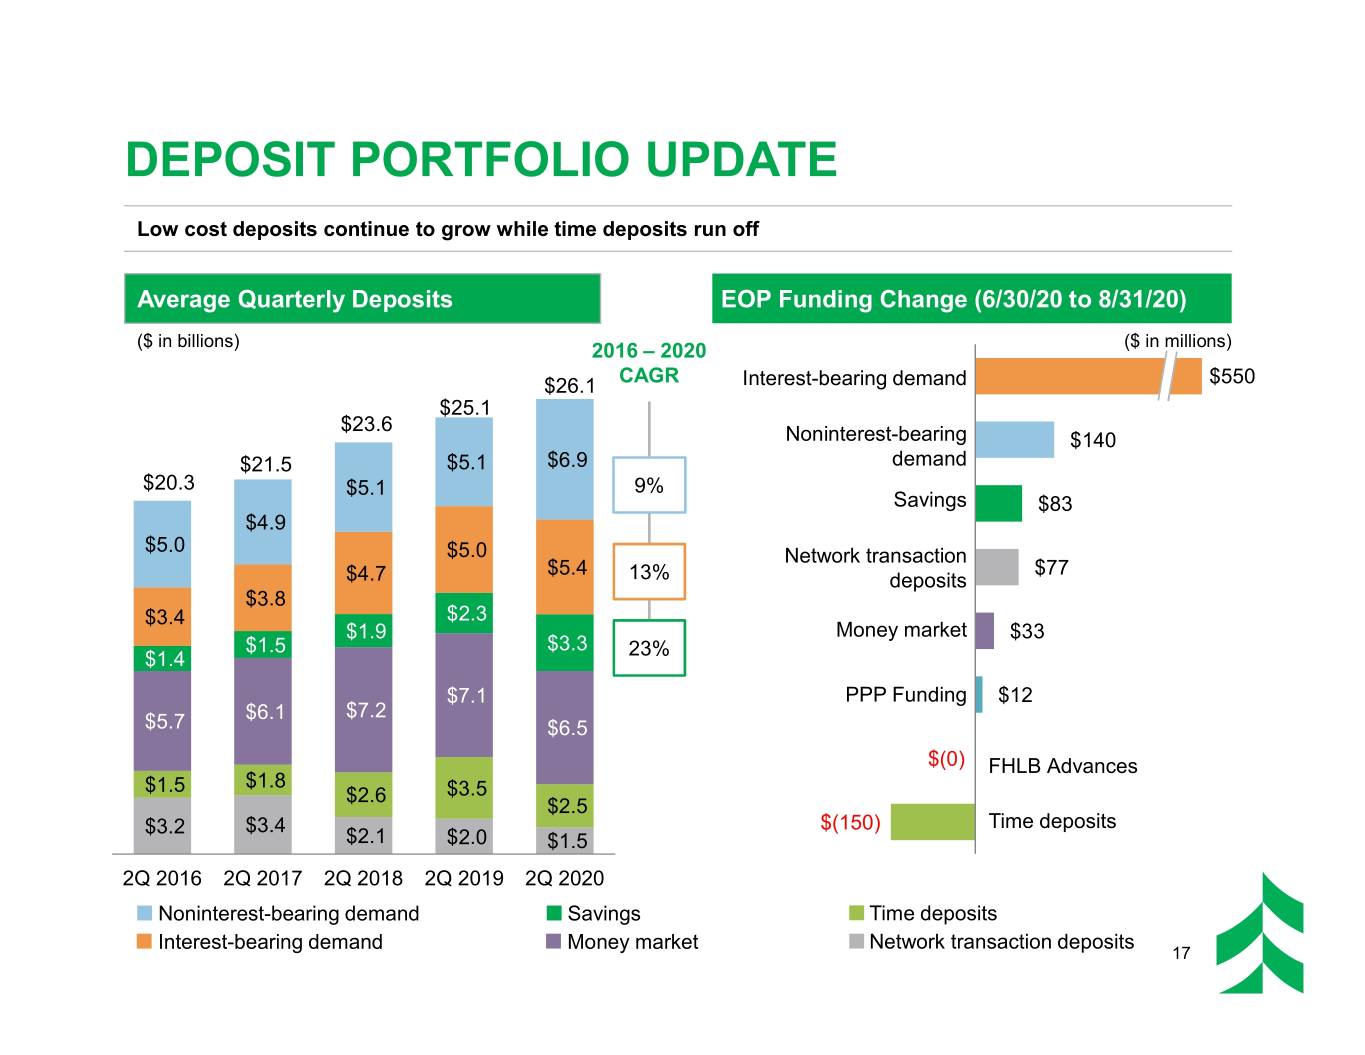
DEPOSIT PORTFOLIO UPDATE Low cost deposits continue to grow while time deposits run off Average Quarterly Deposits EOP Funding Change (6/30/20 to 8/31/20) ($ in billions) 2016 – 2020 ($ in millions) $26.1 CAGR Interest-bearing demand $550 $25.1 $23.6 Noninterest-bearing $140 $21.5 $5.1 $6.9 demand $20.3 $5.1 9% Savings $83 $4.9 $5.0 $5.0 Network transaction $5.4 $77 $4.7 13% deposits $3.8 $3.4 $2.3 $1.9 Money market $33 $1.5 $3.3 23% $1.4 $7.1 PPP Funding $12 $6.1 $7.2 $5.7 $6.5 $(0) FHLB Advances $1.8 $1.5 $2.6 $3.5 $2.5 $3.2 $3.4 $(150) Time deposits $2.1 $2.0 $1.5 2Q 2016 2Q 2017 2Q 2018 2Q 2019 2Q 2020 Noninterest-bearing demand Savings Time deposits Interest-bearing demand Money market Network transaction deposits 17
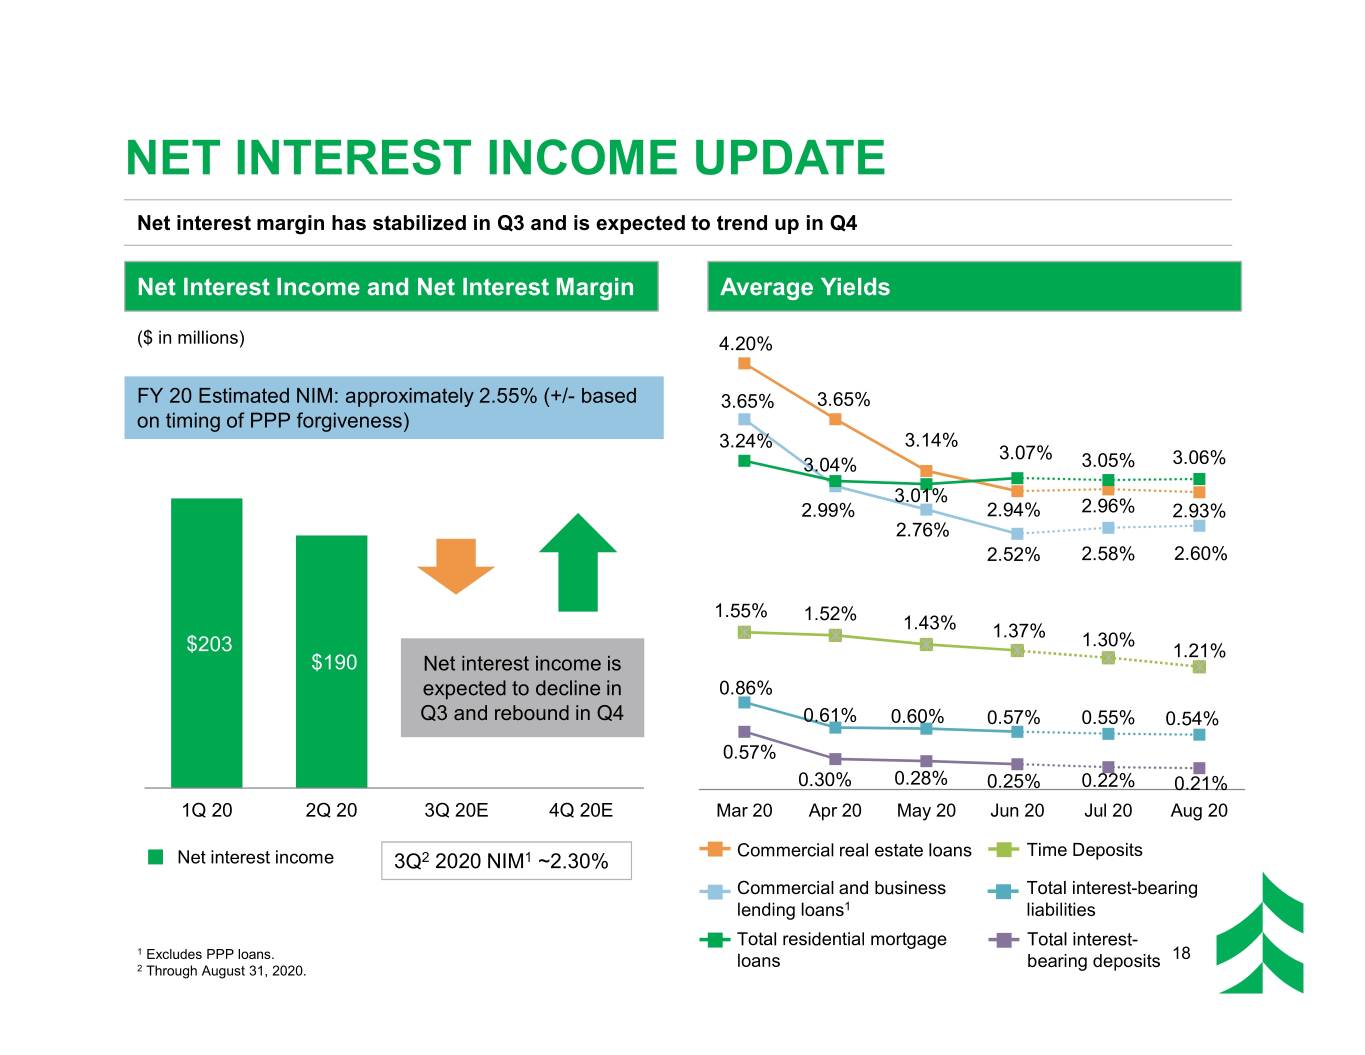
NET INTEREST INCOME UPDATE Net interest margin has stabilized in Q3 and is expected to trend up in Q4 Net Interest Income and Net Interest Margin Average Yields ($ in millions) 4.20% FY 20 Estimated NIM: approximately 2.55% (+/- based 3.65% 3.65% on timing of PPP forgiveness) 3.24% 3.14% 3.07% 3.04% 3.05% 3.06% 3.01% 2.99% 2.94% 2.96% 2.93% 2.76% 2.52% 2.58% 2.60% 1.55% 1.52% 1.43% 1.37% 1.30% $203 1.21% $190 Net interest income is expected to decline in 0.86% Q3 and rebound in Q4 0.61% 0.60% 0.57% 0.55% 0.54% 0.57% 0.30% 0.28% 0.25% 0.22% 0.21% 1Q 20 2Q 20 3Q 20E 4Q 20E Mar 20 Apr 20 May 20 Jun 20 Jul 20 Aug 20 Commercial real estate loans Time Deposits Net interest income 3Q2 2020 NIM1 ~2.30% Commercial and business Total interest-bearing lending loans1 liabilities Total residential mortgage Total interest- 1 Excludes PPP loans. loans bearing deposits 18 2 Through August 31, 2020.
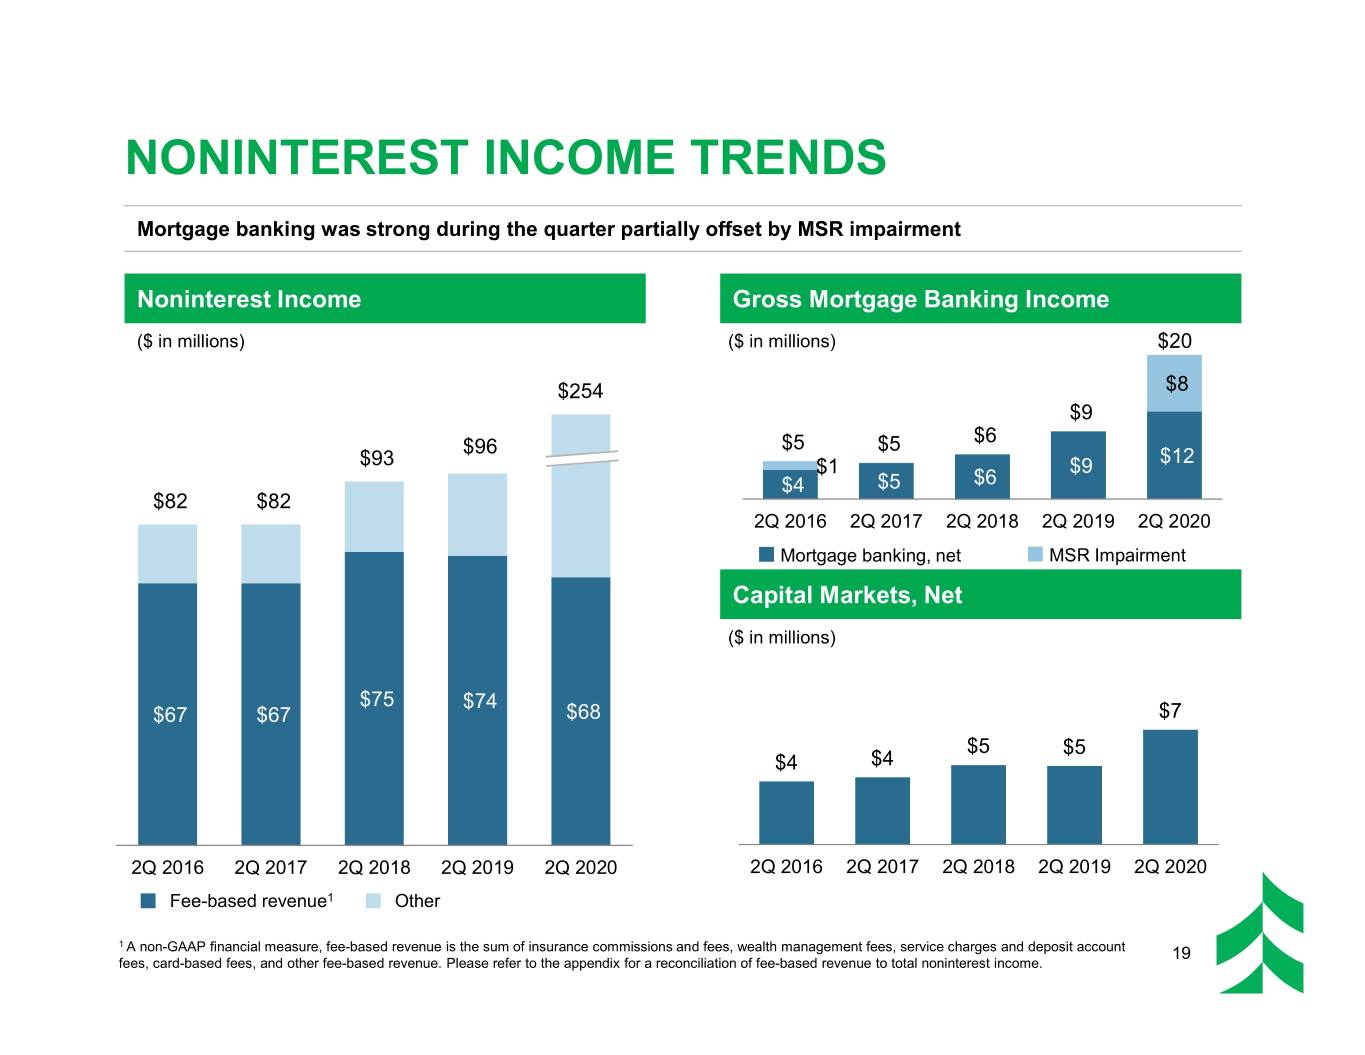
NONINTEREST INCOME TRENDS Mortgage banking was strong during the quarter partially offset by MSR impairment Noninterest Income Gross Mortgage Banking Income ($ in millions) ($ in millions) $20 $254 $8 $9 $6 $96 $5 $5 $93 $1 $9 $12 $4 $5 $6 $82 $82 2Q 2016 2Q 2017 2Q 2018 2Q 2019 2Q 2020 Mortgage banking, net MSR Impairment Capital Markets, Net ($ in millions) $75 $74 $67 $67 $68 $7 $5 $5 $4 $4 2Q 2016 2Q 2017 2Q 2018 2Q 2019 2Q 2020 2Q 2016 2Q 2017 2Q 2018 2Q 2019 2Q 2020 Fee-based revenue1 Other 1 A non-GAAP financial measure, fee-based revenue is the sum of insurance commissions and fees, wealth management fees, service charges and deposit account 19 fees, card-based fees, and other fee-based revenue. Please refer to the appendix for a reconciliation of fee-based revenue to total noninterest income.
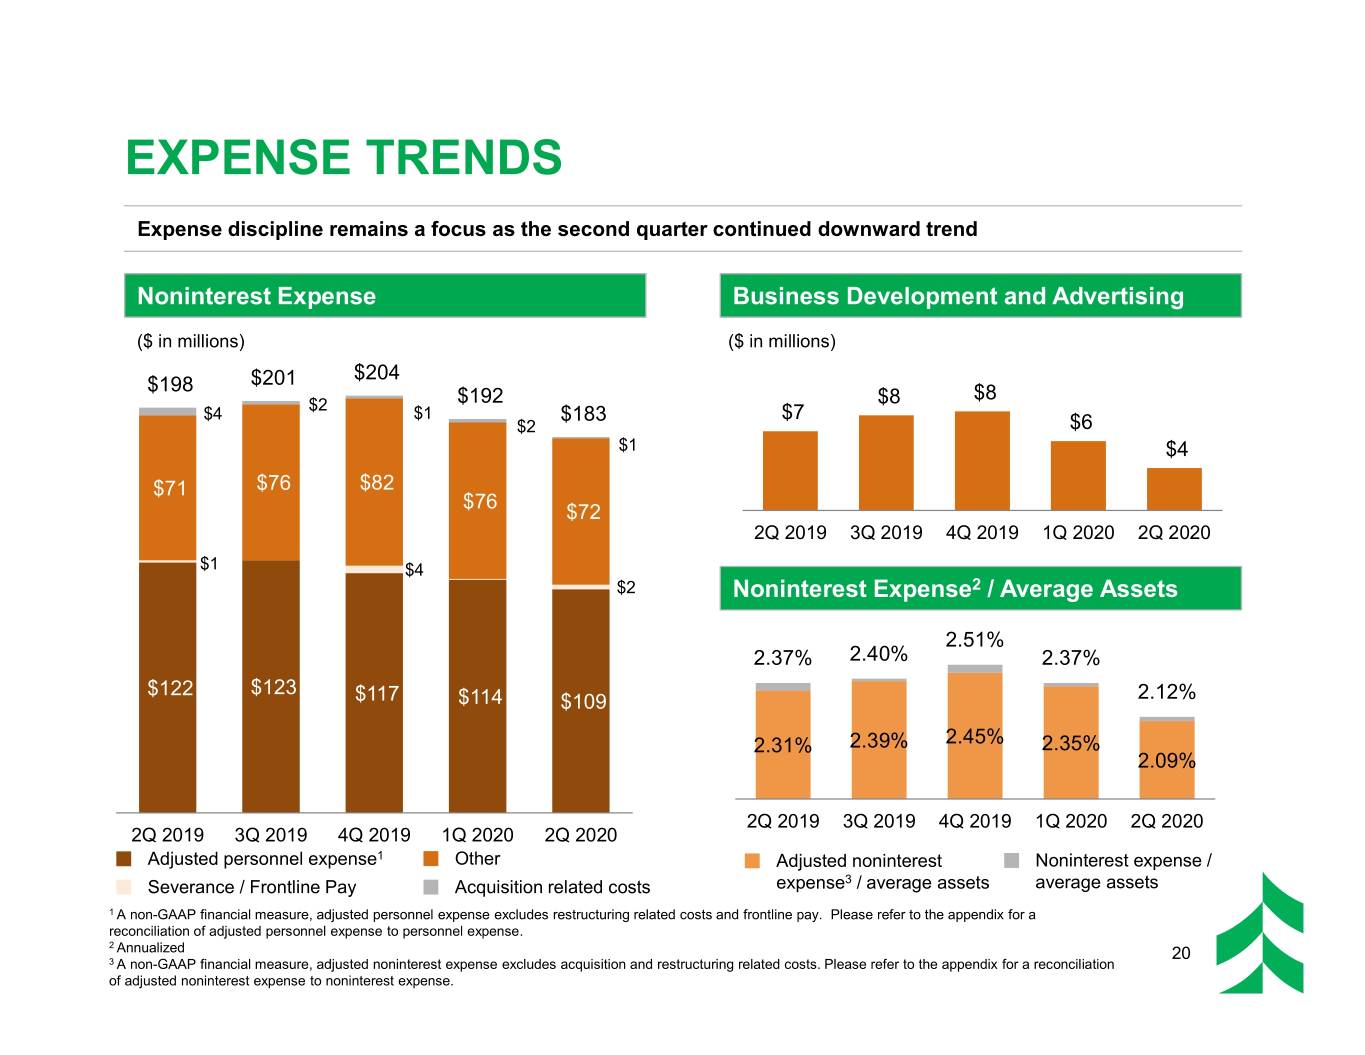
EXPENSE TRENDS Expense discipline remains a focus as the second quarter continued downward trend Noninterest Expense Business Development and Advertising ($ in millions) ($ in millions) $201 $204 $198 $8 $2 $192 $8 $4 $1 $183 $7 $2 $6 $1 $4 $71 $76 $82 $76 $72 2Q 2019 3Q 2019 4Q 2019 1Q 2020 2Q 2020 $1 $4 $2 Noninterest Expense2 / Average Assets 2.51% 2.37% 2.40% 2.37% $122 $123 $117 $114 $109 2.12% 2.31% 2.39% 2.45% 2.35% 2.09% 2Q 2019 3Q 2019 4Q 2019 1Q 2020 2Q 2020 2Q 2019 3Q 2019 4Q 2019 1Q 2020 2Q 2020 Adjusted personnel expense1 Other Adjusted noninterest Noninterest expense / Severance / Frontline Pay Acquisition related costs expense3 / average assets average assets 1 A non-GAAP financial measure, adjusted personnel expense excludes restructuring related costs and frontline pay. Please refer to the appendix for a reconciliation of adjusted personnel expense to personnel expense. 2 Annualized 20 3 A non-GAAP financial measure, adjusted noninterest expense excludes acquisition and restructuring related costs. Please refer to the appendix for a reconciliation of adjusted noninterest expense to noninterest expense.
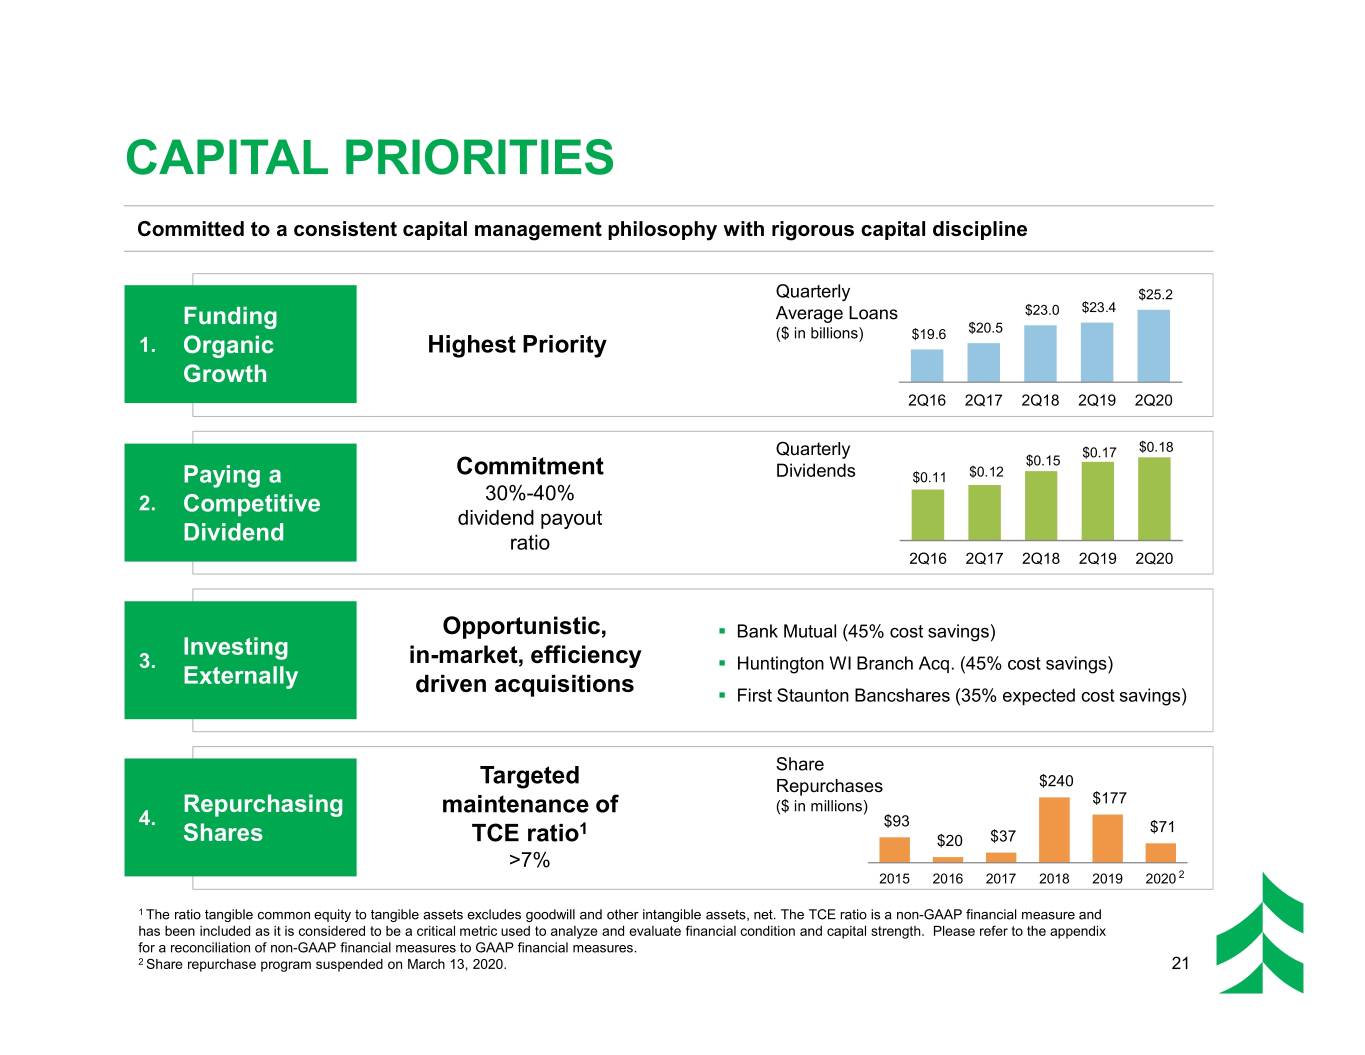
CAPITAL PRIORITIES Committed to a consistent capital management philosophy 2with rigorous capital discipline Quarterly $25.2 Funding Average Loans $23.0 $23.4 ($ in billions) $19.6 $20.5 1. Organic Highest Priority Growth 2Q16 2Q17 2Q18 2Q19 2Q20 Quarterly $0.17 $0.18 Commitment $0.15 Paying a Dividends $0.11 $0.12 2. Competitive 30%-40% dividend payout Dividend ratio 2Q16 2Q17 2Q18 2Q19 2Q20 Opportunistic, . Bank Mutual (45% cost savings) Investing 3. in-market, efficiency . Huntington WI Branch Acq. (45% cost savings) Externally driven acquisitions . First Staunton Bancshares (35% expected cost savings) Share Targeted Repurchases $240 $177 Repurchasing maintenance of ($ in millions) 4. 1 $93 $71 Shares TCE ratio $20 $37 >7% 2015 2016 2017 2018 2019 2020 2 1 The ratio tangible common equity to tangible assets excludes goodwill and other intangible assets, net. The TCE ratio is a non-GAAP financial measure and has been included as it is considered to be a critical metric used to analyze and evaluate financial condition and capital strength. Please refer to the appendix for a reconciliation of non-GAAP financial measures to GAAP financial measures. 2 Share repurchase program suspended on March 13, 2020. 21
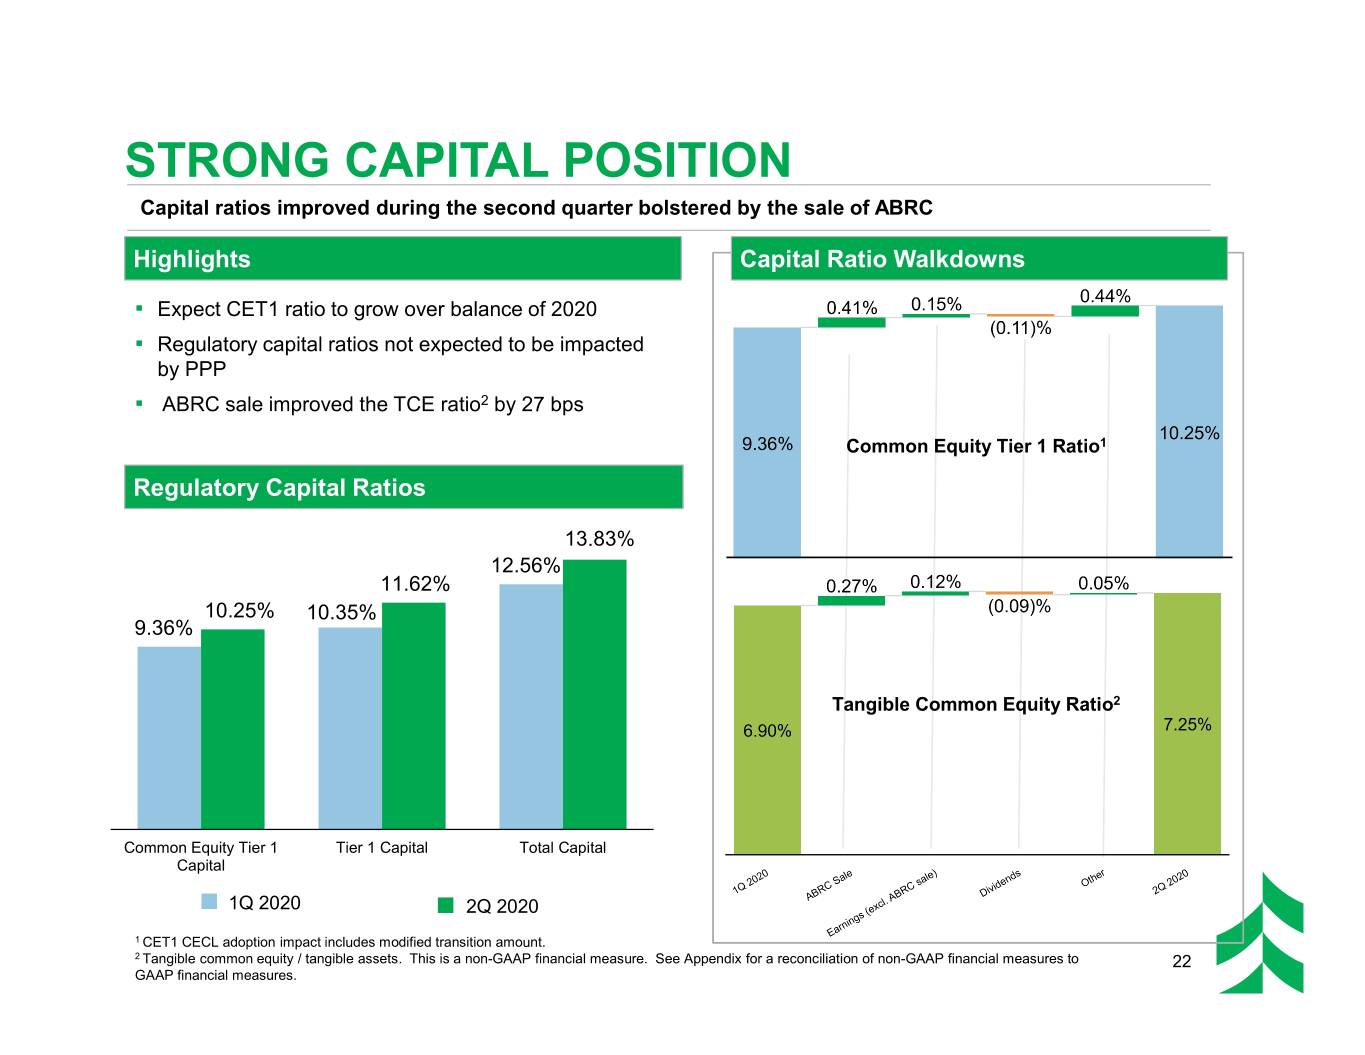
STRONG CAPITAL POSITION Capital ratios improved during the second quarter bolstered by the sale of ABRC Highlights Capital Ratio Walkdowns ▪ Expect CET1 ratio to grow over balance of 2020 ▪ Regulatory capital ratios not expected to be impacted by PPP ▪ ABRC sale improved the TCE ratio2 by 27 bps Common Equity Tier 1 Ratio1 Regulatory Capital Ratios 13.83% 12.56% 11.62% 10.25% 10.35% 9.36% Tangible Common Equity Ratio2 Common Equity Tier 1 Tier 1 Capital Total Capital Capital 1Q 2020 2Q 2020 1 CET1 CECL adoption impact includes modified transition amount. 2 Tangible common equity / tangible assets. This is a non-GAAP financial measure. See Appendix for a reconciliation of non-GAAP financial measures to 22 GAAP financial measures.
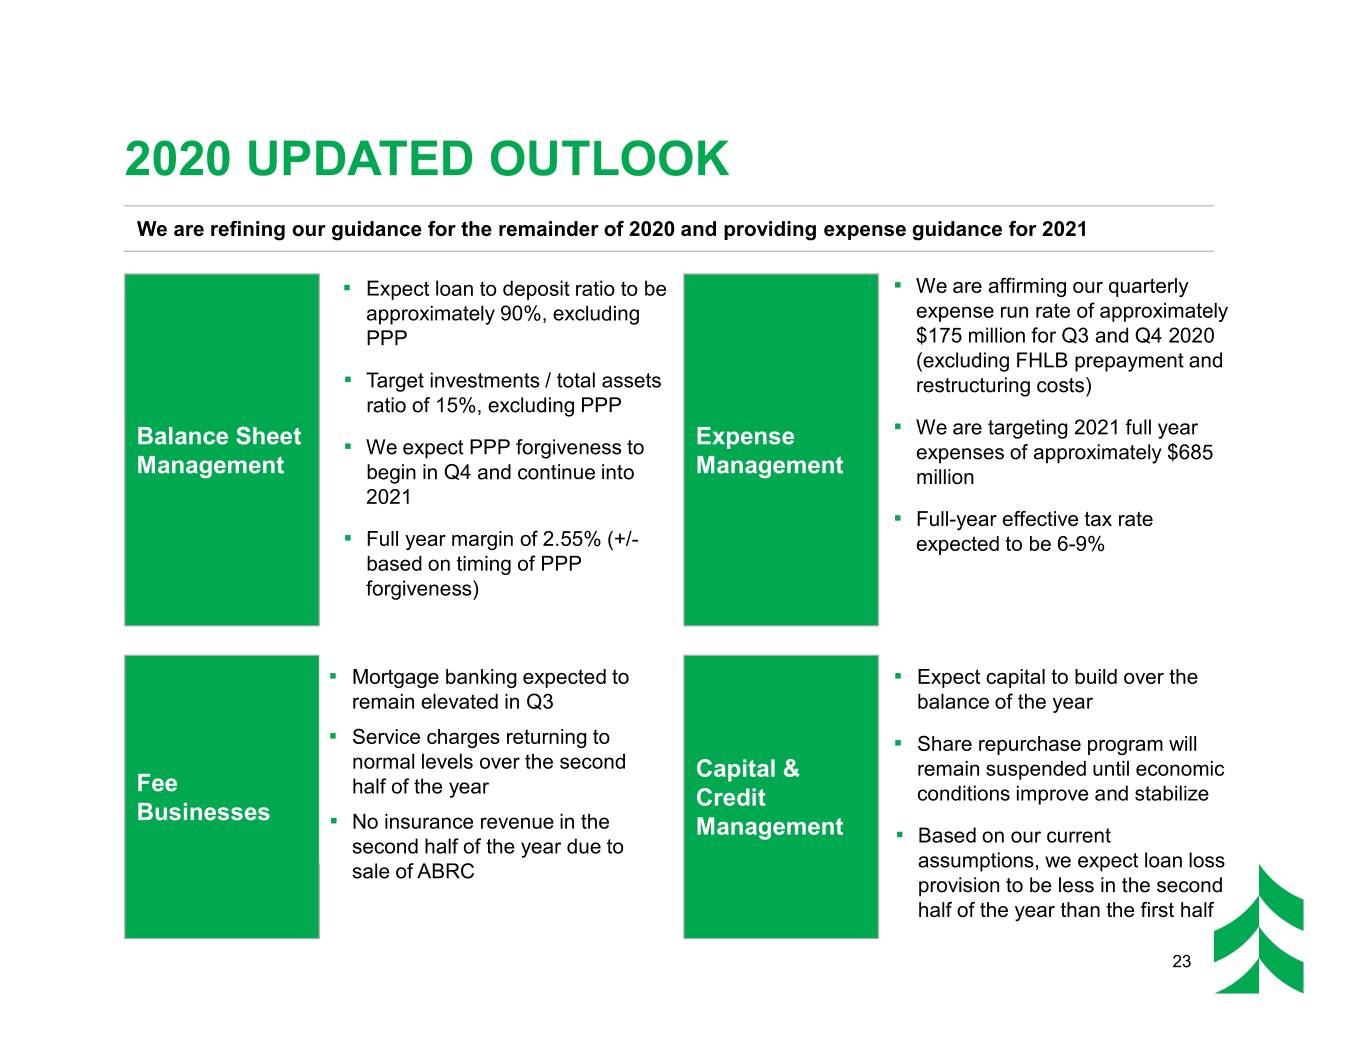
2020 UPDATED OUTLOOK We are refining our guidance for the remainder of 2020 and providing expense guidance for 2021 ▪ Expect loan to deposit ratio to be ▪ We are affirming our quarterly approximately 90%, excluding expense run rate of approximately PPP $175 million for Q3 and Q4 2020 (excluding FHLB prepayment and ▪ Target investments / total assets restructuring costs) ratio of 15%, excluding PPP Balance Sheet Expense ▪ We are targeting 2021 full year ▪ We expect PPP forgiveness to expenses of approximately $685 Management begin in Q4 and continue into Management million 2021 ▪ Full-year effective tax rate ▪ Full year margin of 2.55% (+/- expected to be 6-9% based on timing of PPP forgiveness) ▪ Mortgage banking expected to ▪ Expect capital to build over the remain elevated in Q3 balance of the year ▪ Service charges returning to ▪ Share repurchase program will normal levels over the second Capital & remain suspended until economic Fee half of the year Credit conditions improve and stabilize Businesses ▪ No insurance revenue in the Management Based on our current second half of the year due to ▪ assumptions, we expect loan loss sale of ABRC provision to be less in the second half of the year than the first half 23
APPENDIX
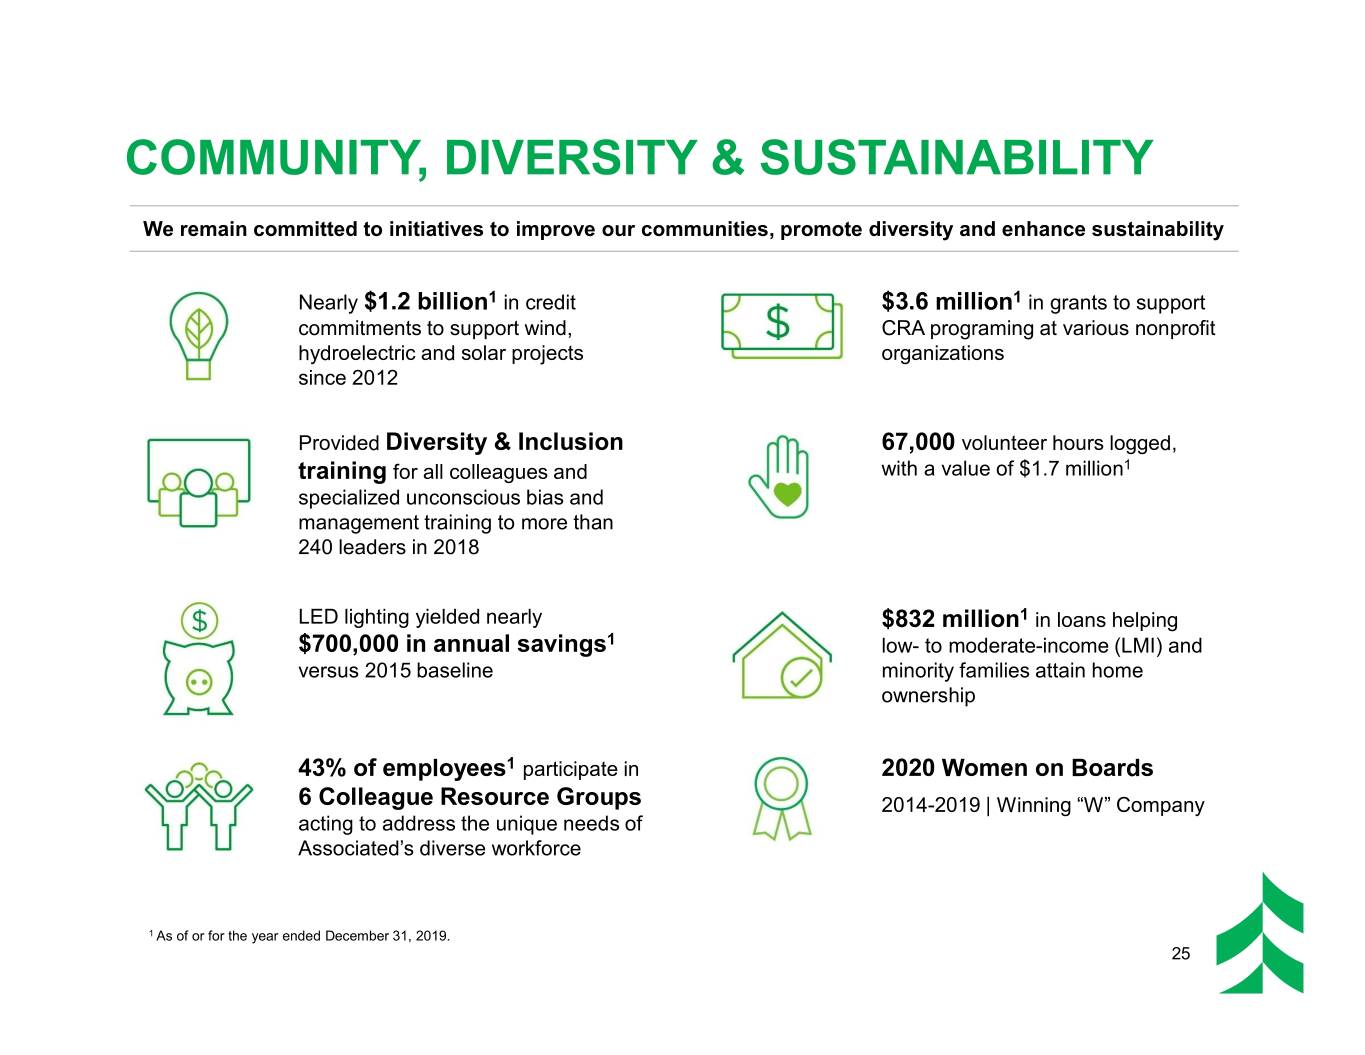
COMMUNITY, DIVERSITY & SUSTAINABILITY We remain committed to initiatives to improve our communities, promote diversity and enhance sustainability Nearly $1.2 billion1 in credit $3.6 million1 in grants to support commitments to support wind, CRA programing at various nonprofit hydroelectric and solar projects organizations since 2012 Provided Diversity & Inclusion 67,000 volunteer hours logged, training for all colleagues and with a value of $1.7 million1 specialized unconscious bias and management training to more than 240 leaders in 2018 LED lighting yielded nearly $832 million1 in loans helping $700,000 in annual savings1 low- to moderate-income (LMI) and versus 2015 baseline minority families attain home ownership 43% of employees1 participate in 2020 Women on Boards 6 Colleague Resource Groups 2014-2019 | Winning “W” Company acting to address the unique needs of Associated’s diverse workforce 1 As of or for the year ended December 31, 2019. 25
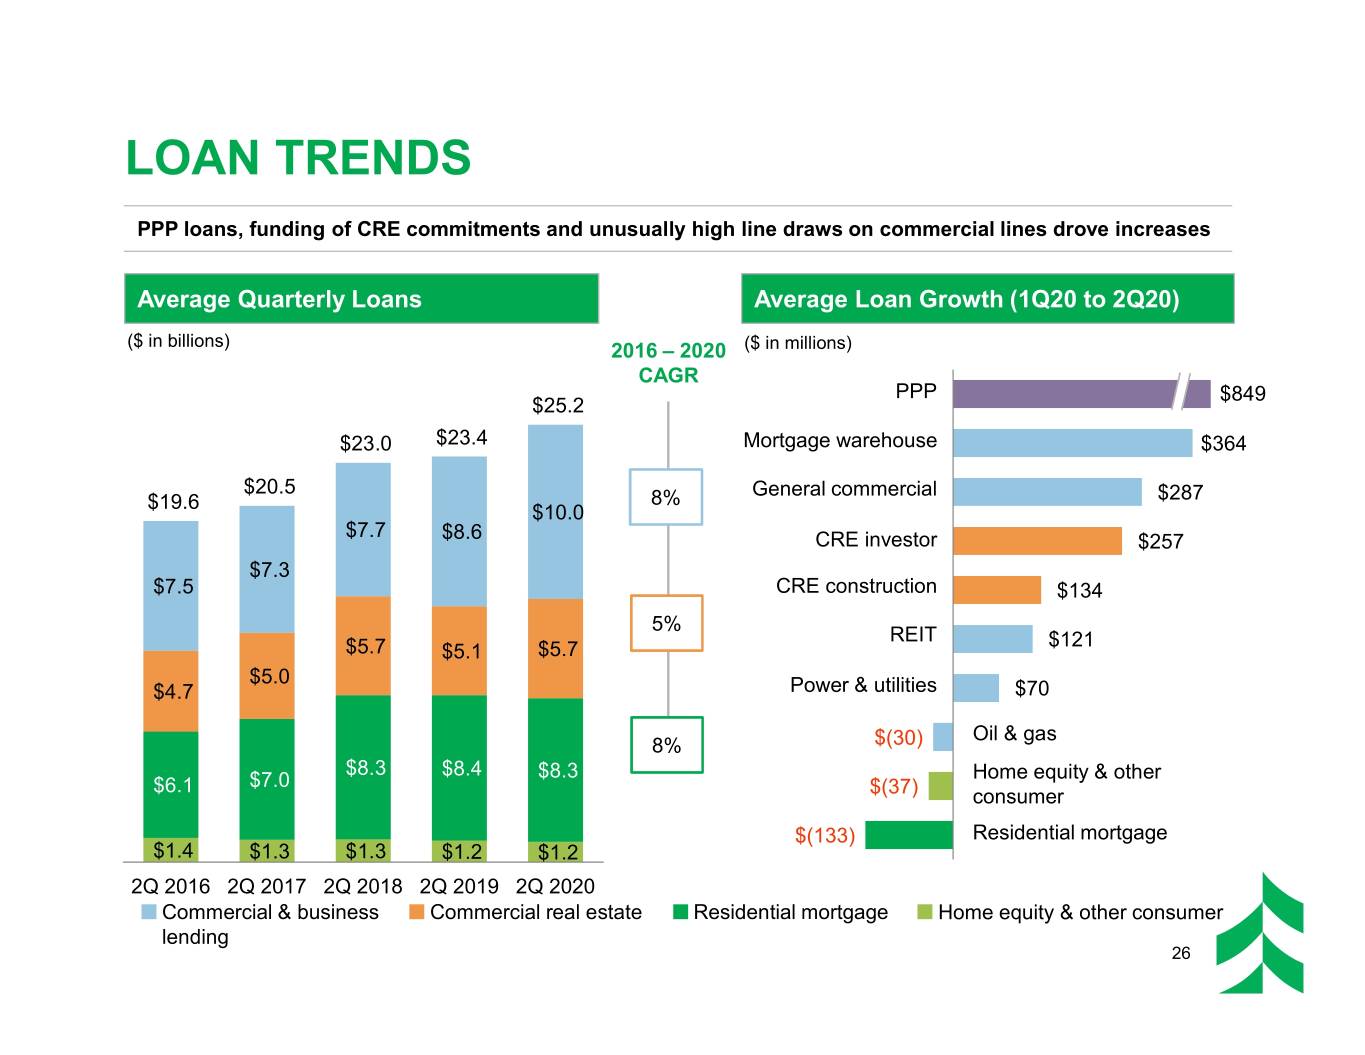
LOAN TRENDS PPP loans, funding of CRE commitments and unusually high line draws on commercial lines drove increases Average Quarterly Loans Average Loan Growth (1Q20 to 2Q20) ($ in billions) 2016 – 2020 ($ in millions) CAGR PPP $849 $25.2 $23.0 $23.4 Mortgage warehouse $364 $20.5 General commercial $19.6 8% $287 $10.0 $7.7 $8.6 CRE investor $257 $7.3 $7.5 CRE construction $134 5% REIT $121 $5.7 $5.1 $5.7 $5.0 $4.7 Power & utilities $70 Oil & gas 8% $(30) $8.3 $8.4 $8.3 Home equity & other $6.1 $7.0 $(37) consumer $(133) Residential mortgage $1.4 $1.3 $1.3 $1.2 $1.2 2Q 2016 2Q 2017 2Q 2018 2Q 2019 2Q 2020 Commercial & business Commercial real estate Residential mortgage Home equity & other consumer lending 26
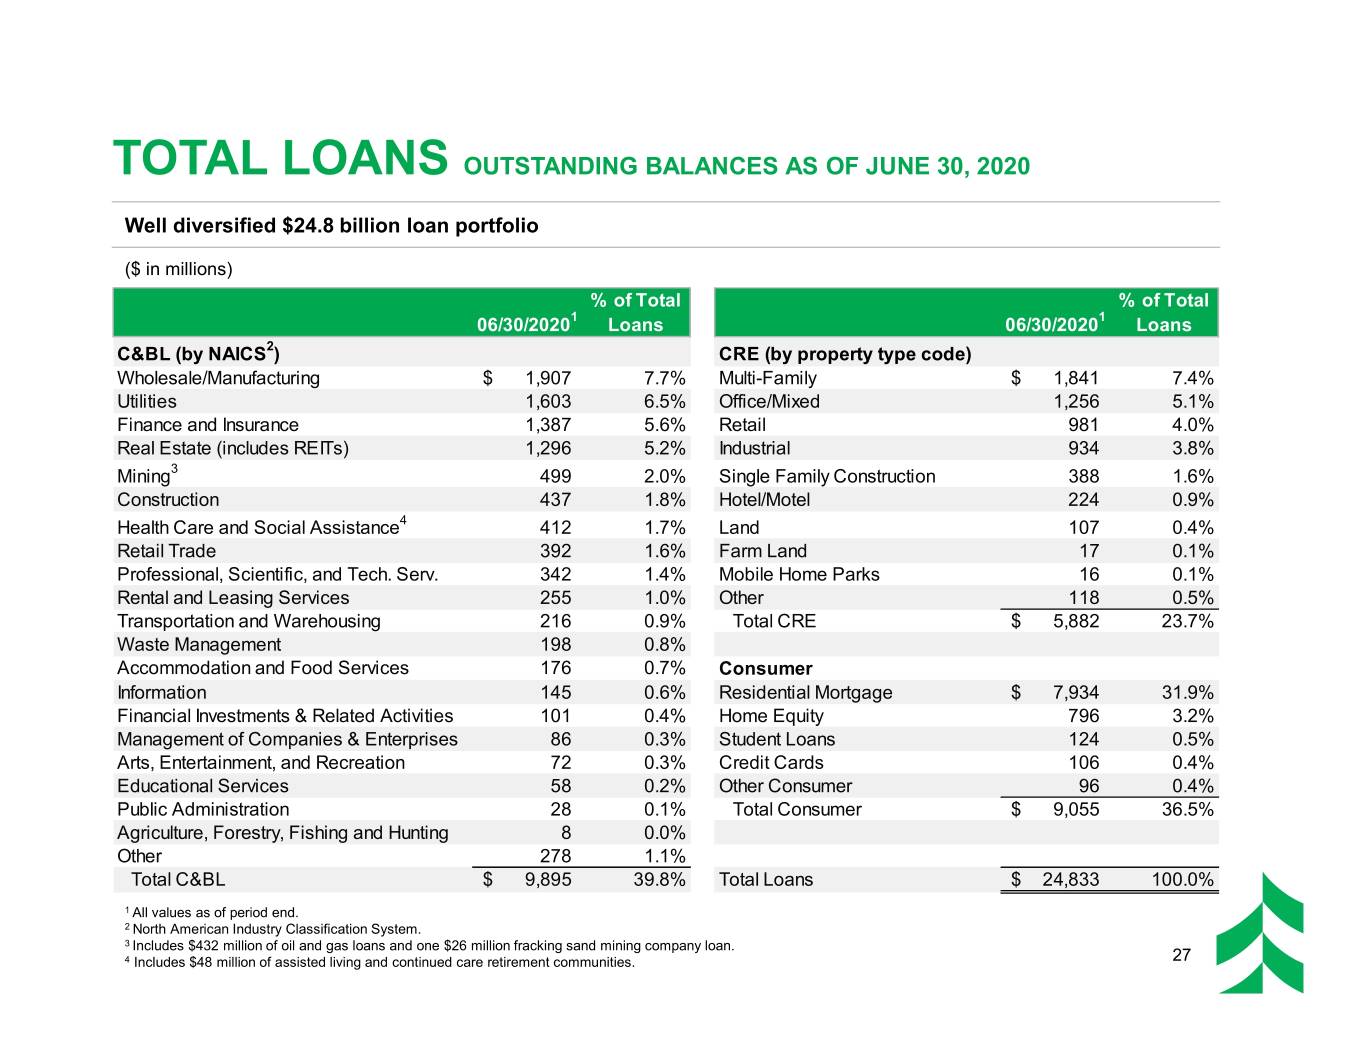
TOTAL LOANS OUTSTANDING BALANCES AS OF JUNE 30, 2020 Well diversified $24.8 billion loan portfolio ($ in millions) % of Total % of Total 06/30/20201 Loans 06/30/20201 Loans C&BL (by NAICS2) CRE (by property type code) Wholesale/Manufacturing$ 1,907 7.7% Multi-Family$ 1,841 7.4% Utilities 1,603 6.5% Office/Mixed 1,256 5.1% Finance and Insurance 1,387 5.6% Retail 981 4.0% Real Estate (includes REITs) 1,296 5.2% Industrial 934 3.8% Mining3 499 2.0% Single Family Construction 388 1.6% Construction 437 1.8% Hotel/Motel 224 0.9% Health Care and Social Assistance4 412 1.7% Land 107 0.4% Retail Trade 392 1.6% Farm Land 17 0.1% Professional, Scientific, and Tech. Serv. 342 1.4% Mobile Home Parks 16 0.1% Rental and Leasing Services 255 1.0% Other 118 0.5% Transportation and Warehousing 216 0.9% Total CRE$ 5,882 23.7% Waste Management 198 0.8% Accommodation and Food Services 176 0.7% Consumer Information 145 0.6% Residential Mortgage$ 7,934 31.9% Financial Investments & Related Activities 101 0.4% Home Equity 796 3.2% Management of Companies & Enterprises 86 0.3% Student Loans 124 0.5% Arts, Entertainment, and Recreation 72 0.3% Credit Cards 106 0.4% Educational Services 58 0.2% Other Consumer 96 0.4% Public Administration 28 0.1% Total Consumer$ 9,055 36.5% Agriculture, Forestry, Fishing and Hunting 8 0.0% Other 278 1.1% Total C&BL$ 9,895 39.8% Total Loans$ 24,833 100.0% 1 All values as of period end. 2 North American Industry Classification System. 3 Includes $432 million of oil and gas loans and one $26 million fracking sand mining company loan. 4 Includes $48 million of assisted living and continued care retirement communities. 27
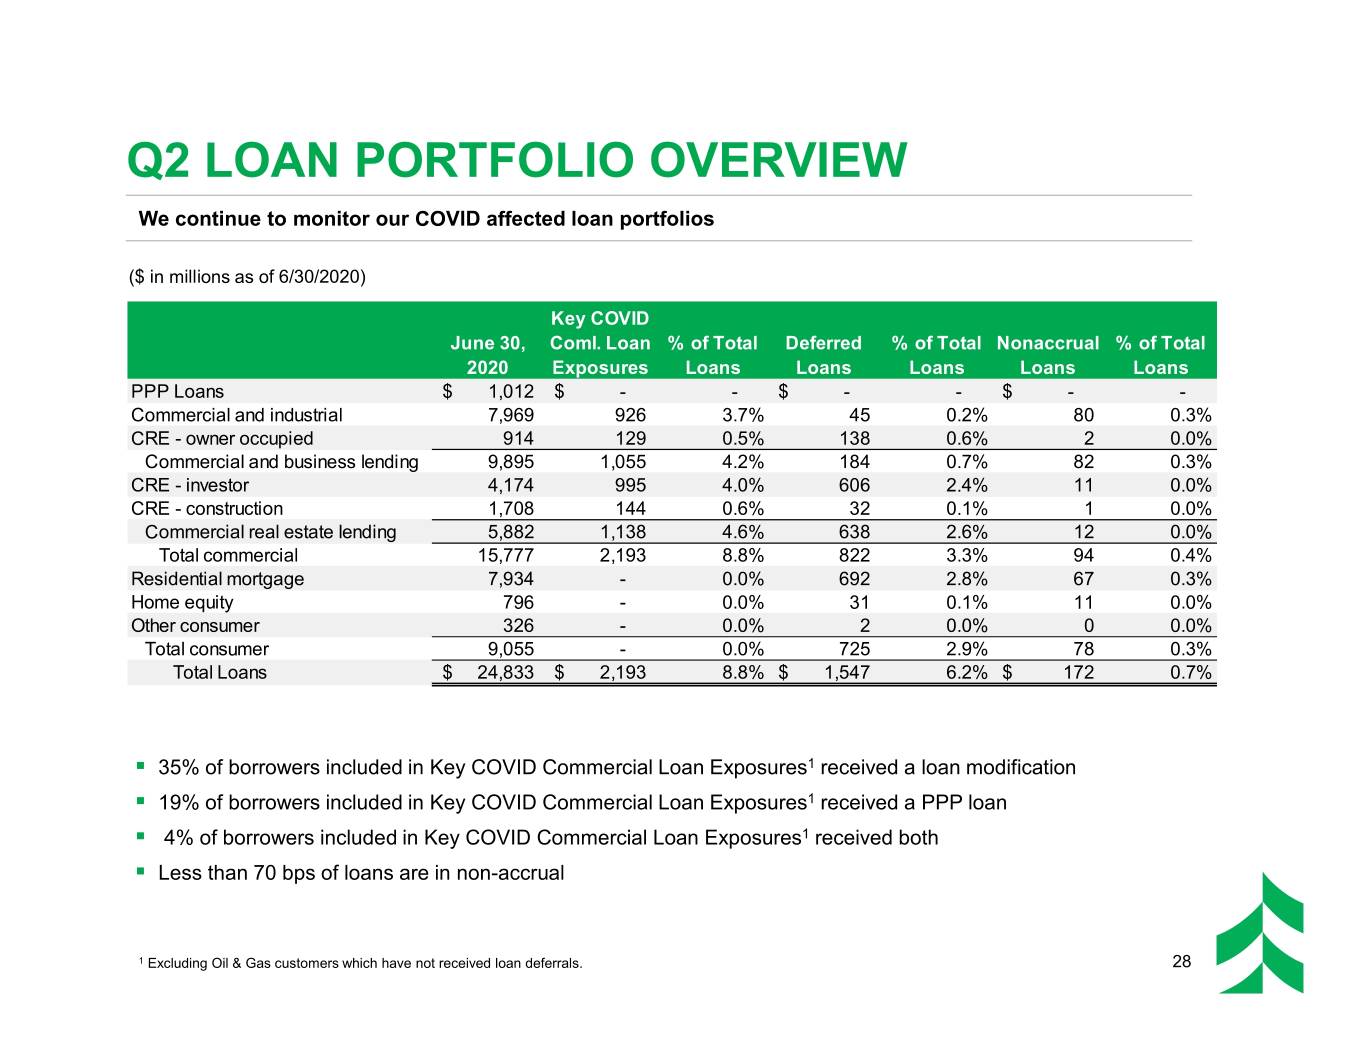
Q2 LOAN PORTFOLIO OVERVIEW We continue to monitor our COVID affected loan portfolios ($ in millions as of 6/30/2020) Key COVID June 30, Coml. Loan % of Total Deferred % of Total Nonaccrual % of Total 2020 Exposures Loans Loans Loans Loans Loans PPP Loans$ 1,012 $ - - $ - - $ - - Commercial and industrial 7,969 926 3.7% 45 0.2% 80 0.3% CRE - owner occupied 914 129 0.5% 138 0.6% 2 0.0% Commercial and business lending 9,895 1,055 4.2% 184 0.7% 82 0.3% CRE - investor 4,174 995 4.0% 606 2.4% 11 0.0% CRE - construction 1,708 144 0.6% 32 0.1% 1 0.0% Commercial real estate lending 5,882 1,138 4.6% 638 2.6% 12 0.0% Total commercial 15,777 2,193 8.8% 822 3.3% 94 0.4% Residential mortgage 7,934 - 0.0% 692 2.8% 67 0.3% Home equity 796 - 0.0% 31 0.1% 11 0.0% Other consumer 326 - 0.0% 2 0.0% 0 0.0% Total consumer 9,055 - 0.0% 725 2.9% 78 0.3% Total Loans$ 24,833 $ 2,193 8.8%$ 1,547 6.2%$ 172 0.7% . 35% of borrowers included in Key COVID Commercial Loan Exposures1 received a loan modification . 19% of borrowers included in Key COVID Commercial Loan Exposures1 received a PPP loan . 4% of borrowers included in Key COVID Commercial Loan Exposures1 received both . Less than 70 bps of loans are in non-accrual 1 Excluding Oil & Gas customers which have not received loan deferrals. 28
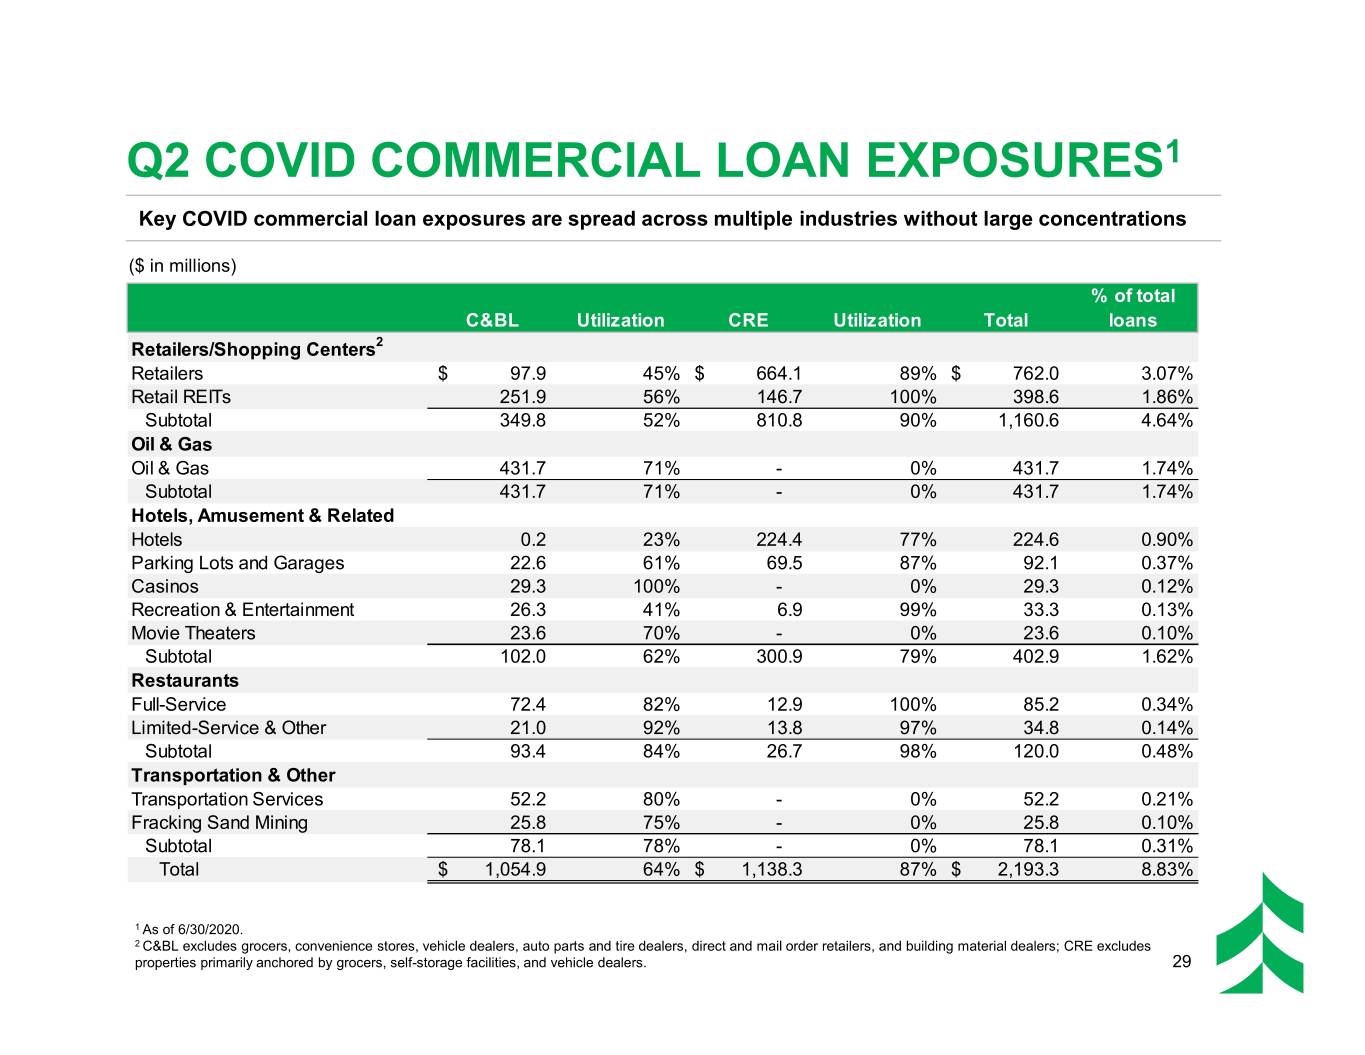
Q2 COVID COMMERCIAL LOAN EXPOSURES1 Key COVID commercial loan exposures are spread across multiple industries without large concentrations ($ in millions) % of total C&BL Utilization CRE Utilization Total loans Retailers/Shopping Centers2 Retailers$ 97.9 45%$ 664.1 89%$ 762.0 3.07% Retail REITs 251.9 56% 146.7 100% 398.6 1.86% Subtotal 349.8 52% 810.8 90% 1,160.6 4.64% Oil & Gas Oil & Gas 431.7 71% - 0% 431.7 1.74% Subtotal 431.7 71% - 0% 431.7 1.74% Hotels, Amusement & Related Hotels 0.2 23% 224.4 77% 224.6 0.90% Parking Lots and Garages 22.6 61% 69.5 87% 92.1 0.37% Casinos 29.3 100% - 0% 29.3 0.12% Recreation & Entertainment 26.3 41% 6.9 99% 33.3 0.13% Movie Theaters 23.6 70% - 0% 23.6 0.10% Subtotal 102.0 62% 300.9 79% 402.9 1.62% Restaurants Full-Service 72.4 82% 12.9 100% 85.2 0.34% Limited-Service & Other 21.0 92% 13.8 97% 34.8 0.14% Subtotal 93.4 84% 26.7 98% 120.0 0.48% Transportation & Other Transportation Services 52.2 80% - 0% 52.2 0.21% Fracking Sand Mining 25.8 75% - 0% 25.8 0.10% Subtotal 78.1 78% - 0% 78.1 0.31% Total$ 1,054.9 64%$ 1,138.3 87%$ 2,193.3 8.83% 1 As of 6/30/2020. 2 C&BL excludes grocers, convenience stores, vehicle dealers, auto parts and tire dealers, direct and mail order retailers, and building material dealers; CRE excludes properties primarily anchored by grocers, self-storage facilities, and vehicle dealers. 29
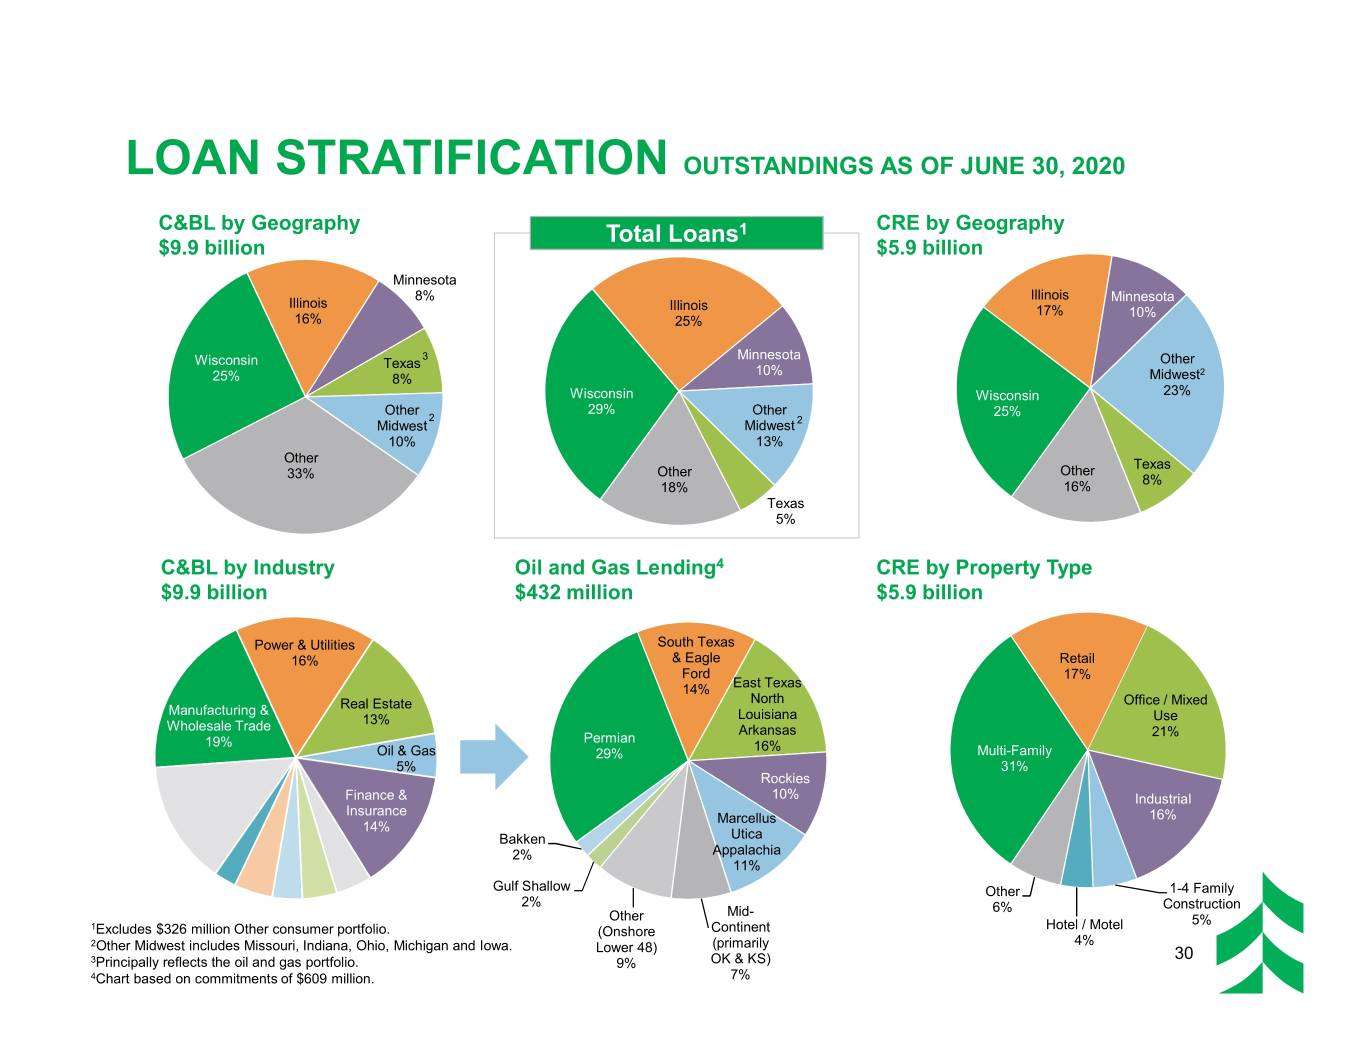
LOAN STRATIFICATION OUTSTANDINGS AS OF JUNE 30, 2020 C&BL by Geography Total Loans1 CRE by Geography $9.9 billion $5.9 billion Minnesota 8% Illinois Illinois Minnesota Illinois 17% 10% 16% 25% 3 Minnesota Wisconsin Texas Other 10% 2 25% 8% Midwest Wisconsin Wisconsin 23% Other 29% Other 2 25% Midwest Midwest 2 10% 13% Other Texas Other Other 33% 8% 18% 16% Texas 5% C&BL by Industry Oil and Gas Lending4 CRE by Property Type $9.9 billion $432 million $5.9 billion Power & Utilities South Texas 16% & Eagle Retail Ford 17% 14% East Texas North Office / Mixed Manufacturing & Real Estate 13% Louisiana Use Wholesale Trade Arkansas Permian 21% 19% 16% Oil & Gas 29% Multi-Family 5% 31% Rockies Finance & 10% Industrial Insurance Marcellus 16% 14% Bakken Utica 2% Appalachia 11% Gulf Shallow Other 1-4 Family 2% 6% Construction Other Mid- 1 Hotel / Motel 5% Excludes $326 million Other consumer portfolio. (Onshore Continent 2 (primarily 4% Other Midwest includes Missouri, Indiana, Ohio, Michigan and Iowa. Lower 48) 30 3Principally reflects the oil and gas portfolio. 9% OK & KS) 4Chart based on commitments of $609 million. 7%

COMMERCIAL LOAN MANAGEMENT1 We continue to de-risk our oil & gas portfolio while growing power & utilities and commercial real estate Oil & Gas Loans Power & Utilities Loans Commercial Real Estate ($ in billions) ($ in billions) ($ in billions) $1.6 $1.6 $1.5 $8.0 $0.8 $1.4 $1.4 $7.6 $1.3 $7.0 $7.1 $7.2 $0.7 $6.7 $0.6 $0.5 $0.5 $0.4 $5.6 $5.9 $5.1 $5.2 $5.2 $5.2 1Q19 2Q19 3Q19 4Q19 1Q20 2Q20 1Q19 2Q19 3Q19 4Q19 1Q20 2Q20 1Q19 2Q19 3Q19 4Q19 1Q20 2Q20 CRE unfunded commitments CRE total outstanding balance 1 All values as of period end. 31
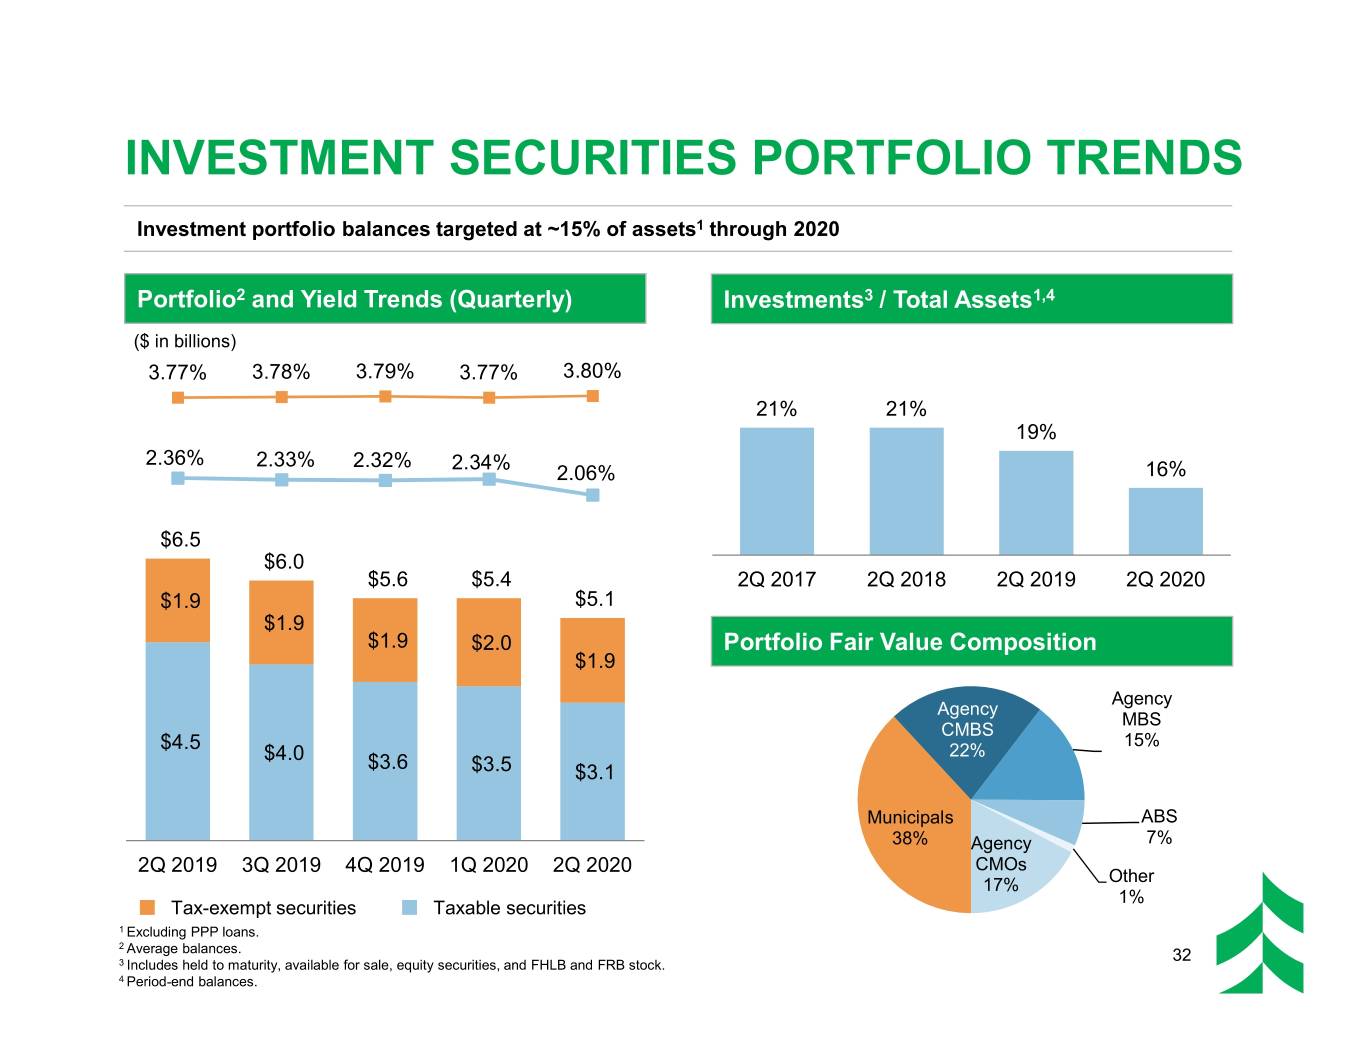
INVESTMENT SECURITIES PORTFOLIO TRENDS Investment portfolio balances targeted at ~15% of assets1 through 2020 Portfolio2 and Yield Trends (Quarterly) Investments3 / Total Assets1,4 ($ in billions) 3.77% 3.78% 3.79% 3.77% 3.80% 21% 21% 19% 2.36% 2.33% 2.32% 2.34% 2.06% 16% $6.5 $6.0 $5.6 $5.4 2Q 2017 2Q 2018 2Q 2019 2Q 2020 $1.9 $5.1 $1.9 $1.9 $2.0 Portfolio Fair Value Composition $1.9 Agency Agency MBS CMBS $4.5 15% $4.0 22% $3.6 $3.5 $3.1 Municipals ABS 38% Agency 7% 2Q 2019 3Q 2019 4Q 2019 1Q 2020 2Q 2020 CMOs 17% Other 1% Tax-exempt securities Taxable securities 1 Excluding PPP loans. 2 Average balances. 32 3 Includes held to maturity, available for sale, equity securities, and FHLB and FRB stock. 4 Period-end balances.

RECONCILIATION AND DEFINITIONS OF NON-GAAP ITEMS ($ IN MILLIONS) Adjusted Noninterest Expense Reconcilation1 2Q19 3Q19 4Q19 1Q20 2Q20 Noninterest expense $198 $201 $204 $192 $183 Acquisition related costs 4 2 1 2 1 Severance / Frontline pay 1 0 4 0 2 Adjusted noninterest expense $193 $199 $199 $190 $181 Fee-based Revenue1 2Q16 2Q17 2Q18 2Q19 2Q20 Insurance commissions and fees $22 $21 $24 $23 $22 Wealth management fees 16 17 20 21 21 Service charges and deposit account fees 16 16 16 15 11 Card-based fees and other fee-based revenue 13 14 14 15 14 Fee-basedrevenue $67 $67 $75 $74 $68 Other 15151821186 Total noninterest income $82 $82 $93 $96 $254 Adjusted Personnel Expense Reconciliation1 2Q19 3Q19 4Q19 1Q20 2Q20 Personnel expense $123 $123 $121 $114 $111 Severance / Frontline pay 1 0 4 0 2 Adjusted personnel expense $122 $123 $117 $114 $109 Tangible Common Equity and Tangible Assets Reconciliation2 1Q20 2Q20 Common equity $3,534 $3,671 Goodwill and other intangible assets, net (1,284) (1,181) Tangible common equity $2,250 $2,490 Total assets $33,908 $35,501 Goodwill and other intangible assets, net (1,284) (1,181) Tangible assets $32,624 $34,321 1 This is a non-GAAP financial measure. Management believes these measures are meaningful because they reflect adjustments commonly made by management, investors, regulators, and analysts to evaluate the adequacy of earnings per common share, provide greater understanding of ongoing operations and enhance comparability of results with prior periods. 2 The ratio tangible common equity to tangible assets excludes goodwill and other intangible assets, net. This financial measure has been included as it is 33 considered to be a critical metric with which to analyze and evaluate financial condition and capital strength.
