Attached files
| file | filename |
|---|---|
| 8-K - 8-K - Frontier Communications Parent, Inc. | brhc10014897_8k.htm |
Exhibit 99.1

Quarterly Investor Update September 3rd, 2020

Safe Harbor StatementForward-looking Language This presentation contains "forward-looking statements,"
related to future events. Forward-looking statements address Frontier’s expected future business, financial performance, and financial condition, and contain words such as "expect," "anticipate," "intend," "plan," "believe," "seek," "see,"
"may," "will," "would," or "target." Forward-looking statements by their nature address matters that are, to different degrees, uncertain. For Frontier, particular uncertainties that could cause actual results to be materially different than
those expressed in such forward-looking statements include: our ability to continue as a going concern; our ability to successfully consummate a financial restructuring of our existing debt, existing equity interests, and certain other
obligations (the Restructuring), and emerge from cases commenced under chapter 11 (the Chapter 11 Cases) of the United States Bankruptcy Code, including by satisfying the conditions and milestones in the restructuring support agreement; our
ability to improve our liquidity and long-term capital structure and to address our debt service obligations through the Restructuring and the potential adverse effects of the Chapter 11 Cases on our liquidity and results of operations; our
ability to maintain relationships with suppliers, customers, employees and other third parties as a result of the Restructuring and the Chapter 11 Cases; the effects of the Restructuring and the Chapter 11 Cases on the Company and the interests
of various constituents; risks and uncertainties associated with the Restructuring, including our ability to receive approvals for debtor-in-possession financing and successfully consummate the Restructuring; our ability to comply with the
restrictions expected to be imposed by covenants in debtor-in-possession and exit financing; the length of time that the Company will operate under Chapter 11 protection and the continued availability of operating capital during the pendency of
the Chapter 11 Cases; risks associated with third party motions in the Chapter 11 Cases, which may interfere with the Company’s ability to consummate the Restructuring; increased administrative and legal costs related to the Chapter 11 process;
declines in revenue from our voice services, switched and nonswitched access and video and data services that we cannot stabilize or offset with increases in revenue from other products and services; our ability to successfully implement
strategic initiatives, including opportunities to enhance revenue and realize productivity improvements; our ability to effectively manage our operations, operating expenses, capital expenditures, debt service requirement and cash paid for
income taxes and liquidity; competition from cable, wireless and wireline carriers, satellite, and OTT companies, and the risk that we will not respond on a timely or profitable basis; our ability to successfully adjust to changes in the
communications industry, including the effects of technological changes and competition on our capital expenditures, products and service offerings; risks related to disruption in our networks, infrastructure and information technology that
result in customer loss and/or incurrence of additional expenses; the impact of potential information technology or data security breaches or other cyber-attacks or other disruptions; our ability to retain or attract new customers and to
maintain relationships with customers, employees or suppliers; our ability to secure, continue to use or renew intellectual property and other licenses used in our business; our ability to hire or retain key personnel; our ability to dispose of
certain assets or asset groups on terms that are attractive to us, or at all; the effects of changes in the availability of federal and state universal service funding or other subsidies to us and our competitors and our ability to obtain
future subsidies, including participation in the proposed RDOF program; our ability to meet our CAF II obligations and the risk of penalties or obligations to return certain CAF II funds; our ability to defend against litigation and potentially
unfavorable results from current pending and future litigation; our ability to comply with applicable federal and state consumer protection requirements; the effects of state regulatory requirements that could limit our ability to transfer cash
among our subsidiaries or dividend funds up to the parent company; the effects of governmental legislation and regulation on our business, including costs, disruptions, possible limitations on operating flexibility and changes to the
competitive landscape resulting from such legislation or regulation; the impact of regulatory, investigative and legal proceedings and legal compliance risks; government infrastructure projects (such as highway construction) that impact our
capital expenditures; continued reductions in switched access revenues as a result of regulation, competition or technology substitutions; our ability to effectively manage service quality in the states in which we operate and meet mandated
service quality metrics; the effects of changes in income tax rates, tax laws, regulations or rulings, or federal or state tax assessments, including the risk that such changes may benefit our competitors more than us, as well as potential
future decreases in the value of our deferred tax assets; the effects of changes in accounting policies or practices, including potential future impairment charges with respect to our intangible assets or additional losses on assets held for
sale; the effects of increased medical expenses and pension and postemployment expenses; our ability to successfully renegotiate union contracts; changes in pension plan assumptions, interest rates, discount rates, regulatory rules and/or the
value of our pension plan assets, which could require us to make increased contributions to the pension plan in 2020 and beyond; the effects of weak economic conditions and market disruptions, including the impact of the ongoing COVID-19
pandemic; risks arising from the delisting of our common stock from the Nasdaq Global Select Market; and the risks and other factors contained in Frontier’s filings with the U.S. Securities and Exchange Commission, including our most recent
report on Form 10-K and our Form 10-Q for the quarter ended June 30, 2020. These risks and uncertainties may cause actual future results to be materially different than those expressed in such forward-looking statements. Frontier has no
obligation to update or revise these forward-looking statements and does not undertake to do so. 2

Non-GAAP Financial Measures Frontier uses certain non-GAAP financial measures in evaluating its
performance, including EBITDA, EBITDA margin, Adjusted EBITDA, Adjusted EBITDA margin, operating free cash flow, and adjusted operating expenses, each of which is described below. Management uses these non-GAAP financial measures internally to
(i) assist in analyzing Frontier's underlying financial performance from period to period, (ii) analyze and evaluate strategic and operational decisions, (iii) establish criteria for compensation decisions, and (iv) assist in the understanding
of Frontier's ability to generate cash flow and, as a result, to plan for future capital and operational decisions. Management believes that the presentation of these non-GAAP financial measures provides useful information to investors
regarding Frontier’s financial condition and results of operations because these measures, when used in conjunction with related GAAP financial measures (i) provide a more comprehensive view of Frontier’s core operations and ability to generate
cash flow, (ii) provide investors with the financial analytical framework upon which management bases financial, operational, compensation, and planning decisions and (iii) present measurements that investors and rating agencies have indicated
to management are useful to them in assessing Frontier and its results of operations. A reconciliation of these measures to the most comparable financial measures calculated and presented in accordance with GAAP is included in the accompanying
tables. These non-GAAP financial measures are not measures of financial performance or liquidity under GAAP, nor are they alternatives to GAAP measures and they may not be comparable to similarly titled measures of other companies. EBITDA is
defined as net income (loss) less income tax expense (benefit), interest expense, investment and other income (loss), pension settlement costs, gains/losses on extinguishment of debt, and depreciation and amortization. EBITDA margin is
calculated by dividing EBITDA by total revenue. Adjusted EBITDA is defined as EBITDA, as described above, adjusted to exclude, certain pension/OPEB expenses, restructuring costs and other charges, stock-based compensation expense, goodwill
impairment charges, and certain other non-recurring items. Adjusted EBITDA margin is calculated by dividing Adjusted EBITDA by total revenue. Management uses EBITDA, EBITDA margin, Adjusted EBITDA and Adjusted EBITDA margin to assist it in
comparing performance from period to period and as measures of operational performance. Management believes that these non-GAAP measures provide useful information for investors in evaluating Frontier’s operational performance from period to
period because they exclude depreciation and amortization expenses related to investments made in prior periods and are determined without regard to capital structure or investment activities. By excluding capital expenditures, debt repayments
and dividends, among other factors, these non-GAAP financial measures have certain shortcomings. Management compensates for these shortcomings by utilizing these non-GAAP financial measures in conjunction with the comparable GAAP financial
measures. Adjusted net income (loss) attributable to Frontier common shareholders is defined as net income (loss) attributable to Frontier common shareholders and excludes restructuring costs and other charges, pension settlement costs,
goodwill impairment charges, certain income tax items and the income tax effect of these items, and certain other non-recurring items. Adjusting for these items allows investors to better understand and analyze Frontier’s financial performance
over the periods presented. Management defines operating free cash flow, a non-GAAP measure, as net cash from operating activities less capital expenditures. Management uses operating free cash flow to assist it in comparing liquidity from
period to period and to obtain a more comprehensive view of Frontier’s core operations and ability to generate cash flow. Management believes that this non-GAAP measure is useful to investors in evaluating cash available to service debt. This
non-GAAP financial measure has certain shortcomings; it does not represent the residual cash flow available for discretionary expenditures, as items such as taxes, pension and OPEB costs, interest expense, and debt repayments are not deducted
in determining such measure. Management compensates for these shortcomings by utilizing this non-GAAP financial measure in conjunction with the comparable GAAP financial measure. Adjusted operating expenses is defined as operating expenses
adjusted to exclude depreciation and amortization, restructuring and other charges, goodwill impairment charges, certain pension/OPEB expenses, stock-based compensation expense, and certain other non-recurring items. Investors have indicated
that this non-GAAP measure is useful in evaluating Frontier’s performance. Projected GAAP financial measures are not provided herein because such figures are not available on a forward-looking basis and reconciliations of projected non-GAAP
financial measures are not provided because they could not be derived without unreasonable effort.The information in this presentation should be read in conjunction with the financial statements and footnotes contained in Frontier’s documents
filed with the U.S. Securities and Exchange Commission. 3

Note regarding Classifications of Results Unless otherwise indicated, the information presented herein,
including operational and financial data, non-GAAP measures, and commentary pertains to the Remaining Properties only. “Remaining Properties”, as defined in Frontier’s 10-Q for the quarter ended June 30, 2020, comprises the 25 states Frontier
currently operates in as of June 30, 2020, and excludes Washington, Oregon, Idaho, and Montana due to the divestiture of operations and assets in these states effective May 1, 2020. “Consolidated” refers to the entire business, which may
include financial data from Washington, Oregon, Idaho, and Montana for the periods through May 1, 2020. References to “Northwest Ops” refer to the metrics of the four Northwest states. Reconciliations for the Consolidated, Remaining Properties,
and Northwest Ops financial results can be found in the Appendix section of this presentation, Frontier’s 10-Q for the quarter ended June 30, 2020, and Frontier’s Form 8-K containing supplemental financial information filed on August 7, 2020.
4

Introduction Today’s Presenters Robert A. SchriesheimDirector; Chairman of Finance Committee Bernard
L. HanPresident and Chief Executive Officer Sheldon BruhaChief Financial Officer 5

Table of Contents Situation Overview (Speaker: Robert A. Schriesheim)Key Initiatives Update (Speaker:
Bernard L. Han)Quarterly Financial Results (Speaker: Sheldon Bruha)Appendix 7 6 13 25 31

Situation OverviewRobert A. Schriesheim,Director; Chairman of Finance Committee

Summary: Overview Our Focus is on creating value for our stakeholders by: 8 1 Managing an
expeditious restructuring process 2 Progressing and implementing an extensive operational improvement plan 3 Augmenting current management team through key hires 4 Developing a strong business foundation to position Frontier for maximum
optionality, including asset reconfiguration and reinvestment

Restructuring OverviewFrontier expects to emerge from bankruptcy with a deleveraged balance sheet and
ample liquidity to pursue operational and strategic initiatives 1 ~$11BDebt Reduction1 ~$1BAnnual Interest Expense Reduction1 9 Illustratively assumes $750M of takeback debt to Unsecured Bondholders at a 10% interest rate. Does not include
impact of any potential refinancingCourt approved confirmation on 8/21/20 subject to final documentation, which occurred on 8/27/20. Flexibility to Reinvest in Attractive New Initiatives Expeditious Bankruptcy Process ~$3.5B+Cumulative
capital investment opportunities identified ~60KFiber to the Home builds planned for 2020 and currently underway 75%Restructuring Support Agreement supported by over 75% of Bondholders Early 2021Expected Bankruptcy Emergence (6 state PUCs
have already approved) August21 Plan Confirmed2 ~3.0M+Copper homes can be upgraded to fiber at an attractive IRR

Operational Initiatives are on track to achieve roughly $125M of Adj EBITDA benefit in 2020, and on track
for $400 Million by 2022 Key Operational Milestones Jun. 2020: Launched fulsome enterprise managed security solution January 2020 March2020 April2020 May 2020 June 2020 August2020 Feb. 2020: Dropped Starz from video
offering Feb. 2020: Announced Mike Shippey as new Wholesale SVP Dec. 2019: Announced Bernie Han as new CEO Dec. 2019: Raised prices on premium channels Late 2019: Deployed 1G capability to over 97% of fiber homes Jan. – Apr. 2020: Hired 22
new enterprise “inside sales reps” Mar. 2020: Hired enterprise consultant Chris Ancell (former XO Comm. CEO) July2020 February 2020 Jun. 2020: Renegotiated HBO contract as part of video strategy Aug. 2020: As of August 25th, 44K brownfield
FTTH pilot homes released for construction Mar. – Apr. 2020: Transition to work from home (WFH) Apr. 2020: Resumed selling 500Mbps speeds, enabled by tech. solution Apr. 2020: Paused selling TV due to reevaluation of product offerings Apr.
2020: Instituted no home-entry policy for installs, limiting ability to sell 500Mbps & 1G speeds Apr. 2020: Hired SVP of Finance: Jim Stanley 2 Summary of Operational Improvements September2020 Product or Network Launch /
Upgrade Other Product-related Initiative Implemented New Hiring / Other Key Operational Milestone July 2020: Applied to participate in the Rural Digital Opportunity Fund (RDOF) auction Sept. 2020: Dropped FOX regional sports networks
from video offering May 2020: Resumed 1G installs, enabled by tech. solution May 2020: Launched engineering planning and prioritization process for 60k brownfield FTTH pilot build in 2020 Aug. 2020: Plan of Reorganization confirmed on August
21st 1 June 2019: Reconstituted the Board and Finance Committee 10 Court approved confirmation on 8/21/20 subject to final documentation, which occurred on 8/27/20.

Strengthening the Management Team 3 Frontier’s recent appointments of experienced telecom veterans
augment senior leadership team and leave us well-positioned to implement planned operational improvements Bernard L. Han, President & Chief Executive OfficerAppointed CEO in December 2019Previously an advisor to Frontier, beginning in
October 2019Over 30 years’ experience and significant operational and financial expertise, including 11 years in the telecommunications industry at DISH Network, where he served as Chief Financial Officer, Chief Operating Officer, and Executive
Vice President Mike Shippey, SVP of Wholesale ServicesJoined in February 2020Prior to Frontier, served as president of wholesale services at Windstream Holdings for four yearsBrings significant experience in the telecom industry, having held
executive level and other leadership positions at YMAX Communications, Covista Communications and Teleglobe Chris Ancell, Enterprise ConsultantJoined in March 2020Prior to Frontier, served as CEO of XO Communications, a telecom firm acquired
by Verizon in 2017 for $1.8bnPreviously spent 12 years in leadership roles at both CenturyLink and Qwest, including president of CenturyLink’s business markets organization and executive vice president of Qwest’s business markets
organization Jim Stanley, SVP of FinanceJoined in April 2020Over 30 years of experience in corporate finance, including time spent as the CFO of The NutraSweet Company, the Center for Diagnostic Imaging, and Meridian Behavioral Health 11

Strong Foundation 4 Significantly Deleveraged Capital Structure Numerous Expansion Opportunities
Identified, Which Could Generate Meaningful Cash Flow Significant Interest Expense Savings Create Optionality to Delever or Invest in Accretive Investment Opportunities Strategic Operational Initiatives Reduce Unprofitable Product Mix and
Enhance Unit Economics while Reducing Customer Churn and Rationalizing Costs Attractive Position in Key Geographic Markets Illustratively assumes $750M of takeback debt to Unsecured Bondholders at a 10% interest rate. Does not include impact
of any refinancingCalculated as projected debt at emergence divided by LTM Q2 ‘20 Adj. EBITDA pro forma for the Remaining PropertiesAnnual expected cash interest expense at emergence as compared to filing date capital structure Frontier is
well-positioned to capitalize on its incumbency and attractive market demographics 13%+ of copper footprint does not face cable competition Opportunities to invest in fiber upgrades in-footprint and bid on next-gen, fiber-based service
contracts could provide uplift to fiber availability 65%Reduced Churn at Expiration of Promo Pricing Since “Soft-Landing” Implementation ~70%Reduction in annual interest expense1, 3 Churn ReductionImproved Sales StrategyProcess
StreamliningProduct Portfolio ImprovementNew BuildsSolution Modernization Further potential to decrease cost of debt through opportunistic refinancing Applied to Participate in RDOF Auction 2.3x Net Leverage Ratio1, 2Projected at Emergence
Debt 12

2. Key Initiatives UpdateBernard L. Han,President and Chief Executive Officer

Transform the business from a provider of legacy telecom services over a primarily copper-based network
to a next generation broadband service provider with long-lived fiber-based infrastructureShift revenue base from predominantly legacy copper-based products to predominantly modern/next-gen fiber products by 2031Pursue a virtual separation of
state groupingsEnhance value of enterprise given increased fiber margin contribution of subscriber counts Frontier Strategic Vision Frontier Strategy Reconfigure Asset PortfolioSelectively and proactively identify and seek to
monetize states that may be less strategicIdentify potential alternative sources of funding and/or innovative capital structure optionsCarefully consider fixed / stranded costs and develop strategies to minimize these costs Maximize
Flexibility to Invest in Fiber and Growth Projects Opportunistically invest in fiber upgrades in-footprint, including consumer, SMB, enterprise, towers, and small cellsReset wholesale customer relationships and bid on next-gen, fiber-based
service contracts, including ethernet, Fiber to the Tower (FTTT), and small cell solutionsApplied to participate in RDOF Stabilize and Repair the Existing BusinessImplement initiatives to reduce churn and stop new sales of value destructive
products and bundlesRetain legacy voice and data customers, and support conversion to VoIP, UCaaS, and Ethernet as neededImprove customer experience and service quality to drive positive fiber broadband net addsGrow share where possible based
on network advantageContain costs, reconfigure staffing, and manage cash flow 14

Business Update Consumer customer churn of 1.63% for Remaining Properties, a sequential and YoY
improvementFourth consecutive quarter of positive fiber net adds and a YoY improvement in net losses in copper marketsSignificant repricing and reduction of video gross adds while still maintaining positive broadband net addsCommercial facing
COVID pressures in the area of broadband Key Q2 2020 Highlights $181M Adjusted EBITDA1Adjusted EBITDA of Remaining Properties of $703M $732M $1,131M Net sale proceeds from Northwest sale excluding amounts in escrowClosed sale of
operations and assets in four Northwest states on May 1, 2020 Net lossIncludes $176M of reorganization items and balance sheet restructuring costs, $136M loss on sale of Northwest Operations, and $56M pension settlement charge
15 $1,801M Total RevenueRevenue of Remaining Properties of $1,754M Consumer revenue of $874MCommercial revenue of $786M 1 Adjusted EBITDA is a non-GAAP measure. See page 32 and 33 for the reconciliation of Net Income (Loss) to Adjusted
EBITDA.

Frontier is transitioning to a more productive enterprise sales force focused on cultivating
relationships with our existing customer base and driving efficient sales of core strategic productsTotal ethernet circuit counts have been steadily increasing both pre and post COVID 16 Commercial Strategy: Sales & Account
Update Ethernet Internet Access (EIA):Net Adds and Beginning Units Restructure sales staffImprove engagement with existing customersCreate clear customer segmentation rules and align organizational structure with these segmentsImprove sales
proficiency and effectiveness around core productsImprove sales information and targeting Enterprise Priorities 1 2 3 4 5 Total Ethernet Circuits Net Adds

17 Wholesale Initiatives Update:Progress has been made on relationships with major customers with
positive customer feedbackProducts and systems are being enhanced to make Frontier more competitive and more reliable as a service partnerContinue to seek to invest capital in creating modern ethernet solutions for customers, both wireline and
wirelessProcesses for sales continue to be augmented to improve execution for all accounts, large and small Frontier continues to advance relationships with its wholesale customers, looking to create long-term value as a reliable partner for
modern ethernet and fiber-based services Wholesale: Initiatives Update

Network: Brownfield Pilot Update Currently in the build stage of the Brownfield fiber to the home
(“FTTH”) pilot, with penetration uptake to occur in future quartersBuilding up to 60K homes across six states for a total of $50M 18 June 30th August 25th Cumulative Homes Engineered / Released for Construction 18K 44K FTTH Build
Progress as of… Relevant Discussion Points Over 40k homes have been engineered as of August 25thTo date, all planning, permitting, construction, and training has been progressing without issue

Network: Brownfield FTTH Potential 19 Note: FTTH builds are staged through 2028 due to assumed capital
and labor constraints.Note: Not to scaleNote: Figures represent Brownfield FTTH opportunity only, does not include RDOF or other reinvestment opportunities Frontier has examined its entire footprint and developed an estimate of expected
Brownfield FTTH opportunity given different IRR thresholdsToday, Frontier passes roughly 3.0 million homes with fiber, or ~20% of the 14.0 million total homes served with broadband (BB)There are between 2.5 and 9.0 million incremental potential
homes passeddepending on target IRR thresholds 20% IRR Threshold 15% IRR Threshold 9% IRR Threshold 2.5-3.0M $1.5-$2.0B $0.5-$0.7B 5.5-6.0M $4.5-$5.0B $1.0-$1.5B 8.5-9.0M $8.5-$9.0B $1.5-$2.0B 15-20% Total Program
IRR 20-25% Total Program IRR 25-30% Total Program IRR 35-40% 60-65% 80-85% Potential Homes Passed 2031 Adj. EBITDA Uplift Initial Build Capex Projected % of BB Capable Homes Served with Fiber Potential Homes
Passed 2031 Adj. EBITDA Uplift Initial Build Capex % of BB HHs w/ Fiber
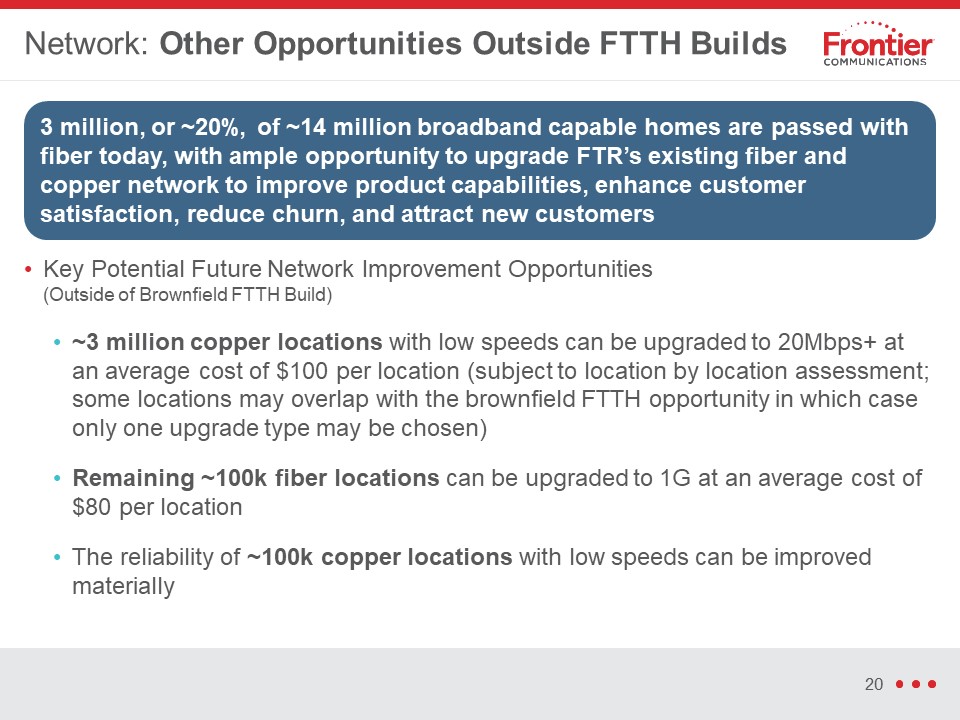
Key Potential Future Network Improvement Opportunities (Outside of Brownfield FTTH Build)~3 million
copper locations with low speeds can be upgraded to 20Mbps+ at an average cost of $100 per location (subject to location by location assessment; some locations may overlap with the brownfield FTTH opportunity in which case only one upgrade type
may be chosen)Remaining ~100k fiber locations can be upgraded to 1G at an average cost of $80 per locationThe reliability of ~100k copper locations with low speeds can be improved materially 3 million, or ~20%, of ~14 million broadband capable
homes are passed with fiber today, with ample opportunity to upgrade FTR’s existing fiber and copper network to improve product capabilities, enhance customer satisfaction, reduce churn, and attract new customers Network: Other Opportunities
Outside FTTH Builds 20

Product: Frontier Data-First Strategy To create long-term value and add profitable business, the focus
is on creating a higher performance, data-driven product suite and migrating away from legacy products and video Move Towards Profitable Data-Driven Strategy Transition Away from Legacy & Video Video / Triple Play Pivot away from video
and triple play sales due to low-margins and high customer acquisition costs Video market under intense competition from OTT players (demand for which bolsters broadband)Offer OTT TV services as an alternative to traditional video Manage Voice
Decline Manage TDM voice declinesDevelop more VoIP and UCaaS productsTreat as add-ons for data customers Network Upgrades 3 million copper homes can be upgraded to 20Mbps97% of fiber homes are 1G capable, with ~100K fiber locations that can
be upgraded from DSL speeds to 1GBrownfield FTTH Commercial & Wholesale Prioritize ethernet and strategic product salesRamp up enterprise sales and account management force with new structure 21 Products Simplify broadband product
offerings and packages
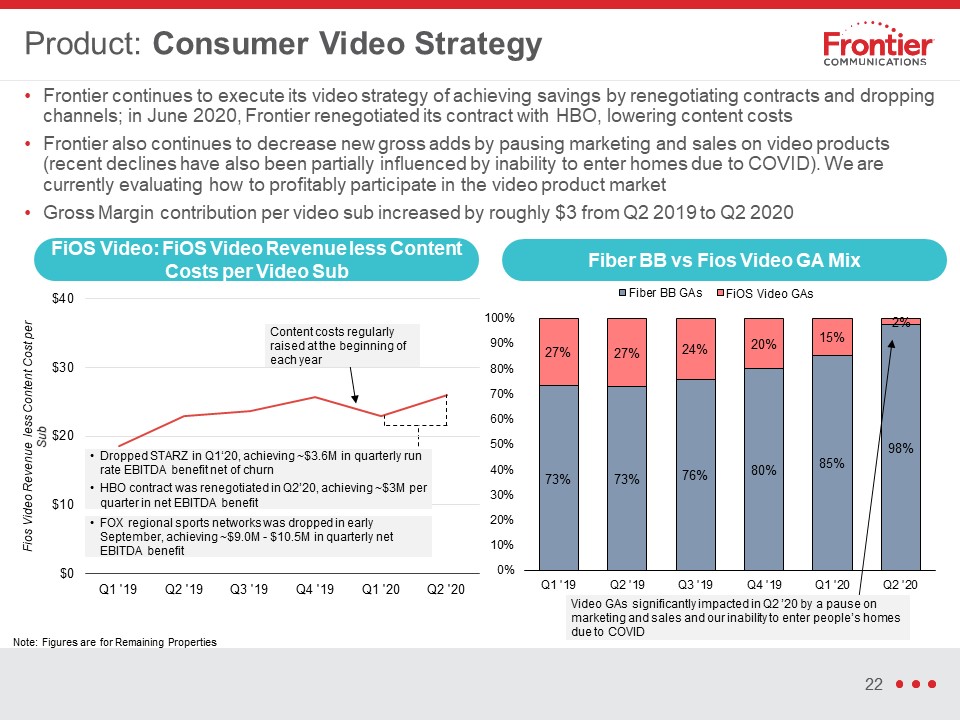
Frontier continues to execute its video strategy of achieving savings by renegotiating contracts and
dropping channels; in June 2020, Frontier renegotiated its contract with HBO, lowering content costsFrontier also continues to decrease new gross adds by pausing marketing and sales on video products (recent declines have also been partially
influenced by inability to enter homes due to COVID). We are currently evaluating how to profitably participate in the video product marketGross Margin contribution per video sub increased by roughly $3 from Q2 2019 to Q2 2020 Product:
Consumer Video Strategy FiOS Video: FiOS Video Revenue less Content Costs per Video Sub Fiber BB vs Fios Video GA Mix 22 Dropped STARZ in Q1‘20, achieving ~$3.6M in quarterly run rate EBITDA benefit net of churnHBO contract was renegotiated
in Q2’20, achieving ~$3M per quarter in net EBITDA benefit Content costs regularly raised at the beginning of each year Note: Figures are for Remaining Properties FOX regional sports networks was dropped in early September, achieving ~$9.0M
- $10.5M in quarterly net EBITDA benefit Video GAs significantly impacted in Q2 ’20 by a pause on marketing and sales and our inability to enter people’s homes due to COVID FiOS Video GAs

Customer Service / Churn: Fiber Broadband Net Adds Continued initiatives focused on soft-landing promo
roll-offs and customer service improvements continued to drive down churn in Q2 ‘20Frontier previously was unable to offer high speed packages to fiber customers for a period during COVID, but that has been resolved via a technology
solution Consumer Fiber Broadband Quarterly Net Adds 23 Consumer Fiber Broadband Avg. Monthly Churn Rate Churn reduction continued through Q2‘20, driven by soft-landing promo-roll offs, customer service improvements, and the impact
COVID-19 Note: Figures are for Remaining Properties Unable to offer 500Mbps and 1G installs for a period during Q2 ‘20, but this was fixed via a technology solution

COVID-19 Impact Update Operational Learnings and Facts to DateFrontier completed significant 1G fiber
upgrades without entering homes, allowing us to improve install efficiency moving forwardThe adjustment to WFH was seamless and appears to have improved productivity to date, translating into an improved customer experienceNon-PaysAfter peaking
in April during the height of COVID restrictions and various mandates, such as the FCC Keep America Connected pledge, levels of residential subscribers that are active but not paying have returned to pre-COVID levelsSmall and Medium Business
(SMB) non-pays similarly spiked in April – May, and have largely recovered in recent monthsBroadband InstallsWeekly average consumer fiber broadband installs bottomed out during April before rebounding to pre-COVID levelsWeekly average consumer
copper broadband installs remained flat through Q2 ’20Commercial installs declined more drastically than their consumer counterpart but are similarly returning to normal levelsBroadband ChurnConsumer broadband has been resilient through the
pandemicCommercial churn remained steady through March and April and has improved in recent months Key KPIs show COVID-19’s impact on FTR’s business has been relatively modest to date, with very minor non-payment impact and some improvements
in net adds during the pandemic 24

3. Quarterly Financial ResultsSheldon Bruha,Chief Financial Officer
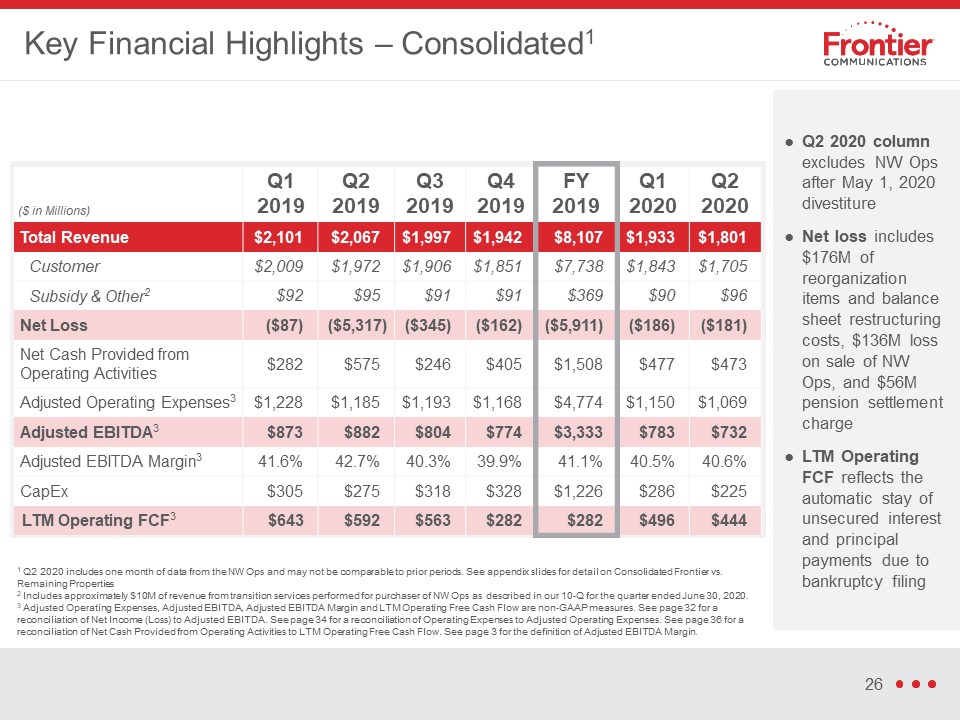
Key Financial Highlights – Consolidated1 ($ in Millions) Q12019 Q22019 Q32019 Q42019 FY
2019 Q1 2020 Q2 2020 Total Revenue $2,101 $2,067 $1,997 $1,942 $8,107 $1,933 $1,801 Customer $2,009 $1,972 $1,906 $1,851 $7,738 $1,843 $1,705 Subsidy & Other2 $92 $95 $91 $91 $369 $90 $96 Net
Loss ($87) ($5,317) ($345) ($162) ($5,911) ($186) ($181) Net Cash Provided from Operating Activities $282 $575 $246 $405 $1,508 $477 $473 Adjusted Operating
Expenses3 $1,228 $1,185 $1,193 $1,168 $4,774 $1,150 $1,069 Adjusted EBITDA3 $873 $882 $804 $774 $3,333 $783 $732 Adjusted EBITDA
Margin3 41.6% 42.7% 40.3% 39.9% 41.1% 40.5% 40.6% CapEx $305 $275 $318 $328 $1,226 $286 $225 LTM Operating FCF3 $643 $592 $563 $282 $282 $496 $444 Q2 2020 column excludes NW Ops after May 1, 2020 divestiture Net loss
includes $176M of reorganization items and balance sheet restructuring costs, $136M loss on sale of NW Ops, and $56M pension settlement charge LTM Operating FCF reflects the automatic stay of unsecured interest and principal payments due to
bankruptcy filing 1 Q2 2020 includes one month of data from the NW Ops and may not be comparable to prior periods. See appendix slides for detail on Consolidated Frontier vs. Remaining Properties 2 Includes approximately $10M of revenue from
transition services performed for purchaser of NW Ops as described in our 10-Q for the quarter ended June 30, 2020. 3 Adjusted Operating Expenses, Adjusted EBITDA, Adjusted EBITDA Margin and LTM Operating Free Cash Flow are non-GAAP measures.
See page 32 for a reconciliation of Net Income (Loss) to Adjusted EBITDA. See page 34 for a reconciliation of Operating Expenses to Adjusted Operating Expenses. See page 36 for a reconciliation of Net Cash Provided from Operating Activities to
LTM Operating Free Cash Flow. See page 3 for the definition of Adjusted EBITDA Margin. 26
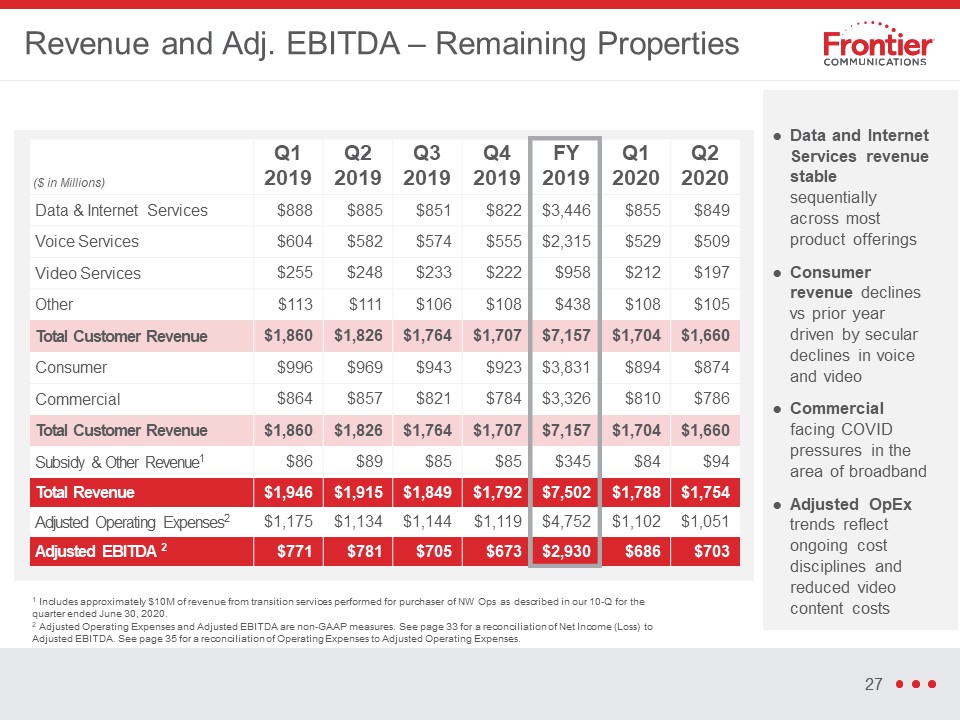
Revenue and Adj. EBITDA – Remaining Properties Data and Internet Services revenue stable
sequentially across most product offeringsConsumer revenue declines vs prior year driven by secular declines in voice and videoCommercial facing COVID pressures in the area of broadbandAdjusted OpEx trends reflect ongoing cost disciplines and
reduced video content costs ($ in Millions) Q12019 Q22019 Q32019 Q42019 FY 2019 Q1 2020 Q2 2020 Data & Internet Services $888 $885 $851 $822 $3,446 $855 $849 Voice
Services $604 $582 $574 $555 $2,315 $529 $509 Video Services $255 $248 $233 $222 $958 $212 $197 Other $113 $111 $106 $108 $438 $108 $105 Total Customer
Revenue $1,860 $1,826 $1,764 $1,707 $7,157 $1,704 $1,660 Consumer $996 $969 $943 $923 $3,831 $894 $874 Commercial $864 $857 $821 $784 $3,326 $810 $786 Total Customer
Revenue $1,860 $1,826 $1,764 $1,707 $7,157 $1,704 $1,660 Subsidy & Other Revenue1 $86 $89 $85 $85 $345 $84 $94 Total Revenue $1,946 $1,915 $1,849 $1,792 $7,502 $1,788 $1,754 Adjusted Operating
Expenses2 $1,175 $1,134 $1,144 $1,119 $4,752 $1,102 $1,051 Adjusted EBITDA 2 $771 $781 $705 $673 $2,930 $686 $703 27 1 Includes approximately $10M of revenue from transition services performed for purchaser of NW Ops as
described in our 10-Q for the quarter ended June 30, 2020. 2 Adjusted Operating Expenses and Adjusted EBITDA are non-GAAP measures. See page 33 for a reconciliation of Net Income (Loss) to Adjusted EBITDA. See page 35 for a reconciliation of
Operating Expenses to Adjusted Operating Expenses.
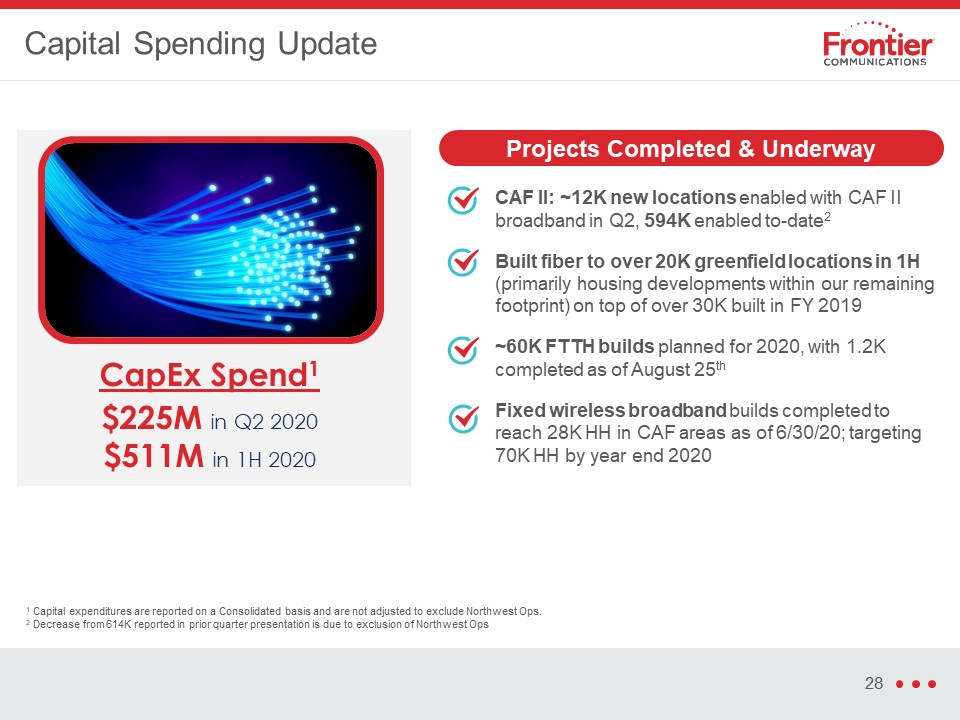
Capital Spending Update Projects Completed & Underway CAF II: ~12K new locations enabled with
CAF II broadband in Q2, 594K enabled to-date2 Built fiber to over 20K greenfield locations in 1H (primarily housing developments within our remaining footprint) on top of over 30K built in FY 2019 ~60K FTTH builds planned for 2020, with 1.2K
completed as of August 25th Fixed wireless broadband builds completed to reach 28K HH in CAF areas as of 6/30/20; targeting 70K HH by year end 2020 CapEx Spend1$225M in Q2 2020$511M in 1H 2020 28 1 Capital expenditures are
reported on a Consolidated basis and are not adjusted to exclude Northwest Ops.2 Decrease from 614K reported in prior quarter presentation is due to exclusion of Northwest Ops

1H’20 Actuals vs. Disclosure Statement – Remaining Properties Revenue $11M favorable to
Disclosure Statement, primarily driven by lower consumer churnAdj. Operating Expenses $4M favorable, primarily driven by lower Consumer add activity and favorable variable cost per customer ($ in Millions) 1H 2020 B/(W) vs. Disclosure
Statement1 Actuals Abs ($M) % Consumer $1,768 $11 0.6 Commercial $1,596 $2 0.1 Subsidy & Other Revenue2 $178 $(2) (1.1) Total Revenue $3,542 $11 0.3 Adj. Operating Expenses3 $2,153 $4 0.2 Adjusted
EBITDA3 $1,389 $15 1.1 29 1 Represents the 2020 Base Case as presented in our Disclosure Statement filed with the United States Bankruptcy Court for the Southern District of New York, Case No. 20-22476, on June 17, 2020.2 Includes
revenue from transition services performed for purchaser of NW Ops as described in our 10-Q for the quarter ended June 30, 2020.3 Adjusted Operating Expenses and Adjusted EBITDA are non-GAAP measures. See page 35 for a reconciliation of
Operating Expenses to Adjusted Operating Expenses, and page 33 for a reconciliation of net income (loss) to Adjusted EBITDA.

Pro Forma Capitalization Surplus Cash as defined in the Fifth Amended Plan of ReorganizationSubject to
court approvalIllustratively assumes $750M takeback debt at 10% interest rate. If 2L debt is reinstated, takeback debt required to be 3L. If 2L debt is repaid, takeback debt can be secured or unsecured, subject to agreement between the Company
and Consenting NoteholdersAdjusted EBITDA is pro forma for the Remaining Properties and excludes NW Ops. See page 33 for a reconciliation of net income (loss) to Adjusted EBITDA. 30 Plan of Reorganization - Key Transaction HighlightsBetween
now and emergence, use balance sheet cash to repay the prepetition Revolving Credit Facility (RCF) Equitize the Unsecured Notes; Unsecured Bondholders to receive up to $750M of takeback debtRemaining unrestricted cash above $150M to be
distributed to Unsecured Bondholders upon emergence, subject to the conditions of Surplus Cash (as defined in the Plan)1 Pro forma capital structure results in: Debt reduction of ~$11B3 Annual interest expense reduction of ~$1B3Pro forma
emergence net leverage of 2.3x (based on LTM Q2’20 Adj. EBITDA4) Further potential to decrease cost of debt through opportunistic refinancing

4. Appendix

($ in Millions) Q12019 Q22019 Q32019 Q42019 FY 2019 Q1 2020 Q22020 Net Income
(Loss) (87) (5,317) (345) (162) (5,911) (186) (181) Add back (Subtract): Income Tax Expense (Benefit) 18 (534) (21) (74) (611) (23) (57) Interest Expense 379 383 382 391 1,535 383 160 Investment and
Other (Income) Loss, Net 9 9 10 9 37 (5) 20 Pension Settlement Costs - - - 57 57 103 56 Loss on Extinguishment of Debt 20 - - - 20 - - Reorganization Items, Net - - - - - - 142 Operating Income
(Loss) 339 (5,459) 26 221 (4,873) 272 140 Depreciation and Amortization 484 454 422 420 1,780 415 397 EBITDA $823 ($5,005) $448 $641 ($3,093) $687 $537 Add back: Pension/OPEB
Expense 20 19 20 19 78 23 23 Restructuring Costs and Other Charges 28 31 27 82 168 48 36 Stock-based Compensation Expense 3 4 3 5 15 1 1 Storm Related Insurance Proceeds (1) - - (5) (6) - (1) Loss on disposal
of Northwest Operations - 384 30 32 446 24 136 Goodwill Impairment - 5,449 276 - 5,725 - - Adjusted EBITDA $873 $882 $804 $774 $3,333 $783 $732 EBITDA
Margin 39.1% (242.1)% 22.4% 33.0% (38.2)% 35.6% 29.8% Adjusted EBITDA Margin 41.6% 42.7% 40.3% 39.9% 41.1% 40.5% 40.6% Non-GAAP Financial Measures - Consolidated 32

($ in Millions) Q12019 Q22019 Q32019 Q42019 FY 2019 Q1 2020 Q22020 Net Income
(Loss) (153) (5,392) (444) (263) (6,252) (283) (210) Add back (Subtract): Income Tax Expense (Benefit) 18 (534) (21) (74) (611) (23) (57) Interest Expense 379 383 382 391 1,535 383 160 Investment and
Other (Income) Loss, Net 9 9 10 9 37 (5) 20 Pension Settlement Costs - - - 57 57 103 56 Loss on Extinguishment of Debt 20 - - - 20 - - Reorganization Items, Net - - - - - - 142 Operating Income
(Loss) 273 (5,534) (73) 120 (5,214) 175 111 Depreciation and Amortization 449 429 422 420 1,720 415 397 EBITDA $722 ($5,105) $349 $540 ($3,494) $590 $508 Add back: Pension/OPEB
Expense 20 19 20 19 78 23 23 Restructuring Costs and Other Charges 27 30 27 82 166 48 36 Stock-based Compensation Expense 3 4 3 5 15 1 1 Storm Related Insurance Proceeds (1) - - (5) (6) - (1) Loss on disposal
of Northwest Operations - 384 30 32 446 24 136 Goodwill Impairment - 5,449 276 - 5,725 - - Adjusted EBITDA $771 $781 $705 $673 $2,930 $686 $703 EBITDA
Margin 37.1% (266.6)% 18.9% 30.1% (46.6)% 33.0% 29.0% Adjusted EBITDA Margin 39.6% 40.8% 38.1% 37.6% 39.1% 38.4% 40.1% Non-GAAP Financial Measures – Remaining Properties1 33 For a reconciliation of the Remaining Properties
Non-GAAP Financial Measures to the to the Consolidated Non-GAAP Financial Measures see Frontier’s Form 8-K containing supplemental financial information filed on August 7, 2020.

Non-GAAP Financial Measures – Consolidated ($ in Millions) Q12019 Q2
2019 Q32019 Q42019 FY2019 Q1 2020 Q2 2020 Total Operating Expenses $1,762 $7,526 $1,971 $1,721 $12,980 $1,661 $1,661 Subtract: Depreciation and Amortization 484 454 422 420 1,780 415 397 Goodwill
Impairment - 5,449 276 - 5,725 - - Loss on disposal of Northwest Operations - 384 30 32 446 24 136 Pension/OPEB Expense 20 19 20 19 78 23 23 Restructuring Costs and Other Charges 28 31 27 82 168 48 36
Stock-based Compensation Expense 3 4 3 5 15 1 1 Storm Related Insurance Proceeds (1) - - (5) (6) - (1) Adjusted Operating Expenses $1,228 $1,185 $1,193 $1,168 $4,774 $1,150 $1,069 34
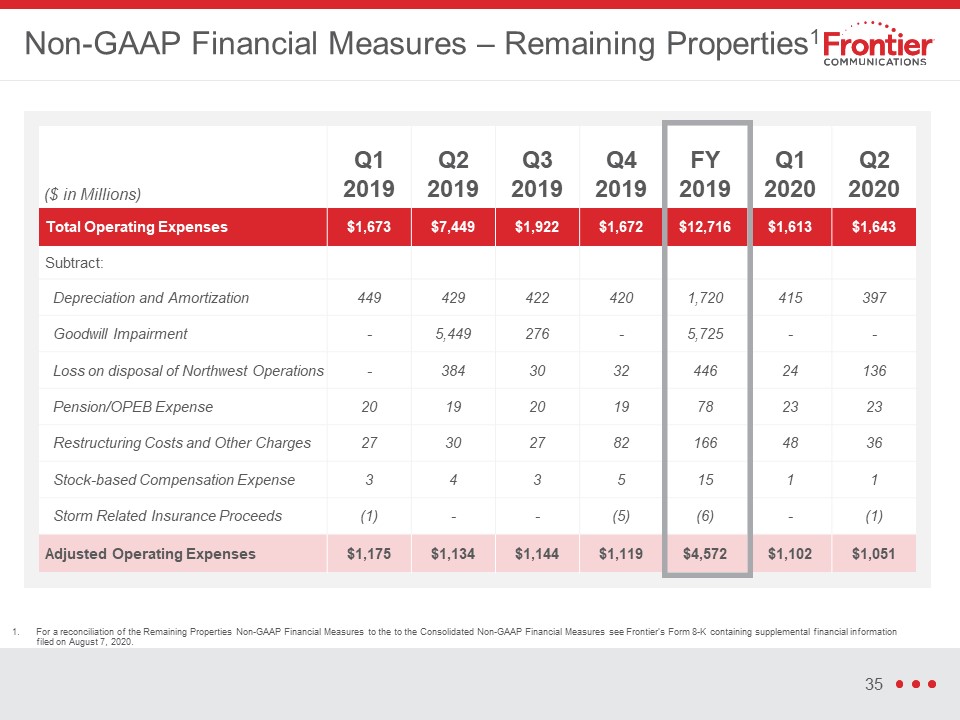
Non-GAAP Financial Measures – Remaining Properties1 ($ in Millions) Q12019 Q2
2019 Q32019 Q42019 FY2019 Q1 2020 Q2 2020 Total Operating Expenses $1,673 $7,449 $1,922 $1,672 $12,716 $1,613 $1,643 Subtract: Depreciation and Amortization 449 429 422 420 1,720 415 397 Goodwill
Impairment - 5,449 276 - 5,725 - - Loss on disposal of Northwest Operations - 384 30 32 446 24 136 Pension/OPEB Expense 20 19 20 19 78 23 23 Restructuring Costs and Other Charges 27 30 27 82 166 48 36
Stock-based Compensation Expense 3 4 3 5 15 1 1 Storm Related Insurance Proceeds (1) - - (5) (6) - (1) Adjusted Operating Expenses $1,175 $1,134 $1,144 $1,119 $4,572 $1,102 $1,051 35 For a reconciliation of the
Remaining Properties Non-GAAP Financial Measures to the to the Consolidated Non-GAAP Financial Measures see Frontier’s Form 8-K containing supplemental financial information filed on August 7, 2020.

Non-GAAP Financial Measures – Consolidated Quarterly Results ($ in
Millions) Q12019 Q22019 Q32019 Q42019 FY2019 Q12020 Q22020 Net Cash Provided from Operating Activities $282 $575 $246 $405 $1,508 $477 $473 Capital Expenditures (305) (275) (318) (328) (1,226) (286) (225) Operating
Free Cash Flow ($23) $300 ($72) $77 $282 $191 $248 Trailing Four Quarter Results ($ in Millions) Q12019 Q22019 Q32019 Q42019 Q1 2020 Q2 2020 Net Cash Provided from Operating
Activities $1,843 $1,746 $1,706 $1,508 $1,703 $1,601 Capital Expenditures (1,200) (1,154) (1,143) (1,226) (1,207) (1,157) Operating Free Cash Flow $643 $592 $563 $282 $496 $444 36

Consumer Unit Trends – Remaining Properties v Video net losses reflect a deemphasis on triple play
products and secular shifts to OTT Consumer Copper Broadband Consumer Fiber Broadband Consumer Video excl. Dish Net Adds (000s) Q1 Q2 2019 Q4 Q2 Q3 2020 37 Q1 Continued positive fiber net
adds reflects introduction of 1 Gig offering in Q4 2019 and improved churn management Copper trends improving YoY and sequentially driven by lower customer churn and stability in gross adds

Customer Churn Trends – Remaining Properties Continued lower churn in both Fiber and Copper markets
2019 Q2 churn lower sequentially and YoY reflect in part the benefit from lower market activity in COVID environment 2020 38 Q1 Q3 Q2 Q4 Q2 Q1

Consumer ARPC – Remaining Properties Consumer Customers ARPC Q2 2020
Consumer ARPC sequential decrease driven by video losses 2019 Q1 Q3 Q2 Q4 Q1 2020 39 3.6M 3.6M 3.5M 3.4M 3.4M 3.3M Q2