Attached files
| file | filename |
|---|---|
| 8-K - FORM 8-K - ProSight Global, Inc. | tm2030096d1_8k.htm |
Exhibit 99.1

Investor Presentation Second Quarter 2020

2 Table of Contents I believe our niche strategy, exclusive distribution arrangements, and careful exposure management will leave us well - positioned for profitable growth exiting 2020. Larry Hannon, CEO & President 03 Summary Information 04 The ProSight Story 08 Business Execution 17 Balance Sheet Highlights 21 Appendix
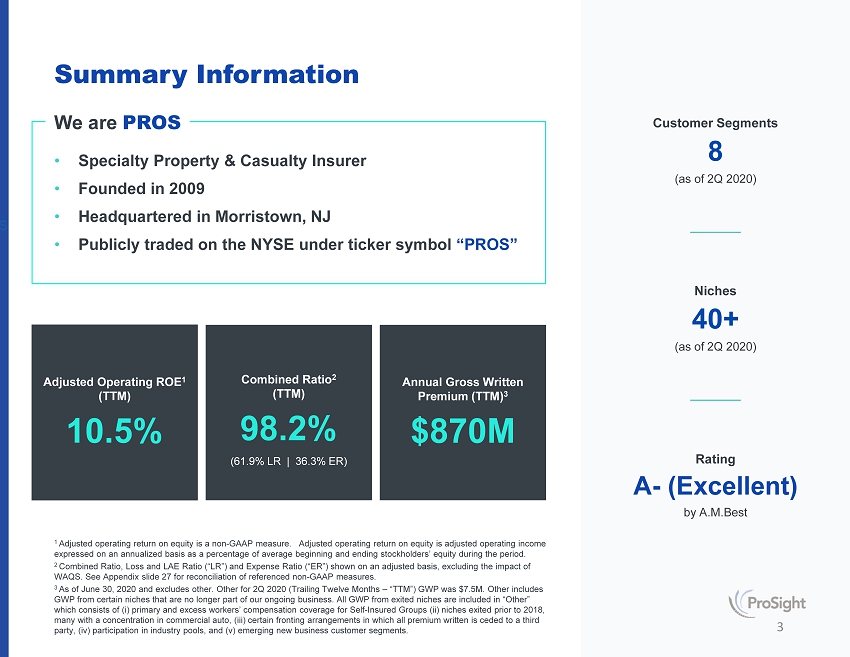
3 Summary Information 1 Adjusted operating return on equity is a non - GAAP measure. Adjusted operating return on equity is adjusted operating income expressed on an annualized basis as a percentage of average beginning and ending stockholders’ equity during the period. 2 Combined Ratio, Loss and LAE Ratio (“LR”) and Expense Ratio (“ER”) shown on an adjusted basis, excluding the impact of WAQS. See Appendix slide 27 for reconciliation of referenced non - GAAP measures. 3 As of June 30, 2020 and excludes other. Other for 2Q 2020 (Trailing Twelve Months – “TTM”) GWP was $7.5M. Other includes GWP from certain niches that are no longer part of our ongoing business. All GWP from exited niches are included in “Other” which consists of ( i ) primary and excess workers’ compensation coverage for Self - Insured Groups (ii) niches exited prior to 2018, many with a concentration in commercial auto, (iii) certain fronting arrangements in which all premium written is ceded to a thi rd party, (iv) participation in industry pools, and (v) emerging new business customer segments. Rating A - (Excellent) by A.M.Best Niches 40+ (as of 2Q 2020) Customer Segments 8 (as of 2Q 2020) • Specialty Property & Casualty Insurer • Founded in 2009 • Headquartered in Morristown, NJ • Publicly traded on the NYSE under ticker symbol “PROS” We are PROS Adjusted Operating ROE 1 (TTM) 10.5% Combined Ratio 2 (TTM) 98.2% (61.9% LR | 36.3% ER) Annual Gross Written Premium (TTM) 3 $870M

The ProSight Story Who we are, where we’ve been, and how we make a difference
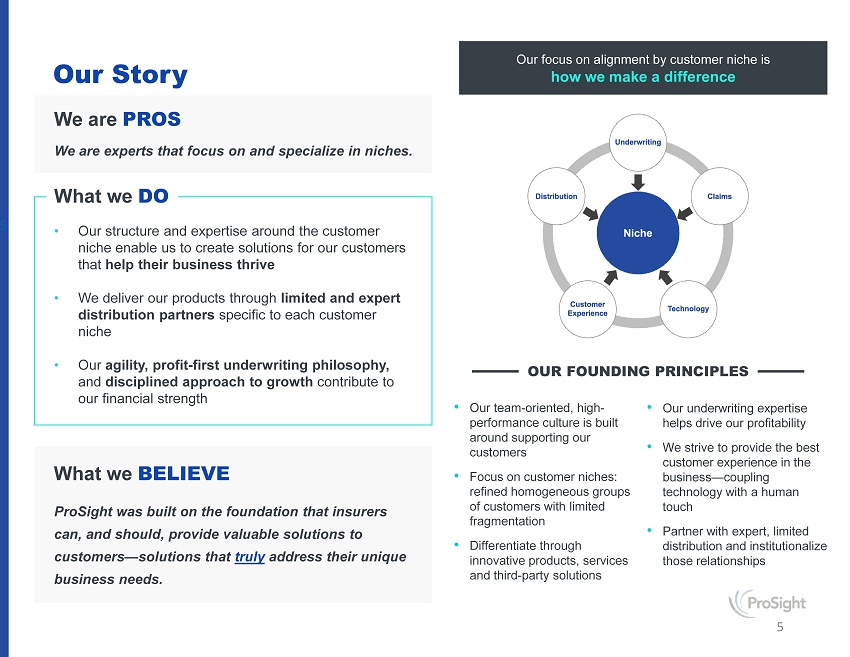
5 We are experts that focus on and specialize in niches. Our focus on alignment by customer niche is how we make a difference • Our team - oriented, high - performance culture is built around supporting our customers • Focus on customer niches: refined homogeneous groups of customers with limited fragmentation • Differentiate through innovative products, services and third - party solutions • Our underwriting expertise helps drive our profitability • We strive to provide the best customer experience in the business — coupling technology with a human touch • Partner with expert, limited distribution and institutionalize those relationships OUR FOUNDING PRINCIPLES ProSight was built on the foundation that insurers can, and should, provide valuable solutions to customers — solutions that truly address their unique business needs. What we BELIEVE • Our structure and expertise around the customer niche enable us to create solutions for our customers that help their business thrive • We deliver our products through limited and expert distribution partners specific to each customer niche • Our agility, profit - first underwriting philosophy, and disciplined approach to growth contribute to our financial strength What we DO We are PROS Our Story

6 Our Executive Team A leadership team with deep expertise built from decades of experience.
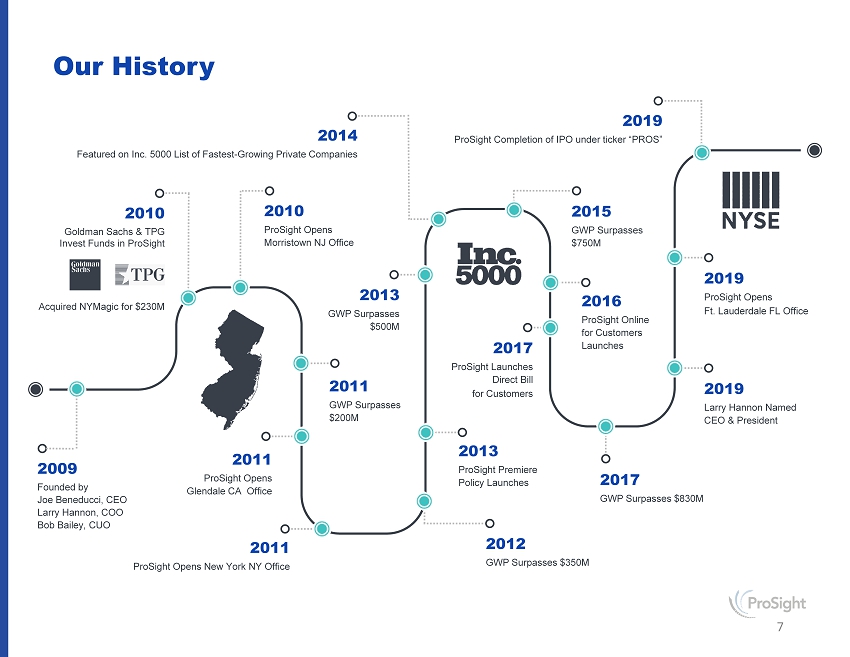
7 Our History 2009 Founded by Joe Beneducci, CEO Larry Hannon, COO Bob Bailey, CUO 2010 Goldman Sachs & TPG Invest Funds in ProSight Acquired NYMagic for $230M 2011 GWP Surpasses $200M 2011 ProSight Opens Glendale CA Office 2013 GWP Surpasses $500M 2014 Featured on Inc. 5000 List of Fastest - Growing Private Companies 2015 GWP Surpasses $750M 2017 GWP Surpasses $830M 2019 Larry Hannon Named CEO & President 2010 ProSight Opens Morristown NJ Office 2016 ProSight Online for Customers Launches 2017 ProSight Launches Direct Bill for Customers 2013 ProSight Premiere Policy Launches 2019 ProSight Completion of IPO under ticker “PROS” 2019 ProSight Opens Ft. Lauderdale FL Office 2011 ProSight Opens New York NY Office 2012 GWP Surpasses $350M

Business Execution Designed around the customer to deliver results

9 GWP: $870M 2 (trailing twelve months) Niche - Focused Specialty Insurer Diversified portfolio with 8 customer segments and over 40 specialty niches 1 . 1 As of June 30, 2020. 2 Excludes other. Other 2Q 2020 (TTM) GWP was $7.5M. 3 New niches added within preceding 4 quarters. Media & Entertainment $111 Million o Film o Live Entertainment Marine & Energy $109 Million o Marine & Excess Energy o Solar Contractors o Oil Field Contractors o Propane & Fuel Dealers Transportation $71 Million o Charter Bus o School Bus o Intermodal Transportation o Taxis Sports $30 Million o Motor Sports o Sports o Country Clubs o Aquatic Recreation Real Estate $173 Million o Builders Risk o Hotels o MetroBuilders o Residential o Manufactured Housing o Property Managers o Self Storage (NEW) 3 Professional Services $122 Million o Accountants o Credit Unions o Customs Brokers o Lawyers o Pest Control Construction $114 Million o Cranes o Scaffolding o Marine Contractors o Construction Managers o Federal Contractors o Luxury Home Builders o Specialty Trade Contractors Consumer Services $140 Million o Auto Dealers o Franchise Equipment Dealers o Professional Employer Organizations o Funeral Directors (NEW) 3 o Social Services o Parking Facilities o Snow & Ice Mgmt (NEW) 3 o Animal Welfare (NEW) 3
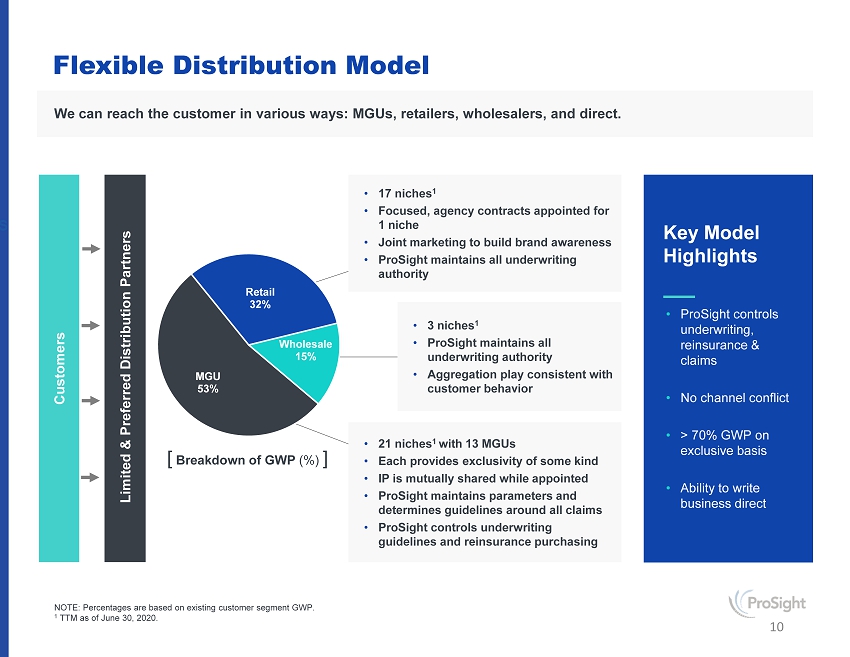
• 17 niches 1 • Focused, agency contracts appointed for 1 niche • Joint marketing to build brand awareness • ProSight maintains all underwriting authority • 3 niches 1 • ProSight maintains all underwriting authority • Aggregation play consistent with customer behavior • 21 niches 1 with 13 MGUs • Each provides exclusivity of some kind • IP is mutually shared while appointed • ProSight maintains parameters and determines guidelines around all claims • ProSight controls underwriting guidelines and reinsurance purchasing Retail 32% Wholesale 15% MGU 53% 10 Flexible Distribution Model NOTE: Percentages are based on existing customer segment GWP. 1 TTM as of June 30, 2020. We can reach the customer in various ways: MGUs, retailers, wholesalers, and direct. Customers Limited & Preferred Distribution Partners • ProSight controls underwriting, reinsurance & claims • No channel conflict • > 70% GWP on exclusive basis • Ability to write business direct Key Model Highlights [ Breakdown of GWP (%) ]

11 Careful Exposure Management • Publicly Traded D&O • Medical Malpractice • Mortgage Insurance • Accident & Health • Travel Insurance We do not write • Event Cancellation • Opioid Manufacturers or Distributors • Personal Lines • Hospitals • Nursing Homes Workers’ comp book has minimal exposure to healthcare and first responders. “Each of our niches is run like a single purpose underwriting organization working through a dedicated and limited distribution partnership, such that we see market dynamics very clearly and very differently through that lens." — Bob Bailey, Chief Underwriting & Risk Officer 1 Policy information as of June 30, 2020 data. Excludes workers’ comp and surety. Policies with gross limits of $2M or less 84% 1
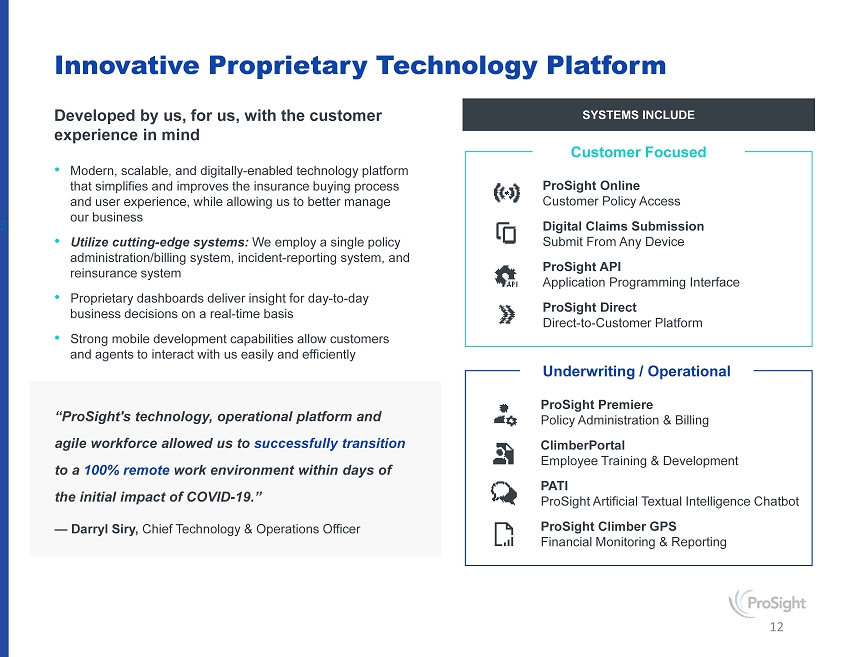
SYSTEMS INCLUDE 12 Innovative Proprietary Technology Platform Developed by us, for us, with the customer experience in mind • Modern, scalable, and digitally - enabled technology platform that simplifies and improves the insurance buying process and user experience, while allowing us to better manage our business • Utilize cutting - edge systems: We employ a single policy administration/billing system, incident - reporting system, and reinsurance system • Proprietary dashboards deliver insight for day - to - day business decisions on a real - time basis • Strong mobile development capabilities allow customers and agents to interact with us easily and efficiently Customer Focused ProSight Online Customer Policy Access Digital Claims Submission Submit From Any Device ProSight API Application Programming Interface ProSight Direct Direct - to - Customer Platform Underwriting / Operational ProSight Premiere Policy Administration & Billing ClimberPortal Employee Training & Development PATI ProSight Artificial Textual Intelligence Chatbot ProSight Climber GPS Financial Monitoring & Reporting “ProSight's technology, operational platform and agile workforce allowed us to successfully transition to a 100% remote work environment within days of the initial impact of COVID - 19.” — Darryl Siry, Chief Technology & Operations Officer

13 “We constantly evaluate our underwriting portfolio to ensure it is best positioned for long - term profitability.” — Larry Hannon, CEO & President

61.7% 62.0% 62.5% 61.8% 6M19 6M20 14 Profitable Underwriting & Low Volatility • Inception - to - date (2011 to 2020) GAAP loss ratio of 63.6% for all business and 61.4% for existing customer segments • Selective entry (and exit) of niches part of our underwriting strategy • Low catastrophe exposure — since 2011, catastrophic losses 1 have averaged less than 1.0 point on combined ratio. • ProSight expects 200 basis points of expense ratio improvement from 2019 (36.6%) by YE 2022 1 Catastrophe losses and LAE are any one claim, or group of claims, equal or greater than $1M related to a single PCS® designat ed catastrophe event. 2 Expense ratio shown is Adjusted Expense Ratio. See “Factors Affecting our Results of Operations (WAQS)” in the Appendix. Effe cti ve January 1, 2020, the WAQS was commuted and there is no further impact to the expense ratio. 3 GWP shown as TTM. NOTE: Loss Ratios as presented, adjusted for Whole Account Quota Share, except where otherwise noted. See “Factors Affecting our Results of Operations (WAQS)” in the Appendix. General Liability 32% Commercial Auto 22% Primary Workers Comp 13% Misc. Lines 8% Property 14% Prof. Liability 5% Umbrella 6% Diversified by Line of Business 3 86% 14% 78% 22% - Casualty 3 - Property 3 - Admitted 3 - Non - Admitted (E&S) 3 Expense Ratio 2 34.9% 37.0% 36.6% 2017 2018 2019 Loss Ratio 6M19 6M20 Calendar Year Loss Ratio Accident Year Loss Ratio Catastrophic Loss 63.9% 59.6% 61.4% 61.0% 60.3% 61.6% 2017 2018 2019 1.3% 0.5% 0.4% 0.8% 0.9% 37.1% 36.7%

$73.4 $101.9 $118.0 $94.4 $107.1 $133.7 $79.3 $83.1 $94.7 $114.4 $119.9 $125.0 $112.6 $110.5 $119.3 $132.0 $132.7 $167.6 $22.2 $23.6 $30.0 $ 85.1 $ 92.2 $ 112.1 2017 2018 2019 Transportation Sports Real Estate Professional Services Media and Entertainment Marine and Energy Consumer Services Construction $713.4M 1 $771.0M 1 15 Focus on Profitable Growth 1 Existing customer segment only; actual GWP are $836M for 2017, $895M for 2018, and $968m for 2019; $491m for 2Q19 and $400m f or 2Q20. 2 CAGR for actual GWP from 2017 to 2019 is 7.6%. Contraction for actual GWP 6M2019 to 6M2020 is (18.5%). 3 Excluding Transportation and Media and Entertainment customer segments (niches heavily impacted by COVID - 19), GWP growth YOY was 7.7%. Future growth within any niche or customer segment considers profitability first . ProSight employs a rigorous process to identify if/when growth is justified and react quickly once a decision is made. Growth in Existing Niches New Customer Segments New Niches in Existing Customer Segments WE GROW IN THREE WAYS: Existing Customer Segments Only $900.4M 1 $55.8 $52.2 $65.4 $71.3 $45.5 $59.6 $62.1 $47.9 $58.7 $61.6 $75.3 $80.5 $14.7 $14.3 $ 49.7 $ 9.1 6M19 6M20 $427.2M 1 $396.5M 1

Balance Sheet Highlights

17 Diversified & Liquid Investment Portfolio • $2.3 billion conservatively managed investment portfolio • No common stocks, private equity, CLO equity or venture capital • CLO and CMBS allocation average rating AA with no securities below single A • 63% of Not Rated fixed maturity securities are considered investment grade by the NAIC • Floating rate allocation 16% • Trailing Twelve Months (TTM) investment yield of 3.1% • Portfolio duration of 4.5 years vs. loss reserve duration of 5.0 years Fixed Maturity Securities 92.9% Limited Partnerships and LLCs 3.4% Cash, Cash Equivalents & Short - term Investments 2.6% Commercial Levered Loans 0.5% Non - redeemable Preferred Stock Securities 0.5% Corporate Securities 62.5% RMBS 12.0% CLO 7.8% CMBS 4.8% Municipals 7.6% ABS 2.3% U.S. Gov't & Gov't Agency 3.1% A 31.6% AA 22.8% AAA 9.5% Not Rated 3.1% Below BBB 6.7% BBB 26.3% 36.2 56.0 68.9 2017 2018 2019 NOTE: All financial information as of June 30, 2020, unless otherwise noted. Maximizing investment income while minimizing volatility Net Investment Income ($ in millions) Investment Portfolio Composition Fixed Maturity Securities (by type) Fixed Maturity Securities (by rating) NOTE: ProSight engages leading 3rd Party investment managers to assist with managing the portfolio. 6M19 6M20 34.6 32.6

0.8% 0.5% 0.2% 2.4% - 1.9% 0.0% - 0.1% - 0.1% 3Q18 4Q18 1Q19 2Q19 3Q19 4Q19 1Q20 2Q20 39% 14% 23% 2% 4% 6% 12% General Liability Commercial Auto Excess WC Property Misc Lines Prof Liability Primary WC 18 Prudent Loss Reserve Position Sound loss reserve position • Total net loss reserves of $1.4 billion • Exited niches excluding Excess Workers’ Compensation business ($25.6M of net loss reserves) and A&E exposures ($12.8M of net loss reserves) are 1.8% and 0.9%, of total net loss reserves, respectively. • Duration of loss reserves: 5.0 years Net Loss Reserves by Line of Business (%) Net Reserve Development Trailing 8 Quarters (cumulative 0.2% favorable) NOTE: All financial information as of June 30, 2020, unless otherwise noted. ** The ratio above represents development [fav/(unfav)] over NEP for the quarter We do NOT write: 1) Publicly Traded D&O 2) Medical Malpractice 3) Opioid Manufacturers or Distributors 4) Hospitals & Nursing Homes

19 Sustainable shareholder value creation over long term • Consistent Underwriting Profitability leads to strong tangible book value per share growth Underwriting Results Combined Ratio (%) Book Value & Tangible Book Value Per Fully Diluted Share NOTE: All financial information as of June 30, 2020, unless otherwise noted. $8.79 $9.14 $11.37 $12.21 $9.53 $9.88 $12.01 $12.84 $- $2.00 $4.00 $6.00 $8.00 $10.00 $12.00 $14.00 2017 2018 2019 6M20 Tangible Book Value per Fully Diluted Share Book Value per Fully Diluted Share 64.6% 59.5% 62.0% 62.0% 35.1% 37.2% 36.0% 36.7% 0.0% 10.0% 20.0% 30.0% 40.0% 50.0% 60.0% 70.0% 80.0% 90.0% 100.0% 2017 2018 2019 6M 2020 Loss Ratio Expense Ratio 99.7 % 96.7 % 98.0 % 98.7 % Profitable Underwriting and Book Value Growth

20 Disclaimer Important Notice This presentation contains forward - looking statements. Forward - looking statements include statements relating to future developm ents in our business or expectations for our future financial performance and any statement not involving a historical fact. Forward - looking statements use words such as “anticipate,” “believe,” “estimate,” “expect,” “intend,” “plan,” “should,” “seek,” and other words and term s o f similar meaning. Forward - looking statements are subject to known and unknown risks and uncertainties, many of which may be beyond our c ontrol. We caution you that forward - looking statements are not guarantees of future performance or outcomes and that actual performance and outcomes may differ materially from those made in or suggested by the forward - looking statements contained in this presentation. In addition, even if our results of operations, financial condition and cash flows, and the development of the market in which we operate, ar e consistent with the forward - looking statements contained in this presentation, those results or developments may not be indicative of resul ts or developments in subsequent periods. New factors emerge from time to time that may cause our business not to develop as we exp ect , and it is not possible for us to predict all of them. For a discussion of some of the risks and important factors that could affect ou r future results and financial conditions, see our filings with the U.S. Securities and Exchange Commission, including, but not limited to, the ri sks and uncertainties included under the caption “Risk Factors”. Except as required by law, we undertake no obligation to publicly u pda te any forward - looking statements, whether as a result of new information, future events or otherwise. Presentation of Financial Information This presentation includes certain “non - GAAP” financial measures that either exclude or include amounts that are not excluded or included in the most directly comparable measures calculated and presented in accordance with generally accepted accounting principles in th e United States (“GAAP”). The non - GAAP financial measures used in this presentation are adjusted operating income, adjusted operating ret urn on equity, and adjusted loss ratio. These non - GAAP financial measures should not be considered in isolation or viewed as a substit ute for their most directly comparable GAAP figures. Other companies may calculate such non - GAAP financial measures differently. Accordingly, these measures may not be comparable to similarly titled measures of other companies. See the Appendix for a reconciliation of thes e n on - GAAP financial measures to the most comparable GAAP figures.

Appendix 2Q 2020

22 Contacts Corporate Headquarters 412 Mt. Kemble Avenue, Suite 300C Morristown, NJ 07960 973 - 532 - 1900 Investor Relations Jeff Arricale 973 - 532 - 1710 jarricale@prosightspecialty.com Media & Public Relations Joe Hathaway 973 - 532 - 1706 jhathaway@prosightspecialty.com

June 30 ($ in thousands, except share amounts) 2020 2019 2018 2017 2016 Assets (as restated) (as restated) (as restated) Investments: Fixed maturity securities, available-for-sale at fair value 2,162,780$ 2,040,682$ 1,693,382$ 1,484,431$ 1,222,234$ Commercial levered loans at amortized cost 13,463 14,069 16,915 24,500 29,834 Non-redeemable preferred stock securities at fair value 11,785 – – – – Limited partnerships and limited liability companies at fair value 79,717 66,660 53,432 41,603 33,383 Short-term investments 496 43,873 36,661 4,223 44,922 Total investments 2,268,241 2,165,284 1,800,390 1,554,757 1,330,373 Cash and cash equivalents 50,637 17,284 22,279 59,397 75,211 Restricted cash 9,966 10,213 7,621 18,475 – Accrued investment income 14,119 13,610 12,279 9,409 5,353 Premiums and other receivables, net 143,519 190,004 200,347 184,334 168,378 Receivable from reinsurers on paid losses, net 2,497 3,481 12,428 17,220 28,876 Reinsurance receivables on unpaid losses, net 141,427 193,952 185,295 201,156 176,651 Deferred policy acquisition costs 94,587 98,812 93,613 60,759 76,572 Prepaid reinsurance premiums 47,837 42,861 44,626 122,950 30,896 Net deferred income taxes – 4,803 33,239 37,068 76,784 Goodwill and net intangible assets 29,174 29,189 29,219 29,249 29,745 Fixed assets and capitalized software, net 35,630 37,167 39,001 37,834 33,068 Funds withheld related to sale of affiliate 19,529 19,453 19,397 26,988 – Other assets 34,218 29,537 57,653 37,159 24,765 Assets of discontinued operations 23,171 21,584 19,719 12,697 194,831 Total assets 2,914,552$ 2,877,234$ 2,577,106$ 2,409,452$ 2,251,503$ Liabilities Reserve for unpaid losses and loss adjustment expenses 1,544,123$ 1,521,648$ 1,396,812$ 1,258,237$ 1,166,619$ Reserve for unearned premiums 450,934 483,223 435,933 395,432 354,828 Ceded reinsurance payable 20,324 17,768 13,281 18,448 2,816 Notes payable, net of debt issuance costs 164,862 164,693 182,355 164,017 163,678 Secured loan payable, net of issuance costs 24,997 – – – – Funds held under reinsurance agreements 22,858 58,855 63,165 112,260 20,589 Net deferred income taxes 75 – – – – Other liabilities 66,762 56,438 73,474 71,014 21,522 Liabilities of discontinued operations 33,517 31,578 22,256 14,061 140,796 Total liabilities 2,328,452 2,334,203 2,187,276 2,033,469 1,870,848 Stockholders’ equity Preferred stock, $0.01 par value – – – – – Common stock, $0.01 par value 433 431 389 387 355 Paid-in capital 664,895 661,761 607,260 606,346 555,289 Accumulated other comprehensive income (loss) 52,756 37,453 (22,315) 19,297 29,482 Retained deficit (131,784) (156,414) (195,304) (249,847) (204,271) Treasury shares - at cost (12,920 shares) (200) (200) (200) (200) (200) Total stockholders’ equity 586,100 543,031 389,830 375,983 380,655 Total liabilities and stockholders’ equity 2,914,552$ 2,877,234$ 2,577,106$ 2,409,452$ 2,251,503$ Statutory surplus 661,314$ 568,777$ 473,575$ 433,946$ 355,366$ December 31 23 Balance Sheet Note: For informational purposes only and should be read in conjunction with documents filed by ProSight Global, Inc. with the Securities and Exchange Commission, including the most recent prospectus on Form S - 1, Quarterly Reports on Form 10 - Q, and Annual Reports on Form 10 - K. Unaudited

Trailing Twelve Months Ended June 30 ($ in thousands) 2020 2020 2019 2020 2019 2020 2019 2019 2018 2017 Revenues: Net earned premiums 797,057$ 387,291$ 398,088$ 181,629$ 202,480$ 205,662$ 195,608$ 807,854$ 730,785$ 609,786$ Net investment income 66,947 32,606 34,556 23,791 17,398 8,815 17,158 68,897 55,971 36,196 Realized investment gains (losses), net 2,643 2,123 250 1,891 137 232 113 770 (1,557) 4,204 Other income, net 561 213 190 101 97 112 93 538 673 853 Total revenues 867,208 422,233 433,084 207,412 220,112 214,821 212,972 878,059 785,872 651,039 Expenses: Net losses and loss adjustment expenses incurred 495,607 240,030 245,448 112,473 127,115 127,557 118,333 501,025 434,830 393,741 Policy acquisition expenses 181,684 89,019 92,106 42,033 45,533 46,986 46,573 184,771 171,429 126,023 General and administrative expenses 105,516 53,052 53,222 26,415 26,028 26,637 27,194 105,686 100,118 87,821 Interest expense 12,458 6,172 6,509 3,067 3,147 3,105 3,362 12,795 12,377 12,125 Other expense 12,108 3,127 7,170 1,390 7,170 1,737 – 16,151 – – Total expenses 807,373 391,400 404,455 185,378 208,993 206,022 195,462 820,428 718,754 619,710 Income from continuing operations before income taxes 59,835 30,833 28,629 22,034 11,119 8,799 17,510 57,631 67,118 31,329 Income tax provision: Current 5,339 5,747 223 4,116 82 1,631 141 (185) (853) 864 Deferred 7,299 992 6,015 635 2,341 357 3,674 12,322 14,242 37,369 Total income tax expense 12,638 6,739 6,238 4,751 2,423 1,988 3,815 12,137 13,389 38,233 Income from continuing operations 47,197 24,094 22,391 17,283 8,696 6,811 13,695 45,494 53,729 (6,904) Discontinued operations: Income (loss) from discontinued operations (5,735) 536 (333) 279 (78) 257 (255) (6,604)$ 814$ (37,089) Net Income (loss) 41,462$ 24,630$ 22,058$ 17,562$ 8,618$ 7,068$ 13,440$ 38,890$ 54,543$ (43,993)$ Three Months Ended June 30Six Months Ended June 30 Year Ended December 31Three Months Ended March 31 24 Income Statement NOTE: Quarterly income statement reported, not audited. Unaudited

($ in thousands) 2019 2018 2017 Net income (loss) from continuing operations 45,494$ 53,729$ (6,904)$ Income tax expense (benefit) 12,137 13,389 38,233 Income (loss) before taxes 57,631 67,118 31,328 Other Expense 16,151 - - Realized investment (gains) losses, net (770) 1,557 (4,204) Adjusted operating income (loss) before taxes 73,012 68,675 27,124 Less: income tax expense on adjusted operating income 15,376 13,389 13,133 Adjusted operating income (loss) 57,636$ 55,286$ 13,991$ December 31 Trailing Twelve Months Ended June 30 ($ in thousands) 2020 2020 2019 2020 2019 2020 2019 Net income from continuing operations 47,197$ 24,094$ 22,391$ 17,283$ 8,696$ 6,811$ 13,695$ Income tax expense from continuing operations 12,638 6,739 6,238 4,751 2,423 1,988 3,815 Income before taxes 59,835 30,833 28,629 22,034 11,119 8,799 17,510 Other expense 12,108 3,127 7,170 1,390 7,170 1,737 - Realized investment gains, net (2,643) (2,123) (250) (1,891) (137) (232) (113) Adjusted operating income before taxes 69,300 31,837 35,549 21,533 18,152 10,304 17,397 Less: income tax expense on adjusted operating income 14,656 6,958 7,691 4,643 3,924 2,328 3,815 Adjusted operating income 54,644$ 24,879$ 27,858$ 16,890$ 14,228$ 7,976$ 13,582$ Three Months Ended June 30Six Months Ended June 30 Three Months Ended March 31 25 Non - GAAP Reconciliation NOTE: Quarterly income statement reported, not audited. Unaudited
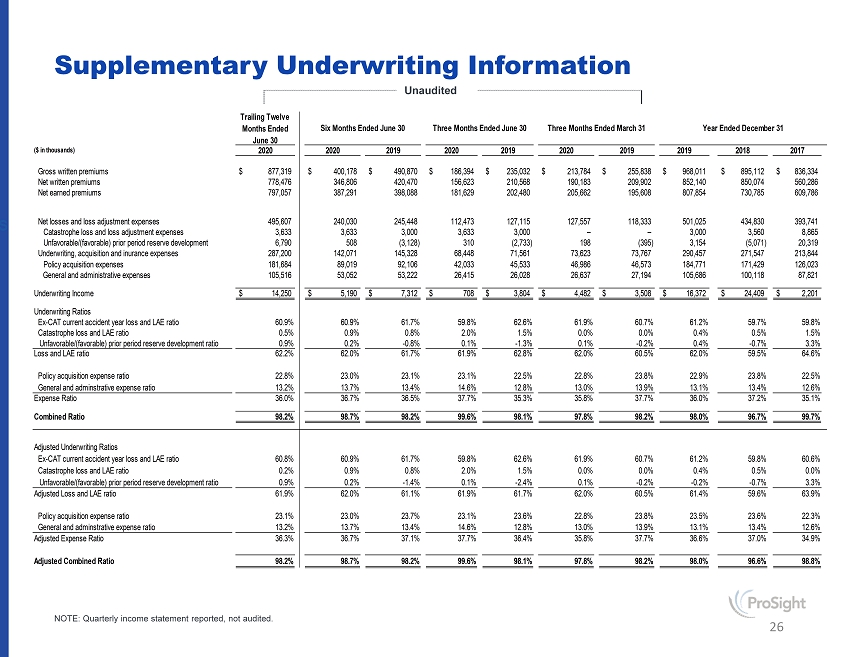
Trailing Twelve Months Ended June 30 ($ in thousands) 2020 2020 2019 2020 2019 2020 2019 2019 2018 2017 Gross written premiums 877,319$ 400,178$ 490,870$ 186,394$ 235,032$ 213,784$ 255,838$ 968,011$ 895,112$ 836,334$ Net written premiums 778,476 346,806 420,470 156,623 210,568 190,183 209,902 852,140 850,074 560,286 Net earned premiums 797,057 387,291 398,088 181,629 202,480 205,662 195,608 807,854 730,785 609,786 Net losses and loss adjustment expenses 495,607 240,030 245,448 112,473 127,115 127,557 118,333 501,025 434,830 393,741 Catastrophe loss and loss adjustment expenses 3,633 3,633 3,000 3,633 3,000 – – 3,000 3,560 8,865 Unfavorable/(favorable) prior period reserve development 6,790 508 (3,128) 310 (2,733) 198 (395) 3,154 (5,071) 20,319 Underwriting, acquisition and inurance expenses 287,200 142,071 145,328 68,448 71,561 73,623 73,767 290,457 271,547 213,844 Policy acquisition expenses 181,684 89,019 92,106 42,033 45,533 46,986 46,573 184,771 171,429 126,023 General and administrative expenses 105,516 53,052 53,222 26,415 26,028 26,637 27,194 105,686 100,118 87,821 Underwriting Income 14,250$ 5,190$ 7,312$ 708$ 3,804$ 4,482$ 3,508$ 16,372$ 24,409$ 2,201$ Underwriting Ratios Ex-CAT current accident year loss and LAE ratio 60.9% 60.9% 61.7% 59.8% 62.6% 61.9% 60.7% 61.2% 59.7% 59.8% Catastrophe loss and LAE ratio 0.5% 0.9% 0.8% 2.0% 1.5% 0.0% 0.0% 0.4% 0.5% 1.5% Unfavorable/(favorable) prior period reserve development ratio 0.9% 0.2% -0.8% 0.1% -1.3% 0.1% -0.2% 0.4% -0.7% 3.3% Loss and LAE ratio 62.2% 62.0% 61.7% 61.9% 62.8% 62.0% 60.5% 62.0% 59.5% 64.6% Policy acquisition expense ratio 22.8% 23.0% 23.1% 23.1% 22.5% 22.8% 23.8% 22.9% 23.8% 22.5% General and adminstrative expense ratio 13.2% 13.7% 13.4% 14.6% 12.8% 13.0% 13.9% 13.1% 13.4% 12.6% Expense Ratio 36.0% 36.7% 36.5% 37.7% 35.3% 35.8% 37.7% 36.0% 37.2% 35.1% Combined Ratio 98.2% 98.7% 98.2% 99.6% 98.1% 97.8% 98.2% 98.0% 96.7% 99.7% Adjusted Underwriting Ratios Ex-CAT current accident year loss and LAE ratio 60.8% 60.9% 61.7% 59.8% 62.6% 61.9% 60.7% 61.2% 59.8% 60.6% Catastrophe loss and LAE ratio 0.2% 0.9% 0.8% 2.0% 1.5% 0.0% 0.0% 0.4% 0.5% 0.0% Unfavorable/(favorable) prior period reserve development ratio 0.9% 0.2% -1.4% 0.1% -2.4% 0.1% -0.2% -0.2% -0.7% 3.3% Adjusted Loss and LAE ratio 61.9% 62.0% 61.1% 61.9% 61.7% 62.0% 60.5% 61.4% 59.6% 63.9% Policy acquisition expense ratio 23.1% 23.0% 23.7% 23.1% 23.6% 22.8% 23.8% 23.5% 23.6% 22.3% General and adminstrative expense ratio 13.2% 13.7% 13.4% 14.6% 12.8% 13.0% 13.9% 13.1% 13.4% 12.6% Adjusted Expense Ratio 36.3% 36.7% 37.1% 37.7% 36.4% 35.8% 37.7% 36.6% 37.0% 34.9% Adjusted Combined Ratio 98.2% 98.7% 98.2% 99.6% 98.1% 97.8% 98.2% 98.0% 96.6% 98.8% Three Months Ended June 30Six Months Ended June 30 Year Ended December 31Three Months Ended March 31 26 Supplementary Underwriting Information NOTE: Quarterly income statement reported, not audited. Unaudited

Trailing Twelve Months Ended June 30 ($ in thousands) 2020 2020 2019 2020 2019 2020 2019 2019 2018 2017 Gross written premiums –$ –$ –$ –$ –$ –$ –$ –$ –$ –$ Ceded written premiums – – 3 – – – – 3 58,857 (160,779) Net written premiums – – 3 – – – – 3 58,857 (160,779) Net premiums earned – – 3 – – – – 3 (14,560) (87,362) Net losses and LAE 2,539 – 2,207 – 2,255 – – 4,746 (9,514) (51,897) Underwriting, acquisition and insurance expenses (2,538) – (2,205) – (2,255) – – (4,743) (3,955) (29,560) Underwriting (loss) income (1)$ -$ 1$ -$ -$ -$ -$ -$ (1,091)$ (5,905)$ Adjustment to loss and LAE ratio -0.3% 0.0% -0.6% 0.0% -1.1% 0.0% 0.0% -0.6% 0.1% -0.7% Adjustment to expense ratio 0.3% 0.0% 0.6% 0.0% 1.1% 0.0% 0.0% 0.6% -0.2% -0.2% Adjustment to combined ratio 0.0% 0.0% 0.0% 0.0% 0.0% 0.0% 0.0% 0.0% -0.1% -0.9% Adjusted loss and LAE ratio 61.9% 62.0% 61.1% 61.9% 61.7% 62.0% 60.5% 61.4% 59.6% 63.9% Adjusted expense ratio 36.3% 36.7% 37.1% 37.7% 36.4% 35.8% 37.7% 36.6% 37.0% 34.9% Adjusted combined ratio 98.2% 98.7% 98.2% 99.6% 98.1% 97.8% 98.2% 98.0% 96.6% 98.8% Three Months Ended June 30Six Months Ended June 30 Three Months Ended March 31 Year Ended December 31 27 Factors Impacting the Results of Operations (WAQS) NOTE: Quarterly income statement reported, not audited. Unaudited
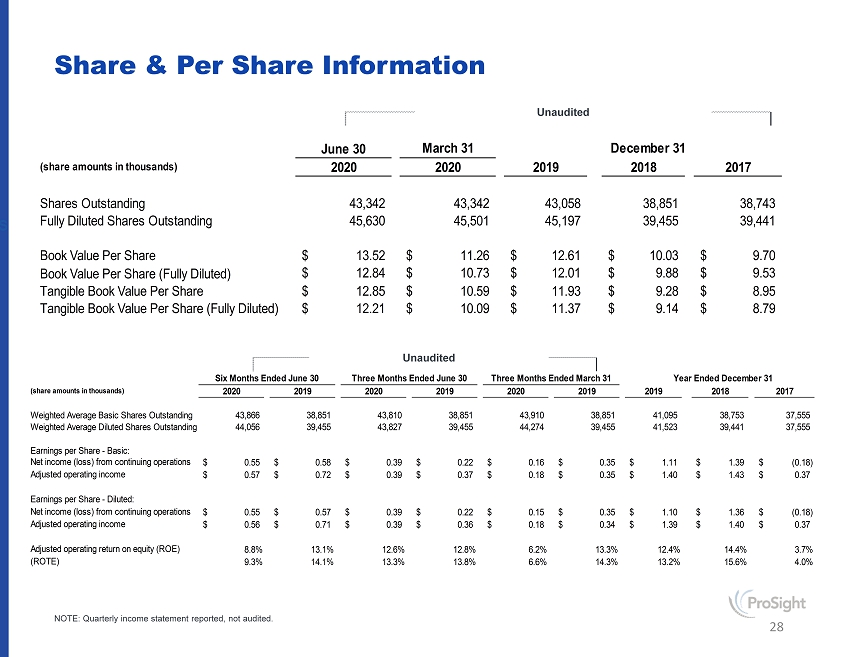
(share amounts in thousands) 2020 2019 2020 2019 2020 2019 2019 2018 2017 Weighted Average Basic Shares Outstanding 43,866 38,851 43,810 38,851 43,910 38,851 41,095 38,753 37,555 Weighted Average Diluted Shares Outstanding 44,056 39,455 43,827 39,455 44,274 39,455 41,523 39,441 37,555 Earnings per Share - Basic: Net income (loss) from continuing operations 0.55$ 0.58$ 0.39$ 0.22$ 0.16$ 0.35$ 1.11$ 1.39$ (0.18)$ Adjusted operating income 0.57$ 0.72$ 0.39$ 0.37$ 0.18$ 0.35$ 1.40$ 1.43$ 0.37$ Earnings per Share - Diluted: Net income (loss) from continuing operations 0.55$ 0.57$ 0.39$ 0.22$ 0.15$ 0.35$ 1.10$ 1.36$ (0.18)$ Adjusted operating income 0.56$ 0.71$ 0.39$ 0.36$ 0.18$ 0.34$ 1.39$ 1.40$ 0.37$ Adjusted operating return on equity (ROE) 8.8% 13.1% 12.6% 12.8% 6.2% 13.3% 12.4% 14.4% 3.7%Adjusted operating return on tangible equity (ROTE) 9.3% 14.1% 13.3% 13.8% 6.6% 14.3% 13.2% 15.6% 4.0% Year Ended December 31Six Months Ended June 30 Three Months Ended June 30 Three Months Ended March 31 June 30 (share amounts in thousands) 2020 2020 2019 2018 2017 Shares Outstanding 43,342 43,342 43,058 38,851 38,743 Fully Diluted Shares Outstanding 45,630 45,501 45,197 39,455 39,441 Book Value Per Share 13.52$ 11.26$ 12.61$ 10.03$ 9.70$ Book Value Per Share (Fully Diluted) 12.84$ 10.73$ 12.01$ 9.88$ 9.53$ Tangible Book Value Per Share 12.85$ 10.59$ 11.93$ 9.28$ 8.95$ Tangible Book Value Per Share (Fully Diluted) 12.21$ 10.09$ 11.37$ 9.14$ 8.79$ March 31 December 31 28 Share & Per Share Information NOTE: Quarterly income statement reported, not audited. Unaudited Unaudited

Trailing Twelve Months Ended June 30 ($ in thousands) 2020 2020 2019 2020 2019 2020 2019 2019 2018 Customer Segment Construction 114,393$ 52,218$ 55,743$ 27,704$ 32,495$ 24,514$ 23,248$ 117,918$ 101,946$ Consumer Services 139,602 71,297 65,378 40,730 37,893 30,568 27,485 133,682 107,086 Marine and Energy 108,866 59,611 45,445 26,821 25,633 32,790 19,812 94,071 82,978 Media and Entertainment 110,776 47,920 62,094 17,454 32,402 30,467 29,692 124,950 119,926 Professional Services 122,249 61,589 58,666 31,891 29,104 29,698 29,562 119,326 110,546 Real Estate 172,774 80,488 75,349 47,273 46,614 33,215 28,735 167,635 132,652 Sports 29,583 14,253 14,748 4,688 6,898 9,565 7,850 30,079 23,590 Transportation 71,577 9,127 49,742 (12,340) 18,985 21,467 30,757 112,191 92,169 Customer Segment Subtotal 869,822 396,505 427,165 184,221 230,024 212,284 197,141 899,852 770,893 Other 7,498 3,673 63,705 2,173 5,008 1,500 58,697 68,159 124,219 Total 877,320$ 400,178$ 490,870$ 186,394$ 235,032$ 213,784$ 255,838$ 968,011$ 895,112$ Three Months Ended June 30Six Months Ended June 30 Three Months Ended March 31 Year Ended December 31 Gross Written Premium by Segment 29 NOTE: Quarterly reported, not audited. Unaudited