Attached files
| file | filename |
|---|---|
| 8-K - 8-K - RENASANT CORP | rnst-20200826.htm |

Investor Presentation August 26, 2020
Forward-Looking Statements This presentation may contain various statements about Renasant Corporation (“Renasant,” “we,” “our,” or “us”) that constitute “forward-looking statements” within the meaning of Section 27A of the Securities Act of 1933, as amended, and Section 21E of the Securities Exchange Act of 1934, as amended. Statements preceded by, followed by or that otherwise include the words “believes,” “expects,” “projects,” “anticipates,” “intends,” “estimates,” “plans,” “potential,” “possible,” “may increase,” “may fluctuate,” “will likely result,” and similar expressions, or future or conditional verbs such as “will,” “should,” “would” and “could,” are generally forward-looking in nature and not historical facts. Forward-looking statements include information about our future financial performance, business strategy, projected plans and objectives and are based on the current beliefs and expectations of management. We believe these forward-looking statements are reasonable, but they are all inherently subject to significant business, economic and competitive risks and uncertainties, many of which are beyond our control. In addition, these forward-looking statements are subject to assumptions about future business strategies and decisions that are subject to change. Actual results may differ from those indicated or implied in the forward-looking statements; such differences may be material. Prospective investors are cautioned that any forward- looking statements are not guarantees of future performance and involve risks and uncertainties. Investors should not place undue reliance on these forward-looking statements, which speak only as of the date they are made. Currently, the most important factor that could cause Renasant’s actual results to differ materially from those in forward-looking statements is the continued impact of the COVID- 19 pandemic and related governmental measures to respond to the pandemic on the U.S. economy and the economies of the markets in which we operate. In this presentation, we have addressed the historical impact of the pandemic on our operations and set forth certain expectations regarding the COVID-19 pandemic’s future impact on our business, financial condition, results of operations, liquidity, asset quality, capital, cash flows and prospects. We believe these statements about future events and conditions in light of the COVID-19 pandemic are reasonable, but these statements are based on assumptions regarding, among other things, how long the pandemic will continue, the duration, extent and effectiveness of the governmental measures implemented to contain the pandemic and ameliorate its impact on businesses and individuals throughout the United States, and the impact of the pandemic and the government’s virus containment measures on national and local economies, all of which are out of our control. If the assumptions underlying these statements about future events prove to be incorrect, Renasant’s business, financial condition, results of operations, liquidity, asset quality, capital, cash flows and prospects may be materially different from what is presented in our forward-looking statements. Important factors other than the COVID-19 pandemic currently known to us that could cause actual results to differ materially from those in forward-looking statements include the following: (i) our ability to efficiently integrate acquisitions into operations, retain the customers of these businesses, grow the acquired operations and realize the cost savings expected from an acquisition to the extent and in the timeframe management anticipated; (ii) the effect of economic conditions and interest rates on a national, regional or international basis; (iii) timing and success of the implementation of changes in operations to achieve enhanced earnings or effect cost savings; (iv) competitive pressures in the consumer finance, commercial finance, insurance, financial services, asset management, retail banking, mortgage lending and auto lending industries; (v) the financial resources of, and products available from, competitors; (vi) changes in laws and regulations as well as changes in accounting standards, such as the adoption of the CECL model on January 1, 2020; (vii) changes in policy by regulatory agencies; (viii) changes in the securities and foreign exchange markets; (ix) our potential growth, including our entrance or expansion into new markets, and the need for sufficient capital to support that growth; (x) changes in the quality or composition of our loan or investment portfolios, including adverse developments in borrower industries or in the repayment ability of individual borrowers; (xi) an insufficient allowance for credit losses as a result of inaccurate assumptions; (xii) general economic, market or business conditions, including the impact of inflation; (xiii) changes in demand for loan products and financial services; (xiv) concentration of credit exposure; (xv) changes or the lack of changes in interest rates, yield curves and interest rate spread relationships; (xvi) increased cybersecurity risk, including potential network breaches, business disruptions or financial losses; (xvii) natural disasters, epidemics and other catastrophic events in our geographic area; (xviii) the impact, extent and timing of technological changes; and (xix) other circumstances, many of which are beyond our control. The COVID-19 pandemic has exacerbated, and is likely to continue to exacerbate, the impact of any of these factors on the Company. Management believes that the assumptions underlying our forward-looking statements are reasonable, but any of the assumptions could prove to be inaccurate. Investors are urged to carefully consider the risks described in Renasant’s filings with the Securities and Exchange Commission from time to time, which are available at www.renasant.com and the SEC’s website at www.sec.gov. We undertake no obligation, and specifically disclaim any obligation, to update or revise our forward-looking statements, whether as a result of new information or to reflect changed assumptions, the occurrence of unanticipated events or changes to future operating results over time, except as required by federal securities laws. This presentation is not an offer to sell securities, nor is it a solicitation of an offer to buy securities in any locality, state, country or other jurisdiction where such distribution, publication, availability or use would be contrary to law or regulation or which would require any registration or licensing within such jurisdiction. Neither the SEC nor any other regulatory body has approved or disapproved of the securities of the Company or passed upon the accuracy or adequacy of this presentation. Any representation to the contrary is a criminal offense. Except as otherwise indicated, this presentation speaks as to the date hereof. The delivery of this presentation shall not, under any circumstances, create any implication that there has been no change in the affairs of the Company after the date hereof. 2
Overview of Renasant Corporation
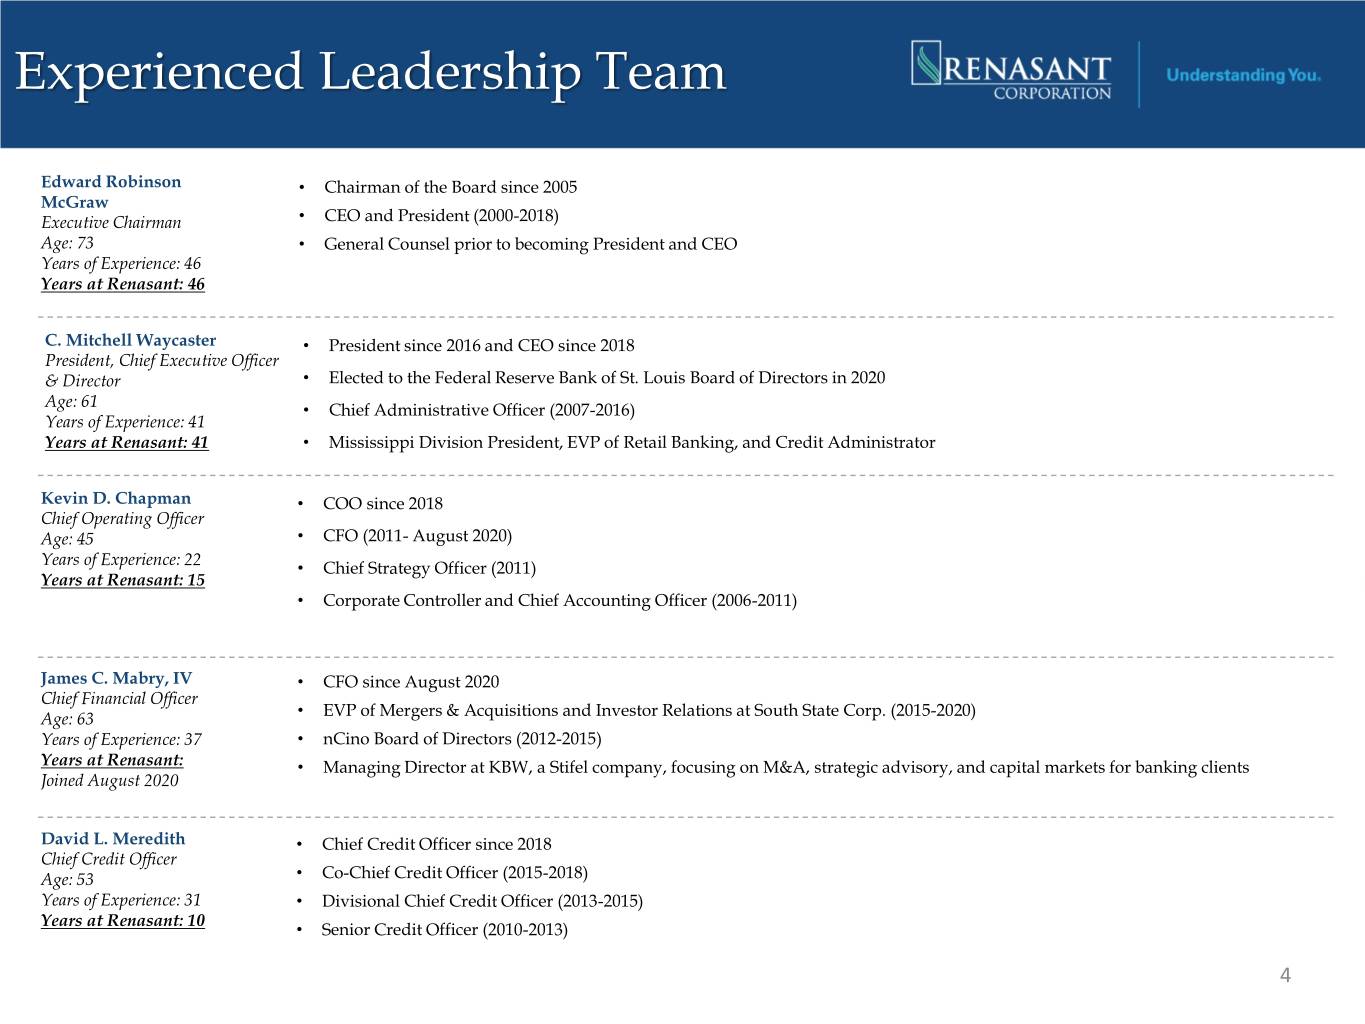
Experienced Leadership Team Edward Robinson • Chairman of the Board since 2005 McGraw Executive Chairman • CEO and President (2000-2018) Age: 73 • General Counsel prior to becoming President and CEO Years of Experience: 46 Years at Renasant: 46 C. Mitchell Waycaster • President since 2016 and CEO since 2018 President, Chief Executive Officer & Director • Elected to the Federal Reserve Bank of St. Louis Board of Directors in 2020 Age: 61 • Chief Administrative Officer (2007-2016) Years of Experience: 41 Years at Renasant: 41 • Mississippi Division President, EVP of Retail Banking, and Credit Administrator Kevin D. Chapman • COO since 2018 Chief Operating Officer Age: 45 • CFO (2011- August 2020) Years of Experience: 22 • Chief Strategy Officer (2011) Years at Renasant: 15 • Corporate Controller and Chief Accounting Officer (2006-2011) James C. Mabry, IV • CFO since August 2020 Chief Financial Officer • EVP of Mergers & Acquisitions and Investor Relations at South State Corp. (2015-2020) Age: 63 Years of Experience: 37 • nCino Board of Directors (2012-2015) Years at Renasant: • Managing Director at KBW, a Stifel company, focusing on M&A, strategic advisory, and capital markets for banking clients Joined August 2020 David L. Meredith • Chief Credit Officer since 2018 Chief Credit Officer Age: 53 • Co-Chief Credit Officer (2015-2018) Years of Experience: 31 • Divisional Chief Credit Officer (2013-2015) Years at Renasant: 10 • Senior Credit Officer (2010-2013) 4
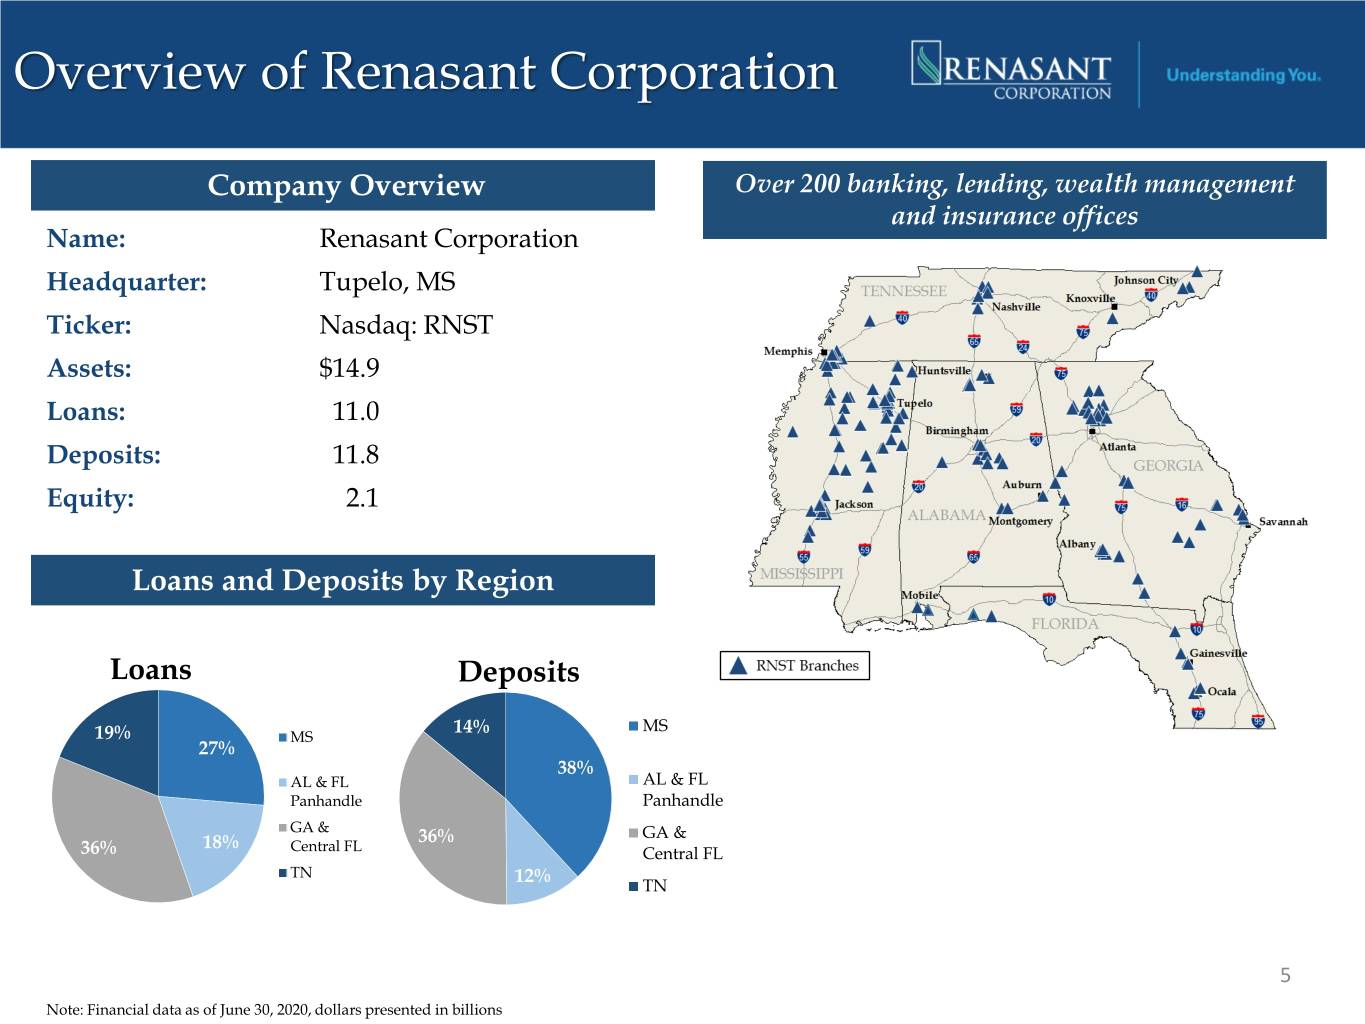
Overview of Renasant Corporation Company Overview Over 200 banking, lending, wealth management and insurance offices Name: Renasant Corporation Headquarter: Tupelo, MS Ticker: Nasdaq: RNST Assets: $14.9 Loans: 11.0 Deposits: 11.8 Equity: 2.1 Loans and Deposits by Region Loans Deposits 14% MS 19% MS 27% 38% AL & FL AL & FL Panhandle Panhandle GA & GA & 18% 36% 36% Central FL Central FL TN 12% TN 5 Note: Financial data as of June 30, 2020, dollars presented in billions
Investment Highlights • Building on a 116 year history • Over 200 banking, lending, mortgage, wealth and insurance offices in vibrant markets across 5 Southeastern states • Experienced and tenured team attracting new talent • Proven track record of successful acquisitions and de novo expansion • Profitable throughout the 2008 financial crisis • Strong balance sheet with an emphasis on liquidity, core funding, meaningful credit reserves and a granular and diverse loan portfolio • Legacy of proactive portfolio management and conservative credit underwriting • Stable low-cost core deposit base • Diverse sources of noninterest income • Engaged Board with a focus on risk management 6
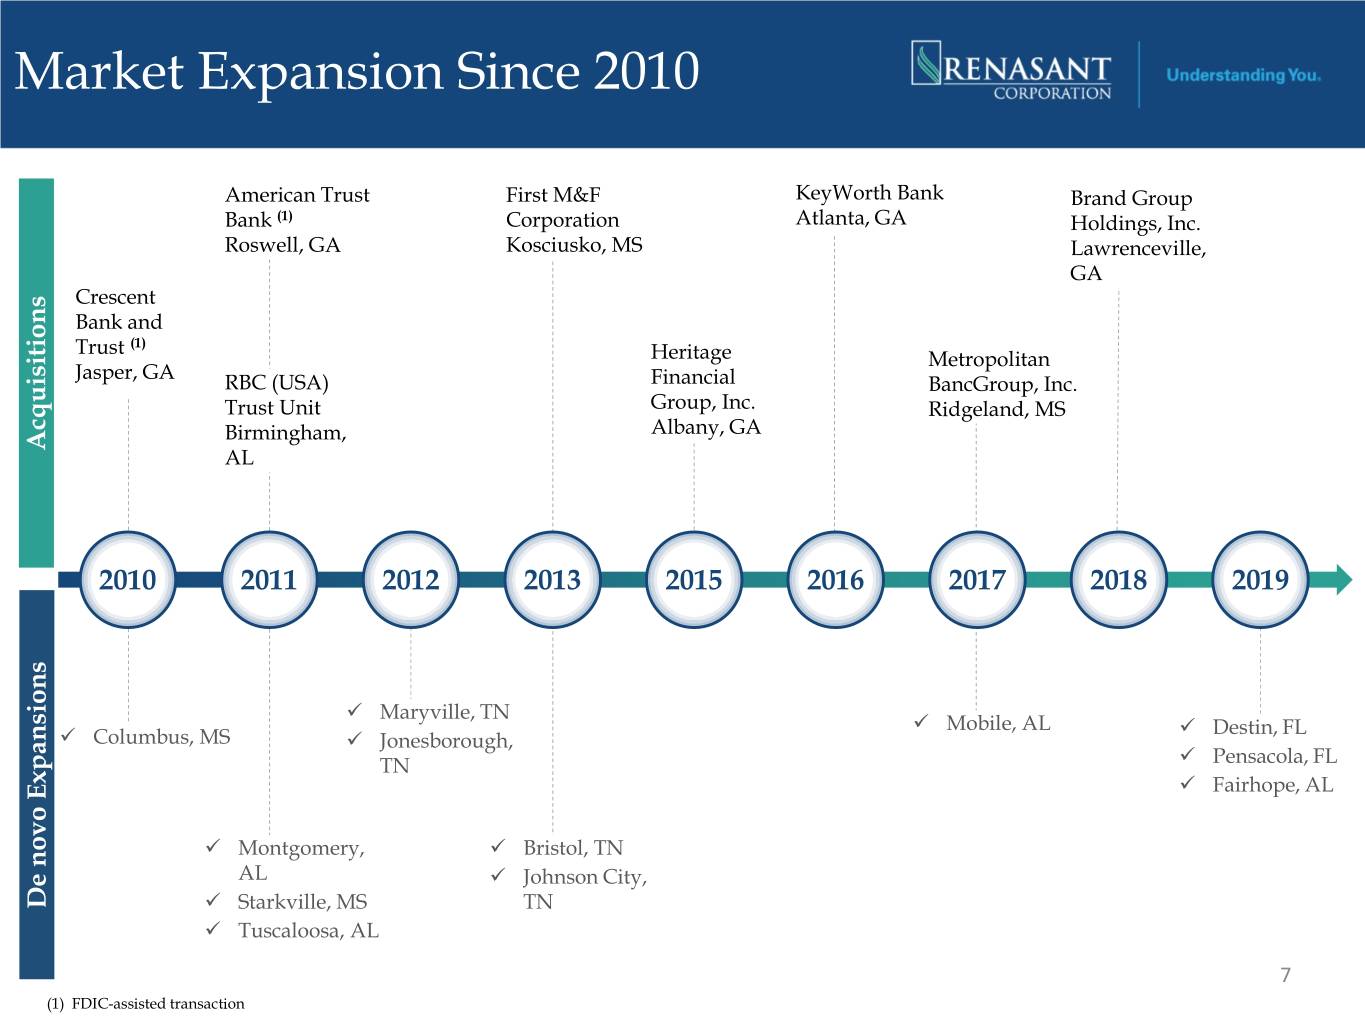
Market Expansion Since 2010 American Trust First M&F KeyWorth Bank Brand Group Bank (1) Corporation Atlanta, GA Holdings, Inc. Roswell, GA Kosciusko, MS Lawrenceville, GA Crescent Bank and Trust (1) Heritage Metropolitan Jasper, GA RBC (USA) Financial BancGroup, Inc. Trust Unit Group, Inc. Ridgeland, MS Birmingham, Albany, GA Acquisitions AL 2010 2011 2012 2013 2015 2016 2017 2018 2019 Maryville, TN Mobile, AL Destin, FL Columbus, MS Jonesborough, TN Pensacola, FL Fairhope, AL Montgomery, Bristol, TN AL Johnson City, De novo Expansions novo De Starkville, MS TN Tuscaloosa, AL 7 (1) FDIC-assisted transaction
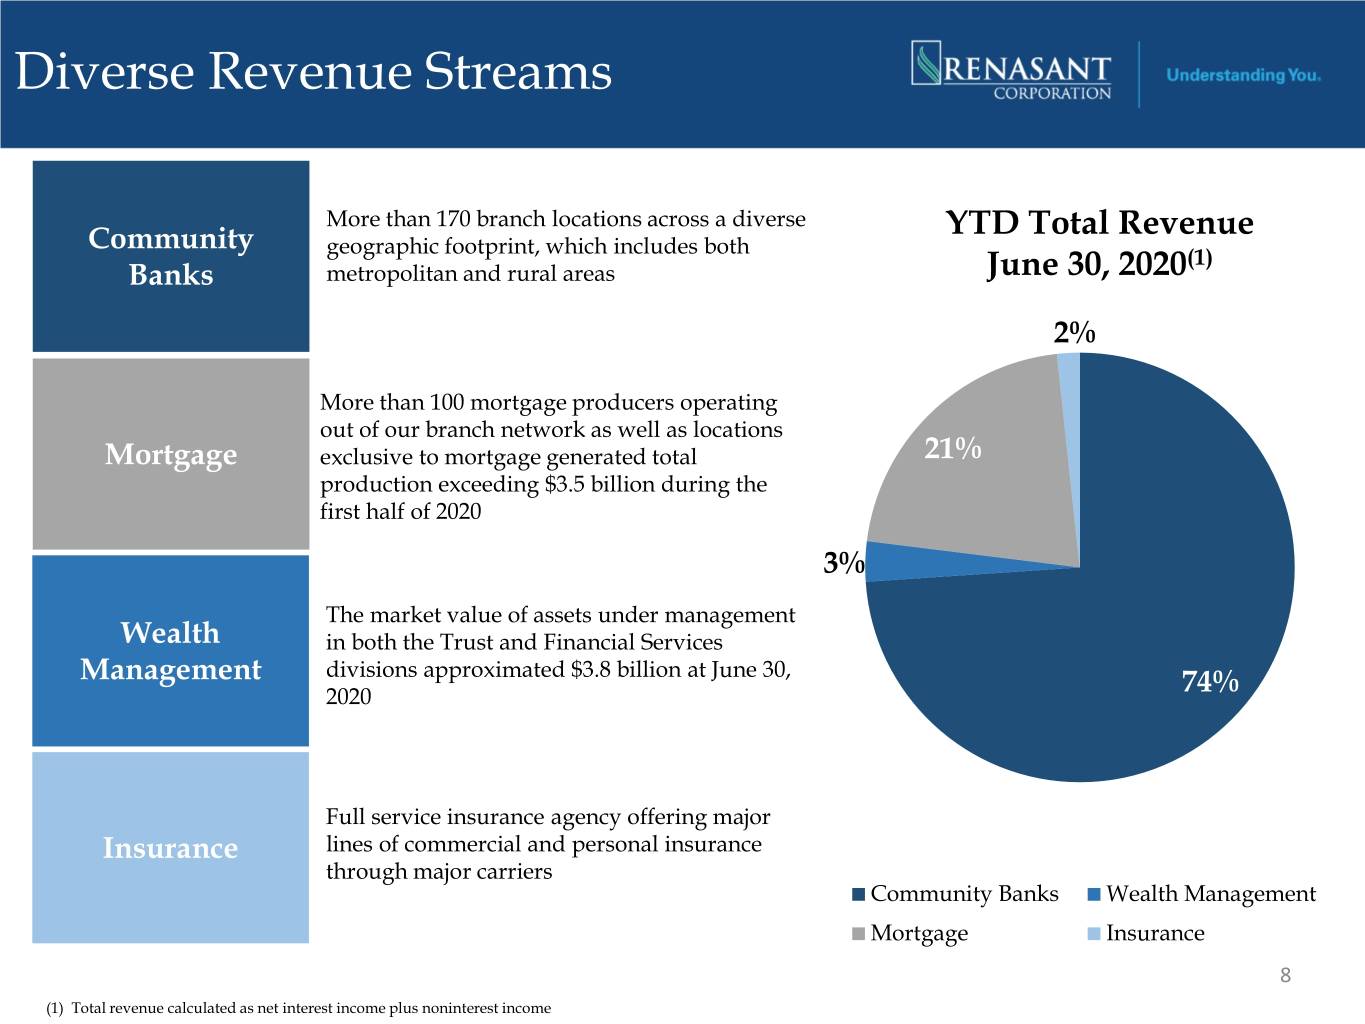
Diverse Revenue Streams More than 170 branch locations across a diverse Community YTD Total Revenue geographic footprint, which includes both (1) Banks metropolitan and rural areas June 30, 2020 2% More than 100 mortgage producers operating out of our branch network as well as locations Mortgage exclusive to mortgage generated total 21% production exceeding $3.5 billion during the first half of 2020 3% The market value of assets under management Wealth in both the Trust and Financial Services Management divisions approximated $3.8 billion at June 30, 2020 74% Full service insurance agency offering major Insurance lines of commercial and personal insurance through major carriers Community Banks Wealth Management Mortgage Insurance 8 (1) Total revenue calculated as net interest income plus noninterest income

COVID-19 Response
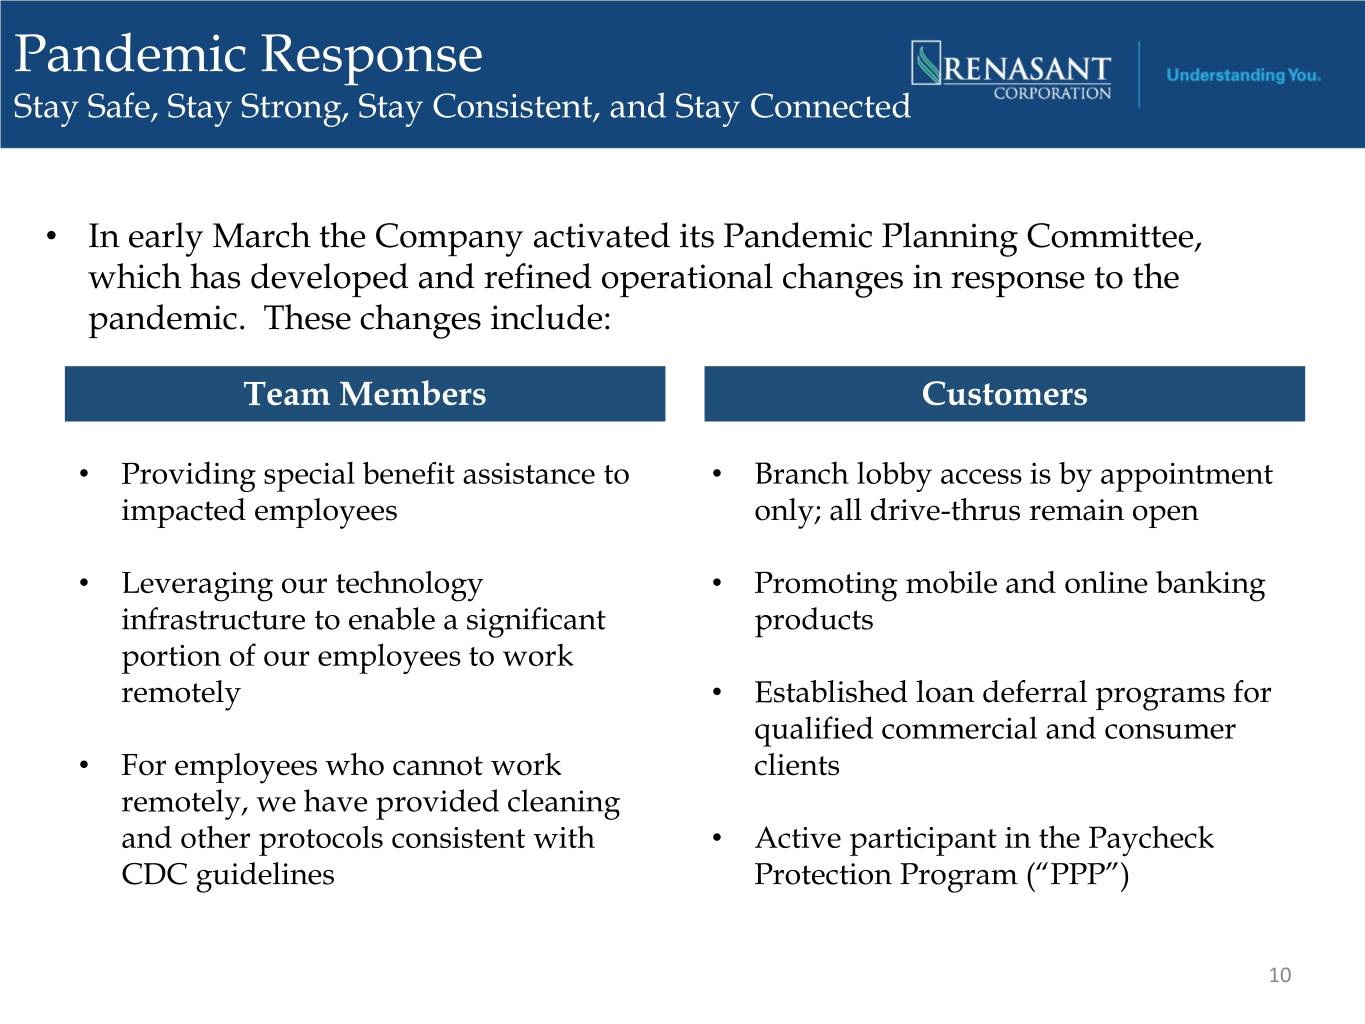
Pandemic Response Stay Safe, Stay Strong, Stay Consistent, and Stay Connected • In early March the Company activated its Pandemic Planning Committee, which has developed and refined operational changes in response to the pandemic. These changes include: Team Members Customers • Providing special benefit assistance to • Branch lobby access is by appointment impacted employees only; all drive-thrus remain open • Leveraging our technology • Promoting mobile and online banking infrastructure to enable a significant products portion of our employees to work remotely • Established loan deferral programs for qualified commercial and consumer • For employees who cannot work clients remotely, we have provided cleaning and other protocols consistent with • Active participant in the Paycheck CDC guidelines Protection Program (“PPP”) 10
Financial Highlights
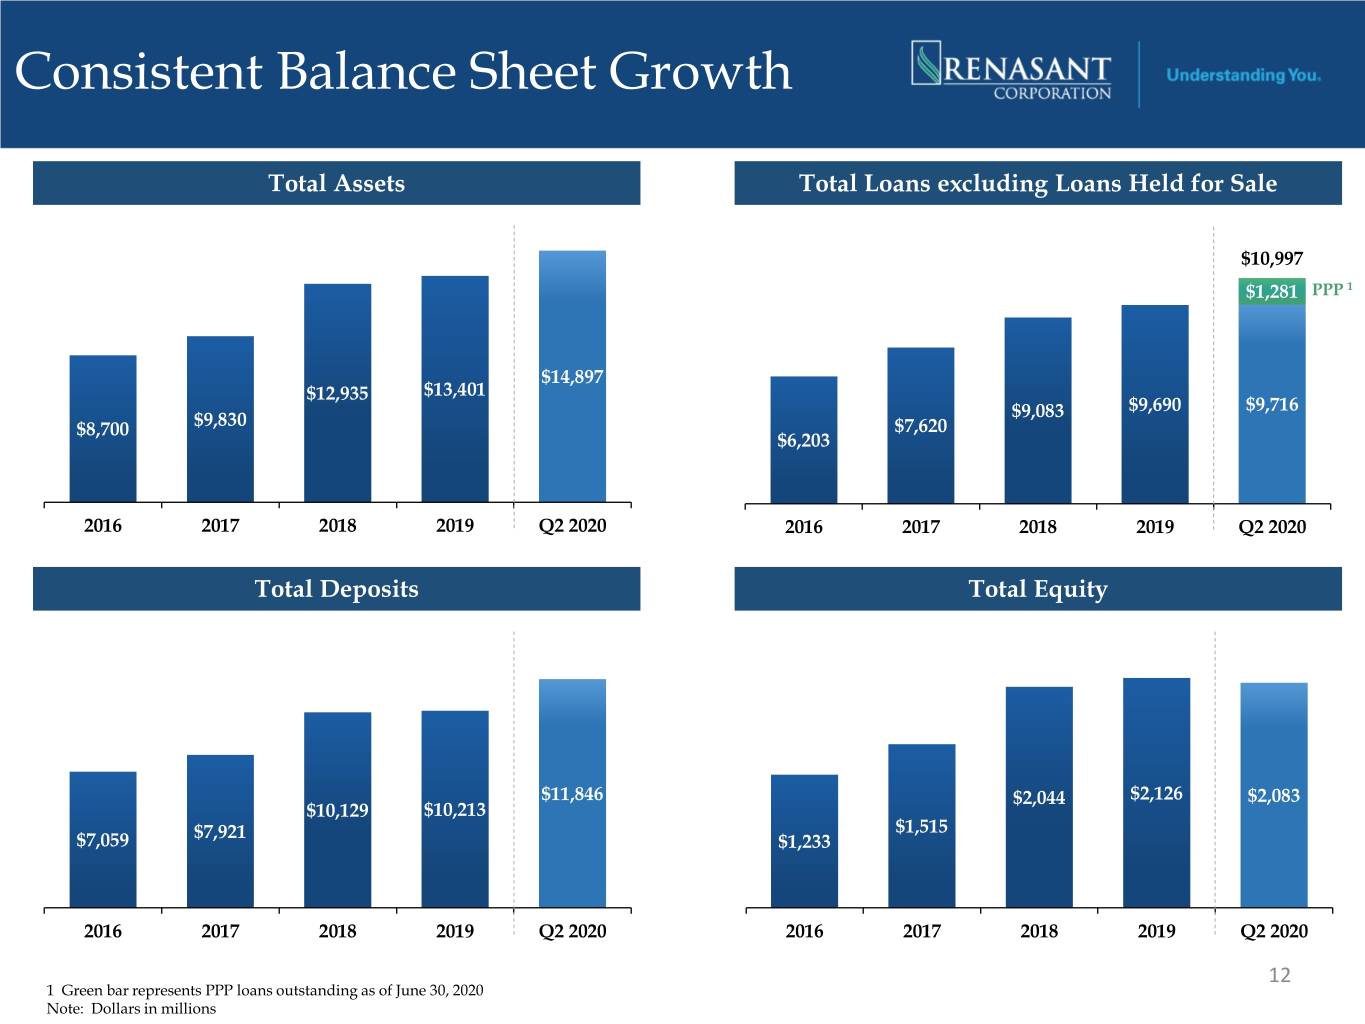
Consistent Balance Sheet Growth Total Assets Total Loans excluding Loans Held for Sale $16,000 $12,000 $12,000 $14,000 $10,997 1 $10,000 PPP$10,000 $12,000 $1,281 $10,000 $8,000 $8,000 $8,000 $14,897 $6,000 $6,000 $13,401 $6,000 $12,935 $9,083 $9,690 $9,716 $9,830 $4,000 $4,000 $4,000 $8,700 $7,620 $6,203 $2,000 $2,000 $2,000 $0 $0 $0 2016 2017 2018 2019 Q2 2020 2016 2017 2018 2019 Q2 2020 Total Deposits Total Equity $14,000 $2,500 $12,000 $2,000 $10,000 $1,500 $8,000 $6,000 $11,846 $1,000 $2,044 $2,126 $2,083 $10,129 $10,213 $4,000 $7,921 $1,515 $7,059 $1,233 $500 $2,000 $0 $0 2016 2017 2018 2019 Q2 2020 2016 2017 2018 2019 Q2 2020 12 1 Green bar represents PPP loans outstanding as of June 30, 2020 Note: Dollars in millions
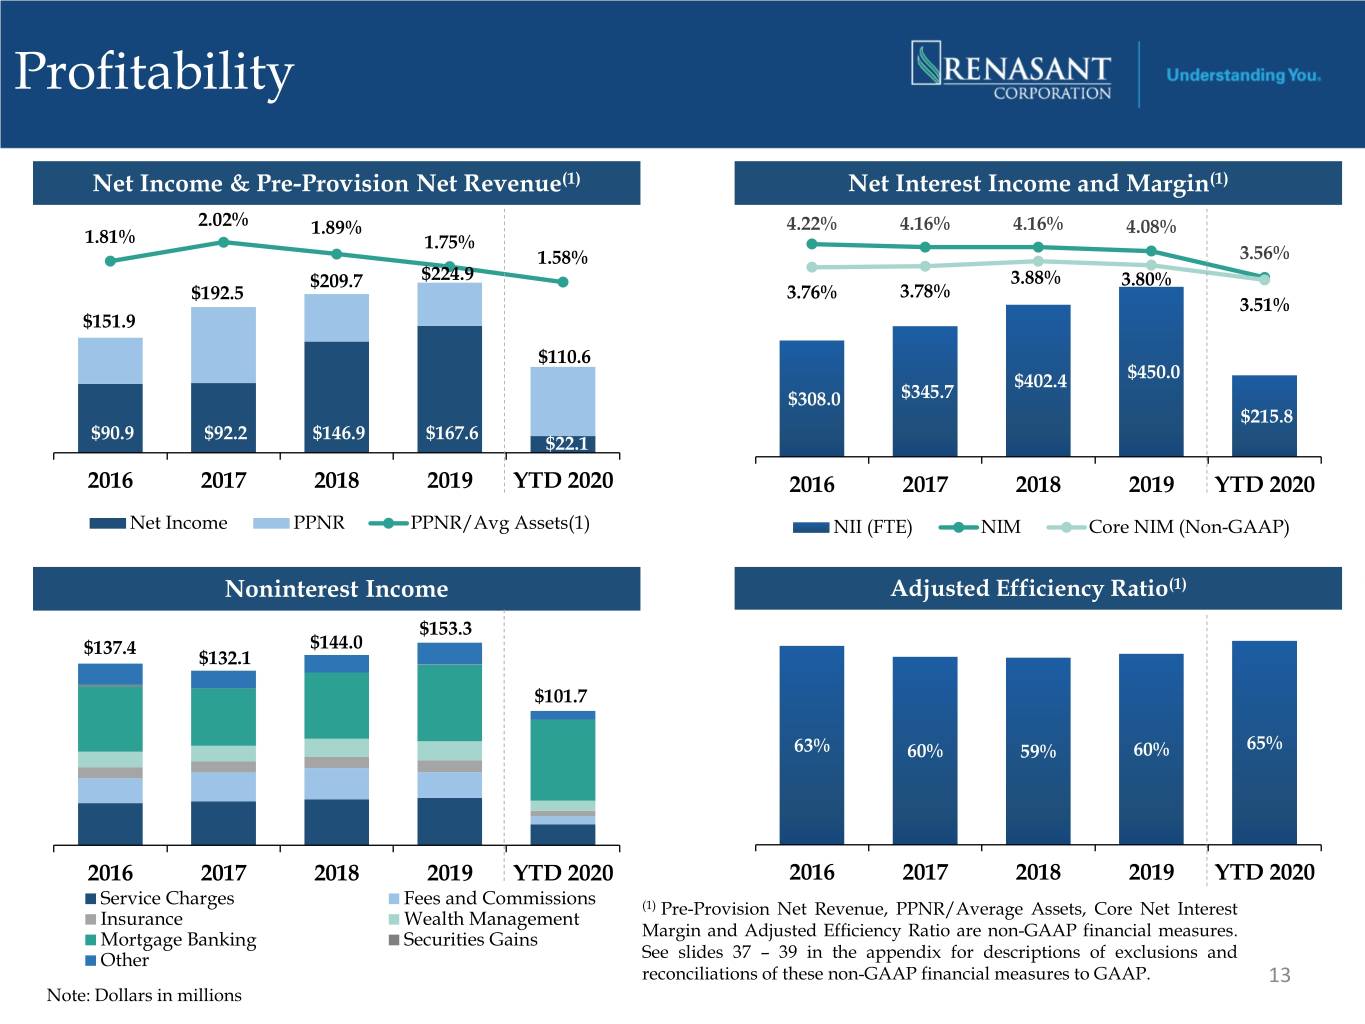
Profitability Net Income & Pre-Provision Net Revenue(1) Net Interest Income and Margin(1) 2.02% 1.89% 4.22% 4.16% 4.16% 4.08% 1.81% 1.75% 1.58% 3.56% $209.7 $224.9 3.88% 3.80% $192.5 3.76% 3.78% 3.51% $151.9 $110.6 $402.4 $450.0 $308.0 $345.7 $215.8 $90.9 $92.2 $146.9 $167.6 $22.1 2016 2017 2018 2019 YTD 2020 2016 2017 2018 2019 YTD 2020 Net Income PPNR PPNR/Avg Assets(1) NII (FTE) NIM Core NIM (Non-GAAP) Noninterest Income Adjusted Efficiency Ratio(1) $153.3 $137.4 $144.0 $132.1 $101.7 63% 60% 59% 60% 65% 2016 2017 2018 2019 YTD 2020 2016 2017 2018 2019 YTD 2020 Service Charges Fees and Commissions (1) Pre-Provision Net Revenue, PPNR/Average Assets, Core Net Interest Insurance Wealth Management Mortgage Banking Securities Gains Margin and Adjusted Efficiency Ratio are non-GAAP financial measures. Other See slides 37 – 39 in the appendix for descriptions of exclusions and reconciliations of these non-GAAP financial measures to GAAP. 13 Note: Dollars in millions
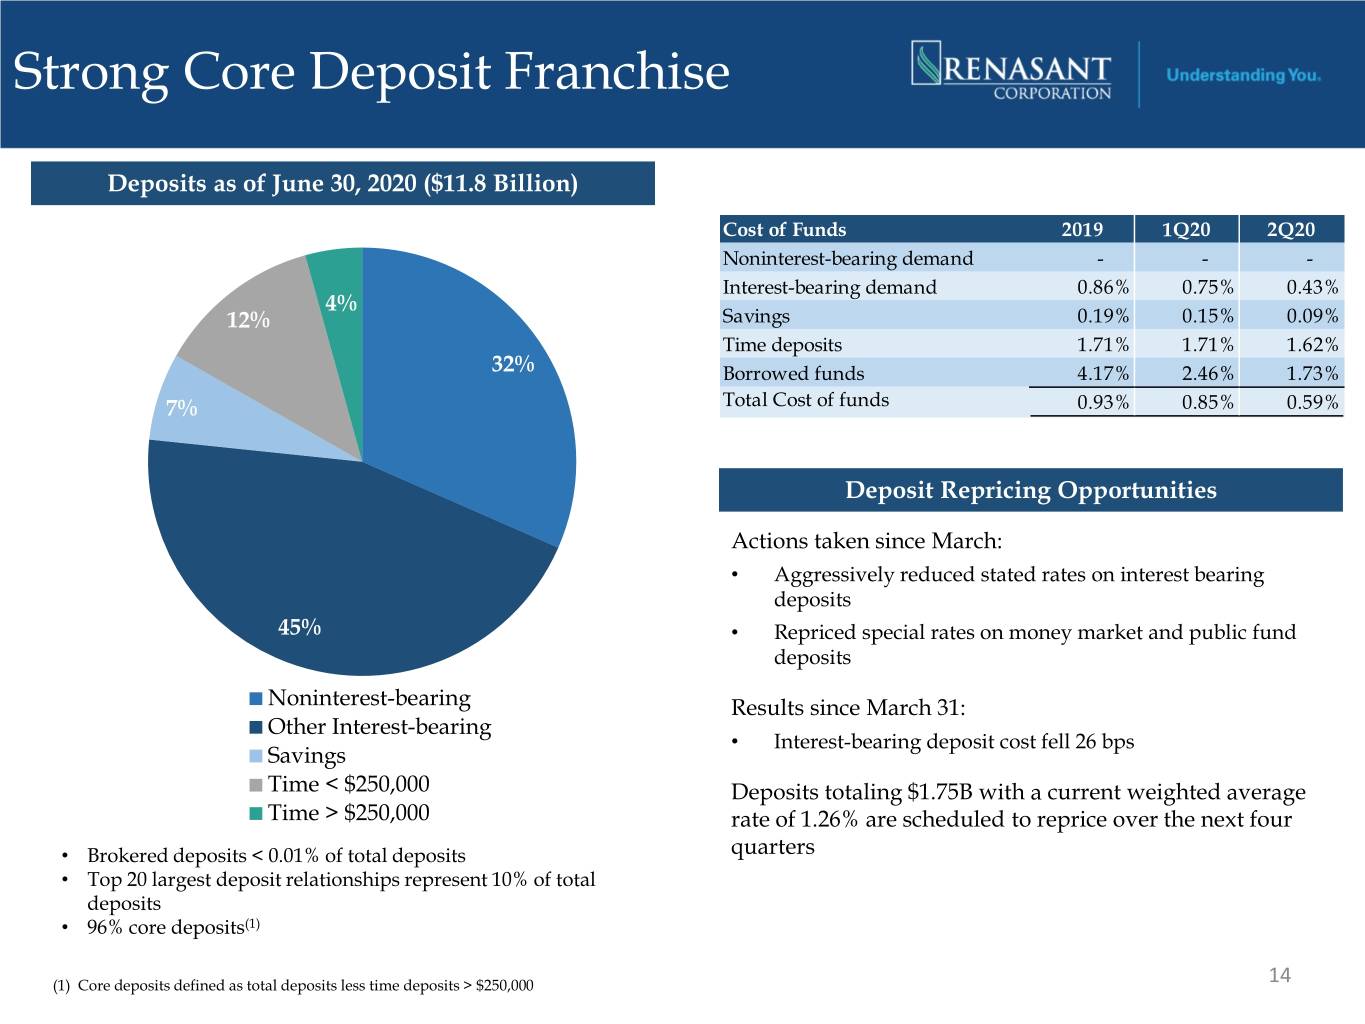
Strong Core Deposit Franchise Deposits as of June 30, 2020 ($11.8 Billion) Cost of Funds 2019 1Q20 2Q20 Noninterest-bearing demand - - - Interest-bearing demand 0.86% 0.75% 0.43% 4% 12% Savings 0.19% 0.15% 0.09% Time deposits 1.71% 1.71% 1.62% 32% Borrowed funds 4.17% 2.46% 1.73% 7% Total Cost of funds 0.93% 0.85% 0.59% Deposit Repricing Opportunities Actions taken since March: • Aggressively reduced stated rates on interest bearing deposits 45% • Repriced special rates on money market and public fund deposits Noninterest-bearing Results since March 31: Other Interest-bearing • Interest-bearing deposit cost fell 26 bps Savings Time < $250,000 Deposits totaling $1.75B with a current weighted average Time > $250,000 rate of 1.26% are scheduled to reprice over the next four • Brokered deposits < 0.01% of total deposits quarters • Top 20 largest deposit relationships represent 10% of total deposits • 96% core deposits(1) (1) Core deposits defined as total deposits less time deposits > $250,000 14

Securities Portfolio Composition Highlights • Market value of $1.3B • Taxable equivalent yield of 2.48% 3% 3% • Average life of 4.1 years • Unrealized gain of $39.6M • 77% of securities portfolio is U.S. government agency or Treasury issued 21% • 96% of the municipal portfolio is rated(1) AA or better • 100% of securities portfolio is classified as available-for-sale 55% 18% Agency MBS Agency CMO Municipal SBA Other Note: Financial data as June 30, 2020 15 (1) As rated by S&P, Moody’s or Fitch
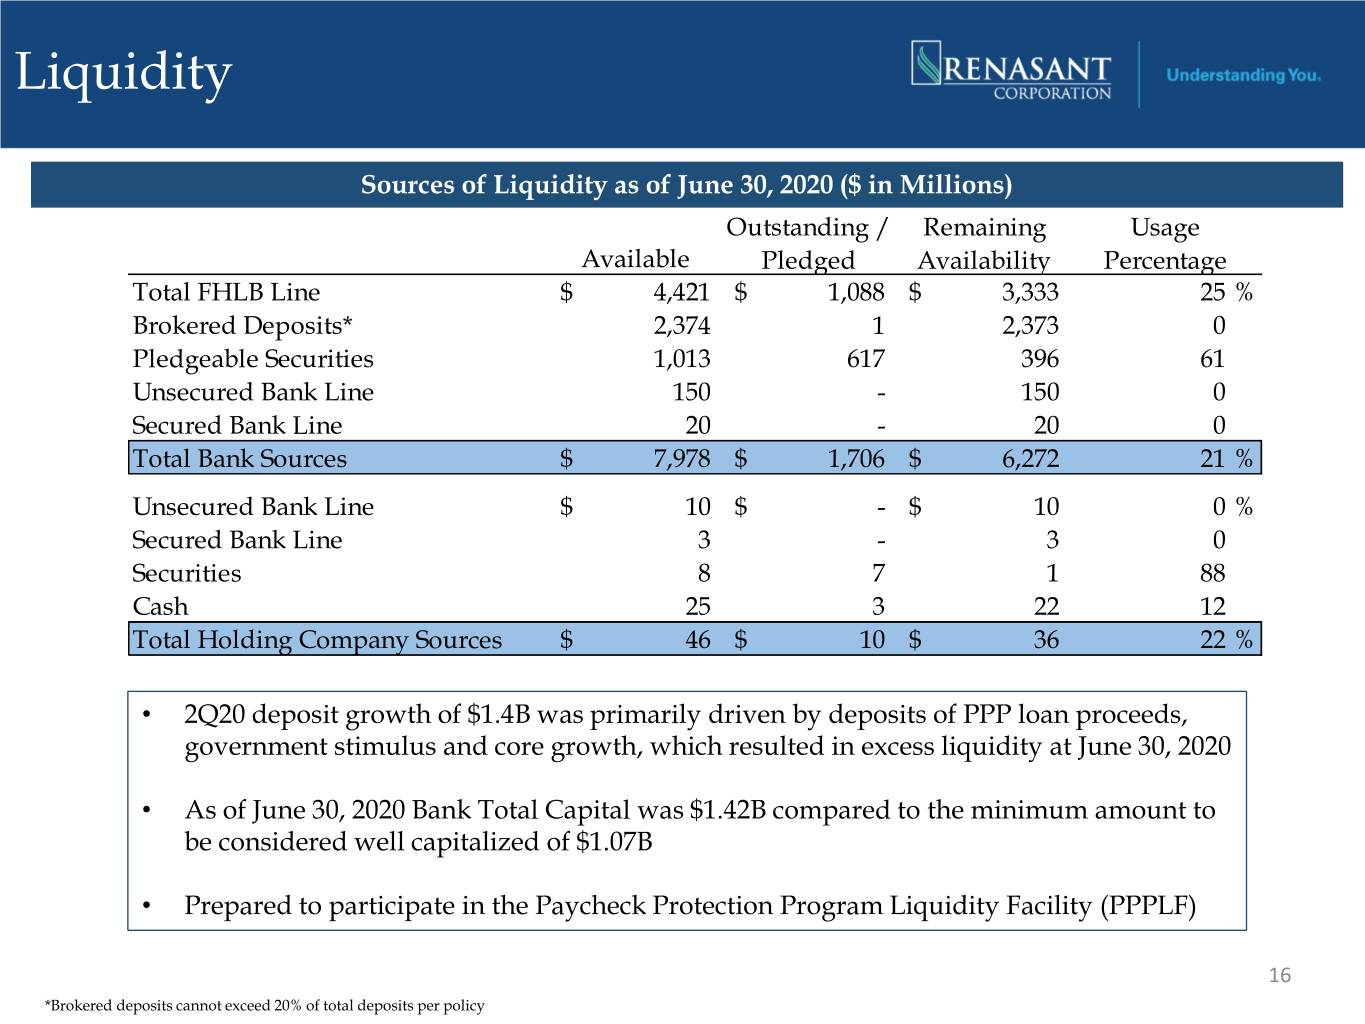
Liquidity Sources of Liquidity as of June 30, 2020 ($ in Millions) Outstanding / Remaining Usage Available Pledged Availability Percentage Total FHLB Line $ 4,421 $ 1,088 $ 3,333 25 % Brokered Deposits* 2,374 1 2,373 0 Pledgeable Securities 1,013 617 396 61 Unsecured Bank Line 150 - 150 0 Secured Bank Line 20 - 20 0 Total Bank Sources $ 7,978 $ 1,706 $ 6,272 21 % Unsecured Bank Line $ 10 $ - $ 10 0 % Secured Bank Line 3 - 3 0 Securities 8 7 1 88 Cash 25 3 22 12 Total Holding Company Sources $ 46 $ 10 $ 36 22 % • 2Q20 deposit growth of $1.4B was primarily driven by deposits of PPP loan proceeds, government stimulus and core growth, which resulted in excess liquidity at June 30, 2020 • As of June 30, 2020 Bank Total Capital was $1.42B compared to the minimum amount to be considered well capitalized of $1.07B • Prepared to participate in the Paycheck Protection Program Liquidity Facility (PPPLF) 16 *Brokered deposits cannot exceed 20% of total deposits per policy
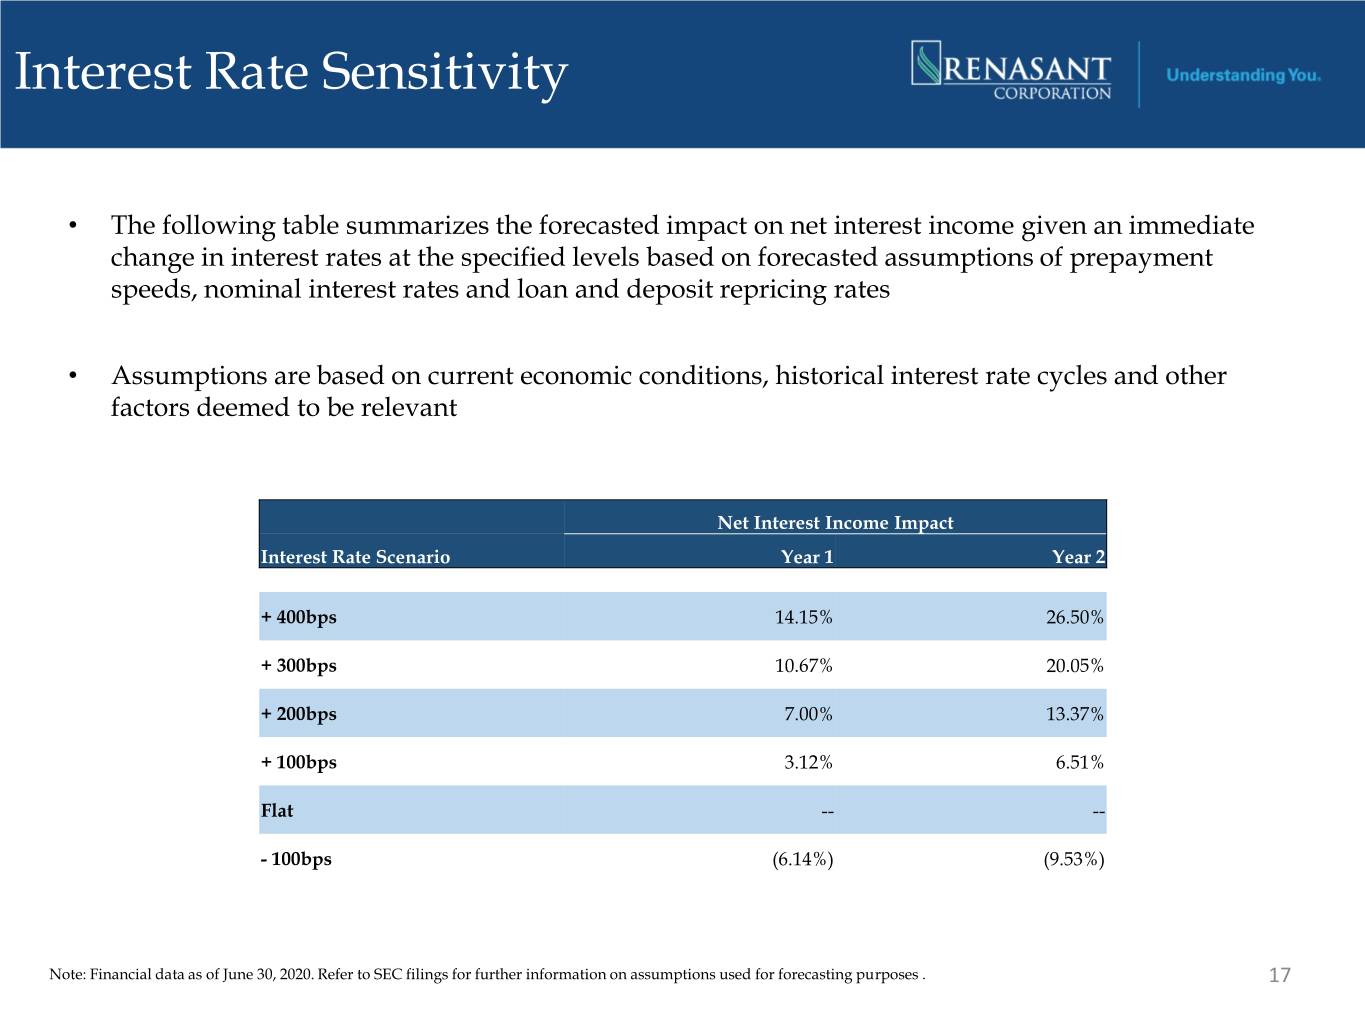
Interest Rate Sensitivity • The following table summarizes the forecasted impact on net interest income given an immediate change in interest rates at the specified levels based on forecasted assumptions of prepayment speeds, nominal interest rates and loan and deposit repricing rates • Assumptions are based on current economic conditions, historical interest rate cycles and other factors deemed to be relevant Net Interest Income Impact Interest Rate Scenario Year 1 Year 2 + 400bps 14.15% 26.50% + 300bps 10.67% 20.05% + 200bps 7.00% 13.37% + 100bps 3.12% 6.51% Flat -- -- - 100bps (6.14%) (9.53%) Note: Financial data as of June 30, 2020. Refer to SEC filings for further information on assumptions used for forecasting purposes . 17

Capital Position Regulatory Capital as of June 30, 2020 ($ in millions) Capital Highlights • Stock buyback program suspended in March 2020 • Elected to take advantage of transitional relief offered by regulators to delay for two years the estimated impact of CECL on regulatory capital, followed by a three-year transitional period to phase out the capital benefit provided by the two year delay Common Equity Tier 1 Tier 1 Capital • Consistent dividend payment history including $1,146M $1,253 million through the 2008 financial crisis • Subordinated debt financing in the Company’s capital structure as of June 30, 2020 included: $15 million par value subordinated notes due July 1, 2026; call period begins July 1, 2021; current fixed rate of 6.50% $60 million par value subordinated notes due Trust Preferred September 1, 2026; call period begins $107M September 1, 2021; current fixed rate of 5.00% ACL, $104M Tier 2 Capital $40 million par value subordinated notes due Subordinated $217 million Notes $113M September 1, 2031; call period begins September 1, 2026; current fixed rate of 5.50% 18
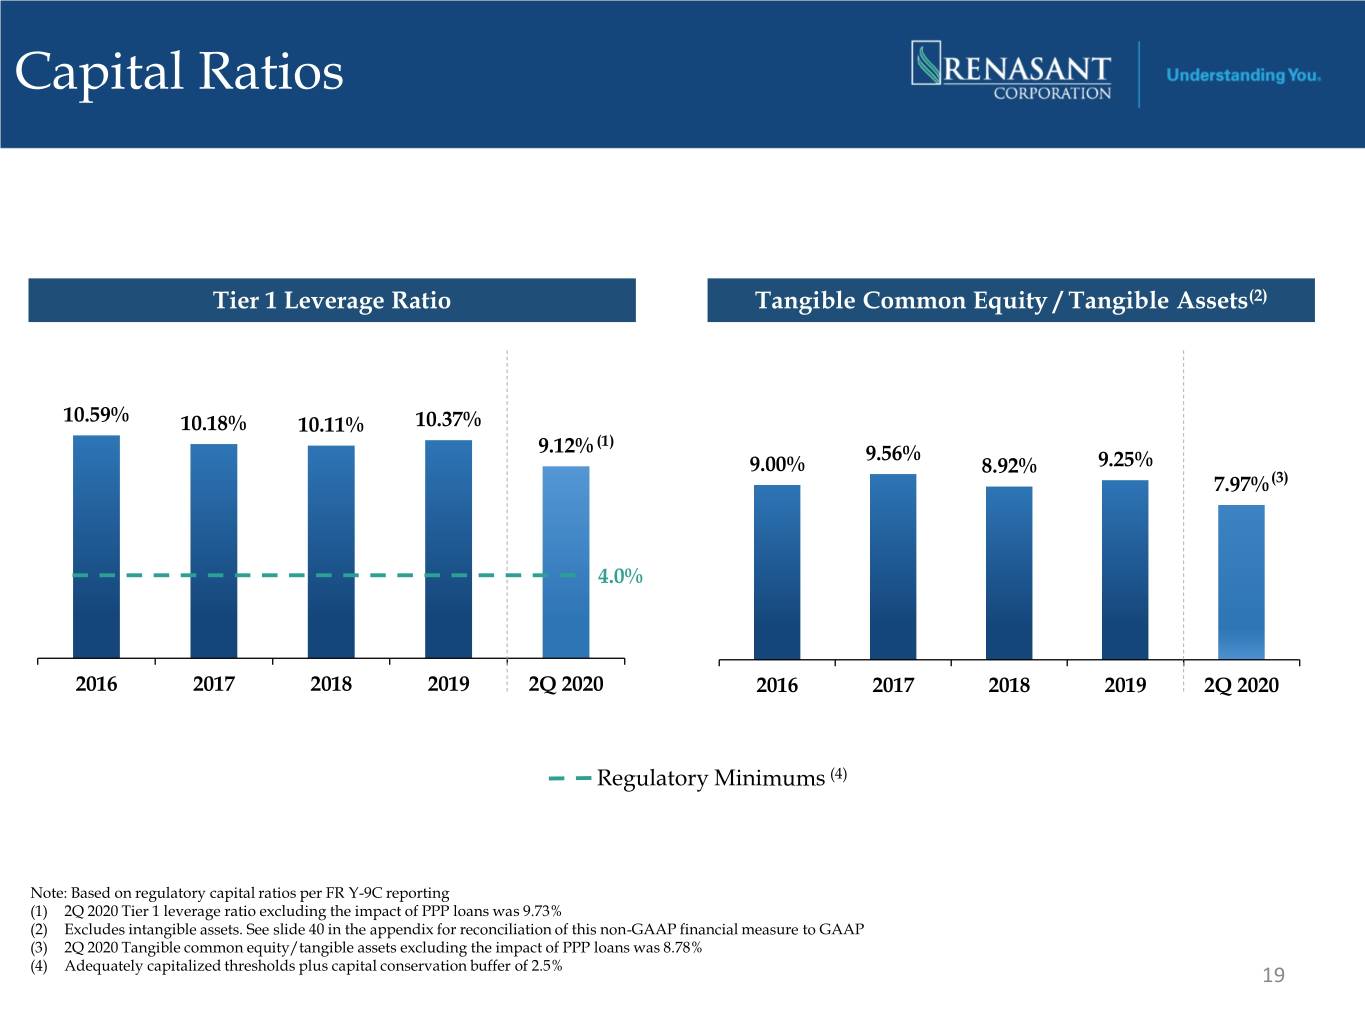
Capital Ratios Tier 1 Leverage Ratio Tangible Common Equity / Tangible Assets(2) $0 (2) 16.00% $0 14.00% $0 10.59% 10.18% 10.11% 10.37% 12.00% $0 (1) 9.12% 9.56% 10.00% 9.00% 8.92% 9.25% (3) $0 7.97% 8.00% $0 6.00% $0 4.0% 4.00% $0 2.00% $0 0.00% 2016 2017 2018 2019 2Q 2020 2016 2017 2018 2019 2Q 2020 Regulatory Minimums (4) Note: Based on regulatory capital ratios per FR Y-9C reporting (1) 2Q 2020 Tier 1 leverage ratio excluding the impact of PPP loans was 9.73% (2) Excludes intangible assets. See slide 40 in the appendix for reconciliation of this non-GAAP financial measure to GAAP (3) 2Q 2020 Tangible common equity/tangible assets excluding the impact of PPP loans was 8.78% (4) Adequately capitalized thresholds plus capital conservation buffer of 2.5% 19
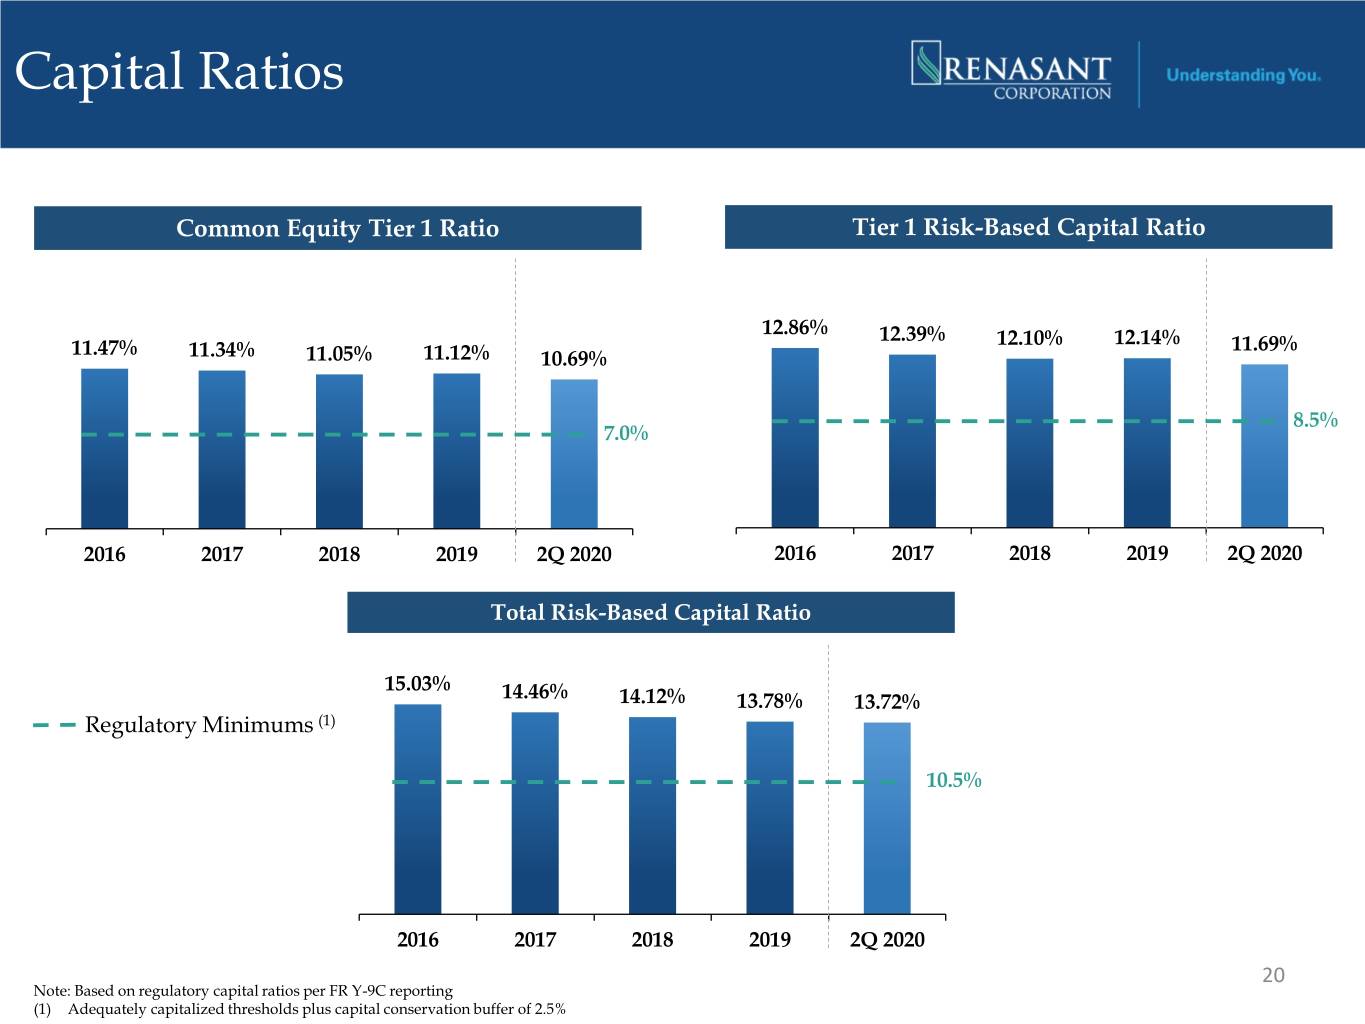
Capital Ratios Common Equity Tier 1 Ratio Tier 1 Risk-Based Capital Ratio $0 $0 $0 $0 $0 $0 $0 $0 12.86% 12.39% 12.14% 11.47% 12.10% 11.69% 11.34% $0 $0 11.05% 11.12% 10.69% $0 $0 $0 $0 8.5% 7.0% $0 $0 $0 $0 $0 $0 $0 $0 2016 2017 2018 2019 2Q 2020 2016 2017 2018 2019 2Q 2020 Total Risk-Based Capital Ratio $0 $0 $0 15.03% 14.46% 14.12% 13.78% 13.72% Regulatory Minimums (1) $0 $0 $0 10.5% $0 $0 $0 $0 $0 2016 2017 2018 2019 2Q 2020 20 Note: Based on regulatory capital ratios per FR Y-9C reporting (1) Adequately capitalized thresholds plus capital conservation buffer of 2.5%
Loan Portfolio and Credit
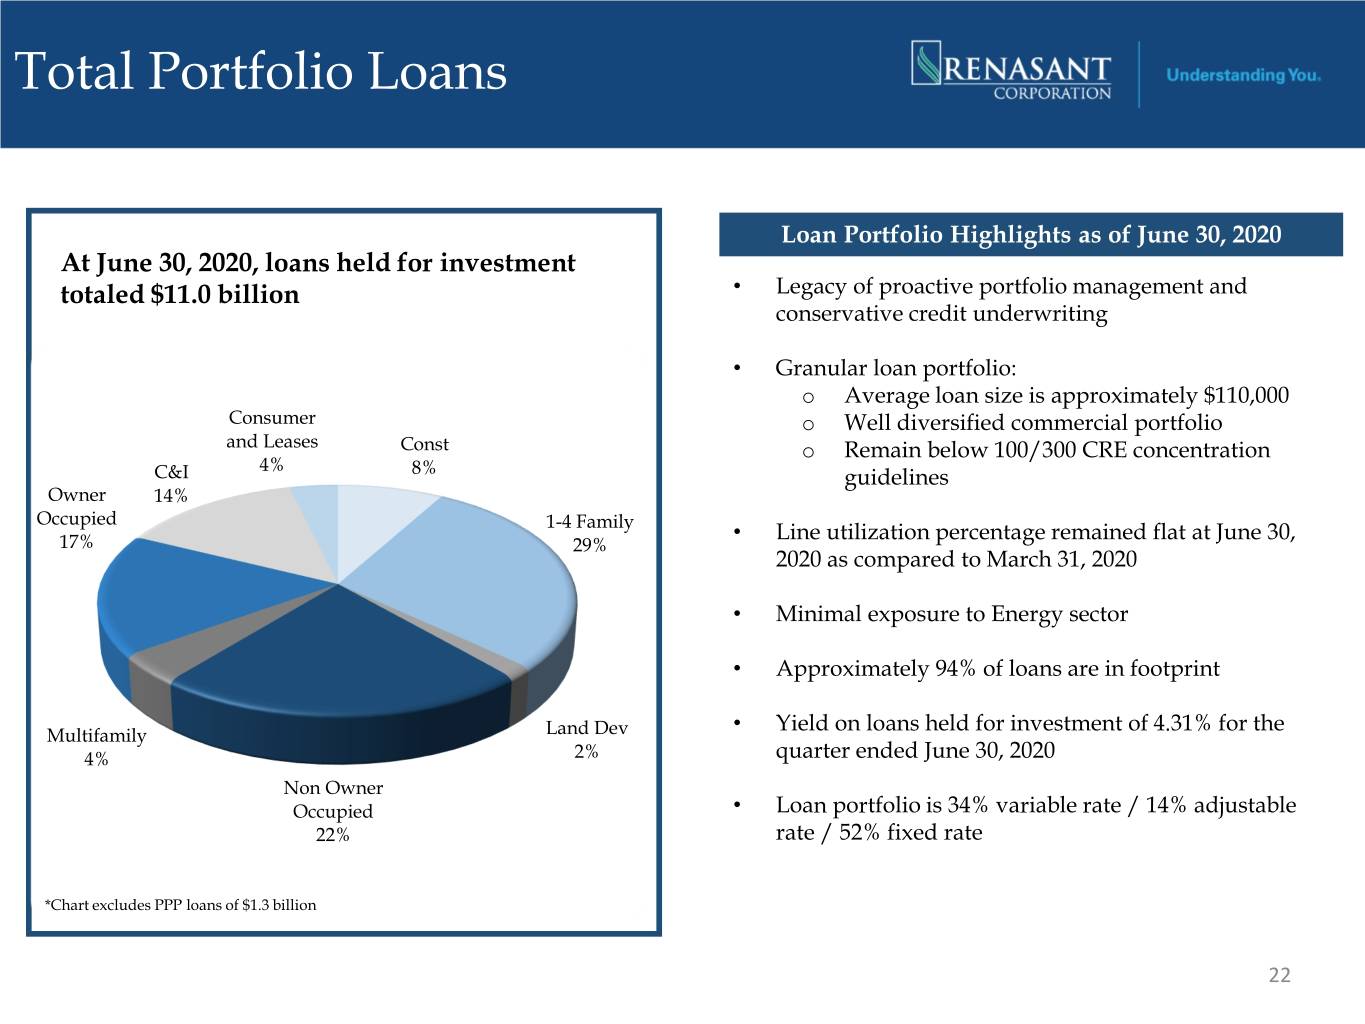
Total Portfolio Loans Loan Portfolio Highlights as of June 30, 2020 At June 30, 2020, loans held for investment totaled $11.0 billion • Legacy of proactive portfolio management and conservative credit underwriting • Granular loan portfolio: o Average loan size is approximately $110,000 Consumer o Well diversified commercial portfolio and Leases Const o Remain below 100/300 CRE concentration 4% C&I 8% guidelines Owner 14% Occupied 1-4 Family • Line utilization percentage remained flat at June 30, 17% 29% 2020 as compared to March 31, 2020 • Minimal exposure to Energy sector • Approximately 94% of loans are in footprint • Yield on loans held for investment of 4.31% for the Multifamily Land Dev 4% 2% quarter ended June 30, 2020 Non Owner Occupied • Loan portfolio is 34% variable rate / 14% adjustable 22% rate / 52% fixed rate *Chart excludes PPP loans of $1.3 billion 22
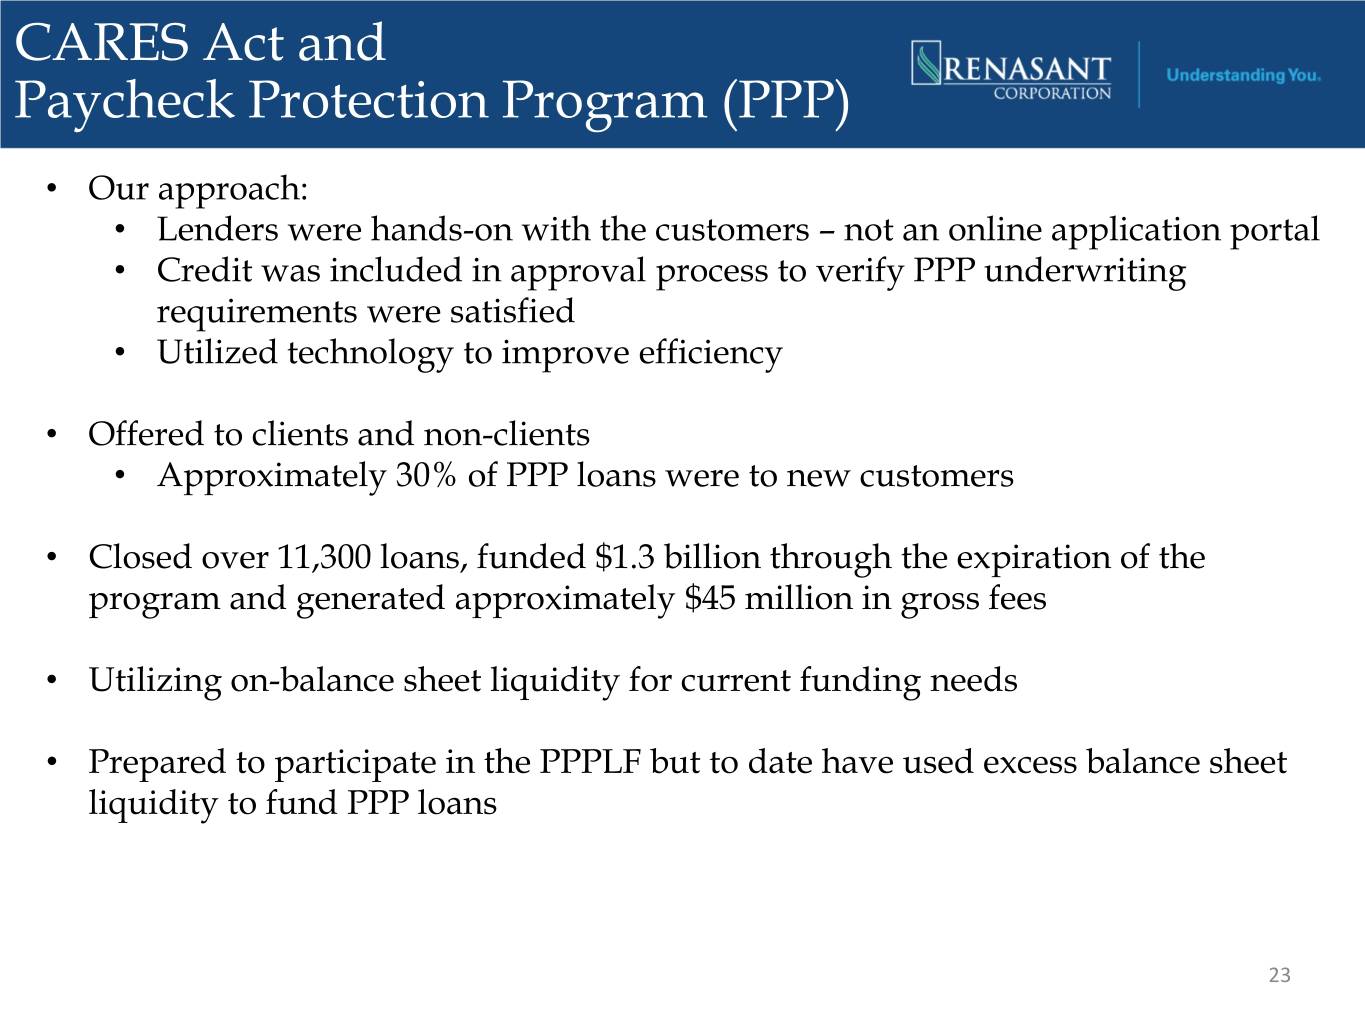
CARES Act and Paycheck Protection Program (PPP) • Our approach: • Lenders were hands-on with the customers – not an online application portal • Credit was included in approval process to verify PPP underwriting requirements were satisfied • Utilized technology to improve efficiency • Offered to clients and non-clients • Approximately 30% of PPP loans were to new customers • Closed over 11,300 loans, funded $1.3 billion through the expiration of the program and generated approximately $45 million in gross fees • Utilizing on-balance sheet liquidity for current funding needs • Prepared to participate in the PPPLF but to date have used excess balance sheet liquidity to fund PPP loans 23
Historically Strong Credit Culture Credit Culture: • Proven track record of superior asset quality metrics • Centrally managed credit process • Geographically dispersed credit officers who work closely with the lenders to make credit decisions Portfolio Management: • Collaborative loan monitoring process involving lenders, credit underwriters and credit officers • Continued enhancement to drive more granularity around asset quality reporting and detailed credit analytics • Experienced and engaged internal loan review department that reports directly to the Audit Committee Asset Resolution: • Active participation by Executive Management in monthly Problem Asset Resolution Committee to monitor and manage asset quality • Veteran special assets and work out teams 24
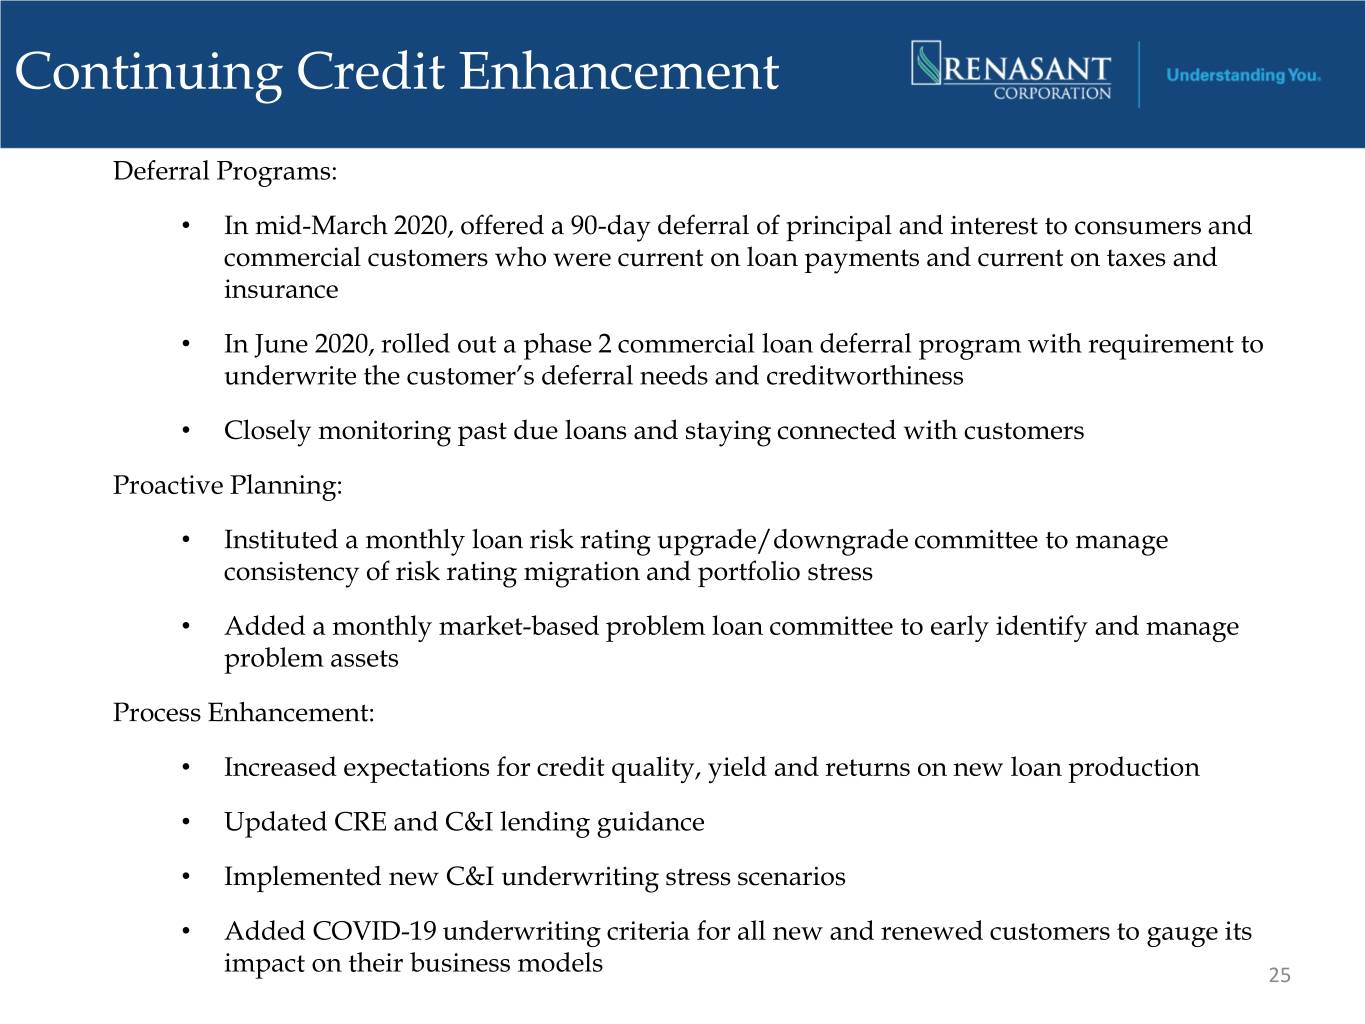
Continuing Credit Enhancement Deferral Programs: • In mid-March 2020, offered a 90-day deferral of principal and interest to consumers and commercial customers who were current on loan payments and current on taxes and insurance • In June 2020, rolled out a phase 2 commercial loan deferral program with requirement to underwrite the customer’s deferral needs and creditworthiness • Closely monitoring past due loans and staying connected with customers Proactive Planning: • Instituted a monthly loan risk rating upgrade/downgrade committee to manage consistency of risk rating migration and portfolio stress • Added a monthly market-based problem loan committee to early identify and manage problem assets Process Enhancement: • Increased expectations for credit quality, yield and returns on new loan production • Updated CRE and C&I lending guidance • Implemented new C&I underwriting stress scenarios • Added COVID-19 underwriting criteria for all new and renewed customers to gauge its impact on their business models 25
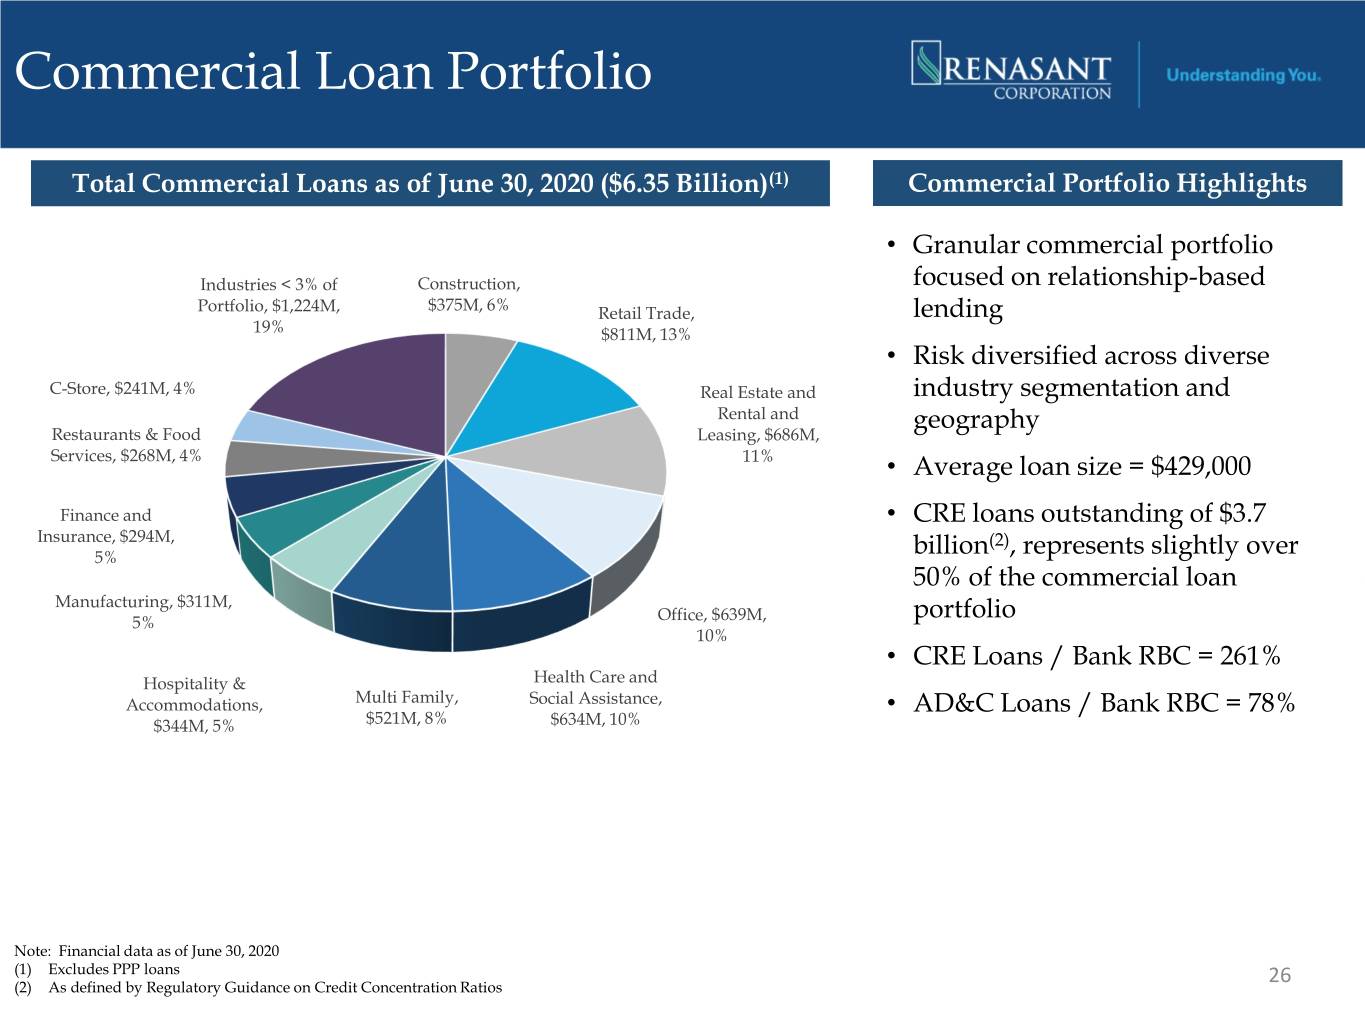
Commercial Loan Portfolio Total Commercial Loans as of June 30, 2020 ($6.35 Billion)(1) Commercial Portfolio Highlights • Granular commercial portfolio Industries < 3% of Construction, focused on relationship-based Portfolio, $1,224M, $375M, 6% Retail Trade, lending 19% $811M, 13% • Risk diversified across diverse C-Store, $241M, 4% Real Estate and industry segmentation and Rental and geography Restaurants & Food Leasing, $686M, Services, $268M, 4% 11% • Average loan size = $429,000 Finance and • CRE loans outstanding of $3.7 Insurance, $294M, (2) 5% billion , represents slightly over 50% of the commercial loan Manufacturing, $311M, 5% Office, $639M, portfolio 10% • CRE Loans / Bank RBC = 261% Hospitality & Health Care and Accommodations, Multi Family, Social Assistance, • AD&C Loans / Bank RBC = 78% $344M, 5% $521M, 8% $634M, 10% Note: Financial data as of June 30, 2020 (1) Excludes PPP loans 26 (2) As defined by Regulatory Guidance on Credit Concentration Ratios
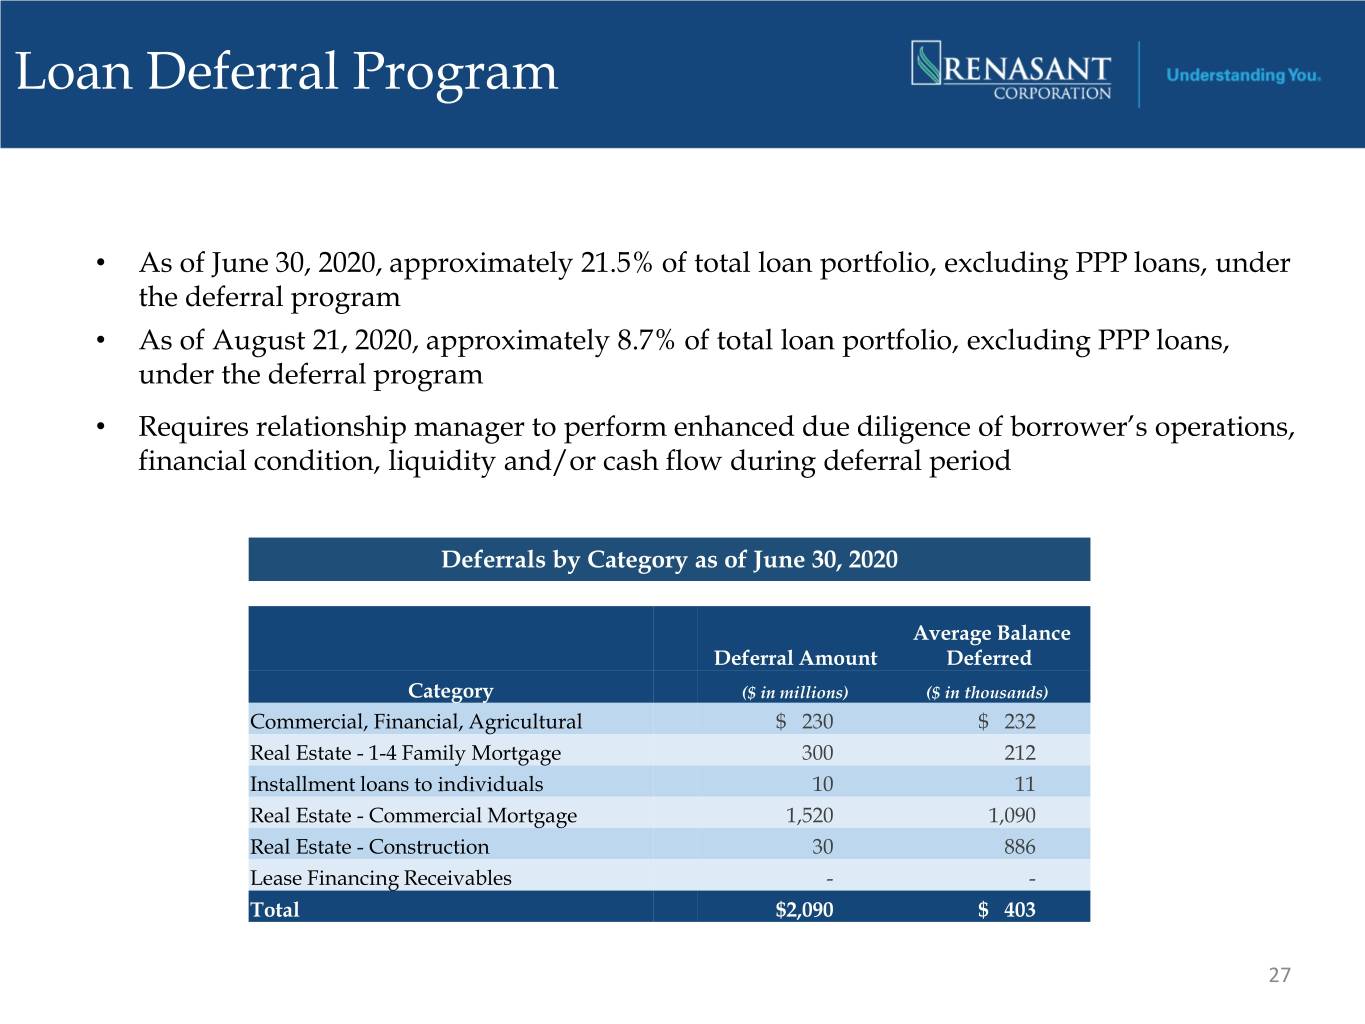
Loan Deferral Program • As of June 30, 2020, approximately 21.5% of total loan portfolio, excluding PPP loans, under the deferral program • As of August 21, 2020, approximately 8.7% of total loan portfolio, excluding PPP loans, under the deferral program • Requires relationship manager to perform enhanced due diligence of borrower’s operations, financial condition, liquidity and/or cash flow during deferral period Deferrals by Category as of June 30, 2020 Average Balance Deferral Amount Deferred Category ($ in millions) ($ in thousands) Commercial, Financial, Agricultural $ 230 $ 232 Real Estate - 1-4 Family Mortgage 300 212 Installment loans to individuals 10 11 Real Estate - Commercial Mortgage 1,520 1,090 Real Estate - Construction 30 886 Lease Financing Receivables - - Total $2,090 $ 403 27
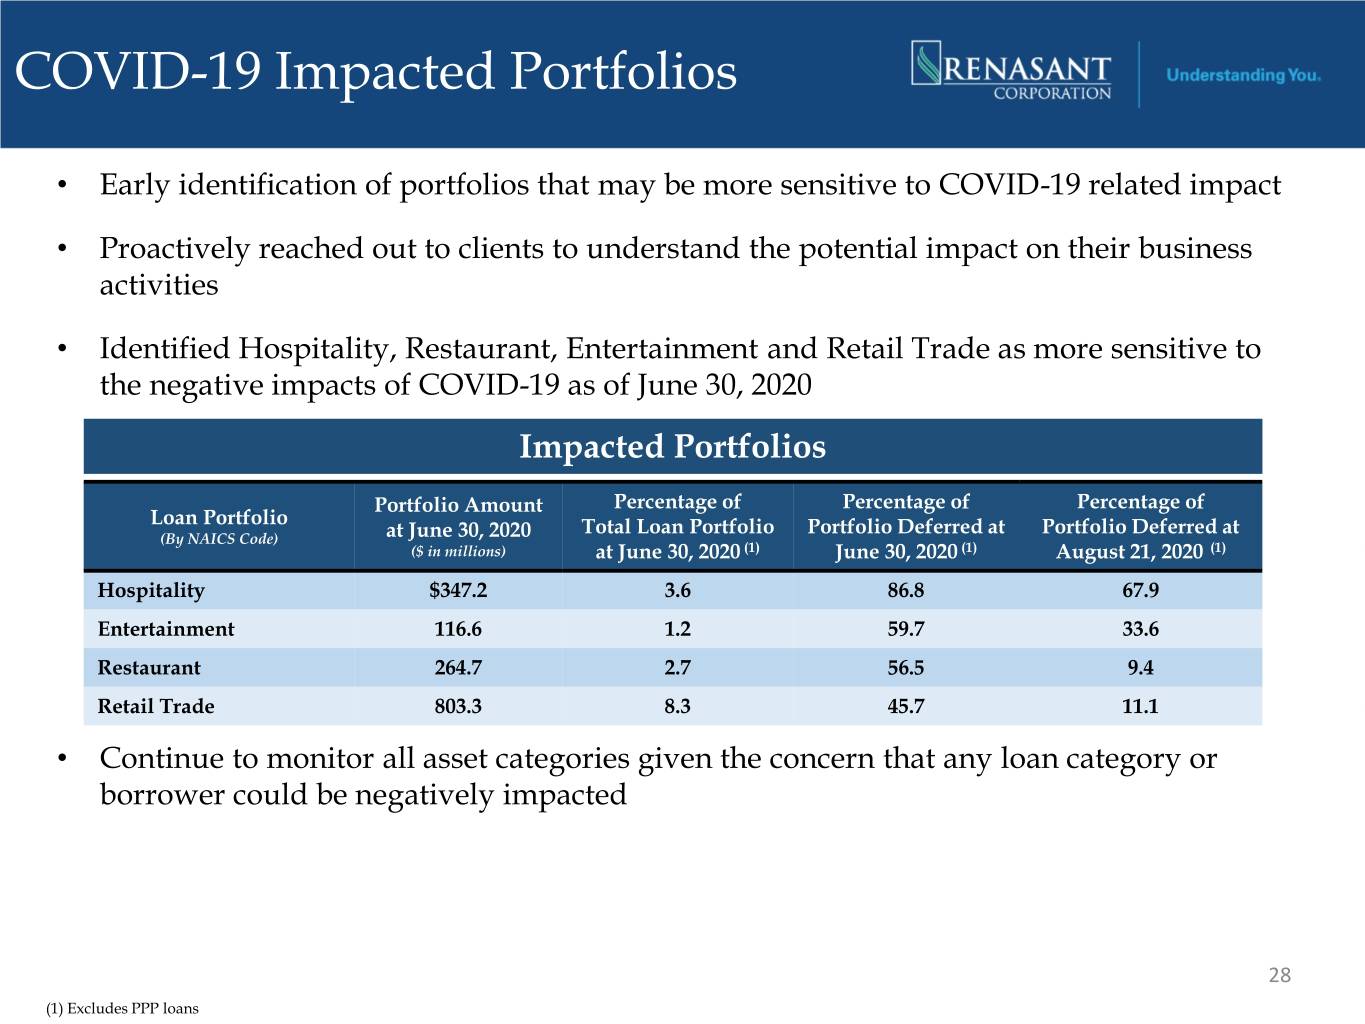
COVID-19 Impacted Portfolios • Early identification of portfolios that may be more sensitive to COVID-19 related impact • Proactively reached out to clients to understand the potential impact on their business activities • Identified Hospitality, Restaurant, Entertainment and Retail Trade as more sensitive to the negative impacts of COVID-19 as of June 30, 2020 Impacted Portfolios Portfolio Amount Percentage of Percentage of Percentage of Loan Portfolio Total Loan Portfolio Portfolio Deferred at Portfolio Deferred at (By NAICS Code) at June 30, 2020 ($ in millions) at June 30, 2020 (1) June 30, 2020 (1) August 21, 2020 (1) Hospitality $347.2 3.6 86.8 67.9 Entertainment 116.6 1.2 59.7 33.6 Restaurant 264.7 2.7 56.5 9.4 Retail Trade 803.3 8.3 45.7 11.1 • Continue to monitor all asset categories given the concern that any loan category or borrower could be negatively impacted 28 (1) Excludes PPP loans

Impacted Industries Hospitality Portfolio by Flag(1) Entertainment Portfolio by Type(1) Other Independent National 9% Golf Flags Other Courses 8% Marriott 24% 25% Wyndham 32% 3% Holiday Inn (IHG) 14% Fitness Centers Theaters 16% 12% Sports Marinas Facilities/Instruction Hilton 19% 4% 34% • Entertainment represents 1.2% of total loans • Hospitality represents 3.6% of total loans • Average loan size approximates $560,000 • Average loan size approximates $2.6 million • Approximately 88% of the entertainment • Weighted average LTV approximates 59% portfolio is secured by real estate 29 (1) As of June 30, 2020, excludes PPP loans
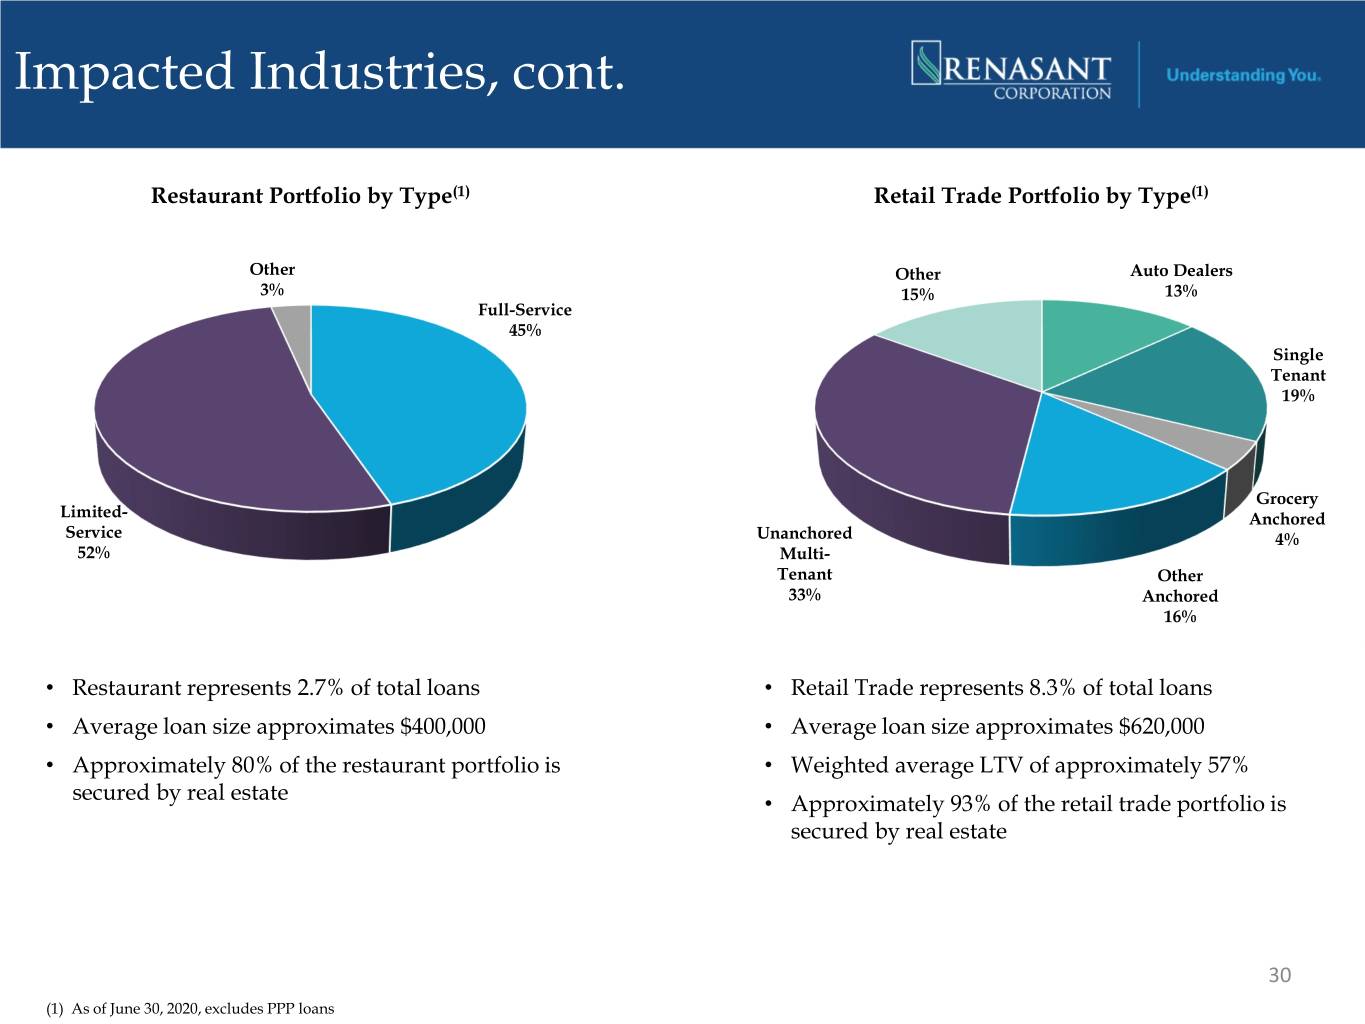
Impacted Industries, cont. Restaurant Portfolio by Type(1) Retail Trade Portfolio by Type(1) Other Other Auto Dealers 3% 15% 13% Full-Service 45% Single Tenant 19% Grocery Limited- Anchored Service Unanchored 4% 52% Multi- Tenant Other 33% Anchored 16% • Restaurant represents 2.7% of total loans • Retail Trade represents 8.3% of total loans • Average loan size approximates $400,000 • Average loan size approximates $620,000 • Approximately 80% of the restaurant portfolio is • Weighted average LTV of approximately 57% secured by real estate • Approximately 93% of the retail trade portfolio is secured by real estate 30 (1) As of June 30, 2020, excludes PPP loans
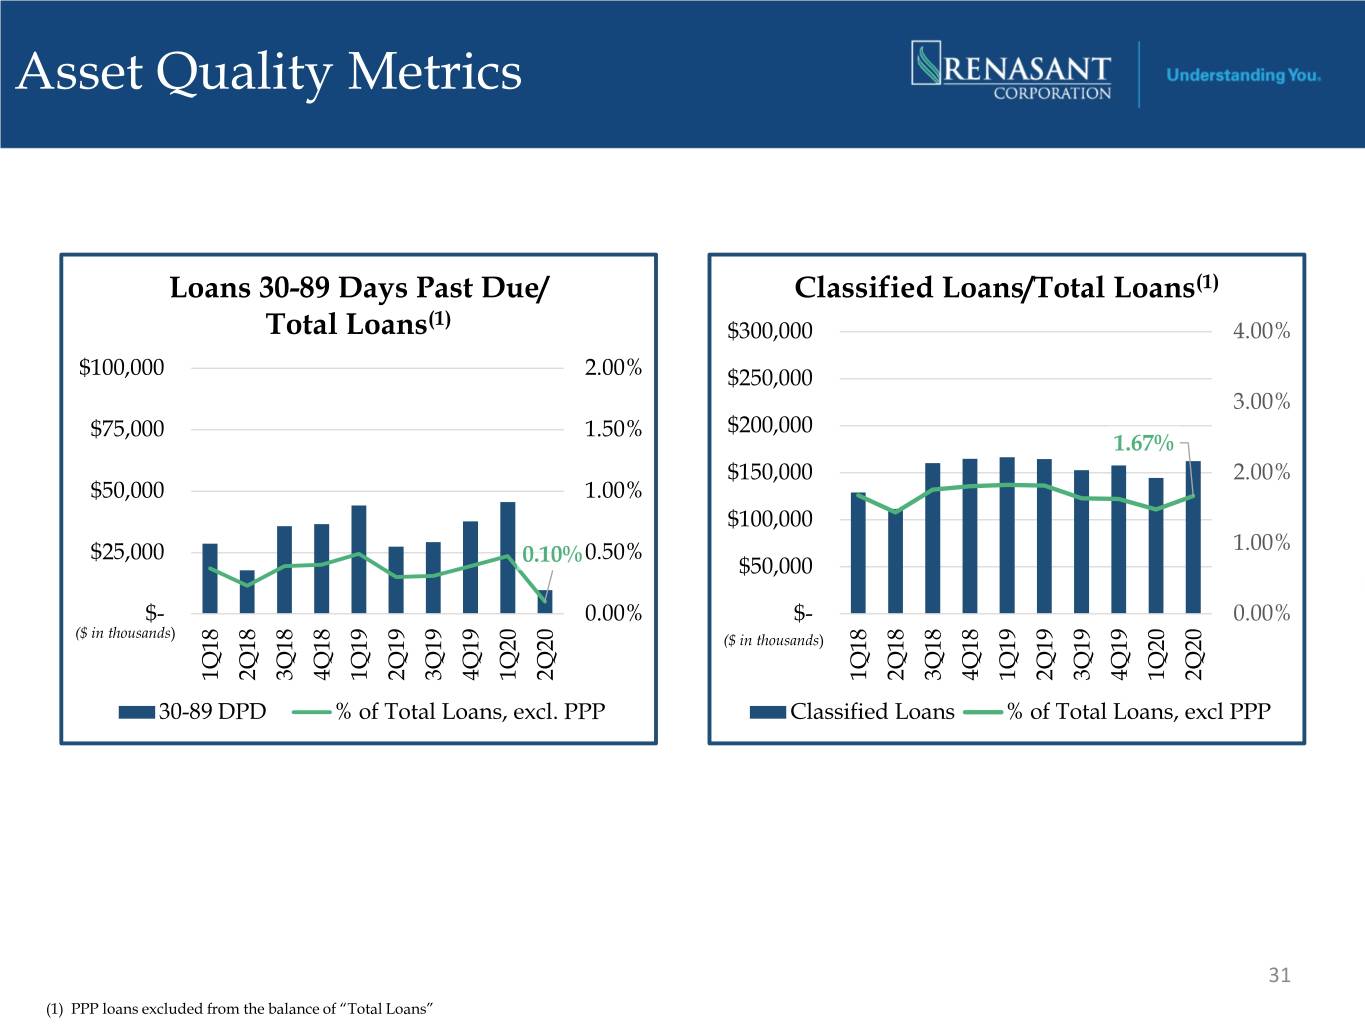
Asset Quality Metrics Loans 30-89 Days Past Due/ Classified Loans/Total Loans(1) (1) Total Loans $300,000 4.00% $100,000 2.00% $250,000 3.00% $75,000 1.50% $200,000 1.67% $150,000 2.00% $50,000 1.00% $100,000 1.00% $25,000 0.10%0.50% $50,000 $- 0.00% $- 0.00% ($ in thousands) ($ in thousands) 1Q18 1Q18 2Q18 3Q18 4Q18 1Q19 2Q19 3Q19 4Q19 1Q20 2Q20 2Q18 3Q18 4Q18 1Q19 2Q19 3Q19 4Q19 1Q20 2Q20 30-89 DPD % of Total Loans, excl. PPP Classified Loans % of Total Loans, excl PPP 31 (1) PPP loans excluded from the balance of “Total Loans”
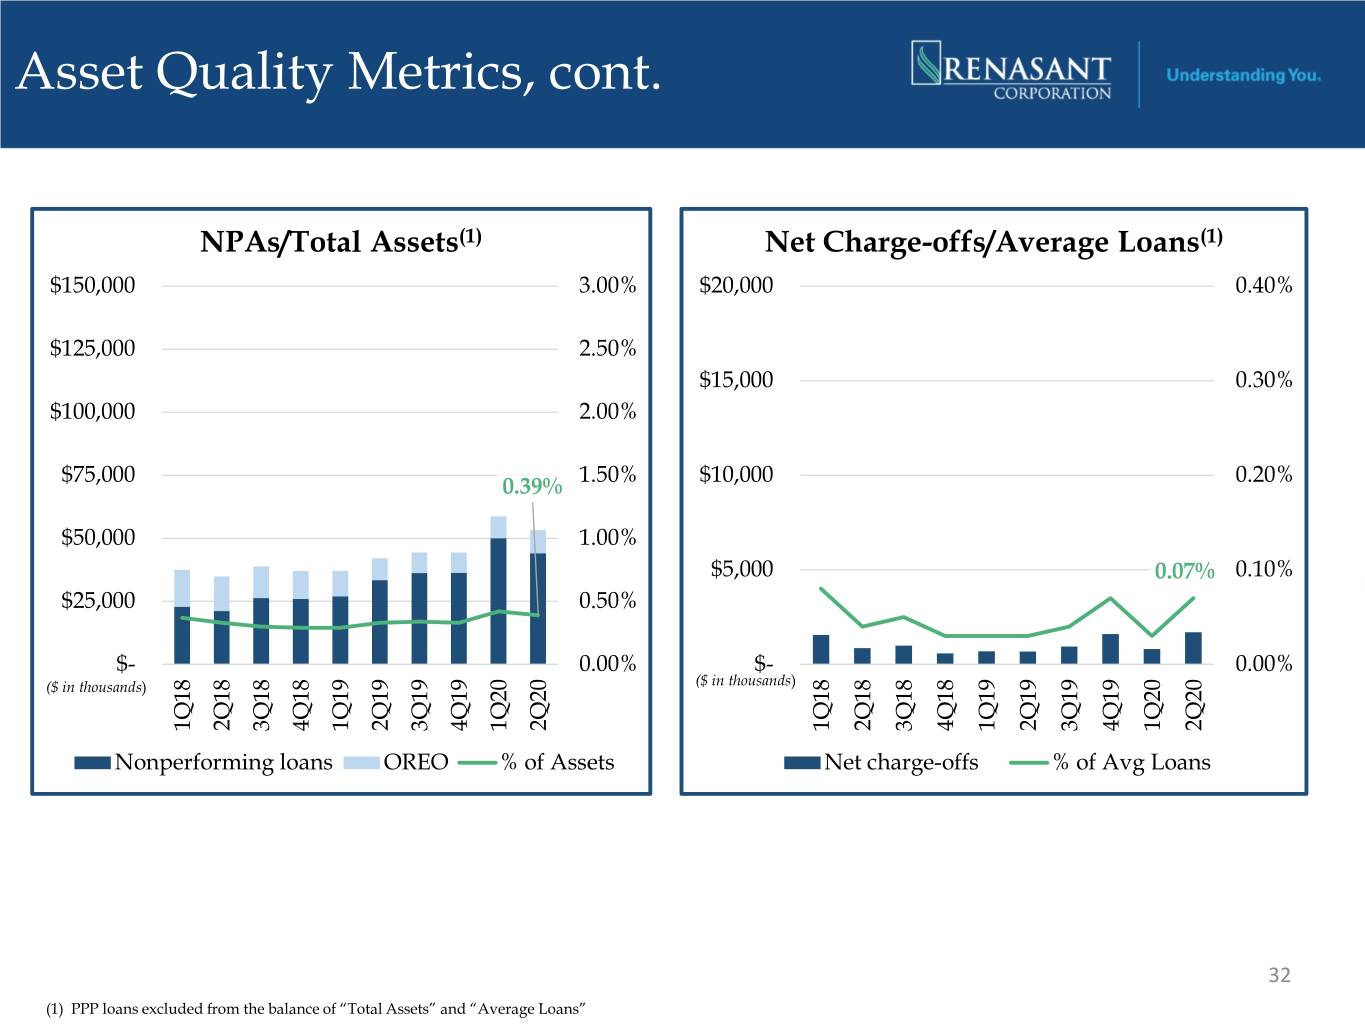
Asset Quality Metrics, cont. NPAs/Total Assets(1) Net Charge-offs/Average Loans(1) $150,000 3.00% $20,000 0.40% $125,000 2.50% $15,000 0.30% $100,000 2.00% $75,000 1.50% $10,000 0.20% 0.39% $50,000 1.00% $5,000 0.07% 0.10% $25,000 0.50% $- 0.00% $- 0.00% ($ in thousands) ($ in thousands) 2Q18 1Q18 1Q18 3Q18 4Q18 1Q19 2Q19 3Q19 4Q19 1Q20 2Q20 2Q18 3Q18 4Q18 1Q19 2Q19 3Q19 4Q19 1Q20 2Q20 Nonperforming loans OREO % of Assets Net charge-offs % of Avg Loans 32 (1) PPP loans excluded from the balance of “Total Assets” and “Average Loans”
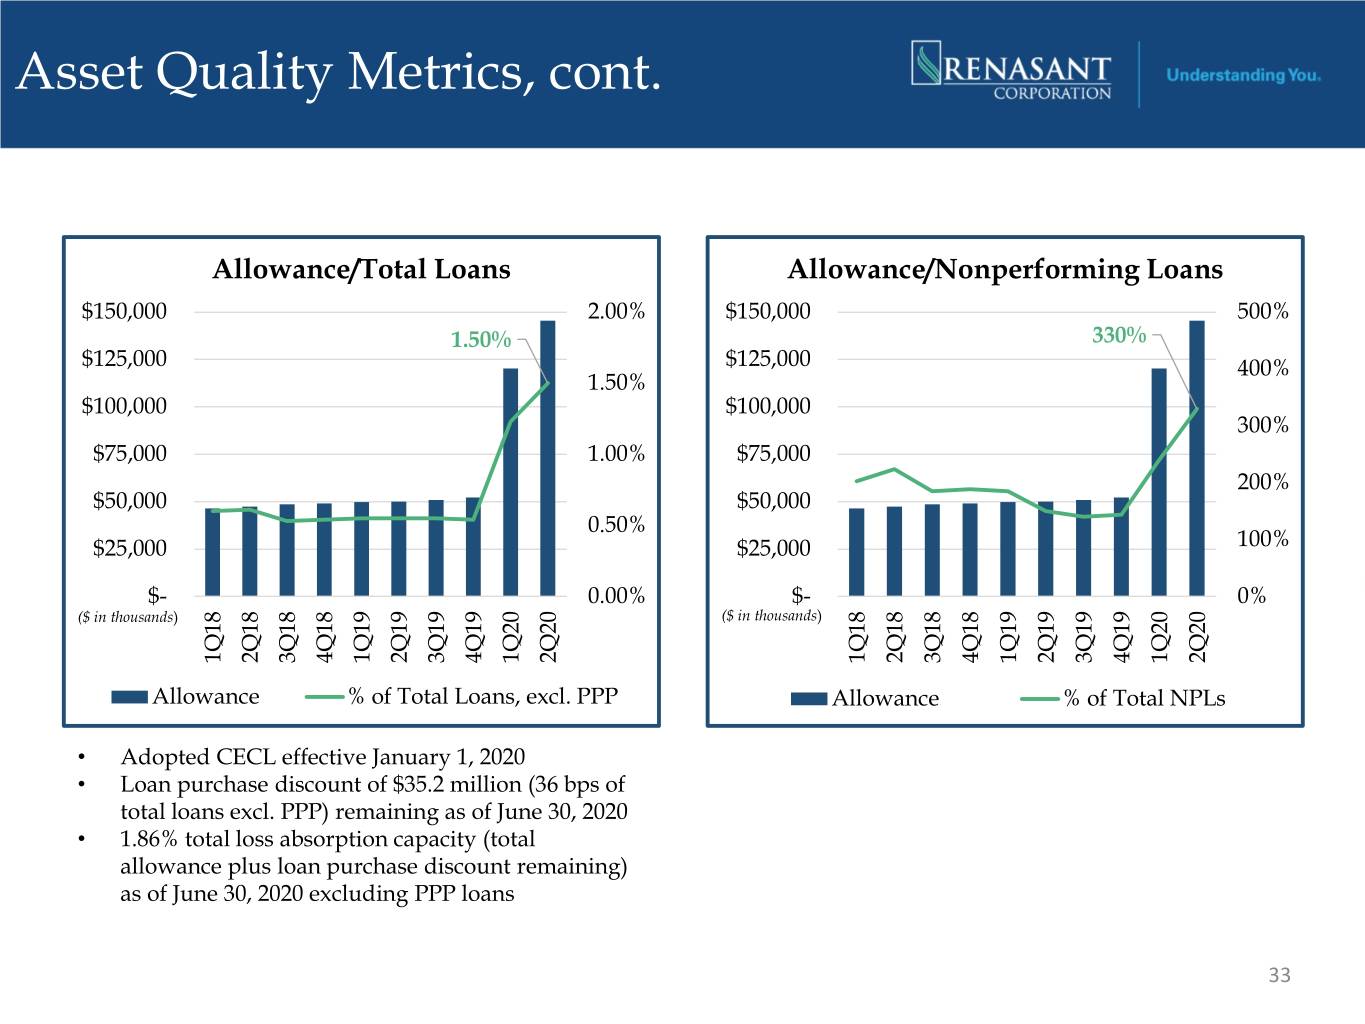
Asset Quality Metrics, cont. Allowance/Total Loans Allowance/Nonperforming Loans $150,000 2.00% $150,000 500% 1.50% 330% $125,000 $125,000 400% 1.50% $100,000 $100,000 300% $75,000 1.00% $75,000 200% $50,000 $50,000 0.50% $25,000 $25,000 100% $- 0.00% $- 0% ($ in thousands) ($ in thousands) 1Q18 2Q18 3Q18 4Q18 1Q19 2Q19 3Q19 4Q19 1Q20 2Q20 1Q18 2Q18 3Q18 4Q18 1Q19 2Q19 3Q19 4Q19 1Q20 2Q20 Allowance % of Total Loans, excl. PPP Allowance % of Total NPLs • Adopted CECL effective January 1, 2020 • Loan purchase discount of $35.2 million (36 bps of total loans excl. PPP) remaining as of June 30, 2020 • 1.86% total loss absorption capacity (total allowance plus loan purchase discount remaining) as of June 30, 2020 excluding PPP loans 33
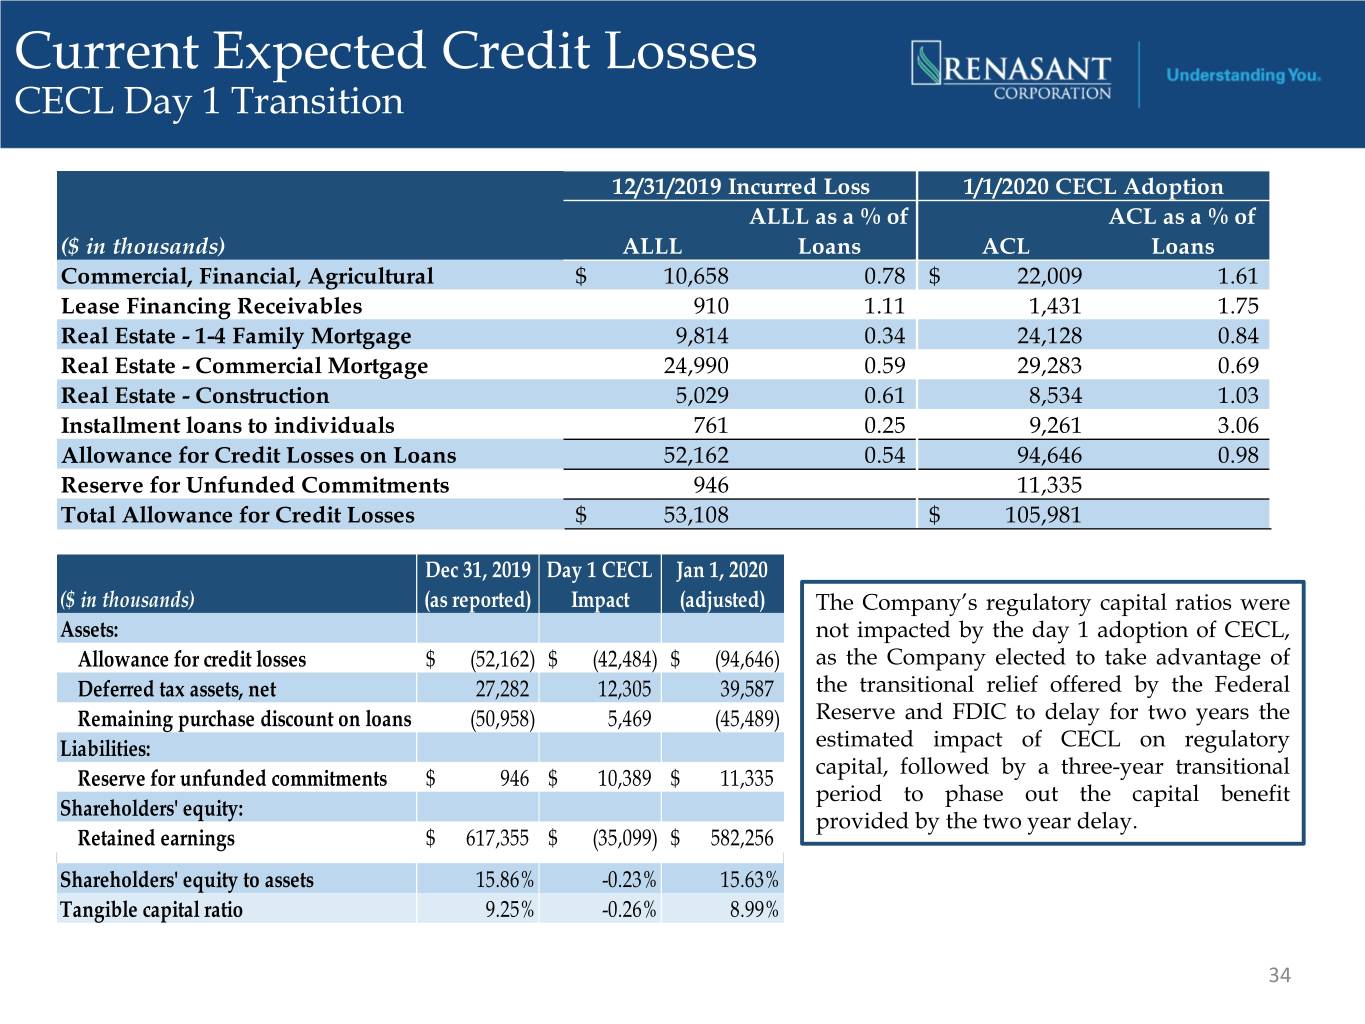
Current Expected Credit Losses CECL Day 1 Transition 12/31/2019 Incurred Loss 1/1/2020 CECL Adoption ALLL as a % of ACL as a % of ($ in thousands) ALLL Loans ACL Loans Commercial, Financial, Agricultural $ 10,658 0.78 $ 22,009 1.61 Lease Financing Receivables 910 1.11 1,431 1.75 Real Estate - 1-4 Family Mortgage 9,814 0.34 24,128 0.84 Real Estate - Commercial Mortgage 24,990 0.59 29,283 0.69 Real Estate - Construction 5,029 0.61 8,534 1.03 Installment loans to individuals 761 0.25 9,261 3.06 Allowance for Credit Losses on Loans 52,162 0.54 94,646 0.98 Reserve for Unfunded Commitments 946 11,335 Total Allowance for Credit Losses $ 53,108 $ 105,981 Dec 31, 2019 Day 1 CECL Jan 1, 2020 ($ in thousands) (as reported) Impact (adjusted) The Company’s regulatory capital ratios were Assets: not impacted by the day 1 adoption of CECL, Allowance for credit losses $ (52,162) $ (42,484) $ (94,646) as the Company elected to take advantage of Deferred tax assets, net 27,282 12,305 39,587 the transitional relief offered by the Federal Remaining purchase discount on loans (50,958) 5,469 (45,489) Reserve and FDIC to delay for two years the Liabilities: estimated impact of CECL on regulatory capital, followed by a three-year transitional Reserve for unfunded commitments $ 946 $ 10,389 $ 11,335 period to phase out the capital benefit Shareholders' equity: provided by the two year delay. Retained earnings $ 617,355 $ (35,099) $ 582,256 Shareholders' equity to assets 15.86% -0.23% 15.63% Tangible capital ratio 9.25% -0.26% 8.99% 34
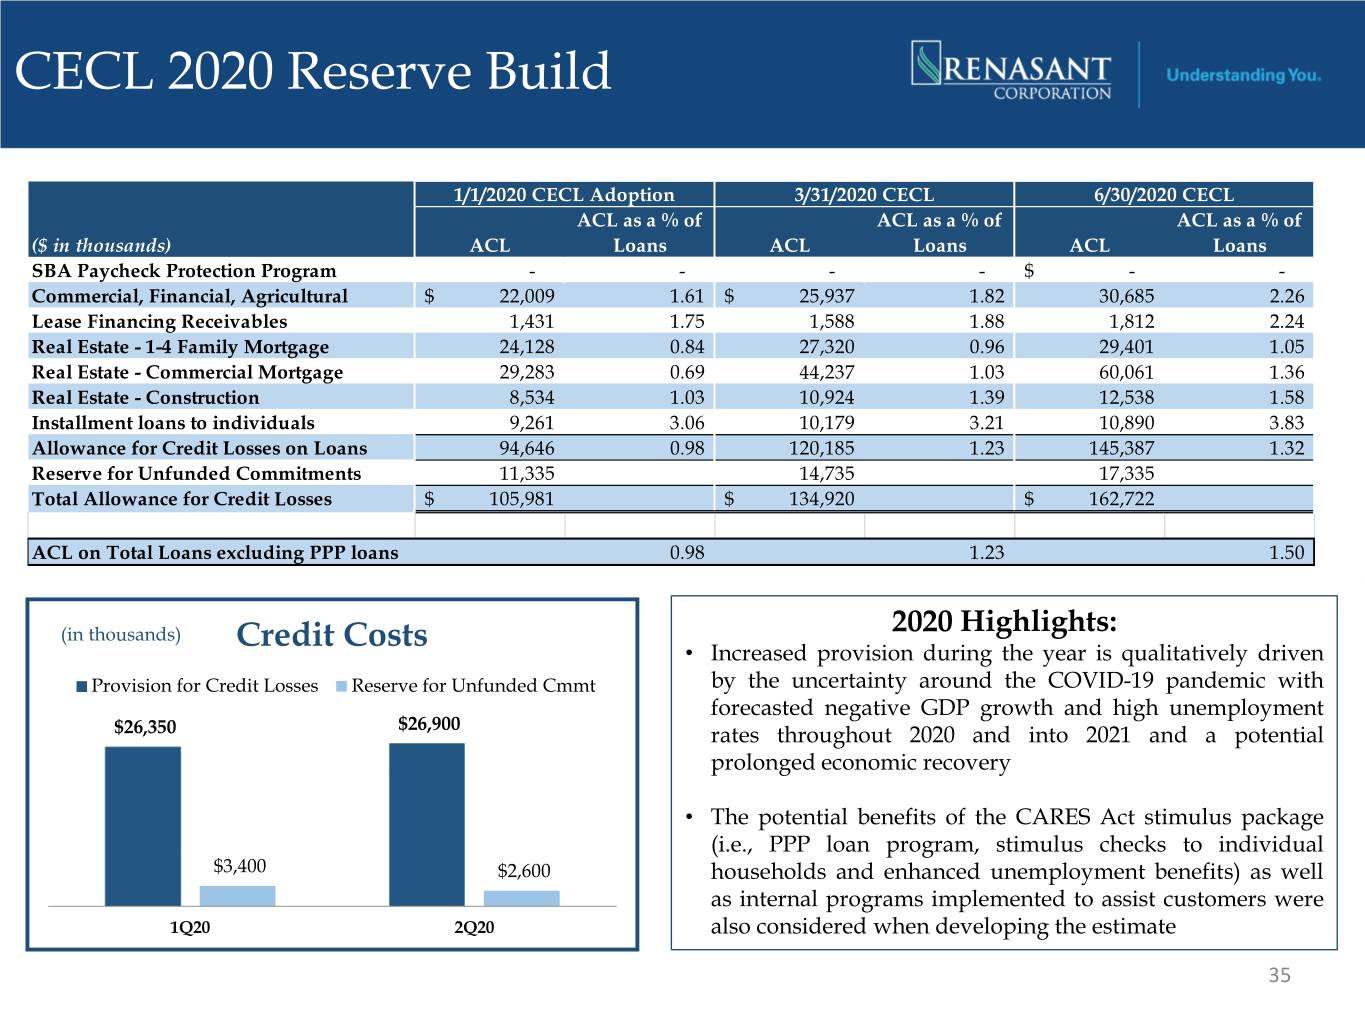
CECL 2020 Reserve Build 1/1/2020 CECL Adoption 3/31/2020 CECL 6/30/2020 CECL ACL as a % of ACL as a % of ACL as a % of ($ in thousands) ACL Loans ACL Loans ACL Loans SBA Paycheck Protection Program - - - - $ - - Commercial, Financial, Agricultural $ 22,009 1.61 $ 25,937 1.82 30,685 2.26 Lease Financing Receivables 1,431 1.75 1,588 1.88 1,812 2.24 Real Estate - 1-4 Family Mortgage 24,128 0.84 27,320 0.96 29,401 1.05 Real Estate - Commercial Mortgage 29,283 0.69 44,237 1.03 60,061 1.36 Real Estate - Construction 8,534 1.03 10,924 1.39 12,538 1.58 Installment loans to individuals 9,261 3.06 10,179 3.21 10,890 3.83 Allowance for Credit Losses on Loans 94,646 0.98 120,185 1.23 145,387 1.32 Reserve for Unfunded Commitments 11,335 14,735 17,335 Total Allowance for Credit Losses $ 105,981 $ 134,920 $ 162,722 ACL on Total Loans excluding PPP loans 0.98 1.23 1.50 2020 Highlights: (in thousands) Credit Costs • Increased provision during the year is qualitatively driven Provision for Credit Losses Reserve for Unfunded Cmmt by the uncertainty around the COVID-19 pandemic with forecasted negative GDP growth and high unemployment $26,900 $26,350 rates throughout 2020 and into 2021 and a potential prolonged economic recovery • The potential benefits of the CARES Act stimulus package (i.e., PPP loan program, stimulus checks to individual $3,400 $2,600 households and enhanced unemployment benefits) as well as internal programs implemented to assist customers were 1Q20 2Q20 also considered when developing the estimate 35
Appendix
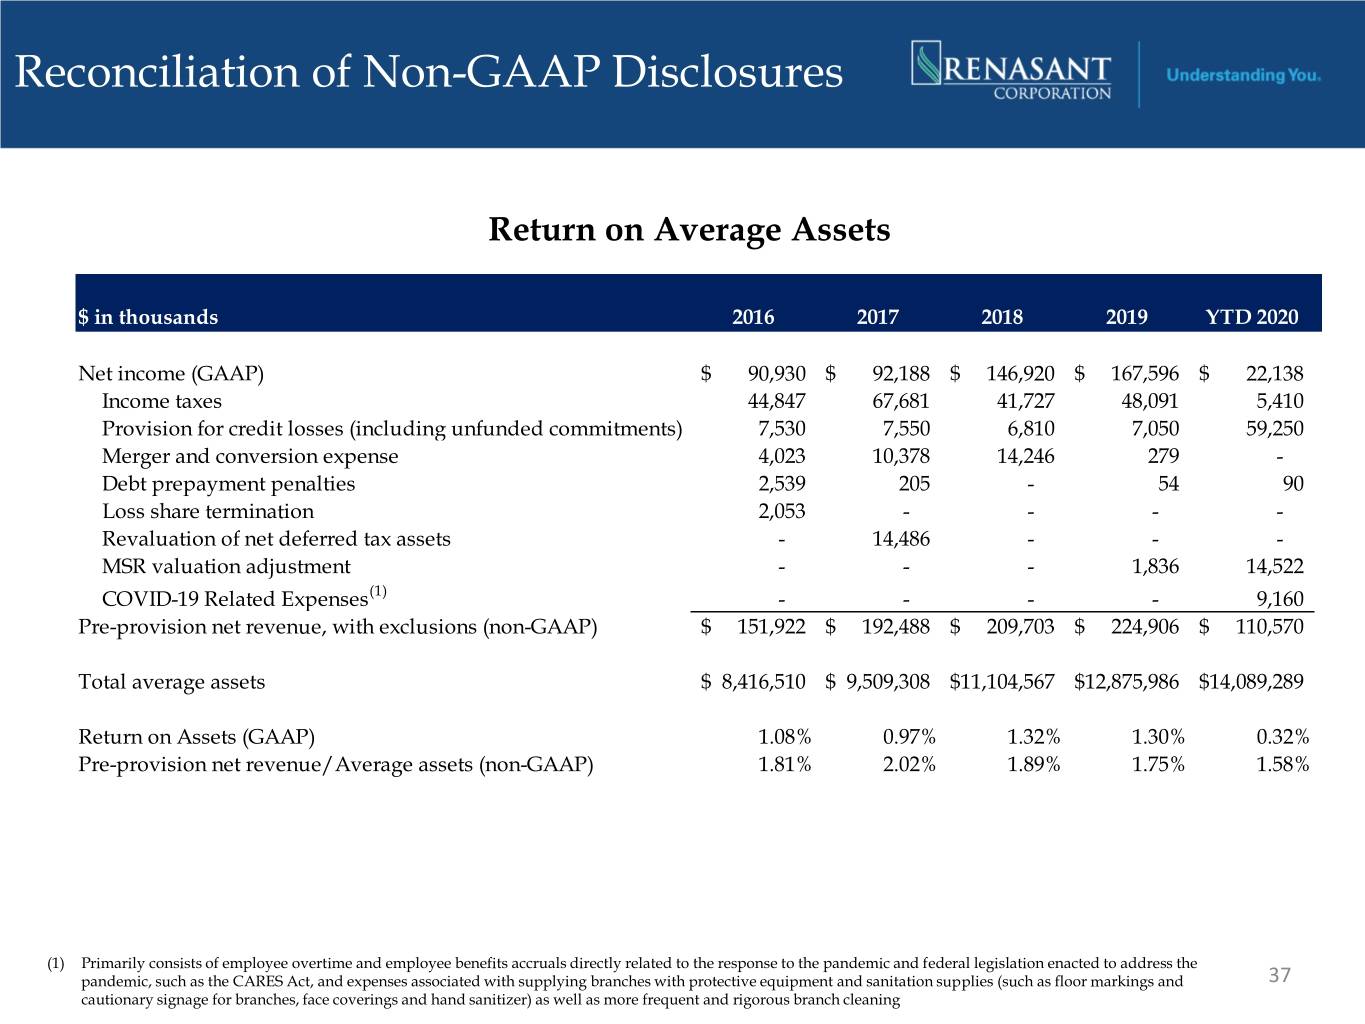
Reconciliation of Non-GAAP Disclosures Return on Average Assets $ in thousands 2016 2017 2018 2019 YTD 2020 Net income (GAAP) $ 90,930 $ 92,188 $ 146,920 $ 167,596 $ 22,138 Income taxes 44,847 67,681 41,727 48,091 5,410 Provision for credit losses (including unfunded commitments) 7,530 7,550 6,810 7,050 59,250 Merger and conversion expense 4,023 10,378 14,246 279 - Debt prepayment penalties 2,539 205 - 54 90 Loss share termination 2,053 - - - - Revaluation of net deferred tax assets - 14,486 - - - MSR valuation adjustment - - - 1,836 14,522 COVID-19 Related Expenses(1) - - - - 9,160 Pre-provision net revenue, with exclusions (non-GAAP) $ 151,922 $ 192,488 $ 209,703 $ 224,906 $ 110,570 Total average assets $ 8,416,510 $ 9,509,308 $11,104,567 $12,875,986 $14,089,289 Return on Assets (GAAP) 1.08% 0.97% 1.32% 1.30% 0.32% Pre-provision net revenue/Average assets (non-GAAP) 1.81% 2.02% 1.89% 1.75% 1.58% (1) Primarily consists of employee overtime and employee benefits accruals directly related to the response to the pandemic and federal legislation enacted to address the pandemic, such as the CARES Act, and expenses associated with supplying branches with protective equipment and sanitation supplies (such as floor markings and 37 cautionary signage for branches, face coverings and hand sanitizer) as well as more frequent and rigorous branch cleaning
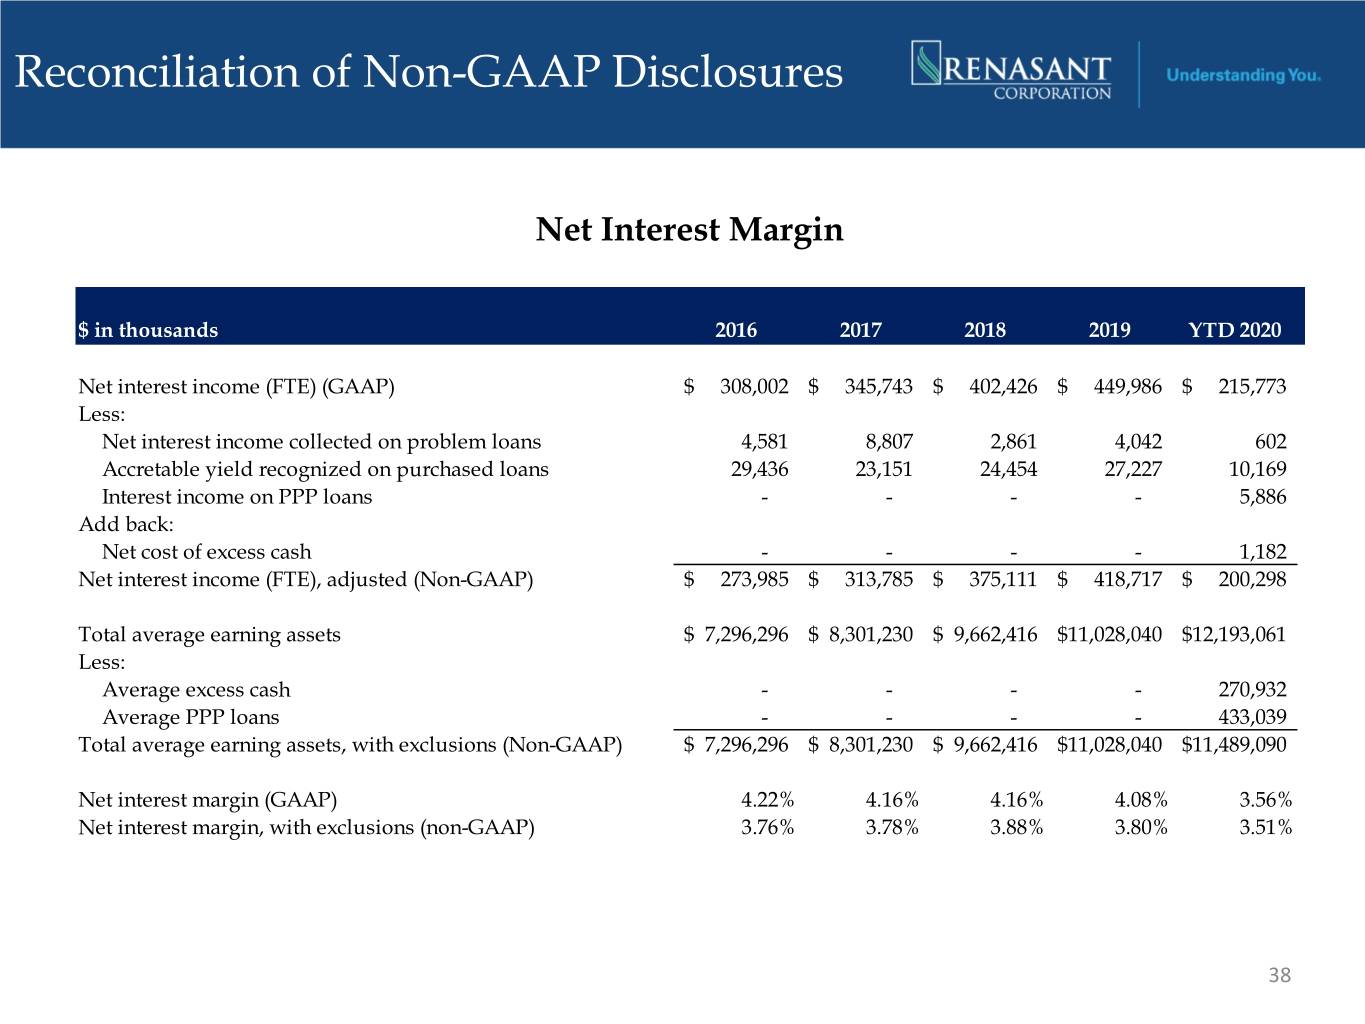
Reconciliation of Non-GAAP Disclosures Net Interest Margin $ in thousands 2016 2017 2018 2019 YTD 2020 Net interest income (FTE) (GAAP) $ 308,002 $ 345,743 $ 402,426 $ 449,986 $ 215,773 Less: Net interest income collected on problem loans 4,581 8,807 2,861 4,042 602 Accretable yield recognized on purchased loans 29,436 23,151 24,454 27,227 10,169 Interest income on PPP loans - - - - 5,886 Add back: Net cost of excess cash - - - - 1,182 Net interest income (FTE), adjusted (Non-GAAP) $ 273,985 $ 313,785 $ 375,111 $ 418,717 $ 200,298 Total average earning assets $ 7,296,296 $ 8,301,230 $ 9,662,416 $11,028,040 $12,193,061 Less: Average excess cash - - - - 270,932 Average PPP loans - - - - 433,039 Total average earning assets, with exclusions (Non-GAAP) $ 7,296,296 $ 8,301,230 $ 9,662,416 $11,028,040 $11,489,090 Net interest margin (GAAP) 4.22% 4.16% 4.16% 4.08% 3.56% Net interest margin, with exclusions (non-GAAP) 3.76% 3.78% 3.88% 3.80% 3.51% 38
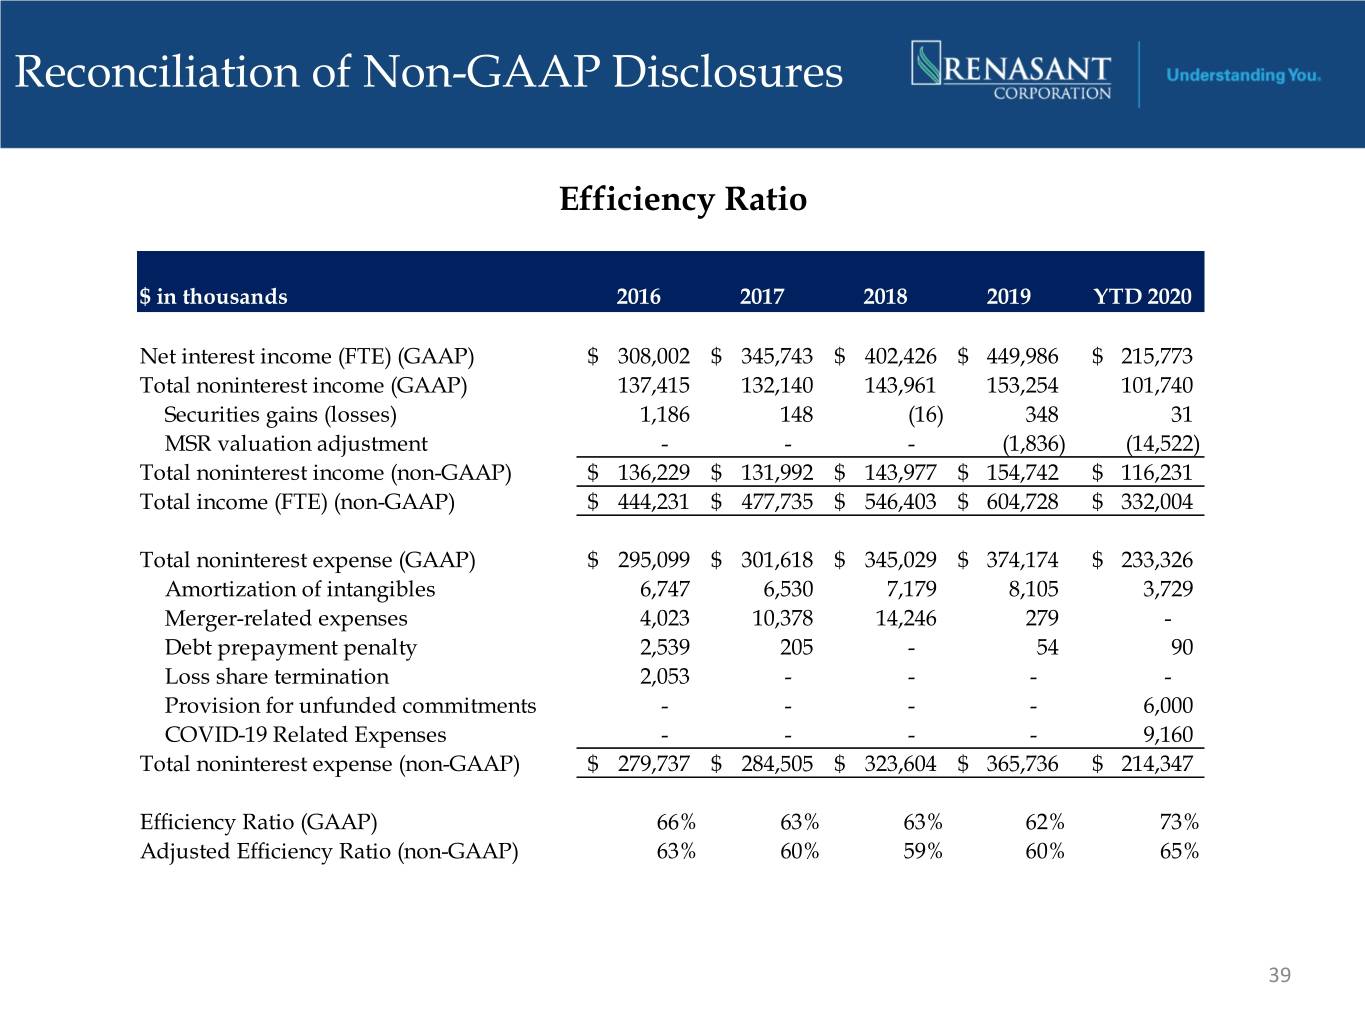
Reconciliation of Non-GAAP Disclosures Efficiency Ratio $ in thousands 2016 2017 2018 2019 YTD 2020 Net interest income (FTE) (GAAP) $ 308,002 $ 345,743 $ 402,426 $ 449,986 $ 215,773 Total noninterest income (GAAP) 137,415 132,140 143,961 153,254 101,740 Securities gains (losses) 1,186 148 (16) 348 31 MSR valuation adjustment - - - (1,836) (14,522) Total noninterest income (non-GAAP) $ 136,229 $ 131,992 $ 143,977 $ 154,742 $ 116,231 Total income (FTE) (non-GAAP) $ 444,231 $ 477,735 $ 546,403 $ 604,728 $ 332,004 Total noninterest expense (GAAP) $ 295,099 $ 301,618 $ 345,029 $ 374,174 $ 233,326 Amortization of intangibles 6,747 6,530 7,179 8,105 3,729 Merger-related expenses 4,023 10,378 14,246 279 - Debt prepayment penalty 2,539 205 - 54 90 Loss share termination 2,053 - - - - Provision for unfunded commitments - - - - 6,000 COVID-19 Related Expenses - - - - 9,160 Total noninterest expense (non-GAAP) $ 279,737 $ 284,505 $ 323,604 $ 365,736 $ 214,347 Efficiency Ratio (GAAP) 66% 63% 63% 62% 73% Adjusted Efficiency Ratio (non-GAAP) 63% 60% 59% 60% 65% 39

Reconciliation of Non-GAAP Disclosures Tangible Common Equity $ in thousands 2016 2017 2018 2019 YTD 2020 Actual shareholder's equity (GAAP) $ 1,232,883 $ 1,514,983 $ 2,043,913 $ 2,125,689 $ 2,082,946 Intangibles 494,608 635,556 977,793 976,943 973,214 Actual tangible shareholders' equity (non-GAAP) $ 738,275 $ 879,427 $ 1,066,120 $ 1,148,746 $ 1,109,732 Actual total assets (GAAP) $ 8,699,851 $ 9,829,981 $ 12,934,878 $ 13,400,618 $ 14,897,207 Intangibles 494,608 635,556 977,793 976,943 973,214 Actual tangible assets (non-GAAP) $ 8,205,243 $ 9,194,425 $ 11,957,085 $ 12,423,675 $ 13,923,993 PPP Loans - - - - 1,281,278 Actual tangible assets exc. PPP loans (non-GAAP) $ 8,205,243 $ 9,194,425 $ 11,957,085 $ 12,423,675 $ 12,642,715 Tangible Common Equity Ratio Shareholders' equity to (actual) assets (GAAP) 14.17% 15.41% 15.80% 15.86% 13.98% Effect of adjustment for intangible assets 5.17% 5.85% 6.88% 6.61% 6.01% Tangible common equity ratio (non-GAAP) 9.00% 9.56% 8.92% 9.25% 7.97% Effect of adjustment for PPP - - - - -0.81% Tangible comon equity ratio exc. PPP loans (non-GAAP) 9.00% 9.56% 8.92% 9.25% 8.78% 40
