Attached files
| file | filename |
|---|---|
| 8-K - 8-K - Old COPPER Company, Inc. | d56140d8k.htm |
Exhibit 99.1
J. C. PENNEY COMPANY, INC.
(Debtor-in-Possession)
CONSOLIDATED STATEMENTS OF OPERATIONS
(Unaudited)
| Month Ended | Six Months Ended | |||||||||||||||
| (In millions) | August 1, 2020 |
August 3, 2019 |
August 1, 2020 |
August 3, 2019 |
||||||||||||
| Total net sales |
$ | 542 | $ | 769 | $ | 2,472 | $ | 4,948 | ||||||||
| Credit income and other |
22 | 40 | 183 | 226 | ||||||||||||
|
|
|
|
|
|
|
|
|
|||||||||
| Total revenues |
564 | 809 | 2,655 | 5,174 | ||||||||||||
| Costs and expenses/(income): |
||||||||||||||||
| Cost of goods sold (exclusive of depreciation and amortization shown separately below) |
417 | 470 | 1,730 | 3,215 | ||||||||||||
| Selling, general and administrative (SG&A) |
177 | 283 | 1,025 | 1,726 | ||||||||||||
| Depreciation and amortization |
42 | 41 | 269 | 284 | ||||||||||||
| Real estate and other, net |
(2 | ) | (1 | ) | (7 | ) | (2 | ) | ||||||||
| Restructuring and management transition |
52 | 5 | 217 | 27 | ||||||||||||
|
|
|
|
|
|
|
|
|
|||||||||
| Total costs and expenses |
686 | 798 | 3,234 | 5,250 | ||||||||||||
|
|
|
|
|
|
|
|
|
|||||||||
| Operating income/(loss) |
(122 | ) | 11 | (579 | ) | (76 | ) | |||||||||
| Other components of net periodic pension cost/(income) |
93 | (4 | ) | 54 | (26 | ) | ||||||||||
| Gain on extinguishment of debt |
— | — | — | (1 | ) | |||||||||||
| Net interest expense |
22 | 25 | 144 | 147 | ||||||||||||
| Loss due to discontinuance of hedge accounting |
— | — | 77 | — | ||||||||||||
| Reorganization items, net |
37 | — | 126 | — | ||||||||||||
|
|
|
|
|
|
|
|
|
|||||||||
| Income/(loss) before income taxes |
(274 | ) | (10 | ) | (980 | ) | (196 | ) | ||||||||
| Income tax expense/(benefit) |
(8 | ) | 2 | (67 | ) | 6 | ||||||||||
|
|
|
|
|
|
|
|
|
|||||||||
| Net income/(loss) |
$ | (266 | ) | $ | (12 | ) | $ | (913 | ) | $ | (202 | ) | ||||
|
|
|
|
|
|
|
|
|
|||||||||
Note: The financial statements presented are internal monthly financial statements within a fiscal quarter, do not include certain quarterly adjustments and other important explanatory notes, and have not been audited or reviewed by any independent public accounting firm. Quarterly financial statements are subject to internal controls over financial reporting performed only with respect to quarterly financial statements. Consequently, these monthly financial statements may be subject to future reconciliation or adjustments to conform to generally accepted accounting principles or reporting requirements of the SEC and may not be representative of our financial position or indicative of future operating results or cash flows.
J. C. PENNEY COMPANY, INC.
(Debtor-in-Possession)
CONSOLIDATED BALANCE SHEETS
(Unaudited)
| (In millions) | August 1, 2020 |
August 3, 2019 |
February 1, 2020 |
|||||||||
| Assets |
||||||||||||
| Current assets: |
||||||||||||
| Cash in banks and in transit |
$ | 205 | $ | 163 | $ | 108 | ||||||
| Cash short-term investments |
826 | 12 | 278 | |||||||||
| Restricted cash |
452 | — | — | |||||||||
|
|
|
|
|
|
|
|||||||
| Cash, cash equivalents and restricted cash |
1,483 | 175 | 386 | |||||||||
| Merchandise inventory |
1,894 | 2,471 | 2,166 | |||||||||
| Prepaid expenses and other |
461 | 275 | 174 | |||||||||
|
|
|
|
|
|
|
|||||||
| Total current assets |
3,838 | 2,921 | 2,726 | |||||||||
| Property and equipment, net |
3,205 | 3,591 | 3,488 | |||||||||
| Operating lease assets |
800 | 925 | 998 | |||||||||
| Prepaid pension |
27 | 166 | 120 | |||||||||
| Other assets |
597 | 657 | 657 | |||||||||
|
|
|
|
|
|
|
|||||||
| Total assets |
$ | 8,467 | $ | 8,260 | $ | 7,989 | ||||||
|
|
|
|
|
|
|
|||||||
| Liabilities and stockholders’ equity |
||||||||||||
| Current liabilities: |
||||||||||||
| Merchandise accounts payable |
$ | 240 | $ | 878 | $ | 786 | ||||||
| Other accounts payable and accrued expenses |
752 | 970 | 931 | |||||||||
| Current operating lease liabilities |
73 | 84 | 68 | |||||||||
|
Debtor-in-possession financing |
900 | — | — | |||||||||
| Current portion of long-term debt, net |
1,204 | 197 | 147 | |||||||||
|
|
|
|
|
|
|
|||||||
| Total current liabilities |
3,169 | 2,129 | 1,932 | |||||||||
| Noncurrent operating lease liabilities |
927 | 1,090 | 1,108 | |||||||||
| Long-term debt |
— | 3,589 | 3,574 | |||||||||
| Deferred taxes |
104 | 121 | 116 | |||||||||
| Other liabilities |
251 | 368 | 430 | |||||||||
| Liabilities subject to compromise |
4,075 | — | — | |||||||||
|
|
|
|
|
|
|
|||||||
| Total liabilities |
8,526 | 7,297 | 7,160 | |||||||||
|
|
|
|
|
|
|
|||||||
| Stockholders’ (deficit) equity |
||||||||||||
| Common stock |
161 | 159 | 160 | |||||||||
| Additional paid-in capital |
4,721 | 4,719 | 4,723 | |||||||||
| Reinvested earnings/(accumulated deficit) |
(4,582 | ) | (3,601 | ) | (3,667 | ) | ||||||
| Accumulated other comprehensive income/(loss) |
(359 | ) | (314 | ) | (387 | ) | ||||||
|
|
|
|
|
|
|
|||||||
| Total stockholders’ (deficit) equity |
(59 | ) | 963 | 829 | ||||||||
|
|
|
|
|
|
|
|||||||
| Total liabilities and stockholders’ (deficit) equity |
$ | 8,467 | $ | 8,260 | $ | 7,989 | ||||||
|
|
|
|
|
|
|
|||||||
Note: The financial statements presented are internal monthly financial statements within a fiscal quarter, do not include certain quarterly adjustments and other important explanatory notes, and have not been audited or reviewed by any independent public accounting firm. Quarterly financial statements are subject to internal controls over financial reporting performed only with respect to quarterly financial statements. Consequently, these monthly financial statements may be subject to future reconciliation or adjustments to conform to generally accepted accounting principles or reporting requirements of the SEC and may not be representative of our financial position or indicative of future operating results or cash flows.
J. C. PENNEY COMPANY, INC.
(Debtor-in-Possession)
CONSOLIDATED STATEMENTS OF STOCKHOLDERS’ EQUITY
(Unaudited)
| (In millions) | Number of Common Shares |
Common Stock |
Additional Paid-in Capital |
Reinvested Earnings/(Accumulated Deficit) |
Accumulated Other Comprehensive Income/(Loss) |
Total Stockholders’ (Deficit)/ Equity |
||||||||||||||||||
| February 1, 2020 |
320.5 | $ | 160 | $ | 4,723 | $ | (3,667 | ) | $ | (387 | ) | $ | 829 | |||||||||||
| Net income/(loss) |
— | — | — | (647 | ) | — | (647 | ) | ||||||||||||||||
| Discontinuance of hedge accounting |
— | — | — | — | 63 | 63 | ||||||||||||||||||
| Other comprehensive income/(loss) |
— | — | — | — | 2 | 2 | ||||||||||||||||||
| Stock-based compensation and other |
1.9 | 1 | (2 | ) | (2 | ) | — | (3 | ) | |||||||||||||||
|
|
|
|
|
|
|
|
|
|
|
|
|
|||||||||||||
| July 4, 2020 |
322.4 | 161 | 4,721 | (4,316 | ) | (322 | ) | 244 | ||||||||||||||||
| Net income/(loss) |
— | — | — | (266 | ) | — | (266 | ) | ||||||||||||||||
| Other comprehensive income/(loss) |
— | — | — | — | (37 | ) | (37 | ) | ||||||||||||||||
|
|
|
|
|
|
|
|
|
|
|
|
|
|||||||||||||
| August 1, 2020 |
322.4 | $ | 161 | $ | 4,721 | $ | (4,582 | ) | $ | (359 | ) | $ | (59 | ) | ||||||||||
|
|
|
|
|
|
|
|
|
|
|
|
|
|||||||||||||
| (In millions) | Number of Common Shares |
Common Stock |
Additional Paid-in Capital |
Reinvested Earnings/(Accumulated Deficit) |
Accumulated Other Comprehensive Income/(Loss) |
Total Stockholders’ Equity |
||||||||||||||||||
| February 2, 2019 |
316.1 | $ | 158 | $ | 4,713 | $ | (3,373 | ) | $ | (328 | ) | $ | 1,170 | |||||||||||
| ASC 842 (Leases) and ASU 2018-02 (Stranded Taxes) adoption |
— | — | — | (26 | ) | 53 | 27 | |||||||||||||||||
| Net income/(loss) |
— | — | — | (190 | ) | — | (190 | ) | ||||||||||||||||
| Other comprehensive income/(loss) |
— | — | — | — | (11 | ) | (11 | ) | ||||||||||||||||
| Stock-based compensation and other |
1.5 | 1 | 7 | (1 | ) | — | 7 | |||||||||||||||||
|
|
|
|
|
|
|
|
|
|
|
|
|
|||||||||||||
| July 6, 2019 |
317.6 | 159 | 4,720 | (3,590 | ) | (286 | ) | 1,003 | ||||||||||||||||
| Net income/(loss) |
— | — | — | (12 | ) | — | (12 | ) | ||||||||||||||||
| Other comprehensive income/(loss) |
— | — | — | — | (28 | ) | (28 | ) | ||||||||||||||||
| Stock-based compensation and other |
0.1 | — | (1 | ) | 1 | — | — | |||||||||||||||||
|
|
|
|
|
|
|
|
|
|
|
|
|
|||||||||||||
| August 3, 2019 |
317.7 | $ | 159 | $ | 4,719 | $ | (3,601 | ) | $ | (314 | ) | $ | 963 | |||||||||||
|
|
|
|
|
|
|
|
|
|
|
|
|
|||||||||||||
Note: The financial statements presented are internal monthly financial statements within a fiscal quarter, do not include certain quarterly adjustments and other important explanatory notes, and have not been audited or reviewed by any independent public accounting firm. Quarterly financial statements are subject to internal controls over financial reporting performed only with respect to quarterly financial statements. Consequently, these monthly financial statements may be subject to future reconciliation or adjustments to conform to generally accepted accounting principles or reporting requirements of the SEC and may not be representative of our financial position or indicative of future operating results or cash flows.
J. C. PENNEY COMPANY, INC.
(Debtor-in-Possession)
CONSOLIDATED STATEMENTS OF CASH FLOWS
(Unaudited)
| Month Ended | Six Months Ended | |||||||||||||||
| (In millions) | August 1, 2020 |
August 3, 2019 |
August 1, 2020 |
August 3, 2019 |
||||||||||||
| Cash flows from operating activities: |
||||||||||||||||
| Net income/(loss) |
$ | (266 | ) | $ | (12 | ) | $ | (913 | ) | $ | (202 | ) | ||||
| Adjustments to reconcile net income/(loss) to net cash provided by/(used in) operating activities: |
||||||||||||||||
| Restructuring and management transition |
13 | 2 | 152 | 17 | ||||||||||||
| Reorganization items, net |
(15 | ) | — | (15 | ) | — | ||||||||||
| Net (gain)/loss on sale of non-operating assets |
— | — | — | (1 | ) | |||||||||||
| Net (gain)/loss on sale of operating assets |
— | — | — | 3 | ||||||||||||
| Discontinuance of hedge accounting |
— | — | 77 | — | ||||||||||||
| (Gain)/loss on extinguishment of debt |
— | — | — | (1 | ) | |||||||||||
| Depreciation and amortization |
42 | 41 | 269 | 284 | ||||||||||||
| Benefit plans |
95 | (2 | ) | 63 | (29 | ) | ||||||||||
| Stock-based compensation |
1 | 1 | (2 | ) | 6 | |||||||||||
| Deferred taxes |
— | 2 | (60 | ) | — | |||||||||||
| Change in cash from: |
||||||||||||||||
| Inventory |
122 | (138 | ) | 272 | (34 | ) | ||||||||||
| Prepaid expenses and other assets |
20 | 45 | (283 | ) | (82 | ) | ||||||||||
| Merchandise accounts payable |
(10 | ) | 134 | (43 | ) | 31 | ||||||||||
| Income taxes |
— | — | (1 | ) | — | |||||||||||
| Accrued expenses and other |
(4 | ) | 77 | 30 | 9 | |||||||||||
|
|
|
|
|
|
|
|
|
|||||||||
| Net cash provided by/(used in) operating activities |
(2 | ) | 150 | (454 | ) | 1 | ||||||||||
|
|
|
|
|
|
|
|
|
|||||||||
| Cash flows from investing activities: |
||||||||||||||||
| Capital expenditures |
(4 | ) | (24 | ) | (43 | ) | (146 | ) | ||||||||
| Proceeds from sale of non-operating assets |
— | — | — | 1 | ||||||||||||
| Proceeds from sale of operating assets |
1 | — | 1 | 12 | ||||||||||||
|
|
|
|
|
|
|
|
|
|||||||||
| Net cash provided by/(used in) investing activities |
(3 | ) | (24 | ) | (42 | ) | (133 | ) | ||||||||
|
|
|
|
|
|
|
|
|
|||||||||
| Cash flows from financing activities: |
||||||||||||||||
| Proceeds from debtor-in-possession financing |
225 | — | 450 | — | ||||||||||||
| Proceeds from borrowings under the credit facility |
— | 49 | 1,984 | 946 | ||||||||||||
| Payments of borrowings under the credit facility |
— | (174 | ) | (771 | ) | (946 | ) | |||||||||
| Payments of finance leases and note payable |
— | — | (1 | ) | (1 | ) | ||||||||||
| Payments of long-term debt |
— | — | (19 | ) | (26 | ) | ||||||||||
|
Debtor-in-possession financing costs |
— | — | (50 | ) | — | |||||||||||
| Proceeds from stock issued under stock plans |
— | — | — | 1 | ||||||||||||
|
|
|
|
|
|
|
|
|
|||||||||
| Net cash provided by/(used in) financing activities |
225 | (125 | ) | 1,593 | (26 | ) | ||||||||||
|
|
|
|
|
|
|
|
|
|||||||||
| Net increase/(decrease) in cash, cash equivalents and restricted cash |
220 | 1 | 1,097 | (158 | ) | |||||||||||
| Cash and cash equivalents at beginning of period |
1,263 | 174 | 386 | 333 | ||||||||||||
|
|
|
|
|
|
|
|
|
|||||||||
| Cash, cash equivalents and restricted cash at end of period |
$ | 1,483 | $ | 175 | $ | 1,483 | $ | 175 | ||||||||
|
|
|
|
|
|
|
|
|
|||||||||
Note: The financial statements presented are internal monthly financial statements within a fiscal quarter, do not include certain quarterly adjustments and other important explanatory notes, and have not been audited or reviewed by any independent public accounting firm. Quarterly financial statements are subject to internal controls over financial reporting performed only with respect to quarterly financial statements. Consequently, these monthly financial statements may be subject to future reconciliation or adjustments to conform to generally accepted accounting principles or reporting requirements of the SEC and may not be representative of our financial position or indicative of future operating results or cash flows.
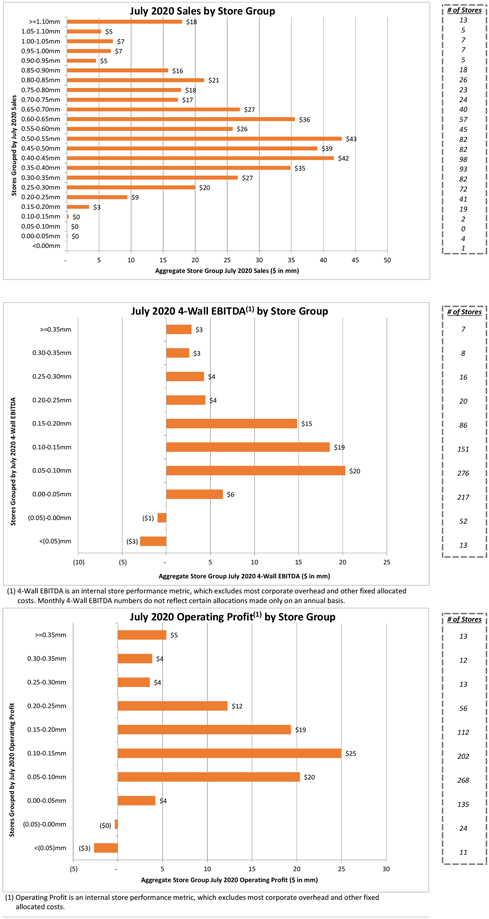
July 2020 Sales by Store Group # of Stores >=1.10mm $18 13 1.05-1.10mm $5 5 1.00-1.05mm $7 7 0.95-1.00mm $7 7 0.90-0.95mm $5 5 0.85-0.90mm $16 18 0.80-0.85mm $21 26 0.75-0.80mm $18 23 Sales 0.70-0.75mm $17 24 0.65-0.70mm $27 40 2020 0.60-0.65mm $36 57 July 0.55-0.60mm $26 45 by 0.50-0.55mm $43 82 0.45-0.50mm $39 82 0.40-0.45mm $42 98 Grouped 0.35-0.40mm $35 93 0.30-0.35mm $27 82 Stores 0.25-0.30mm $20 72 0.20-0.25mm $9 41 0.15-0.20mm $3 19 0.10-0.15mm $0 2 0.05-0.10mm $0 0 0.00-0.05mm $0 4 <0.00mm 1 —5 10 15 20 25 30 35 40 45 50 Aggregate Store Group July 2020 Sales ($ in mm) July 2020 4-Wall EBITDA(1) by Store Group # of Stores >=0.35mm $3 7 0.30-0.35mm $3 8 0.25-0.30mm $4 16 EBITDA 0.20-0.25mm $4 20 Wall 0.15-0.20mm $15 86 4—2020 0.10-0.15mm $19 151 July by 0.05-0.10mm $20 276 Grouped 0.00-0.05mm $6 217 Stores (0.05)-0.00mm ($1) 52 <(0.05)mm ($3) 13 (10) (5)—5 10 15 20 25 Aggregate Store Group July 2020 4-Wall EBITDA ($ in mm) (1) 4-Wall EBITDA is an internal store performance metric, which excludes most corporate overhead and other fixed allocated costs. Monthly 4-Wall EBITDA numbers do not reflect certain allocations made only on an annual basis. July 2020 Operating Profit(1) by Store Group # of Stores >=0.35mm $5 13 0.30-0.35mm $4 12 0.25-0.30mm $4 13 Profit 0.20-0.25mm $12 56 Operating 0.15-0.20mm $19 112 2020 0.10-0.15mm $25 202 July 0.05-0.10mm $20 by 268 Grouped 0.00-0.05mm $4 135 (0.05)-0.00mm ($0) Stores 24 <(0.05)mm ($3) 11 (5)—5 10 15 20 25 30 Aggregate Store Group July 2020 Operating Profit ($ in mm) (1) Operating Profit is an internal store performance metric, which excludes most corporate overhead and other fixed allocated costs.
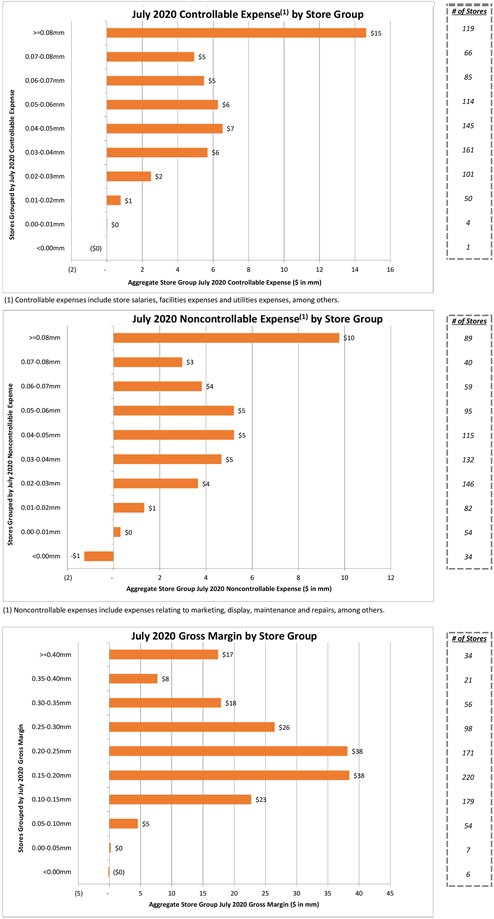
July 2020 Controllable Expense(1) by Store Group # of Stores 119 >=0.08mm $15 66 0.07-0.08mm $5 0.06-0.07mm 85 $5 Expense 0.05-0.06mm $6 114 0.04-0.05mm $7 145 Controllable 0.03-0.04mm $6 161 2020 101 July 0.02-0.03mm $2 by Grouped 0.01-0.02mm $1 50 0.00-0.01mm 4 Stores $0 <0.00mm ($0) 1 (2)—2 4 6 8 10 12 14 16 Aggregate Store Group July 2020 Controllable Expense ($ in mm) (1) Controllable expenses include store salaries, facilities expenses and utilities expenses, among others. July 2020 Noncontrollable Expense(1) by Store Group # of Stores >=0.08mm $10 89 0.07-0.08mm $3 40 Expense 0.06-0.07mm $4 59 0.05-0.06mm $5 95 Noncontrollable 0.04-0.05mm $5 115 2020 0.03-0.04mm $5 132 July 0.02-0.03mm $4 146 by Grouped 0.01-0.02mm $1 82 Stores 0.00-0.01mm $0 54 <0.00mm -$1 34 (2)—2 4 6 8 10 12 Aggregate Store Group July 2020 Noncontrollable Expense ($ in mm) (1)Noncontrollable expenses include expenses relating to marketing, display, maintenance and repairs, among others. July 2020 Gross Margin by Store Group # of Stores >=0.40mm $17 34 0.35-0.40mm $8 21 0.30-0.35mm $18 56 Margin 0.25-0.30mm $26 98 Gross 0.20-0.25mm $38 171 2020 0.15-0.20mm $38 220 July by 0.10-0.15mm $23 179 Grouped 0.05-0.10mm $5 54 Stores 0.00-0.05mm $0 7 <0.00mm ($0) 6 (5)—5 10 15 20 25 30 35 40 45 Aggregate Store Group July 2020 Gross Margin ($ in mm)
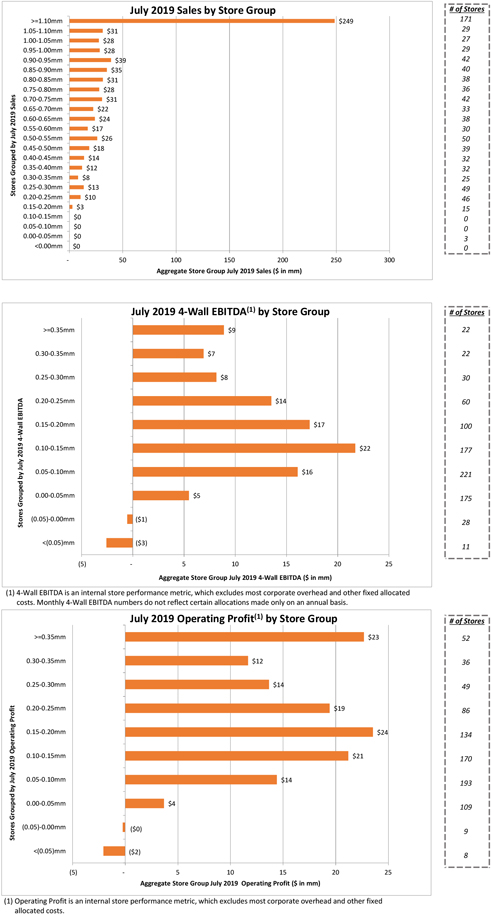
8 July 2019 Sales by Store Group # of Stores >=1.10mm $249 171 1.05-1.10mm $31 29 1.00-1.05mm $28 27 0.95-1.00mm $28 29 0.90-0.95mm $39 42 0.85-0.90mm $35 40 0.80-0.85mm $31 38 0.75-0.80mm $28 36 Sales 0.70-0.75mm $31 42 0.65-0.70mm $22 33 2019 0.60-0.65mm $24 38 July 0.55-0.60mm $17 30 by 0.50-0.55mm $26 50 0.45-0.50mm $18 39 0.40-0.45mm $14 32 Grouped 0.35-0.40mm $12 32 0.30-0.35mm $8 25 Stores 0.25-0.30mm $13 49 0.20-0.25mm $10 46 0.15-0.20mm $3 15 0.10-0.15mm $0 0 0.05-0.10mm $0 0 0.00-0.05mm $0 3 <0.00mm $0 0 —50 100 150 200 250 300 Aggregate Store Group July 2019 Sales ($ in mm) July 2019 4-Wall EBITDA(1) by Store Group # of Stores >=0.35mm $9 22 0.30-0.35mm $7 22 0.25-0.30mm $8 30 EBITDA 0.20-0.25mm $14 60 Wall 0.15-0.20mm $17 100 4—2019 0.10-0.15mm $22 177 July by 0.05-0.10mm $16 221 Grouped 0.00-0.05mm $5 175 Stores (0.05)-0.00mm ($1) 28 <(0.05)mm ($3) 11 (5)—5 10 15 20 25 Aggregate Store Group July 2019 4-Wall EBITDA ($ in mm) (1) 4-Wall EBITDA is an internal store performance metric, which excludes most corporate overhead and other fixed allocated costs. Monthly 4-Wall EBITDA numbers do not reflect certain allocations made only on an annual basis. July 2019 Operating Profit(1) by Store Group # of Stores >=0.35mm $23 52 0.30-0.35mm $12 36 0.25-0.30mm $14 49 Profit 0.20-0.25mm $19 86 Operating 0.15-0.20mm $24 134 2019 0.10-0.15mm $21 170 July 0.05-0.10mm $14 by 193 Grouped 0.00-0.05mm $4 109 (0.05)-0.00mm ($0) Stores 9 <(0.05)mm ($2) 8 (5)—5 10 15 20 25 Aggregate Store Group July 2019 Operating Profit ($ in mm) (1) Operating Profit is an internal store performance metric, which excludes most corporate overhead and other fixed allocated costs.
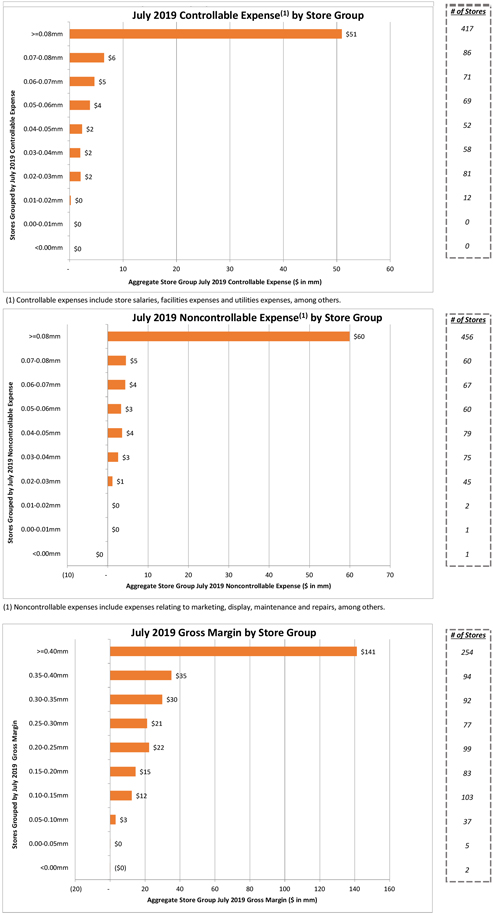
July 2019 Controllable Expense(1) by Store Group # of Stores 417 >=0.08mm $51 86 0.07-0.08mm $6 71 0.06-0.07mm $5 69 Expense 0.05-0.06mm $4 0.04-0.05mm 52 $2 Controllable 0.03-0.04mm 58 2019 $2 0.02-0.03mm 81 July $2 by 12 Grouped 0.01-0.02mm $0 Stores 0.00-0.01mm $0 0 <0.00mm $0 0 —10 20 30 40 50 60 Aggregate Store Group July 2019 Controllable Expense ($ in mm) (1) Controllable expenses include store salaries, facilities expenses and utilities expenses, among others. July 2019 Noncontrollable Expense(1) by Store Group # of Stores >=0.08mm $60 456 0.07-0.08mm $5 60 Expense 0.06-0.07mm $4 67 0.05-0.06mm $3 60 Noncontrollable 0.04-0.05mm $4 79 2019 0.03-0.04mm $3 75 July 0.02-0.03mm $1 45 by Grouped 0.01-0.02mm $0 2 Stores 0.00-0.01mm $0 1 <0.00mm $0 1 (10)—10 20 30 40 50 60 70 Aggregate Store Group July 2019 Noncontrollable Expense ($ in mm) (1)Noncontrollable expenses include expenses relating to marketing, display, maintenance and repairs, among others. July 2019 Gross Margin by Store Group # of Stores >=0.40mm $141 254 0.35-0.40mm $35 94 0.30-0.35mm $30 92 Margin 0.25-0.30mm $21 77 Gross 0.20-0.25mm $22 99 2019 0.15-0.20mm $15 83 July 0.10-0.15mm $12 by 103 Grouped 0.05-0.10mm $3 37 Stores 0.00-0.05mm $0 5 <0.00mm ($0) 2 (20)—20 40 60 80 100 120 140 160 Aggregate Store Group July 2019 Gross Margin ($ in mm)
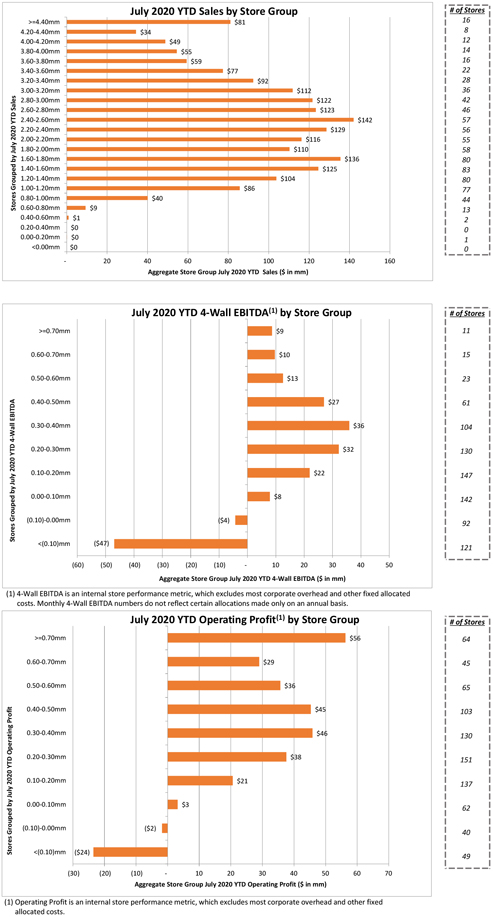
July 2020 YTD Sales by Store Group # of Stores >=4.40mm $81 16 4.20-4.40mm $34 8 4.00-4.20mm $49 12 3.80-4.00mm $55 14 3.60-3.80mm $59 16 3.40-3.60mm $77 22 3.20-3.40mm $92 28 3.00-3.20mm $112 36 Sales 2.80-3.00mm $122 42 2.60-2.80mm $123 46 YTD 2.40-2.60mm $142 57 2020 2.20-2.40mm $129 56 2.00-2.20mm $116 55 July 1.80-2.00mm $110 58 by 1.60-1.80mm $136 80 1.40-1.60mm $125 83 Grouped 1.20-1.40mm $104 80 1.00-1.20mm $86 77 0.80-1.00mm $40 44 Stores 0.60-0.80mm $9 13 0.40-0.60mm $1 2 0.20-0.40mm $0 0 0.00-0.20mm $0 1 <0.00mm $0 0 —20 40 60 80 100 120 140 160 Aggregate Store Group July 2020 YTD Sales ($ in mm) July 2020 YTD 4-Wall EBITDA(1) by Store Group # of Stores >=0.70mm $9 11 0.60-0.70mm $10 15 0.50-0.60mm $13 23 EBITDA 0.40-0.50mm $27 61 Wall 0.30-0.40mm $36 104 4—YTD 0.20-0.30mm $32 130 2020 July 0.10-0.20mm $22 147 by 0.00-0.10mm $8 Grouped 142 (0.10)-0.00mm ($4) 92 Stores <(0.10)mm ($47) 121 (60) (50) (40) (30) (20) (10)—10 20 30 40 50 Aggregate Store Group July 2020 YTD 4-Wall EBITDA ($ in mm) (1) 4-Wall EBITDA is an internal store performance metric, which excludes most corporate overhead and other fixed allocated costs. Monthly 4-Wall EBITDA numbers do not reflect certain allocations made only on an annual basis. July 2020 YTD Operating Profit(1) by Store Group # of Stores >=0.70mm $56 64 0.60-0.70mm $29 45 0.50-0.60mm $36 65 Profit 0.40-0.50mm $45 103 Operating 0.30-0.40mm $46 130 YTD 0.20-0.30mm $38 151 2020 0.10-0.20mm $21 July 137 by 0.00-0.10mm $3 62 Grouped (0.10)-0.00mm ($2) 40 Stores <(0.10)mm ($24) 49 (30) (20) (10)—10 20 30 40 50 60 70 Aggregate Store Group July 2020 YTD Operating Profit ($ in mm) (1) Operating Profit is an internal store performance metric, which excludes most corporate overhead and other fixed allocated costs.
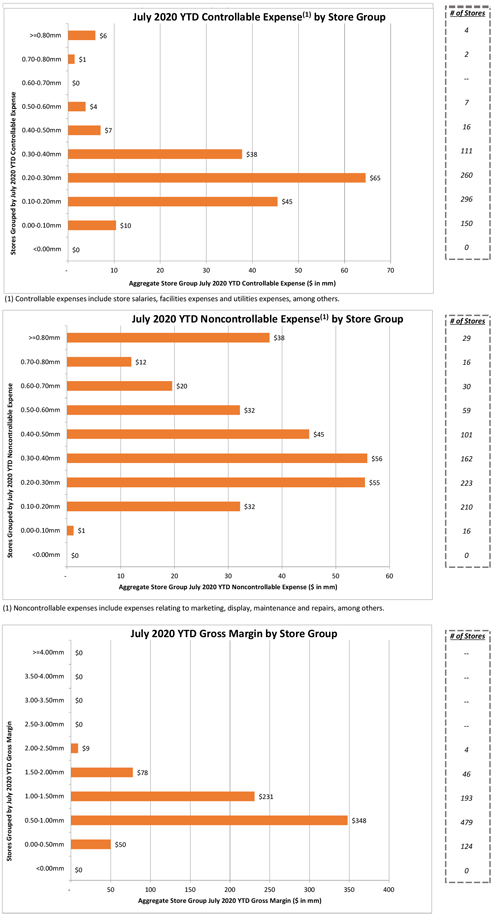
July 2020 YTD Controllable Expense(1) by Store Group # of Stores 4 >=0.80mm $6 2 0.70-0.80mm $1 — 0.60-0.70mm $0 7 Expense 0.50-0.60mm $4 0.40-0.50mm 16 $7 Controllable 0.30-0.40mm 111 YTD $38 260 2020 0.20-0.30mm $65 July by 0.10-0.20mm $45 296 Grouped 0.00-0.10mm $10 150 Stores <0.00mm $0 0 —10 20 30 40 50 60 70 Aggregate Store Group July 2020 YTD Controllable Expense ($ in mm) (1) Controllable expenses include store salaries, facilities expenses and utilities expenses, among others. July 2020 YTD Noncontrollable Expense(1) by Store Group # of Stores >=0.80mm $38 29 0.70-0.80mm $12 16 Expense 0.60-0.70mm $20 30 0.50-0.60mm $32 59 Noncontrollable 0.40-0.50mm $45 101 YTD 0.30-0.40mm $56 162 2020 0.20-0.30mm $55 223 July by 0.10-0.20mm $32 210 Grouped 0.00-0.10mm $1 16 Stores <0.00mm $0 0 —10 20 30 40 50 60 Aggregate Store Group July 2020 YTD Noncontrollable Expense ($ in mm) (1)Noncontrollable expenses include expenses relating to marketing, display, maintenance and repairs, among others. July 2020 YTD Gross Margin by Store Group # of Stores >=4.00mm $0 --3.50-4.00mm $0 --3.00-3.50mm $0 — Margin 2.50-3.00mm $0 —Gross 2.00-2.50mm $9 4 YTD 1.50-2.00mm $78 46 2020 1.00-1.50mm July $231 193 by Grouped 0.50-1.00mm $348 479 Stores 0.00-0.50mm $50 124 <0.00mm $0 0 —50 100 150 200 250 300 350 400 Aggregate Store Group July 2020 YTD Gross Margin ($ in mm)
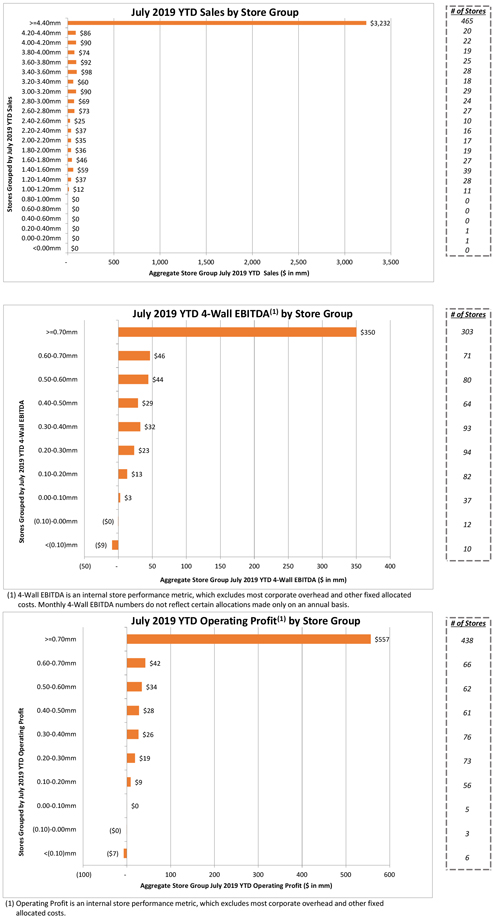
July 2019 YTD Sales by Store Group # of Stores >=4.40mm $3,232 465 4.20-4.40mm $86 20 4.00-4.20mm $90 22 3.80-4.00mm $74 19 3.60-3.80mm $92 25 3.40-3.60mm $98 28 3.20-3.40mm $60 18 3.00-3.20mm $90 29 Sales 2.80-3.00mm $69 24 2.60-2.80mm $73 27 YTD 2.40-2.60mm $25 10 2019 2.20-2.40mm $37 16 2.00-2.20mm $35 17 July 1.80-2.00mm $36 19 by 1.60-1.80mm $46 27 1.40-1.60mm $59 39 Grouped 1.20-1.40mm $37 28 1.00-1.20mm $12 11 0.80-1.00mm $0 0 Stores 0.60-0.80mm $0 0 0.40-0.60mm $0 0 0.20-0.40mm $0 1 0.00-0.20mm $0 1 <0.00mm $0 0 —500 1,000 1,500 2,000 2,500 3,000 3,500 Aggregate Store Group July 2019 YTD Sales ($ in mm) July 2019 YTD 4-Wall EBITDA(1) by Store Group # of Stores >=0.70mm $350 303 0.60-0.70mm $46 71 0.50-0.60mm $44 80 EBITDA 0.40-0.50mm $29 64 Wall 0.30-0.40mm $32 93 4—YTD 0.20-0.30mm $23 94 2019 July 0.10-0.20mm $13 82 by 0.00-0.10mm $3 Grouped 37 (0.10)-0.00mm ($0) 12 Stores <(0.10)mm ($9) 10 (50)—50 100 150 200 250 300 350 400 Aggregate Store Group July 2019 YTD 4-Wall EBITDA ($ in mm) (1) 4-Wall EBITDA is an internal store performance metric, which excludes most corporate overhead and other fixed allocated costs. Monthly 4-Wall EBITDA numbers do not reflect certain allocations made only on an annual basis. July 2019 YTD Operating Profit(1) by Store Group # of Stores >=0.70mm $557 438 0.60-0.70mm $42 66 0.50-0.60mm $34 62 Profit 0.40-0.50mm $28 61 Operating 0.30-0.40mm $26 76 YTD 0.20-0.30mm $19 73 2019 0.10-0.20mm $9 July 56 by 0.00-0.10mm $0 5 Grouped (0.10)-0.00mm ($0) 3 Stores <(0.10)mm ($7) 6 (100)—100 200 300 400 500 600 Aggregate Store Group July 2019 YTD Operating Profit ($ in mm) (1) Operating Profit is an internal store performance metric, which excludes most corporate overhead and other fixed allocated costs.
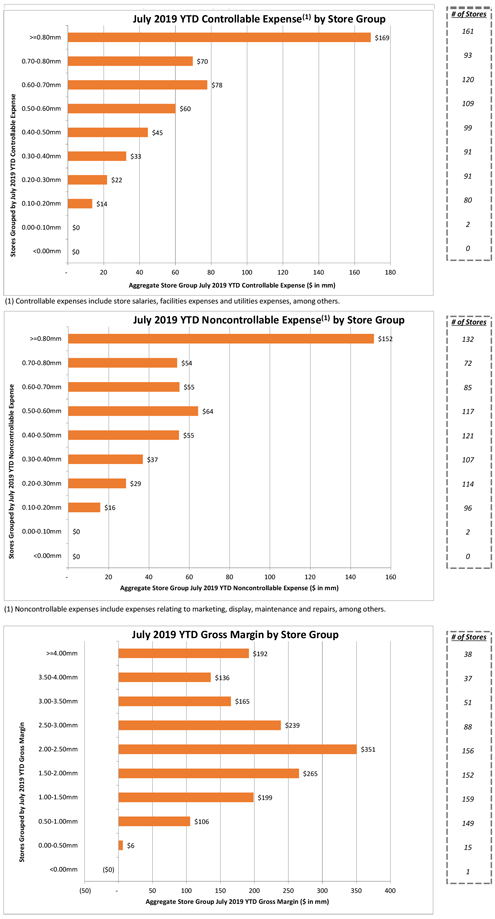
July 2019 YTD Controllable Expense(1) by Store Group # of Stores 161 >=0.80mm $169 93 0.70-0.80mm $70 120 0.60-0.70mm $78 109 Expense 0.50-0.60mm $60 99 0.40-0.50mm $45 Controllable 91 YTD 0.30-0.40mm $33 91 2019 0.20-0.30mm $22 July by 0.10-0.20mm $14 80 Grouped 0.00-0.10mm $0 2 Stores <0.00mm $0 0 —20 40 60 80 100 120 140 160 180 Aggregate Store Group July 2019 YTD Controllable Expense ($ in mm) (1) Controllable expenses include store salaries, facilities expenses and utilities expenses, among others. July 2019 YTD Noncontrollable Expense(1) by Store Group # of Stores >=0.80mm $152 132 0.70-0.80mm $54 72 Expense 0.60-0.70mm $55 85 0.50-0.60mm $64 117 Noncontrollable 0.40-0.50mm $55 121 YTD 0.30-0.40mm $37 107 2019 0.20-0.30mm $29 114 July by 0.10-0.20mm $16 96 Grouped 0.00-0.10mm $0 2 Stores <0.00mm $0 0 —20 40 60 80 100 120 140 160 Aggregate Store Group July 2019 YTD Noncontrollable Expense ($ in mm) (1)Noncontrollable expenses include expenses relating to marketing, display, maintenance and repairs, among others. July 2019 YTD Gross Margin by Store Group # of Stores >=4.00mm $192 38 3.50-4.00mm $136 37 3.00-3.50mm $165 51 Margin 2.50-3.00mm $239 88 Gross 2.00-2.50mm $351 156 YTD 1.50-2.00mm $265 152 2019 1.00-1.50mm July $199 159 by Grouped 0.50-1.00mm $106 149 Stores 0.00-0.50mm $6 15 <0.00mm ($0) 1 (50)—50 100 150 200 250 300 350 400 Aggregate Store Group July 2019 YTD Gross Margin ($ in mm)
