Attached files
| file | filename |
|---|---|
| 8-K - FORM 8-K - Primis Financial Corp. | tm2027771d1_8k.htm |
Exhibit 99.1

SOUTHERN NATIONAL BANCORP OF VIRGINIA, INC. INVESTOR PRESENTATION

2 CERTAIN IMPORTANT INFORMATION DISCLAIMER This presentation has been prepared by Southern National Bancorp of Virginia, Inc . (the “Company”) solely for information purposes based on its own information, as well as information from public sources . This presentation is a summary only and has been prepared to assist interested parties in marking their own evaluation of the Company . The Company is not making any implied or express representation or warranty as to the accuracy or completeness of the information contained herein . Except as otherwise indicated, this presentation speaks as of the date hereof . This presentation does not purport to contain all of the information that may be relevant or material to an interested party’s investment decision . In all cases, interested parties should conduct their own investigation and analysis of the Company, including the Company’s annual and quarterly reports filed with the Securities and Exchange Commission (the “SEC”) and information included or incorporated by reference into the company’s shelf registration statement (including a prospectus) (File No . 333 - 237909 ) and any prospectus supplement filed by the Company with the SEC . This presentation is neither an offer to sell nor a solicitation of an offer to purchase any securities of the Company . There will be no sale of securities in any jurisdiction in which such an offer, solicitation or sale would be unlawful prior to registration or qualification under the securities laws of any such jurisdiction . Any offer to sell or solicitation of an offer to purchase securities of the Company will be made only pursuant to a prospectus supplement and prospectus filed with the SEC .

3 CERTAIN IMPORTANT INFORMATION CAUTION REGARDING FORWARD LOOKING STATEMENTS This presentation contains forward - looking statements within the meaning of the Private Securities Litigation Reform Act of 1995 that relate to future events or the future performance of Southern National Bancorp of Virginia, Inc . (the “Company”) . Forward - looking statements are not guarantees of performance or results . These forward - looking statements are based on the current beliefs and expectations of the respective management of the Company and Sonabank and are inherently subject to significant business, economic and competitive uncertainties and contingencies, many of which are beyond their respective control and which may be heightened by the COVID - 19 pandemic . In addition, these forward - looking statements are subject to assumptions with respect to future business strategies and decisions that are subject to change . Actual results may differ materially from the anticipated results discussed or implied in these forward - looking statements because of numerous possible uncertainties . Words like "may," "plan," "contemplate," "anticipate," "believe," "intend," "continue," "expect," "project," "predict," "estimate," "could," "should," "would," "will," and similar expressions, should be considered as identifying forward - looking statements, although other phrasing may be used . Such forward - looking statements involve risks and uncertainties and may not be realized due to a variety of factors . Additional factors that could cause actual results to differ materially from those expressed in the forward - looking statements are discussed in the reports (such as Annual Reports on Form 10 - K, Quarterly Reports on Form 10 - Q) filed by the Company with the SEC . You should consider such factors and not place undue reliance on such forward - looking statements . No obligation is undertaken by the Company to update such forward - looking statements to reflect events or circumstances occurring after the issuance of this presentation . NON - GAAP FINANCIAL MEASURES Statements included in this presentation include non - GAAP financial measures and should be read along with the accompanying tables under the section titled “Non - GAAP Reconciliations . ” The Company uses non - GAAP financial measures to analyze its performance . Management believes that non - GAAP financial measures provide additional useful information that allows investors to evaluate the ongoing performance of Southern National and provide meaningful comparison to its peers . Non - GAAP financial measures should not be considered as an alternative to any measure of performance or financial condition as promulgated under GAAP, and investors should consider the Company’s performance and financial condition as reported under GAAP and all other relevant information when assessing the performance or financial condition of the Company . Non - GAAP financial measures have limitations as analytical tools, and investors should not consider them in isolation or as a substitute for analysis of the results or financial condition as reported under GAAP .

COMPANY OVERVIEW

5 SOUTHERN NATIONAL BANCORP OF VIRGINIA, INC. ▪ NASDAQ: SONA ▪ Market Cap: $223 million (1) ▪ Headquartered in Mclean, VA ▪ Holding company for Sonabank, a state chartered bank headquartered in Glen Allen, VA ▪ Opened April 14, 2005 ▪ Completed transformational merger of equals with Eastern Virginia Bankshares, Inc. on June 23, 2017 ▪ Total Assets of $3.1 billion as of June 30, 2020 ▪ 42 Full - Service Branches across Maryland, Virginia, & Washington D.C., with one loan production office in Fredericksburg, VA (1) Market data as of August 12, 2020 Source: Market capitalization data from S&P Global Market Intelligence SONA BRANCH LOCATIONS A PREMIER D.C. - MD - VA FRANCHISE
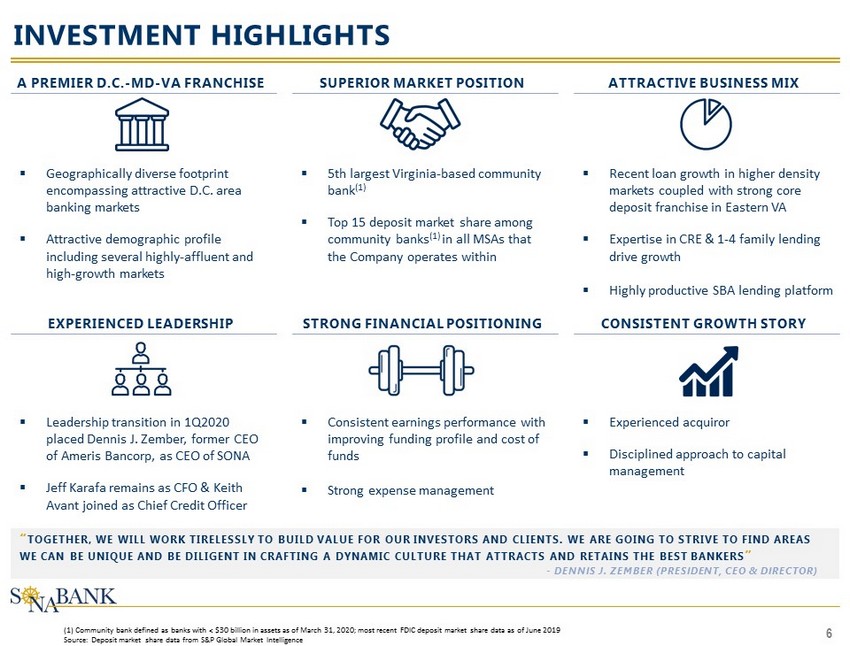
6 INVESTMENT HIGHLIGHTS A PREMIER D.C. - MD - VA FRANCHISE SUPERIOR MARKET POSITION ATTRACTIVE BUSINESS MIX EXPERIENCED LEADERSHIP STRONG FINANCIAL POSITIONING CONSISTENT GROWTH STORY ▪ Geographically diverse footprint encompassing attractive D.C. area banking markets ▪ Attractive demographic profile including several highly - affluent and high - growth markets ▪ 5th largest Virginia - based community bank (1) ▪ Top 15 deposit market share among community banks (1) in all MSAs that the Company operates within ▪ Recent loan growth in higher density markets coupled with strong core deposit franchise in Eastern VA ▪ Expertise in CRE & 1 - 4 family lending drive growth ▪ Highly productive SBA lending platform (1) Community bank defined as banks with < $30 billion in assets as of March 31, 2020; most recent FDIC deposit market share dat a as of June 2019 Source: Deposit market share data from S&P Global Market Intelligence ▪ Leadership transition in 1Q2020 placed Dennis J. Zember, former CEO of Ameris Bancorp, as CEO of SONA ▪ Jeff Karafa remains as CFO & Keith Avant joined as Chief Credit Officer ▪ Consistent earnings performance with improving funding profile and cost of funds ▪ Strong expense management ▪ Experienced acquiror ▪ Disciplined approach to capital management “ TOGETHER, WE WILL WORK TIRELESSLY TO BUILD VALUE FOR OUR INVESTO RS AND CLIENTS. WE ARE GOING TO STRIVE TO FIND AREAS WE CAN BE UNIQUE AND BE DILIGENT IN CRAFTING A DYNAMIC CULTURE T HAT ATTRACTS AND RETAINS THE BEST BANKERS ” - DENNIS J. ZEMBER (PRESIDENT, CEO & DIRECTOR)

7 EXPERIENCED LEADERSHIP TOP EXECUTIVES DENNIS J. ZEMBER, JR. President, CEO & Director ▪ Joined SONA in February 2020 ▪ Former President, CEO & Vice Chair at Ameris Bancorp ▪ Prior to CEO, held the roles of COO & CFO at Ameris Bancorp (2005 – 2019) ▪ Led Ameris through numerous events and transactions, including large acquisition of Fidelity Southern Corporation ▪ Other experience includes CFO of Flag Bank, Atlanta, GA (2002 – 2005); Treasurer of Century South Banks, Inc. (1977 – 2001); Certified Public Accountant at Coopers & Lybrand and Porter Keadle Moore, LLP JEFFREY L. KARAFA EVP & CFO ▪ EVP & CFO of SONA since September 2018 ▪ 31 years of experience in all aspects of financial management in the community banking sector ▪ EVP & CFO of The National Capital Bank of Washington (2014 – 2018) ▪ Served as COO and Interim CFO of Bank of Michigan (2012 – 2013) ▪ Other experience includes CFO and Principal Accounting Officer of Dearborn Bancorp, Inc.; CFO of Fidelity Bank (Dearborn, MI) KEITH L. AVANT Chief Credit Officer ▪ Experienced Senior Credit Executive ▪ Lengthy track record of successfully managing both credit underwriting and portfolio management teams ▪ 20+ years of credit experience ▪ Former EVP & Chief Credit Officer of Access Point Financial (Atlanta, GA - based hotel finance company) ▪ Previously worked as Chief Credit Officer for MidSouth Bank (Lafayette, LA) & as a Credit Executive at both Bank of America Merrill Lynch and SunTrust Bank. BOARD OF DIRECTORS W. RAND COOK Chairman of the Board ▪ Independent non - executive chairman ▪ Partner in law firm of McCaul, Martin, Evans & Cook, P.C. JOHN FITZGERALD BIAGAS ▪ Owner, President & CEO of Bay Electric Co. ▪ Service on numerous local, statewide & national boards, including the U.S. Chamber of Commerce Board of Directors ROBERT YATES “BOB” CLAGETT ▪ Former Director, President & CEO of Prince George’s Federal Savings Bank ▪ Maryland real estate attorney F.L. GARRETT III ▪ Owner of Harborside Storage ▪ Active realtor with Long & Foster Real Estate in Essex County, VA W. BRUCE JENNINGS ▪ Owner of Fairfax City Self Storage; President & Owner of S.O. Jennings Construction Corporation; General Partner of Gateway Partnerships (hotel properties) ERIC A. JOHNSON ▪ Real estate broker with Mason Realty in Middlesex, VA ▪ Previously owned Urbanna Market and Urbanna Builders Supply CHARLES A. KABBASH ▪ Owner of Charlottesville, VA area real estate investment company 414 Associates ▪ Partner in Kabbash, Fox & Gentry Commercial Real Estate DENNIS J. ZEMBER, JR. ▪ President & CEO; See full bio (left)

8 GROWTH MILESTONES 2020 Leadership Transition 2014 Acquisition of Southern Trust Mortgage LLC Acquisition of Prince George’s Federal Savings Bank 2012 FDIC Assisted Acquisition of HarVest Bank of Maryland Sale of Non - Performing Loans to Garrison Investment Group 2011 Acquisition of Two Bank of Hampton Roads Branches 2006 $13.5M Acquisition of 1 st Service Bank $28.0M NASDAQ IPO 2009 FDIC Assisted Acquisition of Greater Atlantic Bank Acquisition of One Millennium Bankshares Branch $25.0M Follow - On Equity Offering 2005 Opened For Business April 2005 2017 $198.8M Acquisition of EVBS $27.0M Subordinated Debt Offering Surpassed $2.0B in Total Assets

FINANCIAL HIGHLIGHTS

10 2ND QUARTER 2020 HIGHLIGHTS (1) Tangible common equity is a non - GAAP financial measure. See appendix for reconciliation FINANCIAL HIGHLIGHTS OBSERVATIONS ▪ Net income of $4.7 million ▪ Diluted earnings per share of $0.19 ▪ Return on average assets of 0.61% and return on average tangible common equity of 6.86% (1) ▪ Exceptional efficiency with efficiency ratio of 49.07% ▪ Originated approx. 3,800 PPP loans totaling $335.6 million ▪ Increased allowance for loan losses (incurred loss model) to $23.6 million or 0.94% of total loans ▪ 1.28% of total loans including discounts on acquired loans) ▪ Strong asset quality positioning with NPAs/Assets of 0.57%, excluding TDRs ▪ Declared thirty - fifth consecutive quarterly dividend ▪ Saw substantial improvement in revenue and pre - tax pre - provision earnings and held steady on operating expenses ▪ Increased PTPP income to $16.8 million or 2.27% of average assets (compared to 1.51% at year end 2019) ▪ Grew core deposits at the fastest pace in Company’s history while steadily moving on lower rates ▪ Grew non - CD deposits to total deposits 71%, compared to 59% at 2Q2019 ▪ Cost of deposits declined to 0.95% (down 45% compared to year end 2019) ▪ Continued to leverage the power of partnerships ▪ Increased contribution from mortgage investment to $4.1 million ▪ Announced partnership with Panacea Financial focusing on medical professionals ▪ Expect second half of the year to be centered on managing the economic impacts of the pandemic

11 BALANCE SHEET TRENDS (1) Tangible common equity is a non - GAAP financial measure. See appendix for reconciliation Note: Annual data or the year ended December 31 of each respective year; 2020Q1 data for the three months ended March 31, 202 0 TOTAL ASSETS ($ M ) TOTAL GROSS LOANS ($ M ) TOTAL DEPOSITS ($ M ) TANGIBLE COMMON EQUITY (1) ($M) $1,142 $2,614 $2,701 $2,722 $3,072 $0 $700 $1,400 $2,100 $2,800 $3,500 2016 2017 2018 2019 2020Q2 $930 $2,062 $2,179 $2,186 $2,512 $0 $600 $1,200 $1,800 $2,400 $3,000 2016 2017 2018 2019 2020Q2 $913 $1,865 $2,098 $2,125 $2,152 $0 $500 $1,000 $1,500 $2,000 $2,500 2016 2017 2018 2019 2020Q2 $115 $212 $238 $268 $273 $0 $60 $120 $180 $240 $300 2016 2017 2018 2019 2020Q2

12 0.00% 3.00% 6.00% 9.00% 12.00% 15.00% 18.00% 2016 2017 2018 2019 2020Q2 YTD ROATCE Core ROATCE CONSISTENT EARNINGS POWER (1) Tangible common equity is a non - GAAP financial measure. See appendix for reconciliation (2) Core earnings performance is a non - GAAP financial measure. See appendix for reconciliation RETURN ON AVERAGE TANGIBLE COMMON EQUITY (1) RETURN ON AVERAGE ASSETS 0.00% 0.20% 0.40% 0.60% 0.80% 1.00% 1.20% 1.40% 2016 2017 2018 2019 2020Q2 YTD ROAA Core ROAA ROAA: 0.95% Core: 0.93% ROAA: 0.13% Core: 0.85% ROAA: 1.25% Core: 1.31% ROAA: 1.22% Core: 1.32% ROAA: 0.33% Core: 0.44% ROATCE: 9.36% Core: 8.97% ROATCE: 1.80% Core: 9.88% ROATCE: 15.37% Core: 15.56% ROATCE: 13.54% Core: 14.17% ROATCE: 3.86% Core: 4.84% EFFICIENCY RATIO 52.33% 52.23% 51.03% 54.49% 54.39% 0.00% 20.00% 40.00% 60.00% 80.00% 100.00% 2016 2017 2018 2019 2020Q2 YTD (2) (2) PRE - PROVISION NET REVENUE ($000) $19,639 $33,713 $48,049 $41,634 $21,966 $0 $10,000 $20,000 $30,000 $40,000 $50,000 2016 2017 2018 2019 2020Q2 YTD 2020Q2 YTD defined as the 6 months ended June 30, 2020

13 1 - 4 FAMILY 28.5% CONSUMER 0.2 % COMMERCIAL 71.3 % CONSERVATIVE CREDIT CULTURE JUNE 30, 2020 NONACCRUAL LOANS BY TYPE 12/31/2016 12/31/2017 12/31/2018 12/31/2019 6/30/2020 GROSS NONACCRUAL LOANS $3,795 $16,931 $6,709 $8,900 $14,930 SBA GUARANTEED AMOUNT NOT INCL. IN NONACC. LOANS 2,173 4,664 3,391 4,129 3,513 NONACCRUAL LOANS $1,622 $12,267 $3,318 $4,771 $11,417 RESTRUCTURED LOANS $688 $672 $692 $697 $1,657 OREO 8,617 7,577 5,077 6,224 6,006 NONPERFORMING ASSETS $10,927 $20,516 $9,087 $11,692 $19,080 NONPERFORMING ASSETS (EX. TDRs) $10,239 $19,844 $8,395 $10,995 $17,423 NPAs / ASSETS 0.96% 0.78% 0.34% 0.43% 0.62% NPAs / ASSETS (EX. TDRs) 0.90% 0.76% 0.31% 0.40% 0.57% HISTORICAL ASSET QUALITY HISTORICAL NPA s /ASSETS & NCO s /LOANS 0.90 % 0.76 % 0.31% 0.40 % 0.57 % 0.55 % 0.52 % 0.06 % 0.11 % 0.00 % 0.00% 0.50% 1.00% 1.50% 2.00% 2016 2017 2018 2019 2020Q2 NPAs/Assets (Ex. TDRs) NCOs / Average Loans Note: Annual data or the year ended December 31 of each respective year; 2020Q2 data for the three months ended June 30, 2020

14 $ 23,627 0.94 % 1.28% 0.04 % 0.00% 0.30% 0.60% 0.90% 1.20% 1.50% $0 $6,000 $12,000 $18,000 $24,000 $30,000 2017 2018 2019 2020Q2 YTD ALL ALL / Total Loans ALLL + Credit Marks / Total Loans NCOs / Average Loans ALLOWANCE FOR LOAN LOSSES ( 1 ) Includes loans secured by farmland and multi - family residential loans (2) Includes home equity lines of credit (3) Non - GAAP financial figure; see Non - GAAP reconciliation in Appendix for additional detail ▪ In addition to the stated loan loss reserve, SONA has certain credit marks on acquired portfolios totaling $8.6 million as of June 30, 2020 ▪ Reserves & credit marks as a percentage of total loans were 1.28% at June 30, 2020 (3) ALLOWANCE FOR LOAN LOSSES TRENDS 2 ND QUARTER 2020 ALL ACTIVITY OBSERVATIONS (3) Commercial Commercial Real Estate Real Estate Construction Other Owner Non-Owner and Land Commercial 1-4 Family Consumer ALLOWANCE FOR LOAN LOSSES Occupied Occupied (1) Development Loans Residential (2) Loans Unallocated Total Beginning Balance (3/31/2020) $1,068 $2,693 $376 $5,833 $2,439 $239 $74 $12,722 Provision (recovery) for non-purchased loans 2,490 5,682 341 (157) 1,410 686 653 11,105 Provision for purchase credit impaired loans 0 0 0 (206) 0 0 0 (206) Total provision (recovery) $2,490 $5,682 $341 ($363) $1,410 $686 $653 $10,899 Charge offs 0 0 0 0 0 (33) 0 (33) Recoveries 0 3 0 20 5 11 0 39 Ending Balance (6/30/2020) $3,558 $8,378 $717 $5,490 $3,854 $903 $727 $23,627

COVID - 19 PANDEMIC RESPONSE

16 ON - GOING CREDIT REVIEW → All loans > $2.0 million that are not reviewed by internal or external loan review require loan officer review annually that is similar to a credit submission → Internal loan review is required each year to review loans representing 30% of the commercial loan portfolio outstanding at prior year end → Independent external loan review each year reviews > 50% of loans outstanding at prior year end → All loan reviews include a detailed assessment of current borrower cash flow, global cash flow, debt service coverage and global debt service coverage, collateral and collateral valuation, and payment performance → Risk ratings are updated throughout the year by the Chief Credit Risk Officer, based on current information, and loan officer / business line recommendations → Portfolio trends are consistently monitored, including trends in originations, past due consumer and commercial loans by segment, special mention, substandard and exceptions to credit policy → Special assets department contacts lenders for updates on any loans > 20 days past due → Reviewed every relationship and portfolio concentration over $5M in 2Q (65% of total loans) → SONA considers its hotel and restaurant concentrations to be its primary COVID - 19 related concerns → Reviewed with lenders the hotel, restaurant, C&I, OORE, CRE and consumer portfolios to assess the likelihood of future problem assets → Monitor hotel portfolio trends monthly including loan - to - value, debt service coverage, occupancy, ADR and RevPar → Lenders engaged in more frequent communications with their entire loan book – special attention paid to borrowers with payment deferrals and with hotel and restaurant borrowers → Lenders on average speak to these borrowers twice a month → Instituted an assessment plan to document trends, borrower action plans, and the likelihood of resuming contractual payments with deferment periods ending → Formed a Portfolio Management Group, tasked with past due monitoring, renewal underwriting, and ongoing risk rating assessment, among other things ON - GOING MONITORING PROCESS ENHANCED PANDEMIC REVIEW

17 PAYCHECK PROTECTION PROGRAM (“PPP”) ▪ Approved 4,244 applications through 8/10/20 ▪ Received SBA approval on $346 million of loans ▪ Funded $346 million of loans ▪ PPP fees of $11.0 million; $0 recognized to date ▪ 100% of PPP loans are C&I SBA PAYCHECK PROTECTION PROGRAM ($000) Count ($000) Count ($000) Count SBA PPP Loans Funded 335,612$ 3,807 345,991$ 4,203 346,054$ 4,244 Net Deferred Income $10,597 $10,970 $10,970 PPP LOANS & DEFERRED INCOME As of June 30, 2020 As of July 31, 2020 As of August 10, 2020 BY SOURCE: Sonabank Origination 70.3% Third Party Referral 29.7% BY MARKET: In Market (VA, MD, DC) 62.6% Out of Market 37.4% PPP LOAN ORIGINATIONS

18 COVID - 19 LOAN MODIFICATIONS ▪ As of August 10, 2020, total modified loans or loans with request for modifications were $575 million or 23.2% of loans outstanding ▪ Total modified loans decreased $133 million, or 19%, from June 30, 2020 to August 10, 2020 ▪ SONA continues to work closely with customers affected by COVID - 19 and stands prepared to offer assistance within regulatory guidelines % of Total $ % of Total $ % of Total $ ($000) Count Total Loans ($000) Count Total Loans ($000) Count Total Loans Loans secured by real estate: Commercial real estate - owner occ. 172,343$ 151 6.9% 137,239$ 133 5.5% 133,859$ 123 5.4% Commercial real estate - non-owner occ. 374,083 105 14.9% 353,329 90 14.2% 327,181 82 13.2% Secured by farmland 780 2 0.0% 780 2 0.0% 780 2 0.0% Construction and land loans 14,619 17 0.6% 7,811 14 0.3% 7,226 12 0.3% Residential 1-4 family 77,721 137 3.1% 61,137 101 2.4% 45,993 77 1.9% Multi-family residential 26,878 15 1.1% 26,229 14 1.1% 25,635 13 1.0% Home equity lines of credit 655 3 0.0% 1,196 4 0.0% 1,196 4 0.0% Total real estate loans 667,079 430 26.6% 587,721 358 23.5% 541,870 313 21.9% Commercial loans 39,694 137 1.6% 36,433 118 1.5% 31,977 110 1.3% Consumer loans 1,068 12 0.0% 752 10 0.0% 752 10 0.0% Total COVID-19 modifications 707,841$ 579 28.2% 624,906$ 486 25.0% 574,598$ 433 23.2% Percentage of loans outstanding 28.2% 25.0% 23.2% As of June 30, 2020 As of July 31, 2020 As of August 10, 2020 LOANS WITH COVID-19 MODIFICATIONS

LOAN PORTFOLIO

20 KEY LENDING STRATEGIES COMMERCIAL BANKING SBA LENDING ▪ Offers a full range of lending options, including commercial real estate ▪ As of 6/30/2020, commercial real estate (1) makes up 49% of total loans, and other commercial loans contribute an additional 8% ▪ Expertise in the federally guaranteed lending program ▪ Preferred Lender in the Washington D.C. and Richmond districts of the SBA ▪ Offers SBA 504 loans and SBA 7A loans ▪ SONA owns 48.9% of Southern Trust Mortgage; the majority of the remaining share are owned by Southern Trust’s management ▪ Headquartered in Virginia Beach with locations in VA, MD, NC and SC ▪ Originates only retail mortgages ▪ SONA primarily purchases loans in its Virginia and Maryland footprint ▪ Purchased $173.8 million of loans from Southern Trust Mortgage in the last twelve months ended June 30, 2020 (1) Defined as Non - Owner Occupied CRE, Owner - Occupied CRE, Multi - Family Residential, and Construction & Land Loans

21 $0 $500,000 $1,000,000 $1,500,000 $2,000,000 $2,500,000 $3,000,000 2016Y 2017Y 2018Y 2019Y 2020Q2 OWNER OCC CRE NON-OWNER OCC CRE CONSTRUCTION & LAND MULTIFAM NON-CRE LOANS LOAN PORTFOLIO DETAIL 6/30/2020 LOAN PORTFOLIO COMPOSITION OBSERVATIONS ▪ 2 nd quarter 2020 loan yield of 4.53% ▪ 1 st half 2020 loan production centered mostly on adjustable rate mortgage offerings with 1 - 4 family mortgages ▪ Substantially all loans are to customers in Virginia and Maryland ▪ Reviewed every relationship and portfolio concentration over $5M in 2Q (65% of total loans) HISTORICAL CRE LOANS / TOTAL LOANS 59.6% OWNER OCC CRE 16.4 % NON - OWNER OCC CRE 23.4 % FARMLAND 0.7 % CONSTRUCTION & LAND 4.8 % 1 - 4 FAM 24.3 % MULTIFAM 4.0 % HELOC 4.0% COMMERCIAL 8.1 % CONSUMER 1.0 % PPP 13.3 % ($000s) 2016Y 2017Y 2018Y 2019Y 2020Q2 Owner Occupied CRE $154,807 $401,847 407,031 414,479 412,916 Non-Owner Occ. CRE 279,634 440,700 540,698 559,195 591,229 Secured by Farmland 541 23,038 20,966 17,622 16,845 Construction and Land 91,067 197,972 146,654 150,750 122,086 Residential 1-4 Family 230,810 483,006 565,083 604,777 612,247 Multi-Family Residential 30,021 70,892 82,516 82,055 100,685 Home Equity Lines of Credit 29,203 152,829 128,225 109,006 101,218 Commercial 115,365 253,258 255,441 221,447 204,160 Consumer 856 39,374 32,347 26,304 24,733 Payment Protection Program 0 0 0 0 335,612 Total Gross Loans $932,304 $2,062,916 $2,178,961 $2,185,635 $2,521,731 LESS: Deferred Fees 1,889 588 137 -412 10,227 Total Loans $930,415 $2,062,328 $2,178,824 $2,186,047 $2,511,504 Loan Portfolio Detail 53.9% 54.0% 55.2% 48.7% CRE LOANS / TOTAL GROSS LOANS:

22 SECTORS WITH ESCALATED MONITORING: HOTELS HOTEL / MOTEL LOAN PORTFOLIO ▪ 6/30/2020 hotel loans of $283.8 million or 11.3% of the loan portfolio ▪ Approximately 76% of hotel loans had been granted a COVID - 19 deferral as of 6/30/2020 ▪ SONA has never experienced a charge - off on hotel loans – most loans are backed by experienced operators with global cash flows ▪ Pre - pandemic, hotel portfolio had debt coverage of approximately 147% and weighted average LTV of 68% (6/30/2020 debt coverage of 135%) ▪ Pre - pandemic global debt service coverage of 165% ▪ 100% pass rated ▪ Portfolio averaged 47% occupancy in July 2020 ▪ Average loan size of $4,359,169 ▪ Substantially all of the hotel loans are to national brands (i.e. Marriott, Hilton, Choice, IHG, Best Western, Wyndham) ▪ 93% of hotel loan portfolio consists of limited service hotels with historically lower operating costs Holiday Inn Express $ 56,281 19.8% Hampton Inn $ 45,126 15.9% Home2Suites by Hilton $ 38,667 13.6% Best Western $ 21,586 7.6% Fairfield Inn by Marriott $ 16,901 6.0% Springhill Suites by Marriott $ 14,467 5.1% Tru by Hilton $ 12,000 4.2% Comfort Inn $ 11,156 3.9% Candlewood Suites $ 8,426 3.0% Country Inn & Suites $ 7,938 2.8% Moxy by Marriott $ 7,000 2.5% Homewood Suites by Hilton $ 5,662 2.0% Other $ 28,245 10.0% Independent $ 10,318 3.6% HOTEL / MOTEL PORTFOLIO, BY FLAG HOTEL / MOTEL PORTFOLIO, BY CLASS Class # of Loans Commitment ($000) Upper Midscale 27 $195,069 Midscale 11 45,735 Upscale 2 20,130 NA - LOCs & Other 6 14,709 Economy 11 8,130 Total Hotel / Motel 57 $283,773 Debt Coverage 135% LTV 68%

23 Taco Bell $33,251 38% Arbys $5,176 6% Blaze Pizza $6,385 7% Tropical Smoothie Café $1,201 1% Wendy's $926 1% Baskin Robins Ice Cream $690 1% Subway $926 1% Independent $ 35,635 40% Other $ 4,010 5% SECTORS WITH ESCALATED MONITORING: RESTAURANTS RESTAURANT PORTFOLIO ▪ $80.5M of restaurant exposure, 3.2% of total loans ▪ Approximately 86% of the restaurant portfolio has been granted a COVID - 19 deferral ▪ Limited service LTV of 67.7%; Full service LTV of 40.1% ▪ Average loan size ▪ Limited service: $869,537 ▪ Full service: $648,585 ▪ Restaurants secured by real estate: ▪ Limited service: 83% secured by RE; average LTV of 68% ▪ Full service: 78% secured by RE; average LTV of 40% ▪ 100% pass rated ▪ Restaurant portfolio has only experienced 1 charge - off since 2018 ▪ Top restaurant brands with national and global scale with resources to maintain market share ▪ Delivery and drive - through capabilities / allow for the possibility of better weathering of the pandemic ▪ Experienced owner operators with proven performance RESTAURANT EXPOSURE BY BRAND FULL - SERVICE VS. LIMITED - SERVICE $51.3 Million 63.7% of Restaurant Portfolio $29.2 Million 36.3% of Restaurant Portfolio
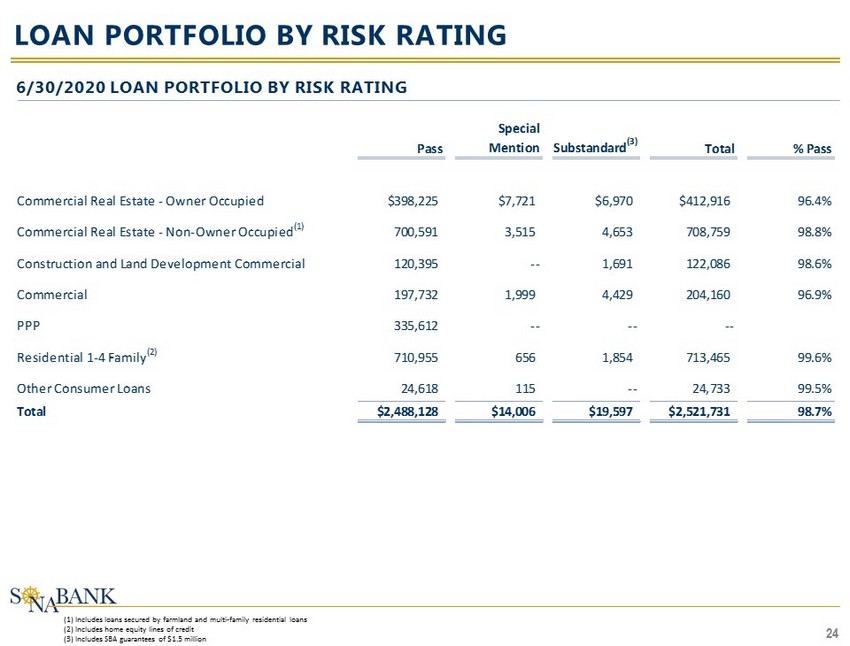
24 LOAN PORTFOLIO BY RISK RATING (1) Includes loans secured by farmland and multi - family residential loans (2) Includes home equity lines of credit (3) Includes SBA guarantees of $1.5 million 6/30/2020 LOAN PORTFOLIO BY RISK RATING Pass Special Mention Substandard (3) Total % Pass Commercial Real Estate - Owner Occupied $398,225 $7,721 $6,970 $412,916 96.4% Commercial Real Estate - Non-Owner Occupied (1) 700,591 3,515 4,653 708,759 98.8% Construction and Land Development Commercial 120,395 -- 1,691 122,086 98.6% Commercial 197,732 1,999 4,429 204,160 96.9% PPP 335,612 -- -- -- Residential 1-4 Family (2) 710,955 656 1,854 713,465 99.6% Other Consumer Loans 24,618 115 -- 24,733 99.5% Total $2,488,128 $14,006 $19,597 $2,521,731 98.7%

FUNDING AND LIQUIDITY
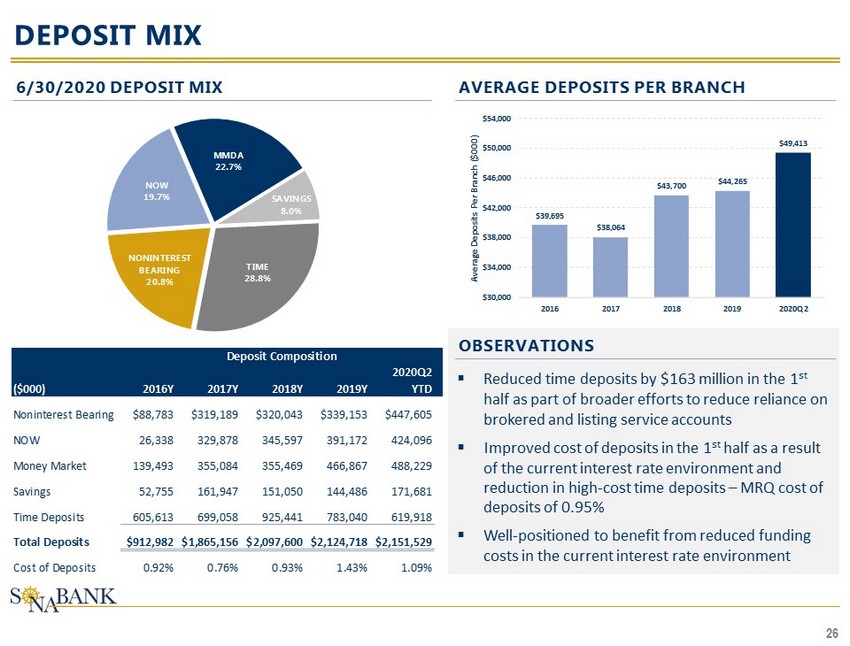
26 DEPOSIT MIX 6/30/2020 DEPOSIT MIX OBSERVATIONS ▪ Reduced time deposits by $163 million in the 1 st half as part of broader efforts to reduce reliance on brokered and listing service accounts ▪ Improved cost of deposits in the 1 st half as a result of the current interest rate environment and reduction in high - cost time deposits – MRQ cost of deposits of 0.95% ▪ Well - positioned to benefit from reduced funding costs in the current interest rate environment AVERAGE DEPOSITS PER BRANCH (1) NONINTEREST BEARING 20.8 % NOW 19.7 % MMDA 22.7 % SAVINGS 8.0 % TIME 28.8 % $39,695 $ 38,064 $ 43,700 $ 44,265 $ 49,413 $30,000 $34,000 $38,000 $42,000 $46,000 $50,000 $54,000 2016 2017 2018 2019 2020Q2 Average Deposits Per Branch ($ 000 ) ($000) 2016Y 2017Y 2018Y 2019Y 2020Q2 YTD Noninterest Bearing $88,783 $319,189 $320,043 $339,153 $447,605 NOW 26,338 329,878 345,597 391,172 424,096 Money Market 139,493 355,084 355,469 466,867 488,229 Savings 52,755 161,947 151,050 144,486 171,681 Time Deposits 605,613 699,058 925,441 783,040 619,918 Total Deposits $912,982 $1,865,156 $2,097,600 $2,124,718 $2,151,529 Cost of Deposits 0.92% 0.76% 0.93% 1.43% 1.09% Deposit Composition

27 LIQUIDITY ▪ SONA manages liquidity to meet short - term financial obligations including the payment of deposits on demand or at maturity, the repayment of borrowings at maturity and the ability to fund commitments and other new business opportunities ▪ Funding is obtained through a variety of sources: ▪ Customer deposit accounts ▪ Customer certificates of deposits and payments on our loans and investments ▪ Institutional certificates of deposits ▪ Sale of available for sale investment securities ▪ FHLB funding (line of credit with the FHLB of Atlanta) ▪ Federal funds lines of credit with three correspondent banks ▪ Securities sold under agreements to repurchase ▪ Reverse repurchase agreement borrowings from approved securities dealers ▪ SONA has the following sources of liquidity: ▪ Approximately $4.5 million in cash at the holding company ($82.6 million total consolidated cash & equivalents) ▪ $50.4 million in dividend capacity from Sonabank (without prior regulatory approval required)
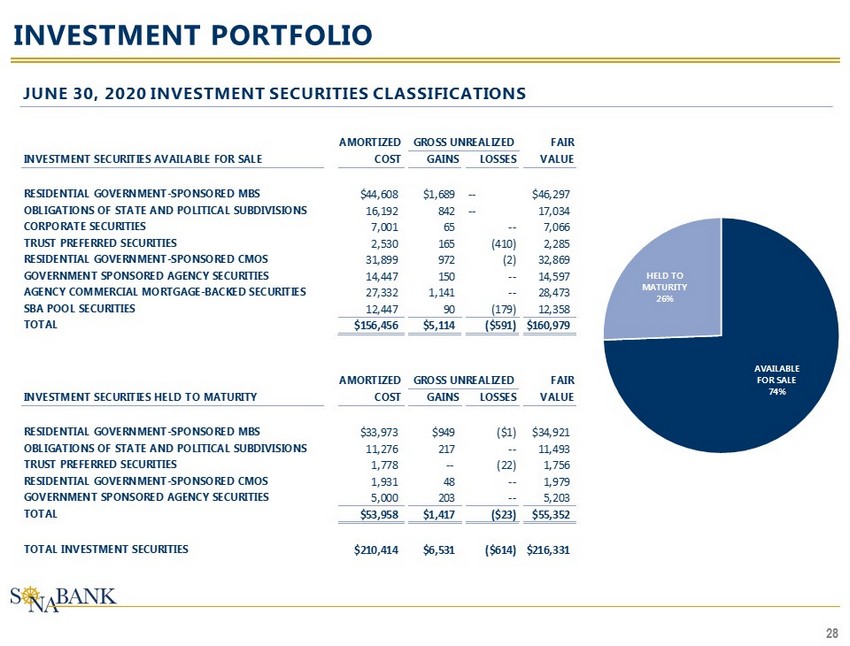
28 AVAILABLE FOR SALE 74 % HELD TO MATURITY 26 % INVESTMENT PORTFOLIO AMORTIZED FAIR INVESTMENT SECURITIES AVAILABLE FOR SALE COST GAINS LOSSES VALUE RESIDENTIAL GOVERNMENT-SPONSORED MBS $44,608 $1,689 -- $46,297 OBLIGATIONS OF STATE AND POLITICAL SUBDIVISIONS 16,192 842 -- 17,034 CORPORATE SECURITIES 7,001 65 -- 7,066 TRUST PREFERRED SECURITIES 2,530 165 (410) 2,285 RESIDENTIAL GOVERNMENT-SPONSORED CMOS 31,899 972 (2) 32,869 GOVERNMENT SPONSORED AGENCY SECURITIES 14,447 150 -- 14,597 AGENCY COMMERCIAL MORTGAGE-BACKED SECURITIES 27,332 1,141 -- 28,473 SBA POOL SECURITIES 12,447 90 (179) 12,358 TOTAL $156,456 $5,114 ($591) $160,979 AMORTIZED FAIR INVESTMENT SECURITIES HELD TO MATURITY COST GAINS LOSSES VALUE RESIDENTIAL GOVERNMENT-SPONSORED MBS $33,973 $949 ($1) $34,921 OBLIGATIONS OF STATE AND POLITICAL SUBDIVISIONS 11,276 217 -- 11,493 TRUST PREFERRED SECURITIES 1,778 -- (22) 1,756 RESIDENTIAL GOVERNMENT-SPONSORED CMOS 1,931 48 -- 1,979 GOVERNMENT SPONSORED AGENCY SECURITIES 5,000 203 -- 5,203 TOTAL $53,958 $1,417 ($23) $55,352 TOTAL INVESTMENT SECURITIES $210,414 $6,531 ($614) $216,331 GROSS UNREALIZED GROSS UNREALIZED JUNE 30, 2020 INVESTMENT SECURITIES CLASSIFICATIONS

APPENDIX

30 CONSOLIDATED FINANCIAL HIGHLIGHTS For the Twelve Months Ended In $000s except for per share data 12/31/2017 12/31/2018 12/31/2019 9/30/2019 12/31/2019 3/31/2020 06/30/20 Balance Sheet Total Assets $2,614,252 $2,701,295 $2,722,170 $2,698,915 $2,722,170 $2,762,563 $3,072,171 Total Gross Loans $2,062,328 $2,178,824 $2,186,047 $2,141,385 $2,186,047 $2,212,538 $2,511,504 Total Deposits $1,865,156 $2,097,600 $2,124,718 $2,178,738 $2,124,718 $2,075,354 $2,151,529 Loans/Deposits 110.57% 103.87% 102.89% 98.29% 102.89% 106.61% 116.73% Capital Common Equity $322,772 $348,290 $377,241 $370,630 $377,241 $378,822 $381,669 Preferred Equity $0 $0 $0 $0 $0 $0 $0 Total Equity/Assets 12.35% 12.89% 13.86% 13.73% 13.86% 13.71% 12.42% Tang. Common Equity/Tang. Assets 8.47% 9.18% 10.26% 10.09% 10.26% 10.17% 8.89% Tangible Equity/Tangible Assets 8.47% 9.18% 10.26% 10.09% 10.26% 10.17% 8.89% Profitability Measures Net Interest Margin 3.87% 3.72% 3.39% 3.40% 3.35% 3.30% 3.31% Non Interest Income/Average Assets 0.29% 0.40% 0.40% 0.35% 0.42% 0.38% 0.57% Non Interest Expense/Average Assets 2.07% 2.00% 1.94% 1.85% 2.04% 2.01% 1.90% Efficiency Ratio 52.23% 51.03% 54.49% 52.42% 57.16% 57.83% 51.41% ROAA 0.13% 1.25% 1.22% 1.30% 1.32% 0.00% 0.64% ROAE 1.02% 9.99% 9.13% 9.65% 9.59% 0.03% 4.91% Earnings per share $0.13 $1.40 $1.38 $0.37 $0.37 $0.00 $0.19 Net Income $2,425 $33,691 $33,167 $8,864 $8,964 $27 $4,709 Asset Quality NPAs/Assets 0.78% 0.34% 0.43% 0.26% 0.43% 0.46% 0.62% NPAs (excl TDRs)/Assets 0.76% 0.31% 0.40% 0.24% 0.40% 0.43% 0.57% NCOs/Avg Loans 0.52% 0.06% 0.11% 0.10% 0.17% 0.18% 0.00% Reserves/Loans 0.46% 0.56% 0.47% 0.52% 0.47% 0.57% 0.94% Quarters Ended

31 KROLL RATINGS Source : Kroll Bond Ratings Agency SOUTHERN NATIONAL BANCORP OF VIRGINIA, INC. Senior Unsecured Debt BBB Subordinated Debt BBB- Short-Term Debt K3 SONABANK Senior Unsecured Debt BBB+ Deposit BBB+ Subordinated Debt BBB Short-Term Deposit K2 Short-Term Debt K2 OUTLOOK Stable KROLL BOND RATING AGENCY - RATINGS SUMMARY MOST RECENT KROLL RATINGS
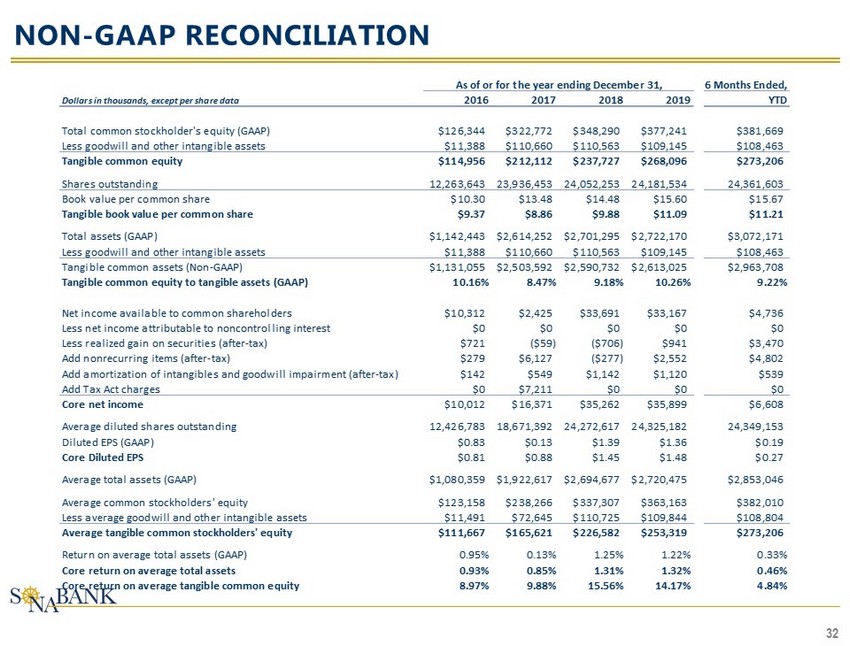
32 NON - GAAP RECONCILIATION 6 Months Ended, Dollars in thousands, except per share data 2016 2017 2018 2019 YTD Total common stockholder's equity (GAAP) $126,344 $322,772 $348,290 $377,241 $381,669 Less goodwill and other intangible assets $11,388 $110,660 $110,563 $109,145 $108,463 Tangible common equity $114,956 $212,112 $237,727 $268,096 $273,206 Shares outstanding 12,263,643 23,936,453 24,052,253 24,181,534 24,361,603 Book value per common share $10.30 $13.48 $14.48 $15.60 $15.67 Tangible book value per common share $9.37 $8.86 $9.88 $11.09 $11.21 Total assets (GAAP) $1,142,443 $2,614,252 $2,701,295 $2,722,170 $3,072,171 Less goodwill and other intangible assets $11,388 $110,660 $110,563 $109,145 $108,463 Tangible common assets (Non-GAAP) $1,131,055 $2,503,592 $2,590,732 $2,613,025 $2,963,708 Tangible common equity to tangible assets (GAAP) 10.16% 8.47% 9.18% 10.26% 9.22% Net income available to common shareholders $10,312 $2,425 $33,691 $33,167 $4,736 Less net income attributable to noncontrolling interest $0 $0 $0 $0 $0 Less realized gain on securities (after-tax) $721 ($59) ($706) $941 $3,470 Add nonrecurring items (after-tax) $279 $6,127 ($277) $2,552 $4,802 Add amortization of intangibles and goodwill impairment (after-tax) $142 $549 $1,142 $1,120 $539 Add Tax Act charges $0 $7,211 $0 $0 $0 Core net income $10,012 $16,371 $35,262 $35,899 $6,608 Average diluted shares outstanding 12,426,783 18,671,392 24,272,617 24,325,182 24,349,153 Diluted EPS (GAAP) $0.83 $0.13 $1.39 $1.36 $0.19 Core Diluted EPS $0.81 $0.88 $1.45 $1.48 $0.27 Average total assets (GAAP) $1,080,359 $1,922,617 $2,694,677 $2,720,475 $2,853,046 Average common stockholders' equity $123,158 $238,266 $337,307 $363,163 $382,010 Less average goodwill and other intangible assets $11,491 $72,645 $110,725 $109,844 $108,804 Average tangible common stockholders' equity $111,667 $165,621 $226,582 $253,319 $273,206 Return on average total assets (GAAP) 0.95% 0.13% 1.25% 1.22% 0.33% Core return on average total assets 0.93% 0.85% 1.31% 1.32% 0.46% Core return on average tangible common equity 8.97% 9.88% 15.56% 14.17% 4.84% As of or for the year ending December 31,

33 NON - GAAP RECONCILIATION 6 Months Ended, Dollars in thousands, except per share data 2017 2018 2019 6/30/2020 Allowance for Loan Losses A $9,397 $12,283 $10,261 $23,627 Credit Marks on Acquired Loans $21,061 $15,055 $11,153 $8,645 Allowance for Loan Losses + Credit Marks on Acquired Loans B $30,458 $27,338 $21,414 $32,272 Total Gross Loans C 2,062,328 2,178,824 2,186,047 2,511,504 Allowance for Loan Losses / Total Loans (A / C) 0.46% 0.56% 0.47% 0.94% (Allowance for Loan Losses + Credit Marks on Acquired Loans) / Total Loans (B / C) 1.48% 1.25% 0.98% 1.28% As of or for the year ending December 31,