Attached files
| file | filename |
|---|---|
| EX-99.2 - PRESS RELEASE ISSUED AUGUST 14, 2020 - LEXINGTON REALTY TRUST | exh99-2.htm |
| 8-K - FORM 8-K - LEXINGTON REALTY TRUST | n22883_x2-8k.htm |
Exhibit 99.1

Fixed Income Presentation August 2020
Disclosure This presentation contains certain forward-looking statements within the meaning of Section 27A of the Securities Act of 1933, as amended, and Section 21E of the Securities Exchange Act of 1934, as amended, which involve known and unknown risks, uncertainties or other factors not under Lexington Realty Trust’s (“Lexington” or “LXP”) control which may cause actual results, performance or achievements of Lexington to be materially different from the results, performance, or other expectations implied by these forward-looking statements. These factors include, but are not limited to, those factors and risks detailed in Lexington’s filings with the Securities and Exchange Commission, including LXP's Annual Report on Form 10-K for the year ended December 31, 2019 and Quarterly Report on Form 10-Q for the quarter ended June 30, 2020. Except as required by law, Lexington undertakes no obligation to (1) publicly release the results of any revisions to those forward-looking statements which may be made to reflect events or circumstances after the occurrence of unanticipated events or (2) update or supplement forward-looking statements that become untrue because of subsequent events. Accordingly, there is no assurance that Lexington’s expectations will be realized. In addition to GAAP financials, this presentation includes certain non-GAAP financial measures, including Adjusted Company FFO, Adjusted EBITDA and Net Operating Income among others. These non-GAAP measures are in addition to, not a substitute for or superior to, measures of financial performance prepared in accordance with GAAP. The non-GAAP financial measures used by LXP may differ from the non-GAAP financial measures used by other companies. A reconciliation of these measures to the most directly comparable GAAP measure is included in the Definitions & Reconciliations section of this presentation.
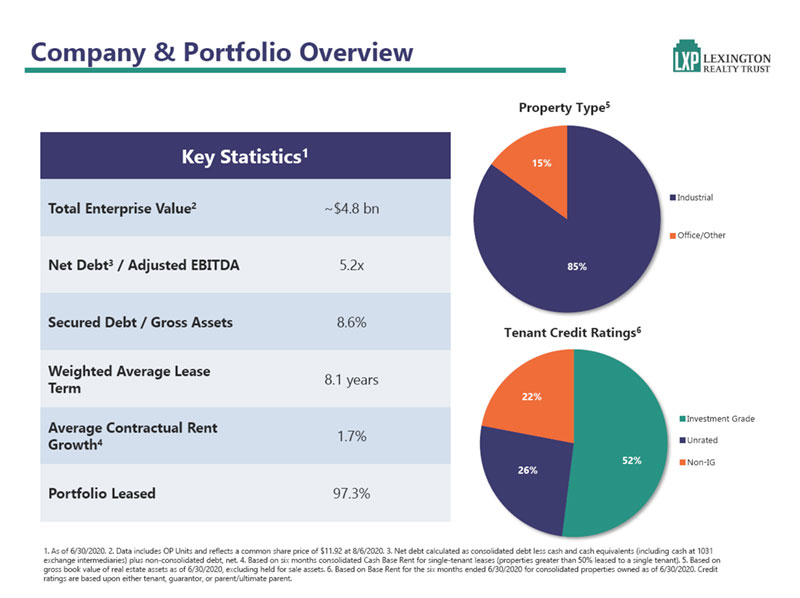
Company & Portfolio Overview Key Statistics1 Total Enterprise Value2 ~$4.8 bn Net Debt3 / Adjusted EBITDA 5.2x Secured Debt / Gross Assets 8.6% Weighted Average Lease 8.1 years Term Average Contractual Rent 1.7% Growth4 Portfolio Leased 97.3% Property Type5 Tenant Credit Ratings6 1. As of 6/30/2020. 2. Data includes OP Units and reflects a common share price of $11.92 at 8/6/2020. 3. Net debt calculated as consolidated debt less cash and cash equivalents (including cash at 1031 exchange intermediaries) plus non-consolidated debt, net. 4. Based on six months consolidated Cash Base Rent for single-tenant leases (properties greater than 50% leased to a single tenant). 5. Based on gross book value of real estate assets as of 6/30/2020, excluding held for sale assets. 6. Based on Base Rent for the six months ended 6/30/2020 for consolidated properties owned as of 6/30/2020. Credit ratings are based upon either tenant, guarantor, or parent/ultimate parent.
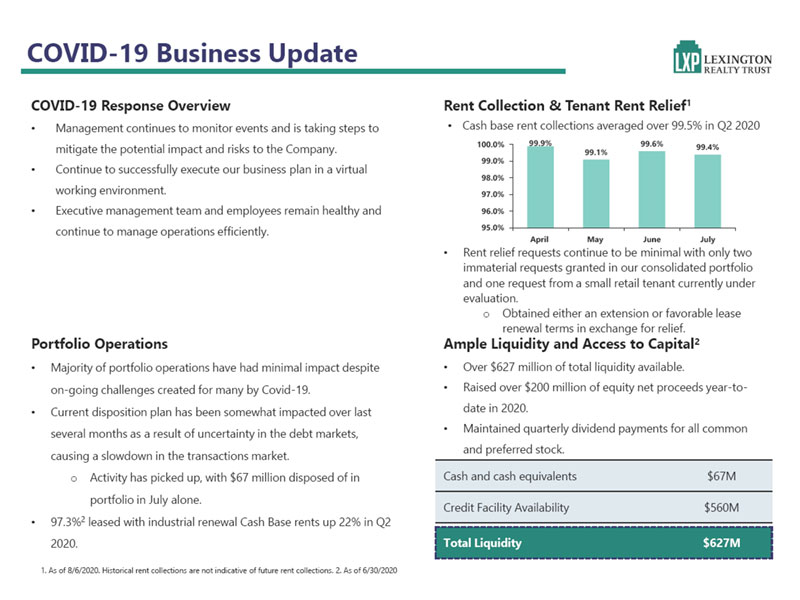
COVID-19 Business Update COVID-19 Response Overview Management continues to monitor events and is taking steps to mitigate the potential impact and risks to the Company. Continue to successfully execute our business plan in a virtual working environment. Executive management team and employees remain healthy and continue to manage operations efficiently. Portfolio Operations Majority of portfolio operations have had minimal impact despite on-going challenges created for many by Covid-19. Current disposition plan has been somewhat impacted over last several months as a result of uncertainty in the debt markets, causing a slowdown in the transactions market. o Activity has picked up, with $67 million disposed of in portfolio in July alone. 97.3%2 leased with industrial renewal Cash Base rents up 22% in Q2 2020. Rent Collection & Tenant Rent Relief1 Cash base rent collections averaged over 99.5% in Q2 2020 Rent relief requests continue to be minimal with only two immaterial requests granted in our consolidated portfolio and one request from a small retail tenant currently under evaluation. o Obtained either an extension or favorable lease renewal terms in exchange for relief. Ample Liquidity and Access to Capital2 Over $627 million of total liquidity available. Raised over $200 million of equity net proceeds year-to-date in 2020. Maintained quarterly dividend payments for all common and preferred stock. Cash and cash equivalents $67M Credit Facility Availability $560M Total Liquidity $627M 1. As of 8/6/2020. Historical rent collections are not indicative of future rent collections. 2. As of 6/30/2020
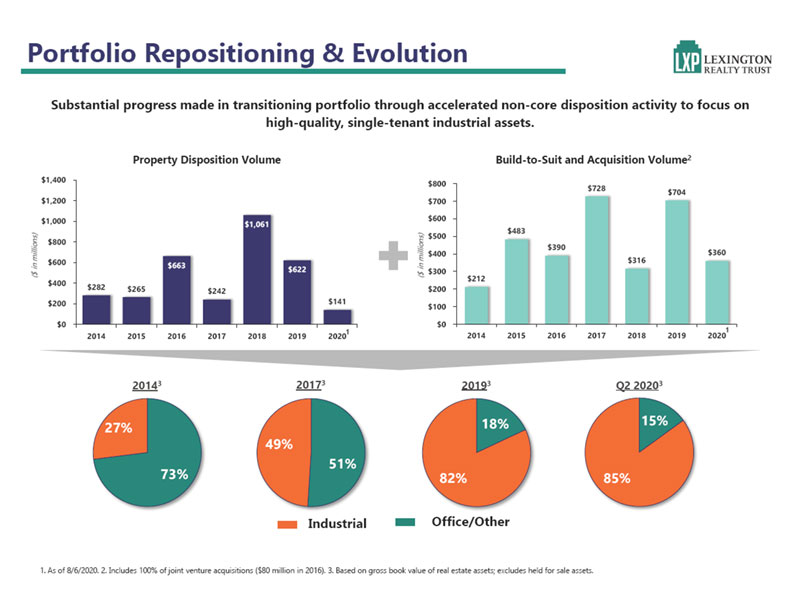
Portfolio Repositioning & Evolution Substantial progress made in transitioning portfolio through accelerated non-core disposition activity to focus on high-quality, single-tenant industrial assets. Property Disposition Volume Build-to-Suit and Acquisition Volume2 1. As of 8/6/2020. 2. Includes 100% of joint venture acquisitions ($80 million in 2016). 3. Based on gross book value of real estate assets; excludes held for sale assets.
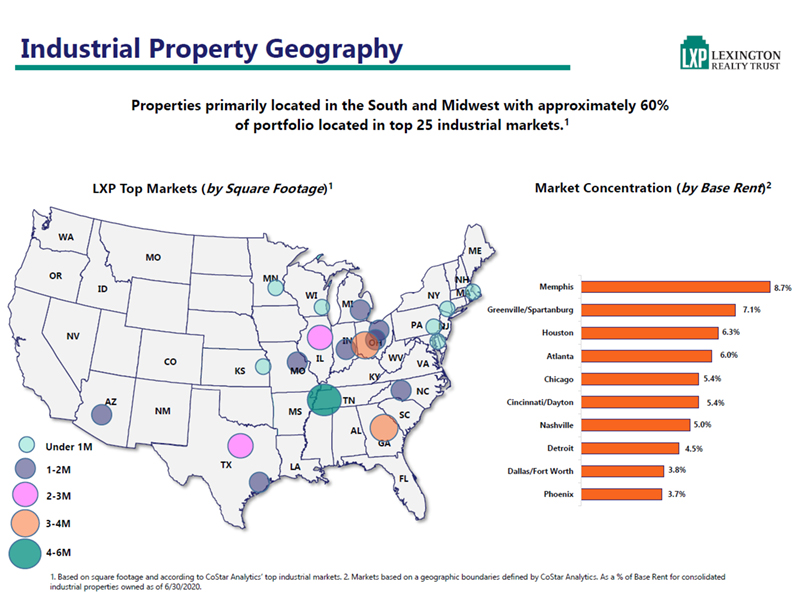
Industrial Property Geography Properties primarily located in the South and Midwest with approximately 60% of portfolio located in top 25 industrial markets.1 LXP Top Markets (by Square Footage)1 Market Concentration (by Base Rent)2 WA ME MO OR MN NH ID Memphis 8.7% WI NY MA A MI Greenville/Spartanburg 7.1% PA NJ NV Houston 6.3% IN OH IL WV Atlanta 6.0% CO VA KS MO KY Chicago 5.4% NC AZ TN Cincinnati/Dayton 5.4% NM MS SC Nashville 5.0% AL Under 1M GA Detroit 4.5% TX LA 1-2M Dallas/Fort Worth 3.8% FL 2-3M Phoenix 3.7% 3-4M 4-6M 1. Based on square footage and according to CoStar Analytics’ top industrial markets. 2. Markets based on a geographic boundaries defined by CoStar Analytics. As a % of Base Rent for consolidated industrial properties owned as of 6/30/2020.
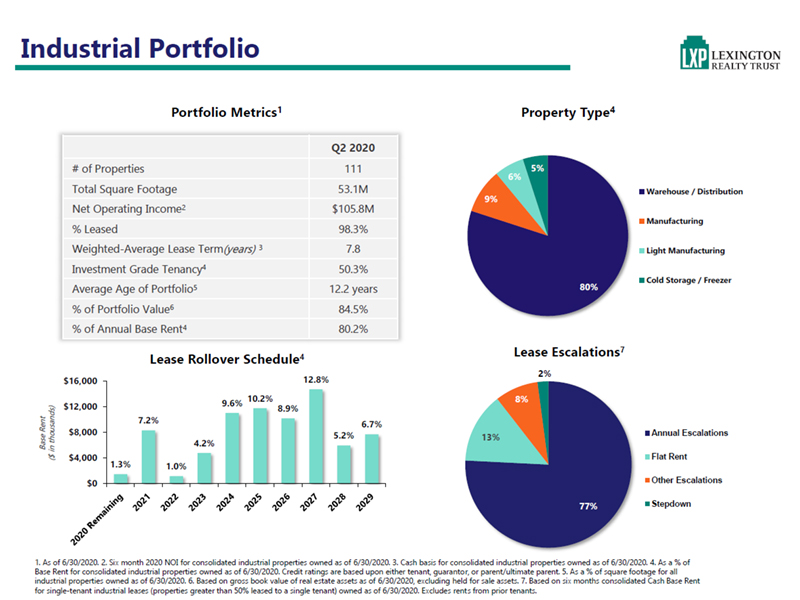
Industrial Portfolio Portfolio Metrics1 Property Type4 Q2 2020 # of Properties 111 6% 5% Total Square Footage 53.1M Warehouse / Distribution 9% Net Operating Income2 $105.8M Manufacturing % Leased 98.3% Weighted-Average Lease Term(years) 3 7.8 Light Manufacturing Investment Grade Tenancy4 50.3% Cold Storage / Freezer Average Age of Portfolio5 12.2 years 80% % of Portfolio Value6 84.5% % of Annual Base Rent4 80.2% Lease Rollover Schedule4 Lease Escalations7 2% $16,000 12.8% 9.6% 10.2% 8% $12,000 8.9% 7.2% 6.7% $8,000 5.2% Annual Escalations 13% Base Rent 4.2% ($ in thousands) $4,000 Flat Rent 1.3% 1.0% $0 Other Escalations Georgia Pacific, Atlanta, GA 77% Stepdown Amazon, Edwardsville, IL Contine Tire, Lebanon, IN 1. As of 6/30/2020. 2. Six month 2020 NOI for consolidated industrial properties owned as of 6/30/2020. 3. Cash basis for consolidated industrial properties owned as of 6/30/2020. 4. As a % of Base Rent for consolidated industrial properties owned as of 6/30/2020. Credit ratings are based upon either tenant, guarantor, or parent/ultimate parent. 5. As a % of square footage for all industrial properties owned as of 6/30/2020. 6. Based on gross book value of real estate assets as of 6/30/2020, excluding held for sale assets. 7. Based on six months consolidated Cash Base Rent for single-tenant industrial leases (properties greater than 50% leased to a single tenant) owned as of 6/30/2020. Excludes rents from prior tenants.
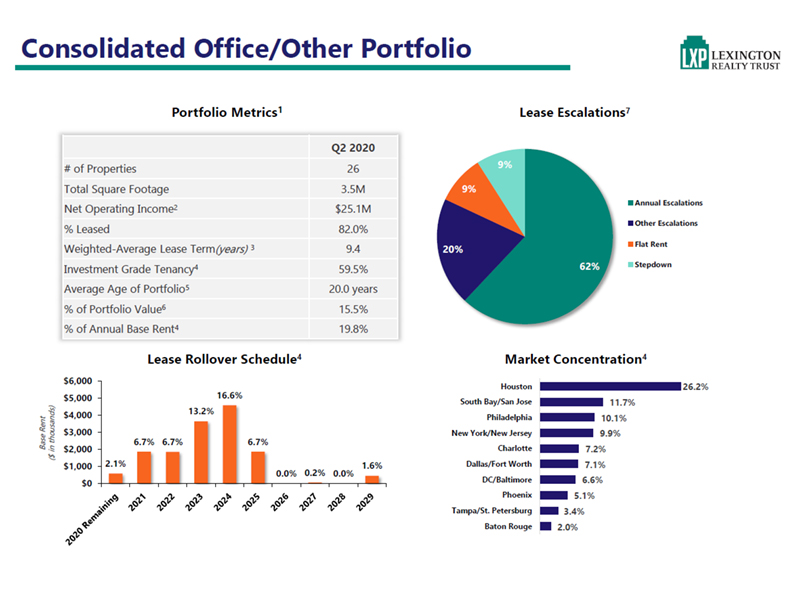
Consolidated Office/Other Portfolio Portfolio Metrics1 Lease Escalations7 Q2 2020 # of Properties 26 9% Total Square Footage 3.5M 9% Net Operating Income2 $25.1M Annual Escalations % Leased 82.0% Other Escalations Weighted-Average Lease Term(years) 3 9.4 20% Flat Rent Investment Grade Tenancy4 59.5% 62% Stepdown Average Age of Portfolio5 20.0 years % of Portfolio Value6 15.5% % of Annual Base Rent4 19.8% Lease Rollover Schedule4 Market Concentration4 $6,000 Houston 26.2% $5,000 16.6% South Bay/San Jose 11.7% $4,000 13.2% Philadelphia 10.1% $3,000 New York/New Jersey 9.9% Base Rent 6.7% 6.7% 6.7% ($ in thousands) $2,000 Charlotte 7.2% $1,000 2.1% Dallas/Fort Worth 7.1% 0.0% 0.2% 0.0% 1.6% $0 DC/Baltimore 6.6% Phoenix 5.1% Tampa/St. Petersburg 3.4% Baton Rouge 2.0%
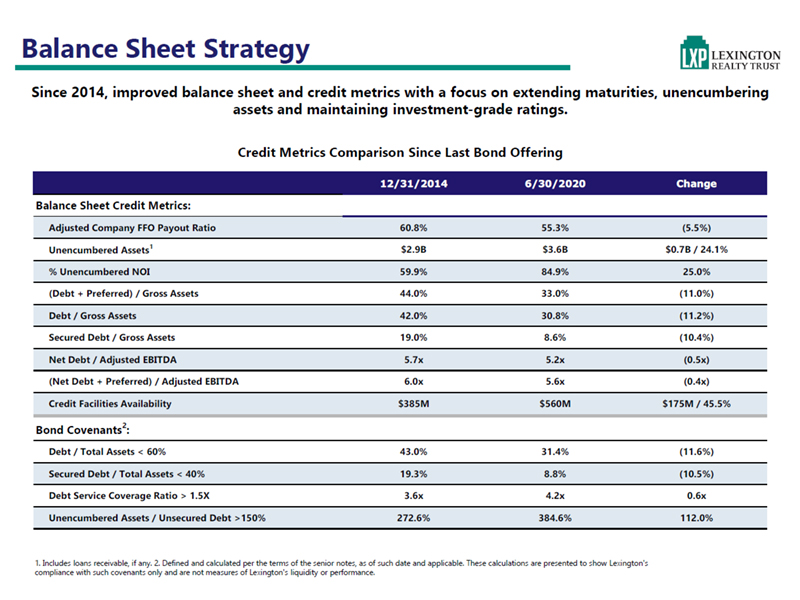
Balance Sheet Strategy Since 2014, improved balance sheet and credit metrics with a focus on extending maturities, unencumbering assets and maintaining investment-grade ratings. Credit Metrics Comparison Since Last Bond Offering 12/31/2014 6/30/2020 Change Balance Sheet Credit Metrics: Adjusted Company FFO Payout Ratio 60.8% 55.3% (5.5%) Unencumbered Assets1 $2.9B $3.6B $0.7B / 24.1% % Unencumbered NOI 59.9% 84.9% 25.0% (Debt + Preferred) / Gross Assets 44.0% 33.0% (11.0%) Debt / Gross Assets 42.0% 30.8% (11.2%) Secured Debt / Gross Assets 19.0% 8.6% (10.4%) Net Debt / Adjusted EBITDA 5.7x 5.2x (0.5x) (Net Debt + Preferred) / Adjusted EBITDA 6.0x 5.6x (0.4x) Credit Facilities Availability $385M $560M $175M / 45.5% Bond Covenants2: Debt / Total Assets < 60% 43.0% 31.4% (11.6%) Secured Debt / Total Assets < 40% 19.3% 8.8% (10.5%) Debt Service Coverage Ratio > 1.5X 3.6x 4.2x 0.6x Unencumbered Assets / Unsecured Debt >150% 272.6% 384.6% 112.0% 1. Includes loans receivable, if any. 2. Defined and calculated per the terms of the senior notes, as of such date and applicable. These calculations are presented to show Lexington's compliance with such covenants only and are not measures of Lexington's liquidity or performance.
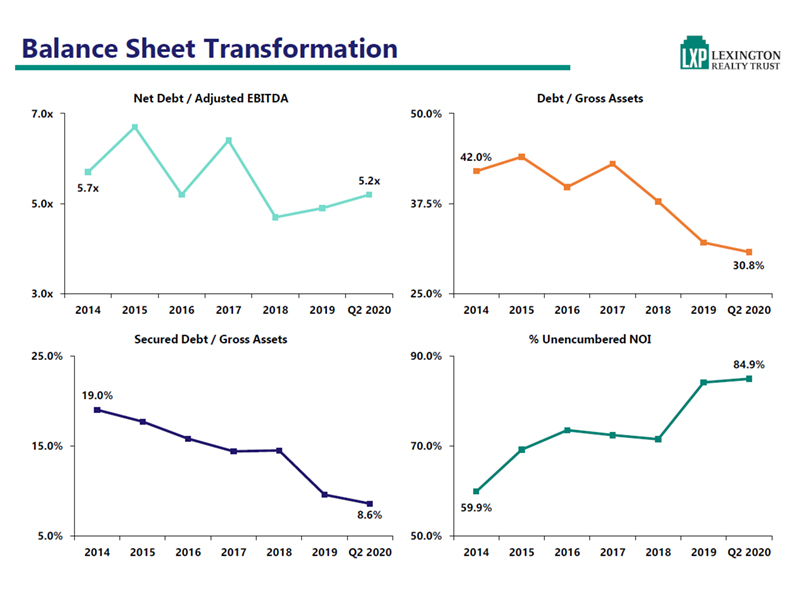
Balance Sheet Transformation Net Debt / Adjusted EBITDA Debt / Gross Assets 7.0x 50.0% 42.0% 5.2x 5.7x 5.0x 37.5% 30.8% 3.0x 25.0% 2014 2015 2016 2017 2018 2019 Q2 2020 2014 2015 2016 2017 2018 2019 Q2 2020 Secured Debt / Gross Assets % Unencumbered NOI 25.0% 90.0% 84.9% 19.0% 15.0% 70.0% 59.9% 8.6% 5.0% 50.0% 2014 2015 2016 2017 2018 2019 Q2 2020 2014 2015 2016 2017 2018 2019 Q2 2020
Non-GAAP Measures-Definitions Lexington has used non-GAAP financial measures as defined by Regulation G promulgated by the Securities and Exchange Commission in this presentation. Lexington believes that the measures defined below are helpful to investors in measuring Lexington’s performance or that of an individual investment. Since these measures exclude certain items which are included in their respective most comparable Generally Accepted Accounting Principles (“GAAP”) measures, reliance on the measures has limitations; management compensates for these limitations by using the measures simply as supplemental measures that are weighed in balance with other GAAP measures. These measures are not necessarily indications of our cash flow available to fund cash needs. Additionally, they should not be used as an alternative to the respective most comparable GAAP measures when evaluating Lexington's financial performance or cash flow from operating, investing, or financing activities or liquidity. Funds from Operations and Adjusted Company FFO(FFO and Adjusted Company FFO): Lexington believes that Funds from Operations, or FFO, which is a non-GAAP measure, is a widely recognized and appropriate measure of the performance of an equity real estate investment trust (“REIT”). Lexington believes FFO is frequently used by securities analysts, investors and other interested parties in the evaluation of REITs, many of which present FFO when reporting their results. FFO is intended to exclude GAAP historical cost depreciation and amortization of real estate and related assets, which assumes that the value of real estate diminishes ratably over time. Historically, however, real estate values have risen or fallen with market conditions. As a result, FFO provides a performance measure that, when compared year over year, reflects the impact to operations from trends in occupancy rates, rental rates, operating costs, development activities, interest costs and other matters without the inclusion of depreciation and amortization, providing perspective that may not necessarily be apparent from net income. The National Association of Real Estate Investment Trusts, or NAREIT, defines FFO as “net income (calculated in accordance with GAAP), excluding depreciation and amortization related to real estate, gains and losses from the sales of certain real estate assets, gains and losses from change in control and impairment write-downs of certain real estate assets and investments in entities when the impairment is directly attributable to decreases in value of depreciable real estate held by the entity. The reconciling items include amounts to adjust earnings from consolidated partially-owned entities and equity in earnings of unconsolidated affiliates to FFO.” FFO does not represent cash generated from operating activities in accordance with GAAP and is not indicative of cash available to fund cash needs. Lexington presents FFO available to common shareholders and unitholders - basic and also presents FFO available to all equityholders and unitholders - diluted on a company-wide basis as if all securities that are convertible, at the holder's option, into Lexington’s common shares, are converted at the beginning of the period. Lexington also presents Adjusted Company FFO available to all equityholders and unitholders – diluted which adjusts FFO available to all equityholders and unitholders - diluted for certain items which we believe are not indicative of the operating results of Lexington's real estate portfolio. Lexington believes this is an appropriate presentation as it is frequently requested by security analysts, investors and other interested parties. Since others do not calculate these measures in a similar fashion, these measures may not be comparable to similarly titled measures as reported by others. These measures should not be considered as an alternative to net income as an indicator of Lexington’s operating performance or as an alternative to cash flow as a measure of liquidity.
Non-GAAP Measures-Definitions, cont. Net Operating Income (NOI): a measure of operating performance used to evaluate the individual performance of an investment. This measure is not presented or intended to be viewed as a liquidity or performance measure that presents a numerical measure of Lexington’s historical or future financial performance, financial position or cash flows. Lexington defines NOI as operating revenues (rental income (less GAAP rent adjustments and lease termination income) and other property income) less property operating expenses. Other REITs may use different methodologies for calculating NOI, and accordingly, Lexington's NOI may not be comparable to that of other companies. Because NOI excludes general and administrative expenses, interest expense, depreciation and amortization, acquisition related expenses, other nonproperty income and losses, and gains and losses from property dispositions, it provides a performance measure that, when compared year over year, reflects the revenues and expenses directly associated with owning and operating commercial real estate and the impact to operations from trends in occupancy rates, rental rates, and operating costs, providing a perspective on operations not immediately apparent from net income. Lexington believes that net income is the most directly comparable GAAP measure to NOI. Adjusted EBITDA: Adjusted EBITDA represents EBITDA (earnings before interest, taxes, depreciation and amortization) modified to include other adjustments to GAAP net income for gains on sales of properties, impairment charges, debt satisfaction gains (charges), net, non-cash charges, net, straight-line adjustments, non-recurring charges and adjustments for pro-rata share of non-wholly owned entities. Lexington’s calculation of Adjusted EBITDA may not be comparable to similarly titled measures used by other companies. Lexington believes that net income is the most directly comparable GAAP measure to Adjusted EBITDA. Base Rent: Base Rent is calculated by making adjustments to GAAP rental revenue to exclude billed tenant reimbursements and lease termination income and to include ancillary income. Base Rent excludes reserves/write-offs of deferred rent receivable, as applicable. Lexington believes Base Rent provides a meaningful measure due to the net lease structure of leases in portfolio. Cash Base Rent: Cash Base Rent is calculated by making adjustments to GAAP rental revenue to remove the impact of GAAP required adjustments to rental income such as adjustments for straight-line rents related to free rent periods and contractual rent increases. Cash Base Rent excludes billed tenant reimbursements and lease termination income and includes ancillary income. Lexington believes Cash Base Rent provides a meaningful indication of an investments ability to fund cash needs.
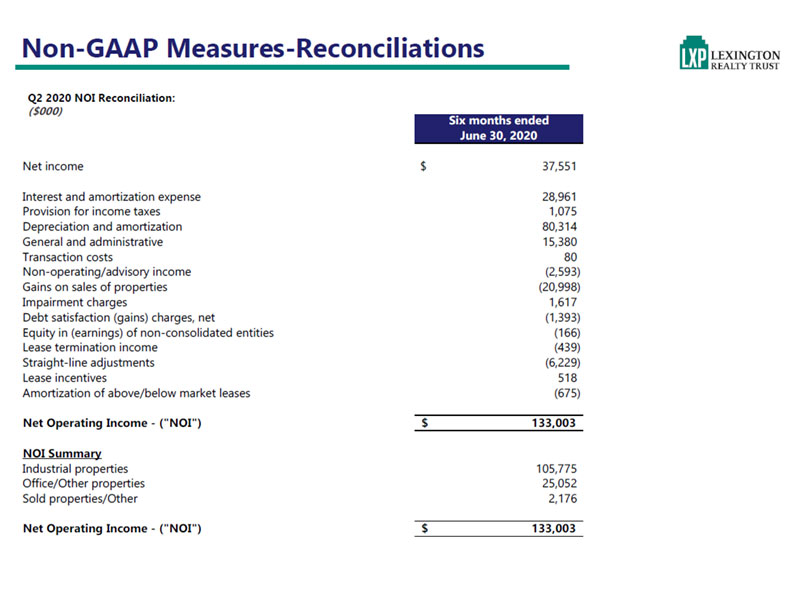
Non-GAAP Measures-Reconciliations Q2 2020 NOI Reconciliation: ($000) Six months ended June 30, 2020 Net income $ 37,551 Interest and amortization expense 28,961 Provision for income taxes 1,075 Depreciation and amortization 80,314 General and administrative 15,380 Transaction costs 80 Non-operating/advisory income (2,593) Gains on sales of properties (20,998) Impairment charges 1,617 Debt satisfaction (gains) charges, net (1,393) Equity in (earnings) of non-consolidated entities (166) Lease termination income (439) Straight-line adjustments (6,229) Lease incentives 518 Amortization of above/below market leases (675) Net Operating Income - (“NOI”) $ 133,003 NOI Summary Industrial properties 105,775 Office/Other properties 25,052 Sold properties/Other 2,176 Net Operating Income - (“NOI”) $ 133,003
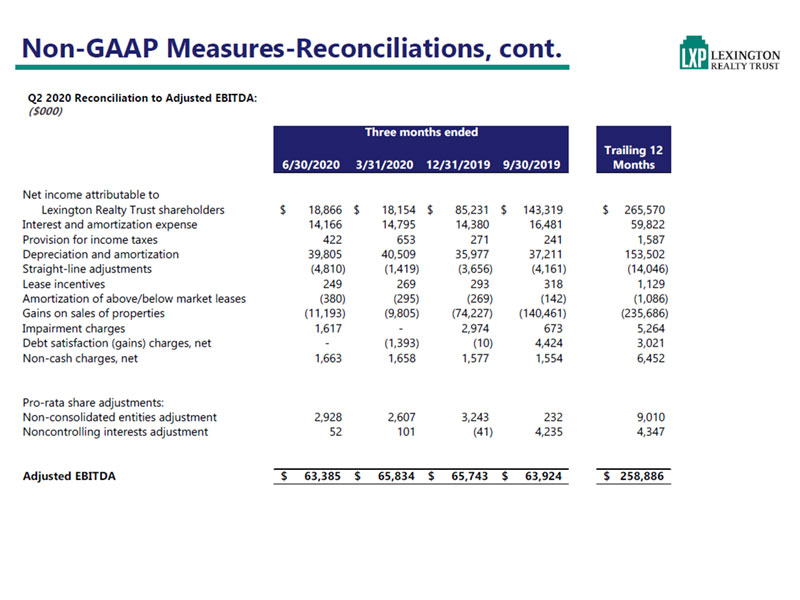
Non-GAAP Measures-Reconciliations, cont. Q2 2020 Reconciliation to Adjusted EBITDA: ($000) Three months ended Trailing 12 6/30/2020 3/31/2020 12/31/2019 9/30/2019 Months Net income attributable to Lexington Realty Trust shareholders $ 18,866 $ 18,154 $ 85,231 $ 143,319 $ 265,570 Interest and amortization expense 14,166 14,795 14,380 16,481 59,822 Provision for income taxes 422 653 271 241 1,587 Depreciation and amortization 39,805 40,509 35,977 37,211 153,502 Straight-line adjustments (4,810) (1,419) (3,656) (4,161) (14,046) Lease incentives 249 269 293 318 1,129 Amortization of above/below market leases (380) (295) (269) (142) (1,086) Gains on sales of properties (11,193) (9,805) (74,227) (140,461) (235,686) Impairment charges 1,617 - 2,974 673 5,264 Debt satisfaction (gains) charges, net - (1,393) (10) 4,424 3,021 Non-cash charges, net 1,663 1,658 1,577 1,554 6,452 Pro-rata share adjustments: Non-consolidated entities adjustment 2,928 2,607 3,243 232 9,010 Noncontrolling interests adjustment 52 101 (41) 4,235 4,347 Adjusted EBITDA $ 63,385 $ 65,834 $ 65,743 $ 63,924 $ 258,886
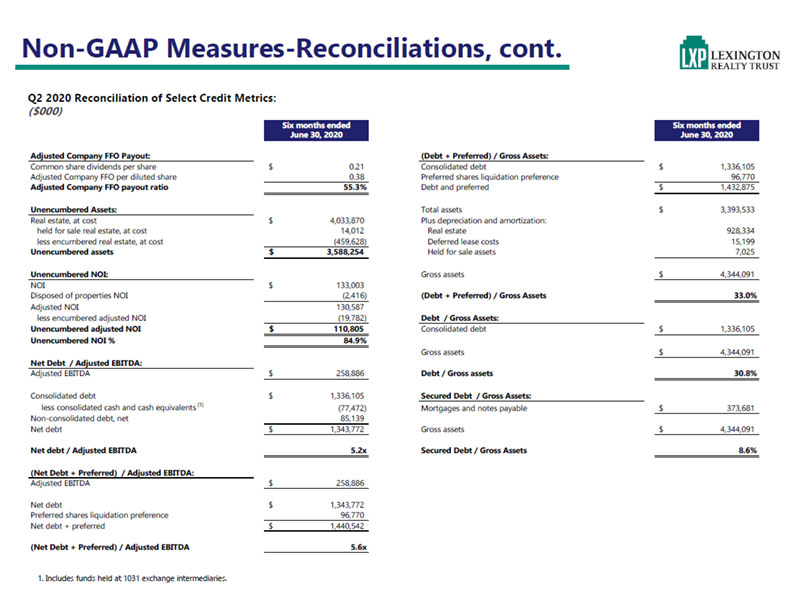
Non-GAAP Measures-Reconciliations, cont. Q2 2020 Reconciliation of Select Credit Metrics: ($000) Six months ended June 30, 2020 Adjusted Company FFO Payout: Common share dividends per share $ 0.21 Adjusted Company FFO per diluted share 0.38 Adjusted Company FFO payout ratio 55.3% Unencumbered Assets: Real estate, at cost $ 4,033,870 held for sale real estate, at cost 14,012 less encumbered real estate, at cost (459,628) Unencumbered assets $ 3,588,254 Unencumbered NOI: NOI $ 133,003 Disposed of properties NOI (2,416) Adjusted NOI 130,587 less encumbered adjusted NOI (19,782) Unencumbered adjusted NOI $ 110,805 Unencumbered NOI % 84.9% Net Debt / Adjusted EBITDA: Adjusted EBITDA $ 258,886 Consolidated debt $ 1,336,105 less consolidated cash and cash equivalents (1) (77,472) Non-consolidated debt, net 85,139 Net debt $ 1,343,772 Net debt / Adjusted EBITDA 5.2x (Net Debt + Preferred) / Adjusted EBITDA: Adjusted EBITDA $ 258,886 Net debt $ 1,343,772 Preferred shares liquidation preference 96,770 Net debt + preferred $ 1,440,542 (Net Debt + Preferred) / Adjusted EBITDA 5.6x Six months ended June 30, 2020 (Debt + Preferred) / Gross Assets: Consolidated debt $ 1,336,105 Preferred shares liquidation preference 96,770 Debt and preferred $ 1,432,875 Total assets $ 3,393,533 Plus depreciation and amortization: Real estate 928,334 Deferred lease costs 15,199 Held for sale assets 7,025 Gross assets $ 4,344,091 (Debt + Preferred) / Gross Assets 33.0% Debt / Gross Assets: Consolidated debt $ 1,336,105 Gross assets $ 4,344,091 Debt / Gross assets 30.8% Secured Debt / Gross Assets: Mortgages and notes payable $ 373,681 Gross assets $ 4,344,091 Secured Debt / Gross Assets 8.6% 1. Includes funds held at 1031 exchange intermediaries.
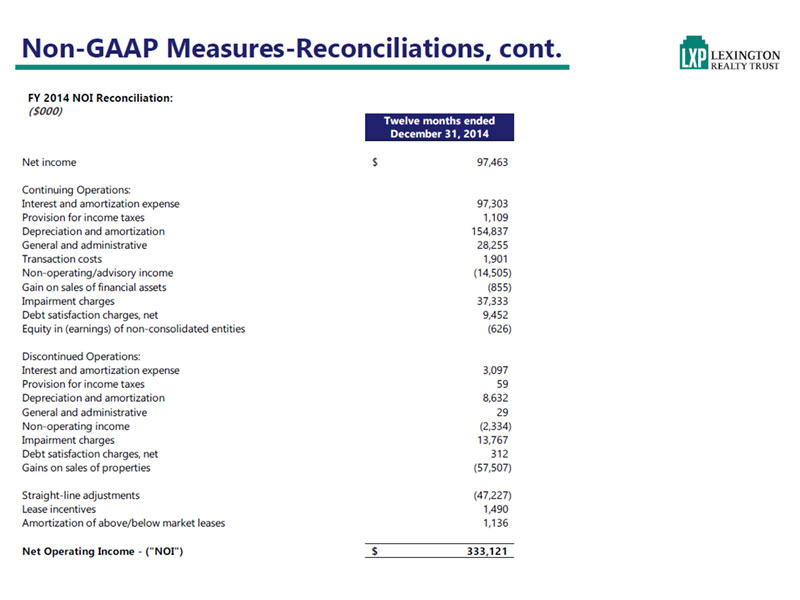
Non-GAAP Measures-Reconciliations, cont. FY 2014 NOI Reconciliation: ($000) Twelve months ended December 31, 2014 Net income $ 97,463 Continuing Operations: Interest and amortization expense 97,303 Provision for income taxes 1,109 Depreciation and amortization 154,837 General and administrative 28,255 Transaction costs 1,901 Non-operating/advisory income (14,505) Gain on sales of financial assets Impairment charges 37,333 Debt satisfaction charges, net 9,452 Equity in (earnings) of non-consolidated entities Discontinued Operations: Interest and amortization expense 3,097 Provision for income taxes 59 Depreciation and amortization 8,632 General and administrative 29 Non-operating income (2,334) Impairment charges 13,767 Debt satisfaction charges, net 312 Gains on sales of properties (57,507) Straight-line adjustments (47,227) Lease incentives 1,490 Amortization of above/below market leases 1,136 Net Operating Income - (“NOI”) $ 333,121
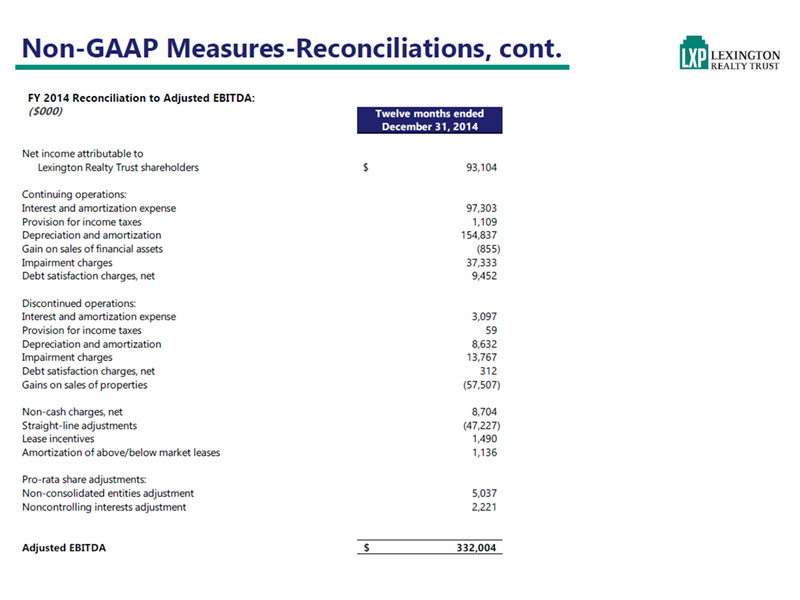
Non-GAAP Measures-Reconciliations, cont. FY 2014 Reconciliation to Adjusted EBITDA: ($000) Twelve months ended December 31, 2014 Net income attributable to Lexington Realty Trust shareholders $ 93,104 Continuing operations: Interest and amortization expense 97,303 Provision for income taxes 1,109 Depreciation and amortization 154,837 Gain on sales of financial assets (855) Impairment charges 37,333 Debt satisfaction charges, net 9,452 Discontinued operations: Interest and amortization expense 3,097 Provision for income taxes 59 Depreciation and amortization 8,632 Impairment charges 13,767 Debt satisfaction charges, net 312 Gains on sales of properties (57,507) Non-cash charges, net 8,704 Straight-line adjustments (47,227) Lease incentives 1,490 Amortization of above/below market leases 1,136 Pro-rata share adjustments: Non-consolidated entities adjustment 5,037 Noncontrolling interests adjustment 2,221 Adjusted EBITDA $ 332,004

Non-GAAP Measures-Reconciliations, cont. FY 2014 Reconciliation of Select Credit Metrics: ($000) Twelve months ended December 31, 2014 Adjusted Company FFO Payout: Common share dividends per share $ 0.675 Adjusted Company FFO per diluted share 1.11 Adjusted Company FFO payout ratio 60.8% Unencumbered Assets: Real estate, at cost $ 4,483,364 Loans receivable,net 105,635 less encumbered real estate, at cost (1,715,832) Unencumbered assets $ 2,873,167 Unencumbered NOI: NOI $ 333,121 Discontinued operations NOI (15,429) Adjusted NOI 317,692 less encumbered adjusted NOI (127,258) Unencumbered adjusted NOI $ 190,434 Unencumbered NOI % 59.9% Net Debt / Adjusted EBITDA: Adjusted EBITDA $ 332,004 Debt per Balance Sheet $ 2,092,675 Add: Discounts 2,889 Held for sale debt 2,778 Consoldiated debt 2,098,342 less consolidated cash and cash equivalents (191,077) Net debt $ 1,907,265 Net debt / Adjusted EBITDA 5.7x (Net Debt + Preferred) / Adjusted EBITDA: Adjusted EBITDA $ 332,004 Net debt $ 1,907,265 Preferred shares liquidation preference 96,770 Net debt + preferred $ 2,004,035 (Net Debt + Preferred) / Adjusted EBITDA 6.0x Twelve months ended December 31, 2014 (Debt + Preferred) / Gross Assets: Consolidated debt $ 2,098,342 Preferred shares liquidation preference 96,770 Debt and preferred $ 2,195,112 Total assets $ 3,777,894 Plus depreciation and amortization: Real estate 1,196,114 Deferred lease costs 19,966 Gross assets $ 4,993,974 (Debt + Preferred) / Gross Assets 44.0% Debt / Gross Assets: Consolidated debt $ 2,098,342 Gross assets $ 4,993,974 Debt / Gross assets 42.0% Secured Debt / Gross Assets: Mortgages and notes payable $ 945,216 Held for sale debt 2,778 Secured debt $ 947,994 Gross assets $ 4,993,974 Secured Debt / Gross Assets 19.0%