Attached files
| file | filename |
|---|---|
| 8-K - CURRENT REPORT - Western New England Bancorp, Inc. | wneb-8k_081220.htm |
Western New England Bancorp, Inc. 8-K
Exhibit 99.1

Local banking is better than ever. INVESTOR PRESENTATION

FORWARD - LOOKING STATEMENTS 2 We may, from time to time, make written or oral “forward - looking statements” within the meaning of the Private Securities Litigation Reform Act of 1995 , including statements contained in our filings with the Securities and Exchange Commission (the “SEC”), our reports to shareholders and in other communications by us . This presentation contains “forward - looking statements” with respect to the Company’s financial condition, liquidity, results of operations, future performance, business, measures being taken in response to the coronavirus disease 2019 (“COVID - 19 ”) pandemic and the impact of COVID - 19 on the Company’s business . Forward - looking statements may be identified by the use of such words as “believe,” “expect,” “anticipate,” “should,” “planned,” “estimated,” and “potential . ” Examples of forward - looking statements include, but are not limited to, estimates with respect to our financial condition, results of operations and business that are subject to various factors which could cause actual results to differ materially from these estimates . These factors include, but are not limited to : • the duration and scope of the COVID - 19 pandemic and the local, national and global impact of COVID - 19; • actions governments, businesses and individuals take in response to the COVID - 19 pandemic; • the pace of recovery when the COVID - 19 pandemic subsides; • changes in the interest rate environment that reduce margins; • the effect on our operations of governmental legislation and regulation, including changes in accounting regulation or standa rds , the nature and timing of the adoption and effectiveness of new requirements under the Dodd - Frank Act Wall Street Reform and Consumer Protection Act of 2010 (“Dodd - Frank Act”), Basel guidelines, capital requirements and other applicable laws and regulations; • the highly competitive industry and market area in which we operate; • general economic conditions, either nationally or regionally, resulting in, among other things, a deterioration in credit qua lit y; • changes in business conditions and inflation; • changes in credit market conditions; • the inability to realize expected cost savings or achieve other anticipated benefits in connection with business combinations an d other acquisitions; • changes in the securities markets which affect investment management revenues; • increases in Federal Deposit Insurance Corporation deposit insurance premiums and assessments; • changes in technology used in the banking business; • the soundness of other financial services institutions which may adversely affect our credit risk; • certain of our intangible assets may become impaired in the future; • our controls and procedures may fail or be circumvented; • new lines of business or new products and services, which may subject us to additional risks; • changes in key management personnel which may adversely impact our operations; • severe weather, natural disasters, acts of war or terrorism and other external events which could significantly impact our bu sin ess; and • other factors detailed from time to time in our SEC filings. Although we believe that the expectations reflected in such forward - looking statements are reasonable, actual results may differ materially from the results discussed in these forward - looking statements . You are cautioned not to place undue reliance on these forward - looking statements, which speak only as of the date hereof . We do not undertake any obligation to republish revised forward - looking statements to reflect events or circumstances after the date hereof or to reflect the occurrence of unanticipated events, except to the extent required by law .
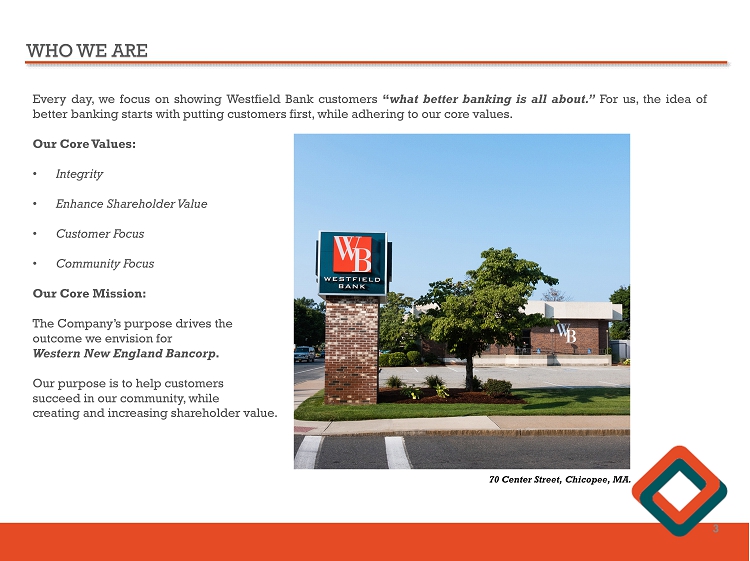
WHO WE ARE Every day, we focus on showing Westfield Bank customers “ what better banking is all about . ” For us, the idea of better banking starts with putting customers first, while adhering to our core values . Our Core Values : • Integrity • Enhance Shareholder Value • Customer Focus • Community Focus Our Core Mission : The Company’s purpose drives the outcome we envision for Western New England Bancorp . Our purpose is to help customers succeed in our community, while creating and increasing shareholder value . 3 70 Center Street, Chicopee, MA.

SENIOR MANAGEMENT TEAM James C . Hagan, President & Chief Executive Officer Guida R . Sajdak, Executive Vice President, Chief Financial Officer & Treasurer Allen J . Miles III, Executive Vice President & Chief Lender Officer Kevin C . O’Connor, Executive Vice President & Chief Banking Officer Leo R . Sagan, Jr . , Senior Vice President & Chief Risk Officer Darlene Libiszewski , Senior Vice President & Chief Information Officer Gerald P . Ciejka , Senior Vice President, General Counsel & Director of Human Resources Louis O . Gorman, Senior Vice President & Chief Credit Officer Deborah J . McCarthy, Senior Vice President, Deposit Operations & Electronic Banking Cidalia Inacio , Senior Vice President, Retail Banking & Wealth Management 4

CONNECTICUT STRATEGY On Monday, July 6 th , the Bank’s Bloomfield branch officially opened for business . This was followed closely by the Bank’s West Hartford Financial Services Center, which opened on Tuesday, July 21 st . These openings marked the Bank’s 24 th and 25 th branch locations, and established West Hartford as the Bank’s Connecticut hub to facilitate its strategic expansion . The new locations build off the success of the Granby and Enfield branches, expand the bank’s footprint further into Connecticut, and provide new growth opportunities in the Greater Hartford Region and the Farmington Valley . Recent mergers and consolidations throughout Connecticut have created increased demand for a local, full - service, community - oriented bank, supporting the Bank’s deposit and loan growth efforts . 5
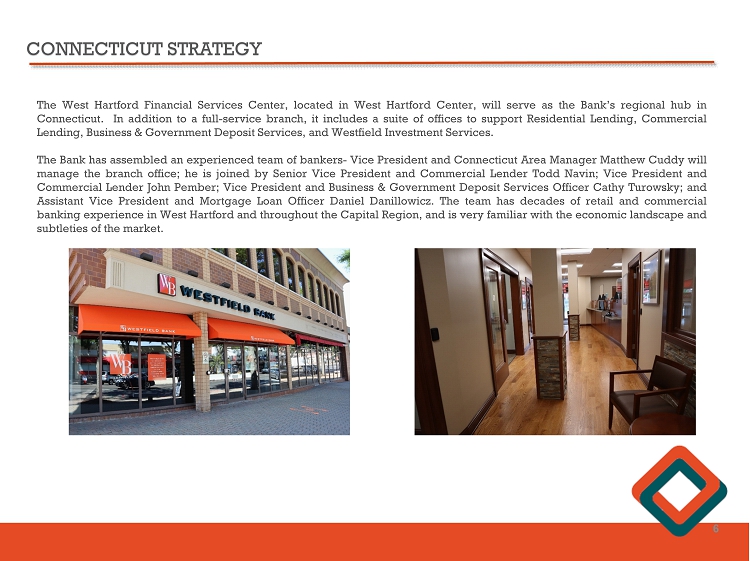
CONNECTICUT STRATEGY The West Hartford Financial Services Center, located in West Hartford Center, will serve as the Bank’s regional hub in Connecticut . In addition to a full - service branch, it includes a suite of offices to support Residential Lending, Commercial Lending, Business & Government Deposit Services, and Westfield Investment Services . The Bank has assembled an experienced team of bankers - Vice President and Connecticut Area Manager Matthew Cuddy will manage the branch office ; he is joined by Senior Vice President and Commercial Lender Todd Navin ; Vice President and Commercial Lender John Pember ; Vice President and Business & Government Deposit Services Officer Cathy Turowsky ; and Assistant Vice President and Mortgage Loan Officer Daniel Danillowicz . The team has decades of retail and commercial banking experience in West Hartford and throughout the Capital Region, and is very familiar with the economic landscape and subtleties of the market . 6

CONNECTICUT STRATEGY The Bloomfield branch , located in the Copaco Shopping Center, is a full - service branch and includes drive - through teller and safe deposit services . The shopping center is composed of national and local brands and is a major shopping destination for the greater Bloomfield area, which offers both retail and commercial banking opportunities . The Bank has hired AVP and Branch Manager Lindsay Allen to manage the Bloomfield branch . Lindsay has extensive banking and branch management experience, having worked for both national and community banks, and is a Bloomfield resident . The Bloomfield branch, along with the Granby and Enfield locations, will be supported by the West Hartford Financial Services Center and its expanded team . 7
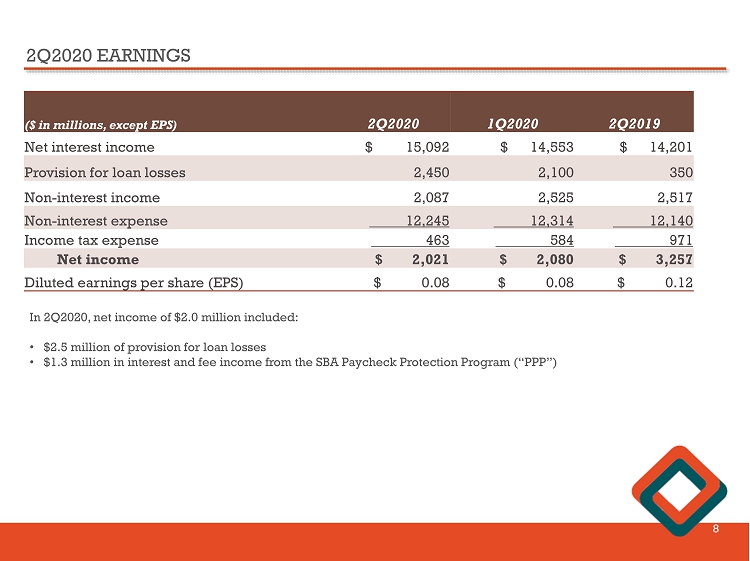
2Q2020 EARNINGS 8 ($ in millions, except EPS) 2Q2020 1Q2020 2Q2019 Net interest income $ 15,092 $ 14,553 $ 14,201 Provision for loan losses 2,450 2,100 350 Non - interest income 2,087 2,525 2,517 Non - interest expense 12,245 12,314 12,140 Income tax expense 463 584 971 Net income $ 2,021 $ 2,080 $ 3,257 Diluted earnings per share (EPS) $ 0.08 $ 0.08 $ 0.12 In 2Q2020, net income of $2.0 million included: • $2.5 million of provision for loan losses • $1.3 million in interest and fee income from the SBA Paycheck Protection Program (“PPP”)
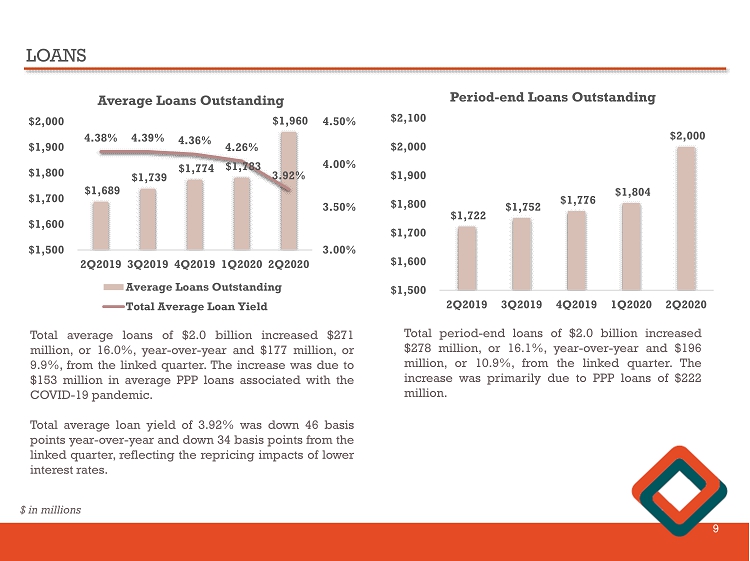
LOANS 9 $1,689 $1,739 $1,774 $1,783 $1,960 4.38% 4.39% 4.36% 4.26% 3.92% $1,500 $1,600 $1,700 $1,800 $1,900 $2,000 2Q2019 3Q2019 4Q2019 1Q2020 2Q2020 3.00% 3.50% 4.00% 4.50% Average Loans Outstanding Average Loans Outstanding Total Average Loan Yield $1,722 $1,752 $1,776 $1,804 $2,000 2Q2019 3Q2019 4Q2019 1Q2020 2Q2020 $1,500 $1,600 $1,700 $1,800 $1,900 $2,000 $2,100 Period - end Loans Outstanding Total average loans of $ 2 . 0 billion increased $ 271 million, or 16 . 0 % , year - over - year and $ 177 million, or 9 . 9 % , from the linked quarter . The increase was due to $ 153 million in average PPP loans associated with the COVID - 19 pandemic . Total average loan yield of 3 . 92 % was down 46 basis points year - over - year and down 34 basis points from the linked quarter, reflecting the repricing impacts of lower interest rates . Total period - end loans of $ 2 . 0 billion increased $ 278 million, or 16 . 1 % , year - over - year and $ 196 million, or 10 . 9 % , from the linked quarter . The increase was primarily due to PPP loans of $ 222 million . $ in millions

LOAN PORTFOLIO TRENDS 10 Loan Segment Modification Balance # of Loans Modified Balance as a % of Total Loan Segment Balances Returned to P&I and Made First Payment (2) % Returned to P&I and Made First Payment # of Loans Returne d to P&I (2) Commercial real estate $ 200.0 131 24.0% $ 71.6 35.8% 54 Commercial and industrial ( 1 ) 19.1 162 8.3% 9.7 50.8% 117 Residential real estate ( 3 ) 41.7 219 5.9% 19.2 46.1% 107 Consumer 0.2 13 3.8% 0.1 50.0% 10 Total $ 261.0 525 14.7% $ 100.6 38.5% 288 (1) Excludes PPP loans and deferred fees (2) Data as of July 27, 2020 (3) Residential includes home equity loans and lines of credit ($ in millions)

COMMERCIAL AND INDUSTRIAL LOAN TRENDS 11 $238 $242 $249 $257 $231 $222 2Q2019 3Q2019 4Q2019 1Q2020 2Q2020 $100 $150 $200 $250 $300 $350 $400 $450 $500 Commercial and Industrial Loans C&I Loans PPP Loans $453 Commercial and industrial loans (C&I) of $ 453 million increased $ 215 million, or 90 . 3 % , year - over - year , and $ 196 million, or 76 . 3 % , from the linked quarter primarily due to $ 222 million in PPP loans . - Excluding PPP loans, C&I loans decreased $ 26 million, or 10 . 1 % , from the linked quarter driven by pay - downs of commercial revolving lines of credit following an increase in 1 Q 2020 draws under the lines of credit . The increase in draws in revolving lines of credit in 1 Q 2020 were due to the economic slowdown associated with the COVID - 19 pandemic . $ in millions

COMMERCIAL AND INDUSTRIAL LOANS (EXCLUDES PPP) 12 Auto Sales , 0.4% Educational Services , 1.0% Healthcare , 0.7% Heavy and Civil Engineering Construction , 0.8% Manufacturing , 3.0% Other , 3.4% Specialty Trade , 0.7% Transportation , 0.7% Wholesale Trade , 2.4% % of total loans, excluding PPP, at June 30, 2020

TOTAL COVID - 19 MODIFICATIONS – C&I PORTFOLIO 13 Industry Balance (1) % of Total Loans (1) Modified Balance # of Modified Accounts % of Balance Modified Manufacturing $ 54 M 3% $ 2 M 18 5% Wholesale Trade 42 M 2% 666 K 3 2% Specialty Trade 13 M 1% - - - Heavy and Civil Engineering Construction 13 M 1% 333 K 1 2% Educational Services 17 M 1% 107 K 1 1% Healthcare and Social Assistance 12 M 1% 4 M 9 32% Transportation and Warehouse 12 M 1% 7 M 13 62% Auto Sales 7 M 0% 2 M 96 23% All other C&I 61 M 3% 3 M 21 6% Total commercial and industrial $ 231 M 13% $ 19 M 162 8% Returned to principal and interest payment : $ 10 M 51% At June 30, 2020, there were $19 million, or 9% of the C&I portfolio, with payment deferrals. As of July 27, 2020, $10 million, or 51% of the modified C&I portfolio, resumed their principal and interest payments, representing their June and July monthly payments. Requests for payment deferrals has significantly decreased since April. (1) Excludes PPP loans
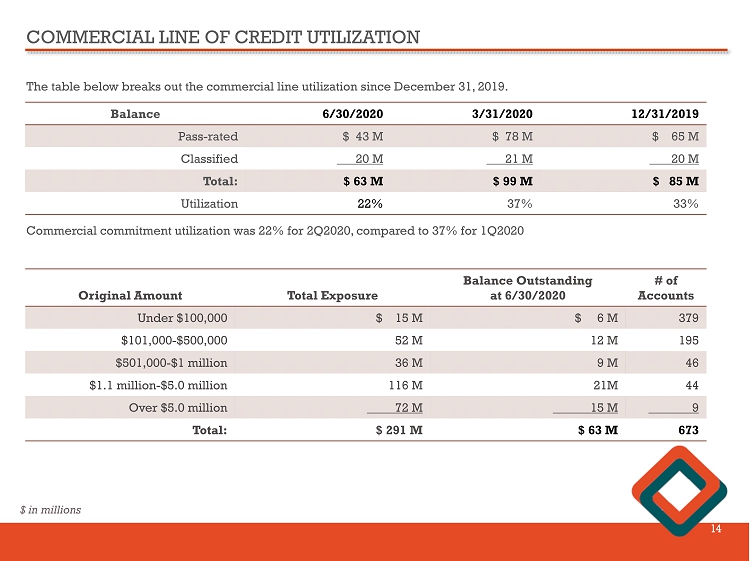
COMMERCIAL LINE OF CREDIT UTILIZATION 14 The table below breaks out the commercial line utilization since December 31, 2019. Balance 6/30/2020 3/31/2020 12/31/2019 Pass - rated $ 43 M $ 78 M $ 65 M Classified 20 M 21 M 20 M Total: $ 63 M $ 99 M $ 85 M Utilization 22% 37% 33% Commercial commitment utilization was 22% for 2Q2020, compared to 37% for 1Q2020 Original Amount Total Exposure Balance Outstanding at 6/30 /2020 # of Accounts Under $100,000 $ 15 M $ 6 M 379 $101,000 - $500,000 52 M 12 M 195 $501,000 - $1 million 36 M 9 M 46 $1.1 million - $5.0 million 116 M 21M 44 Over $5.0 million 72 M 15 M 9 Total: $ 291 M $ 63 M 673 $ in millions
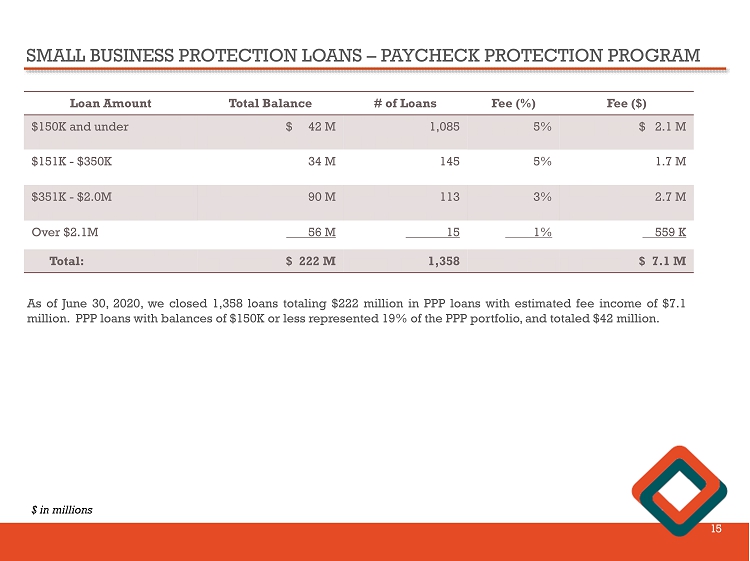
SMALL BUSINESS PROTECTION LOANS – PAYCHECK PROTECTION PROGRAM 15 Loan Amount Total Balance # of Loans Fee (%) Fee ($) $150K and under $ 42 M 1,085 5% $ 2.1 M $151K - $350K 34 M 145 5% 1.7 M $351K - $2.0M 90 M 113 3% 2.7 M Over $2.1M 56 M 15 1% 559 K Total: $ 222 M 1,358 $ 7.1 M As of June 30 , 2020 , we closed 1 , 358 loans totaling $ 222 million in PPP loans with estimated fee income of $ 7 . 1 million . PPP loans with balances of $ 150 K or less represented 19 % of the PPP portfolio, and totaled $ 42 million . $ in millions
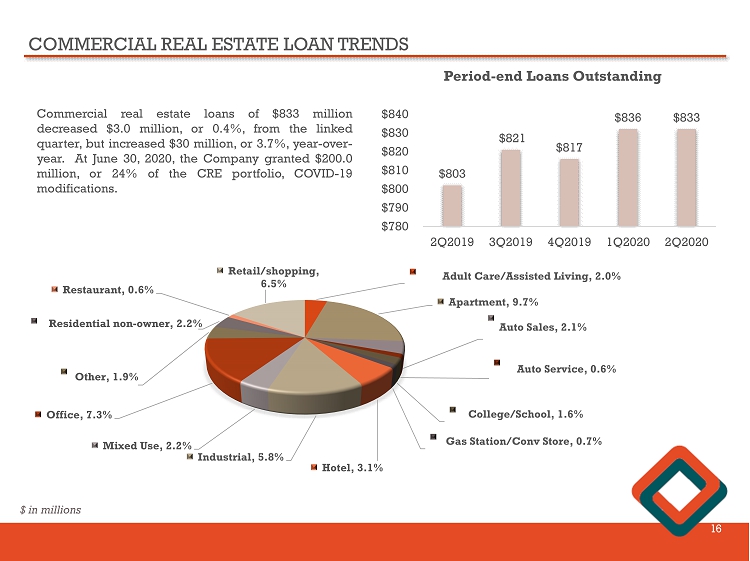
COMMERCIAL REAL ESTATE LOAN TRENDS 16 $803 $821 $817 $836 $833 2Q2019 3Q2019 4Q2019 1Q2020 2Q2020 $780 $790 $800 $810 $820 $830 $840 Commercial real estate loans of $ 833 million decreased $ 3 . 0 million, or 0 . 4 % , from the linked quarter, but increased $ 30 million, or 3 . 7 % , year - over - year . At June 30 , 2020 , the Company granted $ 200 . 0 million, or 24 % of the CRE portfolio, COVID - 19 modifications . $ in millions Adult Care/Assisted Living , 2.0% Apartment , 9.7% Auto Sales , 2.1% Auto Service , 0.6% College/School , 1.6% Gas Station/Conv Store , 0.7% Hotel , 3.1% Industrial , 5.8% Mixed Use , 2.2% Office , 7.3% Other , 1.9% Residential non - owner , 2.2% Restaurant , 0.6% Retail /shopping, 6.5% Period - end Loans Outstanding
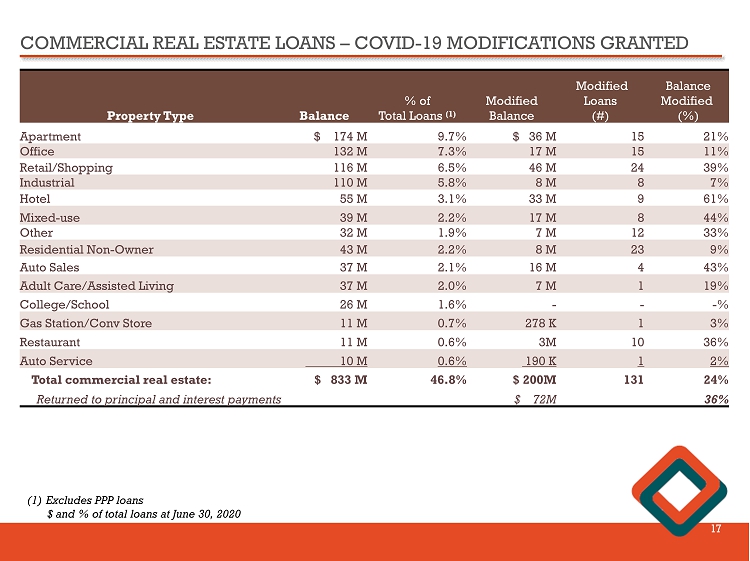
COMMERCIAL REAL ESTATE LOANS – COVID - 19 MODIFICATIONS GRANTED 17 Property Type Balance % of Total Loans (1) Modified Balance Modified Loans (#) Balance Modified (%) Apartment $ 174 M 9.7% $ 36 M 15 21% Office 132 M 7.3% 17 M 15 11% Retail/Shopping 116 M 6.5% 46 M 24 39% Industrial 110 M 5.8% 8 M 8 7% Hotel 55 M 3.1% 33 M 9 61% Mixed - use 39 M 2.2% 17 M 8 44% Other 32 M 1.9% 7 M 12 33% Residential Non - Owner 43 M 2.2% 8 M 23 9% Auto Sales 37 M 2.1% 16 M 4 43% Adult Care/Assisted Living 37 M 2.0% 7 M 1 19% College/School 26 M 1.6% - - - % Gas Station/Conv Store 11 M 0.7% 278 K 1 3% Restaurant 11 M 0.6% 3M 10 36% Auto Service 10 M 0.6% 190 K 1 2% Total commercial real estate : $ 833 M 46.8% $ 200M 131 24% Returned to principal and interest payments $ 72M 36% (1) Excludes PPP loans $ and % of total loans at June 30, 2020
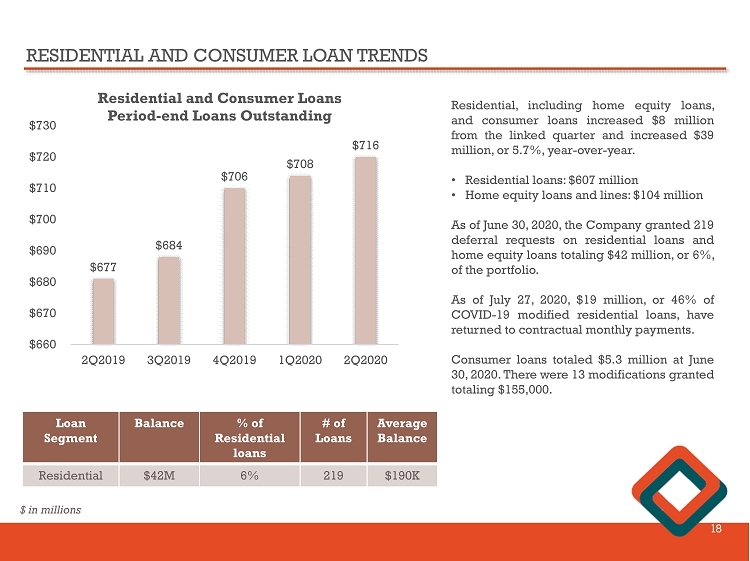
RESIDENTIAL AND CONSUMER LOAN TRENDS 18 $677 $684 $706 $708 $716 2Q2019 3Q2019 4Q2019 1Q2020 2Q2020 $660 $670 $680 $690 $700 $710 $720 $730 Residential and Consumer Loans Period - end Loans Outstanding Residential, including home equity loans, and consumer loans increased $ 8 million from the linked quarter and increased $ 39 million, or 5 . 7 % , year - over - year . • Residential loans : $ 607 million • Home equity loans and lines : $ 104 million As of June 30 , 2020 , the Company granted 219 deferral requests on residential loans and home equity loans totaling $ 42 million, or 6 % , of the portfolio . As of July 27 , 2020 , $ 19 million, or 46 % of COVID - 19 modified residential loans , have returned to contractual monthly payments . Consumer loans totaled $ 5 . 3 million at June 30 , 2020 . There were 13 modifications granted totaling $ 155 , 000 . Loan Segment Balance % of Residential l oans # of Loans Average Balance Residential $42M 6% 219 $190K $ in millions

TOTAL DEPOSITS 19 $967 $1,013 $1,025 $1,057 $1,319 2Q2019 3Q2019 4Q2019 1Q2020 2Q2020 $500 $600 $700 $800 $900 $1,000 $1,100 $1,200 $1,300 $1,400 $1,500 Period - end Core Deposits Period - end core deposits of $ 1 . 3 billion increased $ 352 million , or 36 . 4 % , year - over - year and increased $ 262 million, or 24 . 8 % , from the linked quarter . Time deposits of $ 629 million decreased $ 49 million, or 7 . 2 % , year - over - year and decreased $ 20 million, or 3 . 1 % , from the linked quarter . The increase in core deposits reflected impacts due to COVID - 19 including customers' preferences for liquidity, loan payment deferrals, tax payment deferrals, government stimulus for individuals, and lower consumer spending . The ratio of core deposits as a percentage of total deposits was 67 . 7 % at June 30 , 2020 , compared to 58 . 8 % at June 30 , 2019 and 62 . 0 % at March 31 , 2020 . $678 $656 $653 $649 $629 2Q2019 3Q2019 4Q2019 1Q2020 2Q2020 $500 $550 $600 $650 $700 $750 $800 Period - end Time Deposits $ in millions
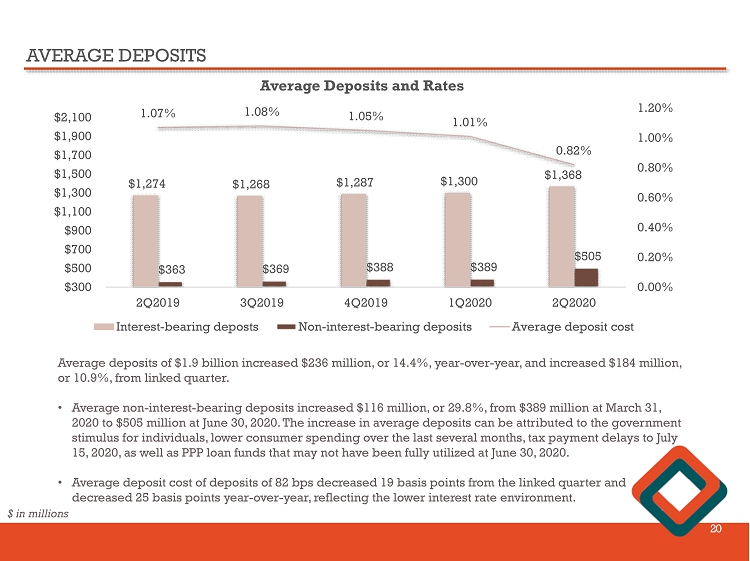
AVERAGE DEPOSITS 20 $1,274 $1,268 $1,287 $1,300 $1,368 $363 $369 $388 $389 $505 1.07% 1.08% 1.05% 1.01% 0.82% 0.00% 0.20% 0.40% 0.60% 0.80% 1.00% 1.20% 2Q2019 3Q2019 4Q2019 1Q2020 2Q2020 $300 $500 $700 $900 $1,100 $1,300 $1,500 $1,700 $1,900 $2,100 Average Deposits and Rates Interest-bearing deposts Non-interest-bearing deposits Average deposit cost Average deposits of $ 1.9 billion increased $236 m illion , or 14.4%, year - over - year, and increased $184 million, or 10.9%, from linked quarter. • Average non - interest - bearing deposits increased $116 million, or 29.8%, from $389 million at March 31, 2020 to $505 million at June 30, 2020. The increase in average deposits can be attributed to the government stimulus for individuals, lower consumer spending over the last several months, tax payment delays to July 15, 2020, as well as PPP loan funds that may not have been fully utilized at June 30, 2020. • Average deposit cost of deposits of 82 bps decreased 19 basis points from the linked quarter and decreased 25 basis points year - over - year, reflecting the lower interest rate environment. $ in millions

AVERAGE CORE DEPOSITS 21 $957 $970 $1,021 $1,037 $1,233 0.31% 0.32% 0.34% 0.33% 0.27% 0.00% 0.05% 0.10% 0.15% 0.20% 0.25% 0.30% 0.35% 0.40% 2Q2019 3Q2019 4Q2019 1Q2020 2Q2020 $300 $500 $700 $900 $1,100 $1,300 $1,500 $1,700 $1,900 $2,100 Average Core Deposits and Rates Interest-bearing deposts Average deposit cost Average core deposits of $ 1 . 2 billion increased $ 276 m illion , or 28 . 8 % , year - over - year, and increased $ 196 million, or 19 . 0 % , from linked quarter . The cost of core deposits decreased 4 basis points year - over - year and decreased 6 basis points from the linked quarter, reflecting the lower interest rate environment . $ in millions

AVERAGE TIME DEPOSITS 22 $680 $667 $654 $651 $640 2.14% 2.18% 2.15% 2.08% 1.87% 1.70% 1.80% 1.90% 2.00% 2.10% 2.20% 2.30% 2Q2019 3Q2019 4Q2019 1Q2020 2Q2020 $500 $550 $600 $650 $700 $750 $800 Average Time Deposits and Rates Interest-bearing deposts Average deposit cost Average time deposits of $ 640 million decreased $ 40 . 0 m illion , or 5 . 9 % , year - over - year, and decreased $ 11 million, or 1 . 7 % , from linked quarter . We continue to reduce our reliance on high - cost time deposits as we continue to focus on low - cost core deposits . The cost of time deposits decreased 27 basis points year - over - year and decreased 21 basis points from the linked quarter, reflecting the lower interest rate environment . $73 $68 $77 $100 $77 $44 DEC 2020 NOV 2020 OCT 2020 SEPT 2020 AUG 2020 JULY 2020 Time Deposits Maturing (Weighted Average Rate) 2.14% 2.13% 1.78% 1.47% 1.19% 2.14% As of June 30 , 2020 , there are $ 440 million time deposits with an average weighted rate of 1 . 81 % scheduled to reprice by December 31 , 2020 . There are $ 221 million maturing by the end of 3 Q 2020 with an average weighted rate of 2 . 01 % and $ 218 million by the end of 4 Q 2020 with an average rate of 1 . 61 % . $ in millions

LOAN - TO - DEPOSIT RATIO 23 105% 105% 106% 106% 103% 2Q2019 3Q2019 4Q2019 1Q2020 2Q2020 97% 98% 99% 100% 101% 102% 103% 104% 105% 106% 107% Loan - to - Deposit Ratio $ in millions 59% 61% 61% 62% 68% 41% 39% 39% 38% 32% 2Q2019 3Q2019 4Q2019 1Q2020 2Q2020 0% 10% 20% 30% 40% 50% 60% 70% 80% Core Deposits and Time Deposits as a % of Total Deposits Core deposits/Total deposits Time deposits/Total deposits We continue to focus on the mix of deposits . Core deposits as a percentage of tota l deposits has improved over the last 5 quarters .

________ Source: SNL Financial as of June 30, 2019. Note: Total number of Westfield Bank branches shown includes the Big E seasonal branch and online deposit channel. Two Westf iel d branches are located in Hampshire County, MA and two Westfield branches are located in Hartford County, CT outside of Springfield MSA. DEPOSIT MARKET SHARE IN HAMPDEN COUNTY, MA AS OF JUNE 30, 2019 24 % Total Deposit Rank 2019 Parent Company Name Deposits in Market ($000) Market Share # of Branches 1Western New England Bancorp 1,516,649 14.22 20 2Toronto-Dominion Bank 1,495,829 14.02 16 3People's United Financial Inc. 1,473,093 13.81 14 4Bank of America Corp. 1,414,913 13.26 9 5PeoplesBancorp MHC 1,404,794 13.17 14 6Berkshire Hills Bancorp Inc. 1,158,239 10.86 13 7KeyCorp 684,142 6.41 8 8Country Bank for Savings 436,283 4.09 5 9Citizens Financial Group Inc. 431,555 4.05 15 Total For Institutions in Market 10,015,497 100.00 129
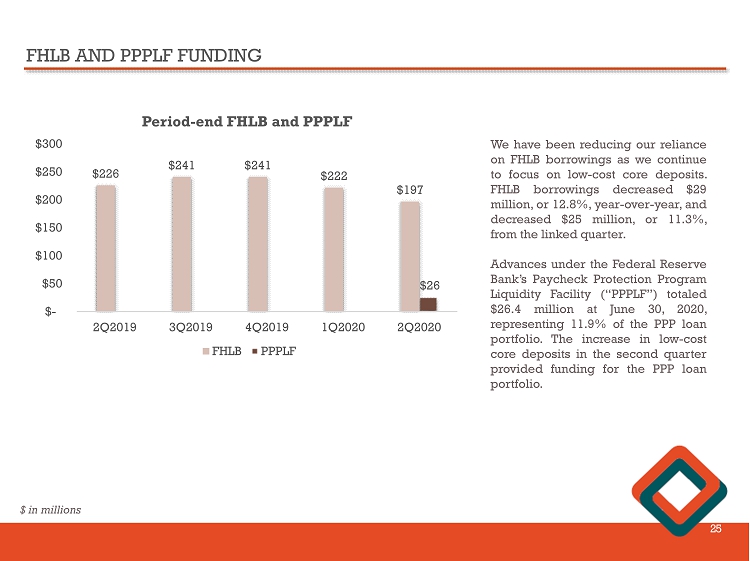
FHLB AND PPPLF FUNDING 25 $226 $241 $241 $222 $197 $26 2Q2019 3Q2019 4Q2019 1Q2020 2Q2020 $- $50 $100 $150 $200 $250 $300 Period - end FHLB and PPPLF FHLB PPPLF We have been reducing our reliance on FHLB borrowings as we continue to focus on low - cost core deposits . FHLB borrowings decreased $ 29 million, or 12 . 8 % , year - over - year, and decreased $ 25 million, or 11 . 3 % , from the linked quarter . Advances under the Federal Reserve Bank’s Paycheck Protection Program Liquidity Facility (“PPPLF”) totaled $ 26 . 4 million at June 30 , 2020 , representing 11 . 9 % of the PPP loan portfolio . The increase in low - cost core deposits in the second quarter provided funding for the PPP loan portfolio . $ in millions
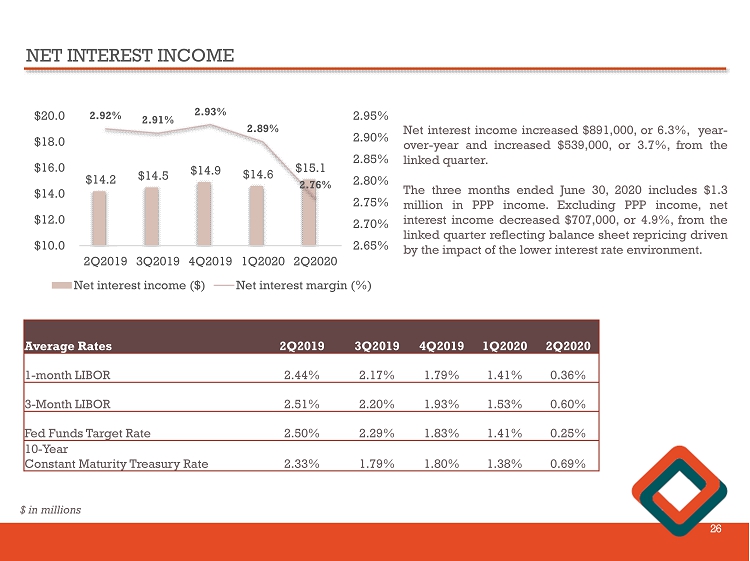
NET INTEREST INCOME 26 $14.2 $14.5 $14.9 $14.6 $15.1 2.92% 2.91% 2.93% 2.89% 2.76% 2.65% 2.70% 2.75% 2.80% 2.85% 2.90% 2.95% 2Q2019 3Q2019 4Q2019 1Q2020 2Q2020 $10.0 $12.0 $14.0 $16.0 $18.0 $20.0 Net interest income ($) Net interest margin (%) Net interest income increased $ 891 , 000 , or 6 . 3 % , year - over - year and increased $ 539 , 000 , or 3 . 7 % , from the linked quarter . The three months ended June 30 , 2020 includes $ 1 . 3 million in PPP income . Excluding PPP income, net interest income decreased $ 707 , 000 , or 4 . 9 % , from the linked quarter reflecting balance sheet repricing driven by the impact of the lower interest rate environment . Average Rates 2Q2019 3Q2019 4Q2019 1Q2020 2Q2020 1 - month LIBOR 2.44% 2.17% 1.79% 1.41% 0.36% 3 - Month LIBOR 2.51% 2.20% 1.93% 1.53% 0.60% Fed Funds Target Rate 2.50% 2.29% 1.83% 1.41% 0.25% 10 - Year Constant Maturity Treasury Rate 2.33% 1.79% 1.80% 1.38% 0.69% $ in millions

NON - INTEREST INCOME 27 $2,517 $2,611 $2,406 $2,525 $2,087 2Q2019 3Q2019 4Q2019 1Q2020 2Q2020 $1,500 $2,000 $2,500 $3,000 Non-interest income Non - interest income decreased $ 430 , 000 , or 17 . 1 % , year - over - year and decreased $ 438 , 000 , or 17 . 3 % , from the linked quarter . • Deposit service charges decreased $ 291 , 000 , or 15 . 7 % , year - over - year, on lower overdraft activity reflecting lower debit card transaction volumes and higher average customer deposit balances which offset accounts fees . • Other income decreased due to a decrease in swap income on commercial loans . 2Q2020 vs 1Q2020 (%) vs 2Q2019 (%) Service charges and fees $1,559 (12.1) (15.7) Income from bank - owned life insurance 480 8.8 0.4 Other income - (100.0) (100.0) Gain on sales of securities, net 13 (43.5) (113.5) Unrealized gain on equity securities 25 (65.7) (55.7) Total non - interest income $2,087 (17.3%) (17.1%) $ in millions
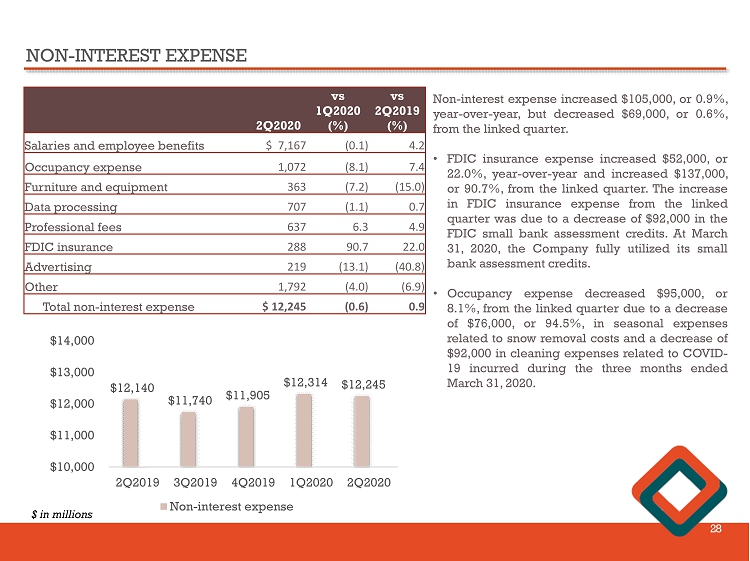
NON - INTEREST EXPENSE 28 $12,140 $11,740 $11,905 $12,314 $12,245 2Q2019 3Q2019 4Q2019 1Q2020 2Q2020 $10,000 $11,000 $12,000 $13,000 $14,000 Non-interest expense Non - interest expense increased $ 105 , 000 , or 0 . 9 % , year - over - year, but decreased $ 69 , 000 , or 0 . 6 % , from the linked quarter . • FDIC insurance expense increased $ 52 , 000 , or 22 . 0 % , year - over - year and increased $ 137 , 000 , or 90 . 7 % , from the linked quarter . The increase in FDIC insurance expense from the linked quarter was due to a decrease of $ 92 , 000 in the FDIC small bank assessment credits . At March 31 , 2020 , the Company fully utilized its small bank assessment credits . • Occupancy expense decreased $ 95 , 000 , or 8 . 1 % , from the linked quarter due to a decrease of $ 76 , 000 , or 94 . 5 % , in seasonal expenses related to snow removal costs and a decrease of $ 92 , 000 in cleaning expenses related to COVID - 19 incurred during the three months ended March 31 , 2020 . 2Q2020 vs 1Q2020 (%) vs 2Q2019 (%) Salaries and employee benefits $ 7,167 (0.1) 4.2 Occupancy expense 1,072 (8.1) 7.4 Furniture and equipment 363 (7.2) (15.0) Data processing 707 (1.1) 0.7 Professional fees 637 6.3 4.9 FDIC insurance 288 90.7 22.0 Advertising 219 (13.1) (40.8) Other 1,792 (4.0) (6.9) Total non - interest expense $ 12,245 (0.6) 0.9 $ in millions

ASSET QUALITY 29 $14.9 $11.1 $9.9 $9.7 $10.4 0.87% 0.63% 0.56% 0.54% 0.59% 0.00% 0.20% 0.40% 0.60% 0.80% 1.00% 2Q2019 3Q2019 4Q2019 1Q2020 2Q2020 $5.0 $10.0 $15.0 $20.0 Non - performing Loans ($ in millions) Non-performing loans Non-performing loans/Total Loans Excluding PPP Loans The Company has taken actions to identify, assess and monitor its COVID - 19 related credit exposures based on asset class and borrower type . The Company implemented a customer forbearance program to assist both consumer and business borrowers that may be experiencing financial hardship due to COVID - 19 related challenges . As of June 30 , 2020 , the Company had approximately 525 loans in forbearance due to COVID - 19 , representing approximately $ 261 million in outstanding loan balances, or 14 . 7 % of total loans outstanding . Loans in forbearance status continued to accrue interest during the forbearance period unless otherwise classified as nonperforming . Consistent with industry regulatory guidance, borrowers that were otherwise current on loan payments that were granted COVID - 19 related financial hardship payment deferrals will continue to be reported as current loans throughout the agreed upon deferral period . $350 $1,275 $1,000 $2,100 $2,450 $(194) $426 $170 $365 $34 2Q2019 3Q2019 4Q2019 1Q2020 2Q2020 $(500) $- $500 $1,000 $1,500 $2,000 $2,500 Provision Expense and Net Charge - offs (Recoveries) ($ in thousands) Provision expense Net charge-offs (recoveries)
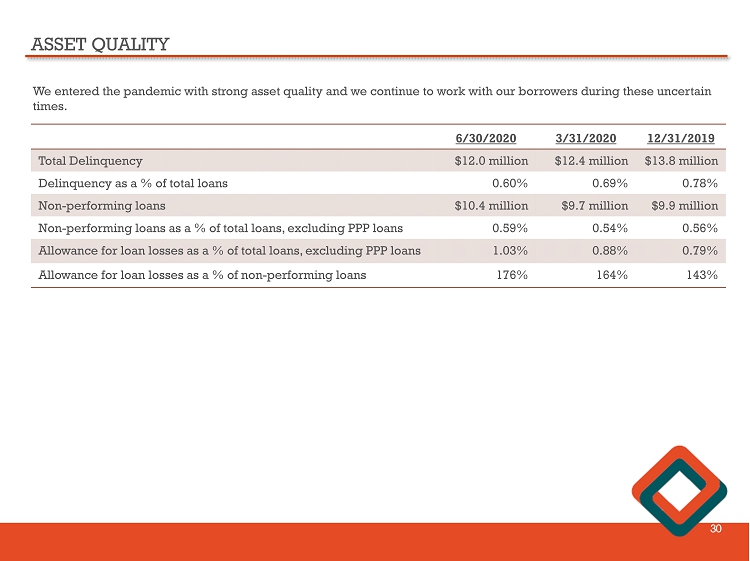
ASSET QUALITY 30 We entered the pandemic with strong asset quality and we continue to work with our borrowers during these uncertain times. 6/30/2020 3/31/2020 12/31/2019 Total Delinquency $12.0 million $12.4 million $13.8 million Delinquency as a % of total loans 0.60% 0.69% 0.78% Non - performing loans $10.4 million $9.7 million $9.9 million Non - performing loans as a % of total loans, excluding PPP loans 0.59% 0.54% 0.56% Allowance for loan losses as a % of total loans, excluding PPP loans 1.03% 0.88% 0.79% Allowance for loan losses as a % of non - performing loans 176% 164% 143%
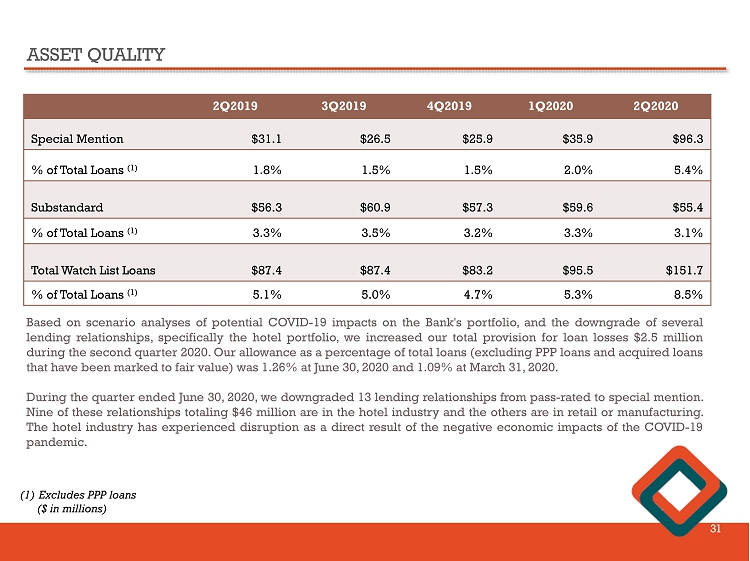
ASSET QUALITY 31 2Q2019 3Q2019 4Q2019 1Q2020 2Q2020 Special Mention $31.1 $26.5 $25.9 $35.9 $96.3 % of Total Loans (1) 1.8% 1.5% 1.5% 2.0% 5.4% Substandard $56.3 $60.9 $57.3 $59.6 $55.4 % of Total Loans (1) 3.3% 3.5% 3.2% 3.3% 3.1% Total Watch List Loans $87.4 $87.4 $83.2 $95.5 $151.7 % of Total Loans (1) 5.1% 5.0% 4.7% 5.3% 8.5% Based on scenario analyses of potential COVID - 19 impacts on the Bank's portfolio, and the downgrade of several lending relationships, specifically the hotel portfolio, we increased our total provision for loan losses $ 2 . 5 million during the second quarter 2020 . Our allowance as a percentage of total loans (excluding PPP loans and acquired loans that have been marked to fair value) was 1 . 26 % at June 30 , 2020 and 1 . 09 % at March 31 , 2020 . During the quarter ended June 30 , 2020 , we downgraded 13 lending relationships from pass - rated to special mention . Nine of these relationships totaling $ 46 million are in the hotel industry and the others are in retail or manufacturing . The hotel industry has experienced disruption as a direct result of the negative economic impacts of the COVID - 19 pandemic . (1) Excludes PPP loans ($ in millions)

ASSET QUALITY 32 Allowance for loan losses (ALLL) = $18.3 million • $4.2 million, or 29.4%, increase in the allowance for loan losses reflected increases of $3.5 million in commercial real estate ALLL. • Allowance coverage for commercial real estate loans of 1.23% increased from 0.83% in 4Q2019. • Allowance coverage for total loans of 1.03% increased from 0.80% in 4Q2019. • The Company has deferred the adoption of CECL, the new accounting standard for loan losses. (1) Excludes PPP loans 2Q2020 4Q2019 ALLL Loans Outstanding (1) ALLL/ Total Loan Segment ALLL Loans Outstanding ALLL/ Total Loan Segment Commercial and industrial $ 3,564 $ 231,052 1.54% $ 3,183 $ 248,893 1.28% Commercial real estate 10,271 832,676 1.23% 6,807 816,886 0.83% Residential 4,167 710,631 0.59% 3,920 700,244 0.56% Consumer 251 5,280 4.75% 192 5,747 3.34% Total Loans $ 18,253 $ 1,779,639 1.03% $ 14,102 $ 1,771,770 0.80%
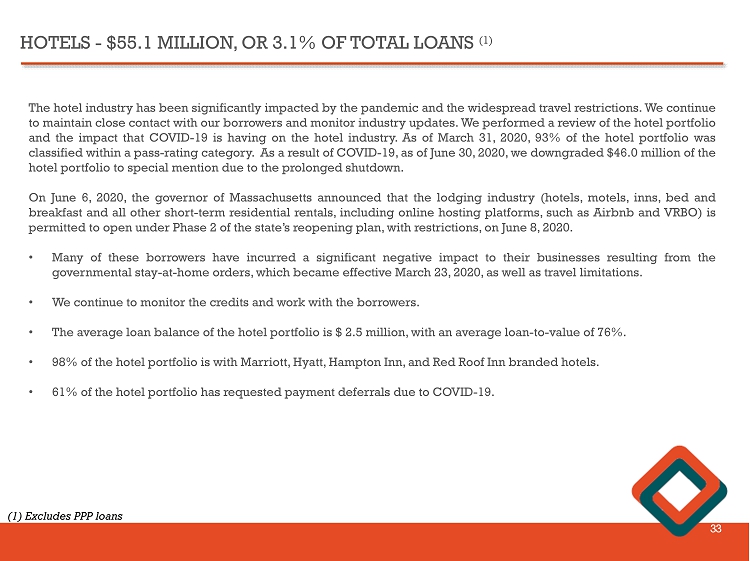
HOTELS - $55.1 MILLION, OR 3.1% OF TOTAL LOANS (1) 33 The hotel industry has been significantly impacted by the pandemic and the widespread travel restrictions . We continue to maintain close contact with our borrowers and monitor industry updates . We performed a review of the hotel portfolio and the impact that COVID - 19 is having on the hotel industry . As of March 31 , 2020 , 93 % of the hotel portfolio was classified within a pass - rating category . As a result of COVID - 19 , as of June 30 , 2020 , we downgraded $ 46 . 0 million of the hotel portfolio to special mention due to the prolonged shutdown . On June 6 , 2020 , the governor of Massachusetts announced that the lodging industry (hotels, motels, inns, bed and breakfast and all other short - term residential rentals, including online hosting platforms, such as Airbnb and VRBO) is permitted to open under Phase 2 of the state’s reopening plan, with restrictions, on June 8 , 2020 . • Many of these borrowers have incurred a significant negative impact to their businesses resulting from the governmental stay - at - home orders, which became effective March 23 , 2020 , as well as travel limitations . • We continue to monitor the credits and work with the borrowers . • The average loan balance of the hotel portfolio is $ 2 . 5 million, with an average loan - to - value of 76 % . • 98 % of the hotel portfolio is with Marriott, Hyatt, Hampton Inn, and Red Roof Inn branded hotels . • 61 % of the hotel portfolio has requested payment deferrals due to COVID - 19 . (1) Excludes PPP loans

CAPITAL MANAGEMENT 34 We are well - capitalized with excess capital. Consolidated Ratio Well Capitalized Excess Consolidated Capital Leverage Ratio 9.5% - - $220.5 Common Equity Tier 1 Ratio 12.9% - - $220.5 Tier 1 Capital Ratio 12.9% - - $220.5 Total Capital Ratio 14.0% - - $238.7 x From a regulatory standpoint, we are well - capitalized with excess capital. x Due to the economic uncertainty we are taking a prudent approach to capital management. x The share repurchase program will remain suspended until economic conditions improve or stabilizes. As of June 30, 2020 ($ in millions) Westfield Bank Ratio Well Capitalized Excess Bank Capital Excess to be Well - Capitalized Leverage Ratio 9.0% 5.0% 4.0% $207.6 $91.7 Common Equity Tier 1 Ratio 12.2% 6.5% 5.7% $207.6 $97.0 Tier 1 Capital Ratio 12.2% 8.0% 4.2% $207.6 $71.5 Total Capital Ratio 13.3% 10.0% 3.3% $225.9 $55.7

CAPITAL RETURN TO SHAREHOLDERS 35 Year # of Shares 2017 606,391 2018 2,189,276 2019 1,938,667 2020 1,009,731 Year Annualized Dividend per Share 2017 $0.12 2018 $0.16 2019 $0.20 2020 $0.20 Share Repurchases Dividends Historically, the Company has been active with share repurchases . During the six months ended June 30 , 2020 , the Company repurchased 1 , 009 , 731 shares of common stock under its previously announced repurchase plan (the “ 2019 Plan”) . On June 30 , 2020 , there were 117 , 135 shares available to repurchase under the 2019 Plan . On March 24 , 2020 , the Board of Directors approved the suspension of the 2019 Plan in response to the COVID - 19 pandemic . This action is effective until further notice, but the Company retains the ability to reinstate its buyback program as soon as circumstances warrant .
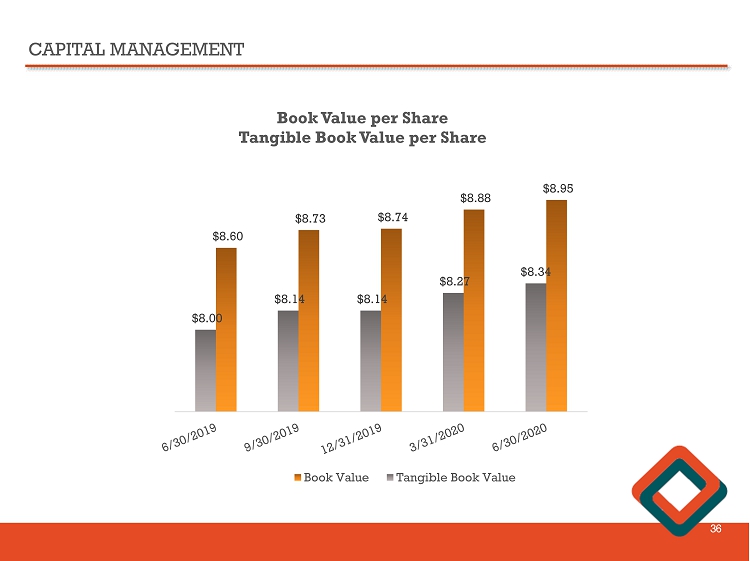
CAPITAL MANAGEMENT 36 $8.95 $8.88 $8.74 $8.73 $8.60 $8.34 $8.27 $8.14 $8.14 $8.00 Book Value per Share Tangible Book Value per Share Book Value Tangible Book Value
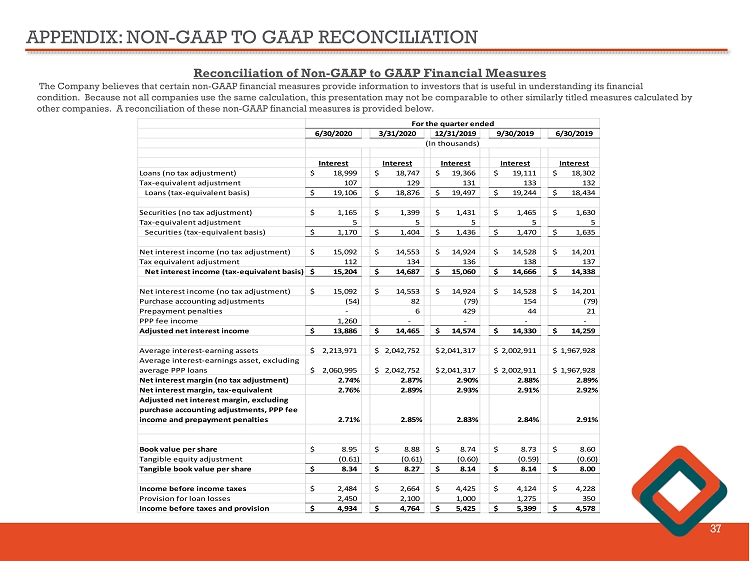
APPENDIX: NON - GAAP TO GAAP RECONCILIATION 37 Reconciliation of Non - GAAP to GAAP Financial Measures The Company believes that certain non - GAAP financial measures provide information to investors that is useful in understanding i ts financial condition. Because not all companies use the same calculation, this presentation may not be comparable to other similarly title d measures calculated by other companies. A reconciliation of these non - GAAP financial measures is provided below. 6/30/2020 3/31/2020 12/31/2019 9/30/2019 6/30/2019 Interest Interest Interest Interest Interest Loans (no tax adjustment) 18,999$ 18,747$ 19,366$ 19,111$ 18,302$ Tax-equivalent adjustment 107 129 131 133 132 Loans (tax-equivalent basis) 19,106$ 18,876$ 19,497$ 19,244$ 18,434$ Securities (no tax adjustment) 1,165$ 1,399$ 1,431$ 1,465$ 1,630$ Tax-equivalent adjustment 5 5 5 5 5 Securities (tax-equivalent basis) 1,170$ 1,404$ 1,436$ 1,470$ 1,635$ Net interest income (no tax adjustment) 15,092$ 14,553$ 14,924$ 14,528$ 14,201$ Tax equivalent adjustment 112 134 136 138 137 Net interest income (tax-equivalent basis) 15,204$ 14,687$ 15,060$ 14,666$ 14,338$ Net interest income (no tax adjustment) 15,092$ 14,553$ 14,924$ 14,528$ 14,201$ Purchase accounting adjustments (54) 82 (79) 154 (79) Prepayment penalties - 6 429 44 21 PPP fee income 1,260 - - - - Adjusted net interest income 13,886$ 14,465$ 14,574$ 14,330$ 14,259$ Average interest-earning assets 2,213,971$ 2,042,752$ 2,041,317$ 2,002,911$ 1,967,928$ Average interest-earnings asset, excluding average PPP loans 2,060,995$ 2,042,752$ 2,041,317$ 2,002,911$ 1,967,928$ Net interest margin (no tax adjustment) 2.74% 2.87% 2.90% 2.88% 2.89% Net interest margin, tax-equivalent 2.76% 2.89% 2.93% 2.91% 2.92% Adjusted net interest margin, excluding purchase accounting adjustments, PPP fee income and prepayment penalties 2.71% 2.85% 2.83% 2.84% 2.91% Book value per share 8.95$ 8.88$ 8.74$ 8.73$ 8.60$ Tangible equity adjustment (0.61) (0.61) (0.60) (0.59) (0.60) Tangible book value per share 8.34$ 8.27$ 8.14$ 8.14$ 8.00$ Income before income taxes 2,484$ 2,664$ 4,425$ 4,124$ 4,228$ Provision for loan losses 2,450 2,100 1,000 1,275 350 Income before taxes and provision 4,934$ 4,764$ 5,425$ 5,399$ 4,578$ For the quarter ended (In thousands)

WESTFIELD BANK “WHAT BETTER BANKING’S ALL ABOUT” James C. Hagan , President and Chief Executive Officer Guida R. Sajdak , Executive Vice President and Chief Financial Officer Meghan Hibner , Vice President and Investor Relations Officer 38 141 Elm Street, Westfield, MA