Attached files
| file | filename |
|---|---|
| EX-99.1 - EX-99.1 - Performance Food Group Co | pfgc-ex991_6.htm |
| 8-K - 8-K - Performance Food Group Co | pfgc-8k_20200812.htm |

Performance Food Group August 2020 Exhibit 99.2

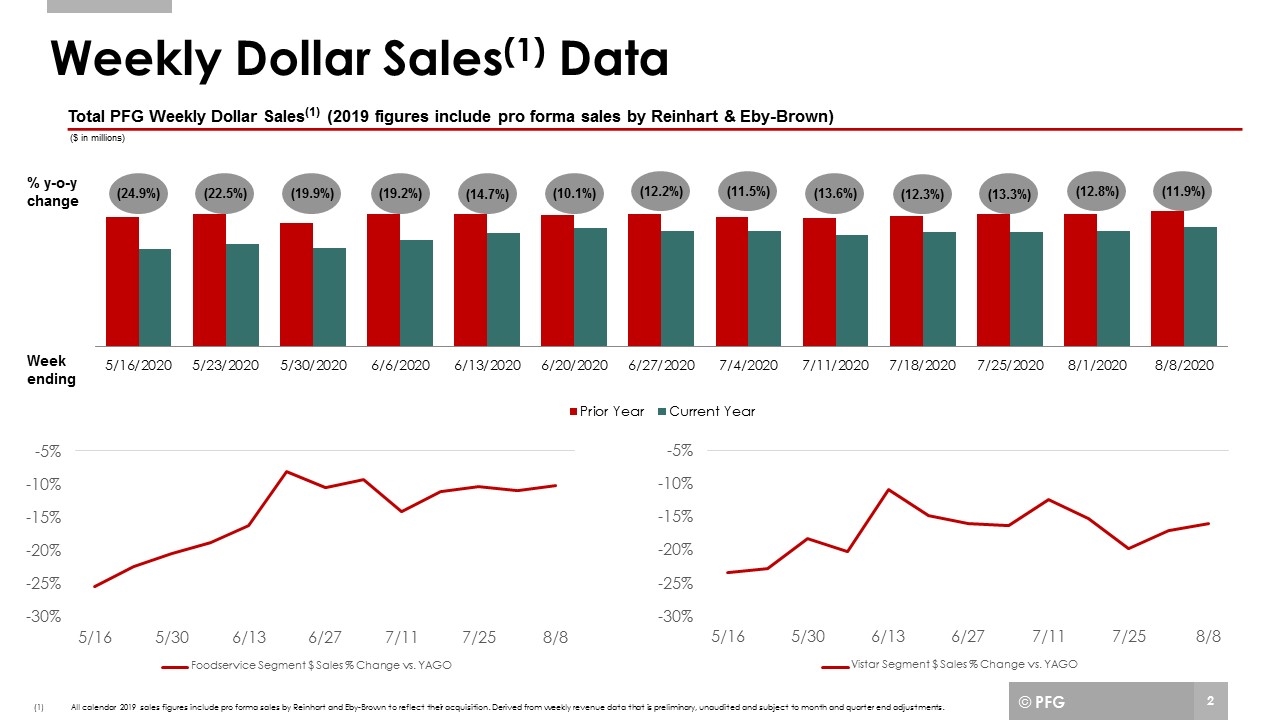
Weekly Dollar Sales(1) Data % y-o-y change (12.2%) Total PFG Weekly Dollar Sales(1) (2019 figures include pro forma sales by Reinhart & Eby-Brown) ($ in millions) (1)All calendar 2019 sales figures include pro forma sales by Reinhart and Eby-Brown to reflect their acquisition. Derived from weekly revenue data that is preliminary, unaudited and subject to month and quarter end adjustments. Week ending (13.6%) (12.3%) (13.3%) (12.8%) (24.9%) (19.9%) (22.5%) (19.2%) (14.7%) © PFG (10.1%) (11.5%) (11.9%)

