Attached files
| file | filename |
|---|---|
| 8-K - 8-K - PINNACLE FINANCIAL PARTNERS INC | pnfp-20200811.htm |

Second Quarter 2020 Update – August 11, 2020

Safe Harbor Statements Forward Looking Statements All statements, other than statements of historical fact, included in this presentation, are forward-looking statements within the meaning of the Private Securities Litigation Reform Act of 1995, Section 27A of the Securities Act of 1933 and Section 21E of the Securities Exchange Act of 1934. The words "expect," "anticipate," "intend," "may," “aims,” "should," "plan," "believe," "seek," "estimate" and similar expressions are intended to identify such forward-looking statements, but other statements not based on historical information may also be considered forward-looking statements. These forward-looking statements are subject to known and unknown risks, uncertainties and other factors that could cause the actual results to differ materially from the statements, including, but not limited to: (i) further deterioration in the financial condition of borrowers of Pinnacle Bank and its subsidiaries or Bankers Healthcare Group, LLC (BHG) resulting in significant increases in credit losses and provisions for those losses and, in the case of BHG, substitutions; (ii) the further effects of the emergence of widespread health emergencies or pandemics, including the magnitude and duration of the COVID-19 pandemic and its impact on general economic and financial market conditions and on Pinnacle Financial's and its customers' business, results of operations, asset quality and financial condition; (iii) the ability of the communities in which we operate and in which our borrowers’ are located or operate to re-open without setbacks or causing a return to more widespread safer-at-home orders as a result of increase in COVID-19 case volume; (iv) the ability to grow and retain low-cost core deposits and retain large, uninsured deposits, including during times when Pinnacle Bank is seeking to lower rates it pays on deposits; (v) the inability of Pinnacle Financial, or entities in which it has significant investments, like BHG, to maintain the historical growth rate of its, or such entities', loan portfolio; (vi) changes in loan underwriting, credit review or loss reserve policies associated with economic conditions, examination conclusions, or regulatory developments; (vii) effectiveness of Pinnacle Financial's asset management activities in improving, resolving or liquidating lower-quality assets; (viii) the impact of competition with other financial institutions, including pricing pressures and the resulting impact on Pinnacle Financial’s results, including as a result of compression to net interest margin; (ix) adverse conditions in the national or local economies including in Pinnacle Financial's markets throughout Tennessee, North Carolina, Georgia, South Carolina and Virginia, particularly in commercial and residential real estate markets; (x) fluctuations or differences in interest rates on loans or deposits from those that Pinnacle Financial is modeling or anticipating, including as a result of Pinnacle Bank's inability to better match deposit rates with the changes in the short-term rate environment, or that affect the yield curve or changes to the interest rate at which commercial banks borrow and lend their excess reserves to each other overnight to include a possible negative interest rate environment; (xi) the results of regulatory examinations; (xii) Pinnacle Financial's ability to identify potential candidates for, consummate, and achieve synergies from, potential future acquisitions; (xiii) difficulties and delays in integrating acquired businesses or fully realizing costs savings and other benefits from acquisitions; (xiv) BHG's ability to profitably grow its business and successfully execute on its business plans; (xv) risks of expansion into new geographic or product markets including the recent expansion into the Atlanta, Georgia metro market; (xvi) any matter that would cause Pinnacle Financial to conclude that there was impairment of any asset, including goodwill or other intangible assets; (xvii) reduced ability to attract additional financial advisors (or failure of such advisors to cause their clients to switch to Pinnacle Bank), to retain financial advisors (including as a result of the competitive environment for associates) or otherwise to attract customers from other financial institutions; (xviii) deterioration in the valuation of other real estate owned and increased expenses associated therewith; (xix) inability to comply with regulatory capital requirements, including those resulting from changes to capital calculation methodologies, required capital maintenance levels or regulatory requests or directives, particularly if Pinnacle Bank's level of applicable commercial real estate loans were to exceed percentage levels of total capital in guidelines recommended by its regulators; (xx) approval of the declaration of any dividend by Pinnacle Financial's board of directors; (xxi) the vulnerability of Pinnacle Bank's network and online banking portals, and the systems of parties with whom Pinnacle Bank contracts, to unauthorized access, computer viruses, phishing schemes, spam attacks, human error, natural disasters, power loss and other security breaches; (xxii) the possibility of increased compliance and operational costs as a result of increased regulatory oversight (including by the Consumer Financial Protection Bureau), including oversight of companies in which Pinnacle Financial or Pinnacle Bank have significant investments, like BHG, and the development of additional banking products for Pinnacle Bank's corporate and consumer clients; (xxiii) the risks associated with Pinnacle Financial and Pinnacle Bank being a minority investor in BHG, including the risk that the owners of a majority of the equity interests in BHG decide to sell the company; (xxiv) changes in state and federal legislation, regulations or policies applicable to banks and other financial service providers, like BHG, including regulatory or legislative developments; (xxv) the availability of and access to capital; (xxvi) adverse results (including costs, fines, reputational harm, inability to obtain necessary approvals and/or other negative effects) from current or future litigation, regulatory examinations or other legal and/or regulatory actions, including as a result of Pinnacle Bank's participation in and execution of government programs related to the COVID-19 pandemic, such as the Paycheck Protection Program; and (xxvii) general competitive, economic, political and market conditions. Additional factors which could affect the forward looking statements can be found in Pinnacle Financial's Annual Report on Form 10-K, Quarterly Reports on Form 10-Q, and Current Reports on Form 8-K filed with the SEC and available on the SEC's website at http://www.sec.gov, which risks may be heightened by the disruption and uncertainty resulting from the COVID-19 pandemic. Any projections of future results of operations or components thereof are based on a number of assumptions, many of which are outside Pinnacle Financial’s ability to control and should not be construed as any guarantee that such results will in fact occur. These projections are subject to change and could differ materially from final reported results. Pinnacle Financial disclaims any obligation to update or revise any forward-looking statements contained in this presentation, which speak only as of the date hereof, whether as a result of new information, future events or otherwise. 2
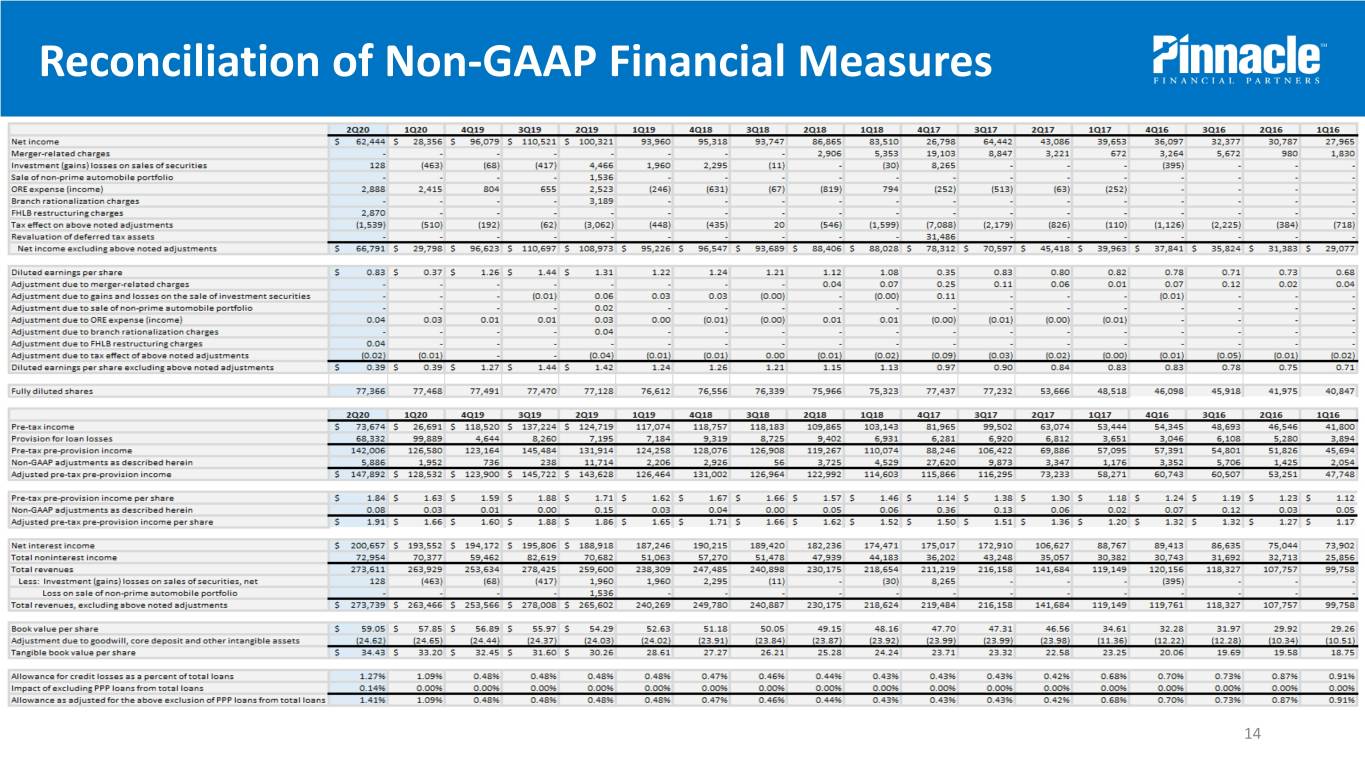
Safe Harbor Statements Non-GAAP Financial Matters This presentation contains certain non-GAAP financial measures, including, without limitation, earnings per diluted common share, adjusted pre-tax pre-provision net revenue and adjusted pre-tax pre- provision net revenue per common share, excluding in certain instances the impact of expenses related to other real estate owned, gains or losses on sale of investment securities, the charges associated with Pinnacle Financial's branch rationalization project, FHLB restructuring charges, the sale of the remaining portion of Pinnacle Bank's non-prime automobile portfolio, the revaluation of Pinnacle Financial’s deferred tax assets and other matters for the accounting periods presented. This presentation also includes non-GAAP financial measures which exclude the impact of loans originated under the PPP. This presentation may also contain certain other non-GAAP capital ratios and performance measures that exclude the impact of goodwill and core deposit intangibles associated with Pinnacle Financial's acquisitions of BNC, Avenue Bank, Magna Bank, CapitalMark Bank & Trust, Mid-America Bancshares, Inc., Cavalry Bancorp, Inc. and other acquisitions which collectively are less material to the non-GAAP measure as well as the impact of Pinnacle Financial’s Series B Preferred Stock. The presentation of the non-GAAP financial information is not intended to be considered in isolation or as a substitute for any measure prepared in accordance with GAAP. Because non-GAAP financial measures presented in this presentation are not measurements determined in accordance with GAAP and are susceptible to varying calculations, these non-GAAP financial measures, as presented, may not be comparable to other similarly titled measures presented by other companies. Pinnacle Financial believes that these non-GAAP financial measures facilitate making period-to-period comparisons and are meaningful indications of its operating performance. In addition, because intangible assets such as goodwill and the core deposit intangible, and the other items excluded each vary extensively from company to company, Pinnacle Financial believes that the presentation of this information allows investors to more easily compare Pinnacle Financial's results to the results of other companies. Pinnacle Financial's management utilizes this non-GAAP financial information to compare Pinnacle Financial's operating performance for 2020 versus certain periods in 2019 and to internally prepared projections. This investor presentation also includes references to estimated levels of adjusted pre-tax, pre-provision net revenue which is not presented as forecast or projection of future operating results. Pinnacle Financial does not provide reconciliations of adjusted pre-tax, pre-provision net revenue on a forward-looking basis to its most comparable GAAP financial measure because Pinnacle Financial is unable to forecast the amount or significance of certain items required to develop a meaningful comparable GAAP financial measures without unreasonable efforts. These items include impairment charges, gains or losses on sales of securities, ORE expenses, and incentive compensation expense, which are difficult to predict and estimate and are primarily dependent on future events, but which are excluded from Pinnacle Financial’s calculation of adjusted pre-tax, pre-provision net revenue. Pinnacle Financial believes that the probable significance of providing this forward-looking non-GAAP financial measure without a reconciliation to the most directly comparable GAAP financial measure, is that investors and analysts will have certain information that Pinnacle Financial believes is useful and meaningful regarding its operations, including its estimates on its ability to generate revenue before provision for credit losses expense, but will not have that information on a GAAP basis. Investors are cautioned that Pinnacle Financial cannot predict the occurrence, timing or amount of all non-GAAP items that may be excluded from adjusted pre-tax, pre-provision net revenue in the future. Accordingly, the actual effect of these items, when determined could potentially be significant to the calculation of adjusted pre-tax, pre-provision net revenue. 3

2Q20 Summary Results of Key GAAP Measures Total Revenues FD EPS Net Income Total Loans Total Deposits Book Value per Common Share (millions) (millions) Classified Asset Ratio NPA/ Loans & OREO NCOs 4

2Q20 Summary Results of Key Non-GAAP Measures Total Revenues FD EPS* Adjusted Pre-Tax Pre-Provision CAGR 20.5% $1.42 Net Revenue* $264,066 $273,739 $1.15 CAGR 22.7% (millions) $230,175 $ 143,628 $ 147,892 $141,684 $0.89 $0.84 $ 122,992 $0.75 $107,757 $ 73,233 $ 53,251 Total Loans Total Core Deposits Tangible Book Value per CAGR 26.0% (millions) $22,520 $21,392 $34.43 $18,814 CAGR 26.5% (millions) Common Share** $17,042 $16,504 CAGR 12.0% $14,759 $15,400 $30.26 $13,529 $25.28 $6,591 $22.58 $7,091 $19.58 NPA/ Loans & OREO Classified Asset Ratio NCOs 0.55% 0.44% 0.53% 0.55% 19.3% 0.35% 0.38% 14.2% 13.9% 0.17% 12.6% 0.10% 11.2% 0.09% 0.10% *: excluding merger-related charges, gains and losses on sales of investment securities, ORE expense (income), loss on sale of non-prime automobile portfolio, branch rationalization charges, FHLB restructuring charges and revaluation of deferred tax assets **: excluding goodwill, core deposit and other intangible assets 5 Note: For a reconciliation of these Non-GAAP financial measures to the comparable GAAP measures, see slide 14.
PNFP Will Focus on Defense During This Pandemic WeConsumer continue to build andliquidity, Small reserves Businessand capital during Programs this crisis Second Quarter 2020 Recap • Increased liquidity • Q2 was strongest core deposit growth in recent history; improving liquidity position. • Completed wholesale funding liquidity build. • Wholesale book allows us to hopefully begin to de-lever in 3Q and 4Q should COVID threat decrease. • Credit diligence • In-depth review of 1,280 loans – Current financial information obtained. ~$2B in loan balances • All graded commercial loans on deferral > $1 million in balances • All hotel and CRE retail loans > $1 million in balances • Deferrals dropped from $4.22 billion at June 30 to $2.65 billion at July 17. • ACL at 1.27% including PPP loans, 1.41% excluding PPP loans, at June 30. • Increased capital • Issued $225 million of noncumulative perpetual preferred stock qualifying as Tier 1 capital • 2020 PPNR in focus • 2Q20 PPNR, as adjusted, $1.96 per diluted common share compared to $1.69 for 1Q20, up 16% linked quarter • Loan growth will be sluggish, optimistic about deposit growth • Reducing deposit costs and implementing loan floors will aid our core margins during anticipated lower for longer, flatter yield curve • BHG is performing well during pandemic, wealth management units continues to build momentum and mortgage is having a great year • Expense growth in 2020 should be minimal • Reducing hiring goals with Atlanta and critical hires still being recruited • Reduced incentive costs for 2020 6
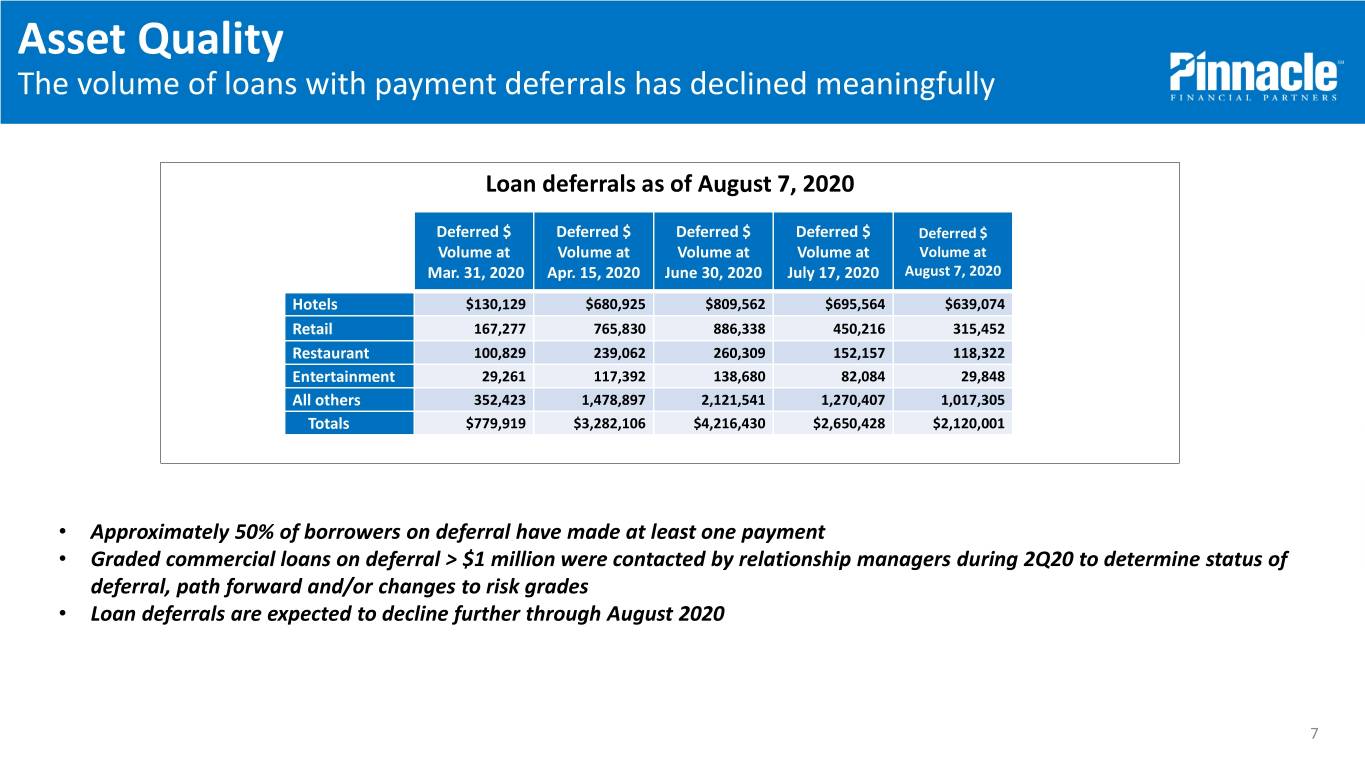
Asset Quality The volume of loans with payment deferrals has declined meaningfully Loan deferrals as of August 7, 2020 Deferred $ Deferred $ Deferred $ Deferred $ Deferred $ Volume at Volume at Volume at Volume at Volume at Mar. 31, 2020 Apr. 15, 2020 June 30, 2020 July 17, 2020 August 7, 2020 Hotels $130,129 $680,925 $809,562 $695,564 $639,074 Retail 167,277 765,830 886,338 450,216 315,452 Restaurant 100,829 239,062 260,309 152,157 118,322 Entertainment 29,261 117,392 138,680 82,084 29,848 All others 352,423 1,478,897 2,121,541 1,270,407 1,017,305 Totals $779,919 $3,282,106 $4,216,430 $2,650,428 $2,120,001 • Approximately 50% of borrowers on deferral have made at least one payment • Graded commercial loans on deferral > $1 million were contacted by relationship managers during 2Q20 to determine status of deferral, path forward and/or changes to risk grades • Loan deferrals are expected to decline further through August 2020 7
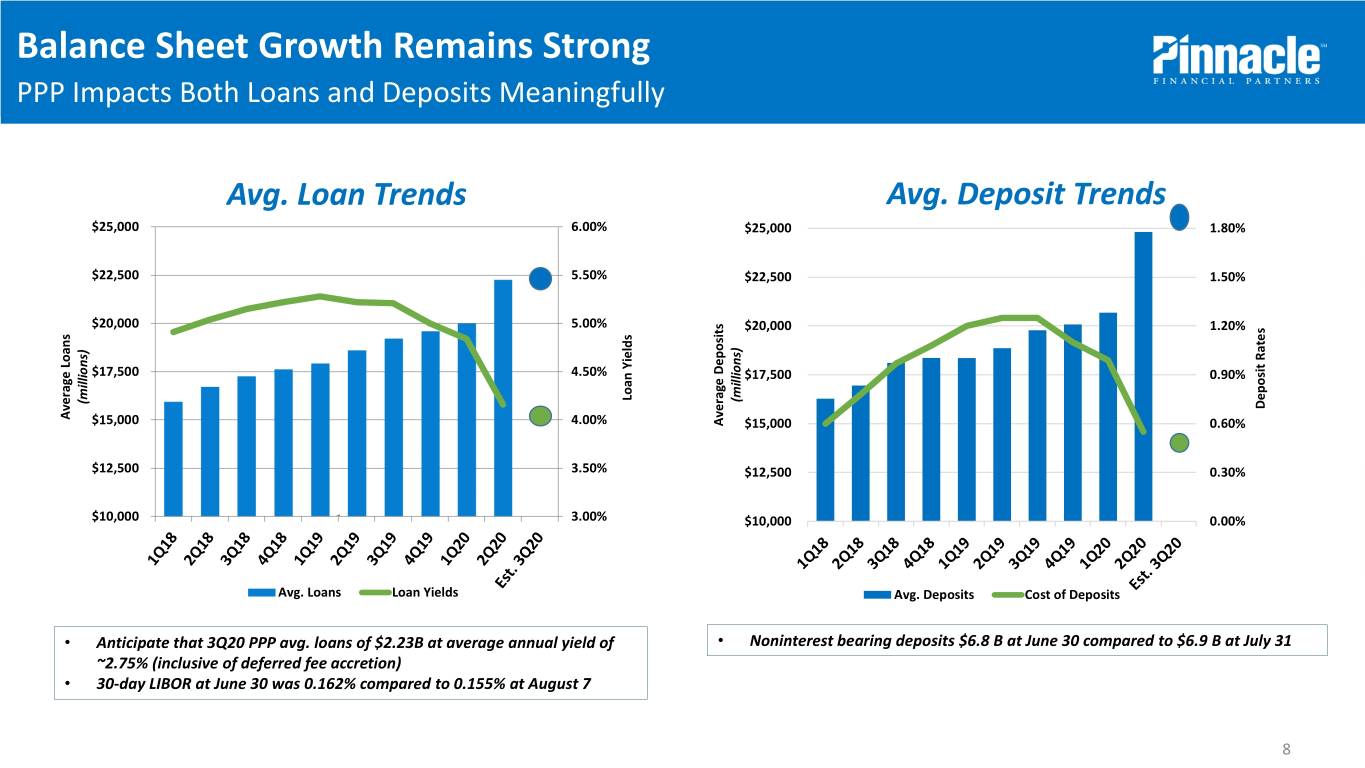
Balance Sheet Growth Remains Strong PPP Impacts Both Loans and Deposits Meaningfully Avg. Loan Trends Avg. Deposit Trends $25,000 6.00% $25,000 1.80% $22,500 5.50% $22,500 1.50% $20,000 5.00% $20,000 1.20% $17,500 4.50% $17,500 0.90% LoanYields (millions) (millions) Deposit Deposit Rates Average Average Loans $15,000 4.00% Average Deposits $15,000 0.60% $12,500 3.50% $12,500 0.30% $10,000 3.00% $10,000 0.00% Avg. Loans Loan Yields Avg. Deposits Cost of Deposits • Anticipate that 3Q20 PPP avg. loans of $2.23B at average annual yield of • Noninterest bearing deposits $6.8 B at June 30 compared to $6.9 B at July 31 ~2.75% (inclusive of deferred fee accretion) • 30-day LIBOR at June 30 was 0.162% compared to 0.155% at August 7 8
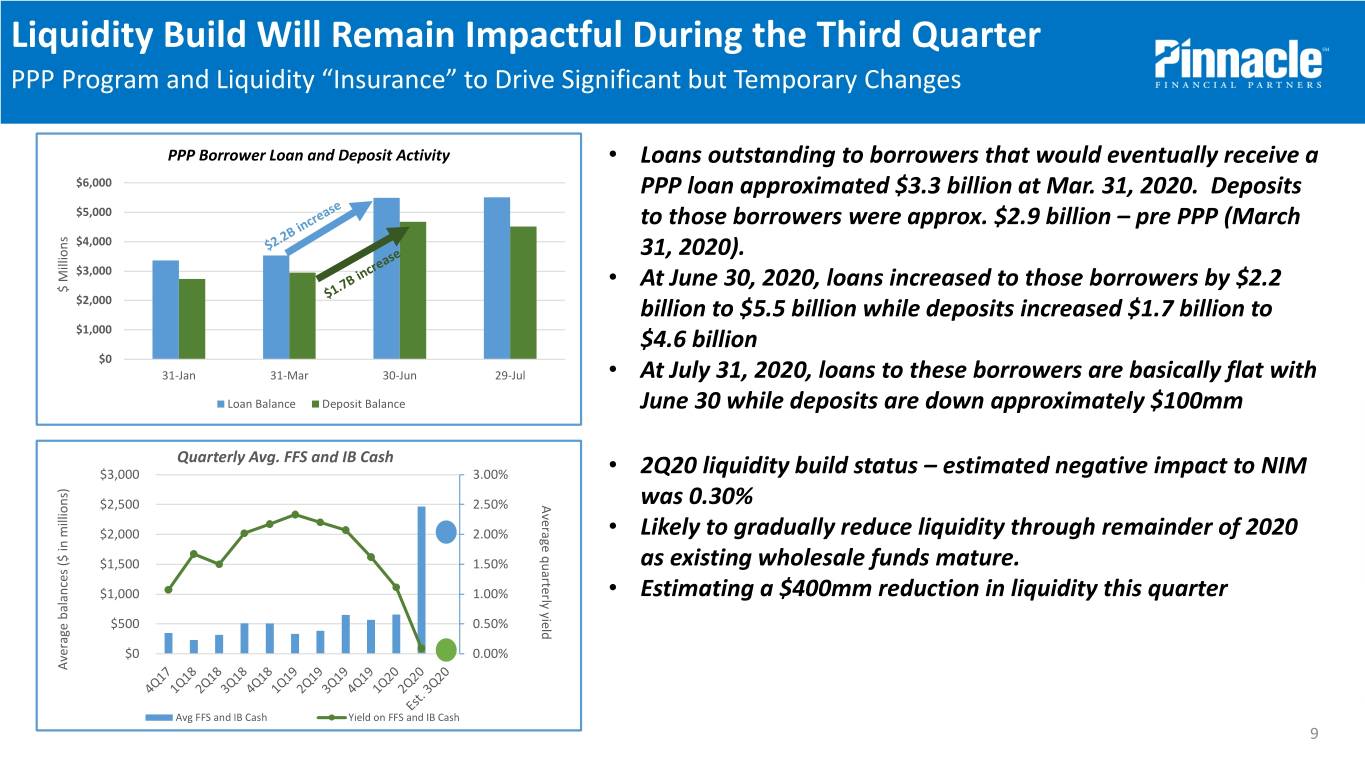
Liquidity Build Will Remain Impactful During the Third Quarter PPPConsumer Program and Liquidity and “Insurance” Small to Drive Business Significant but Temporary Programs Changes PPP Borrower Loan and Deposit Activity • Loans outstanding to borrowers that would eventually receive a $6,000 PPP loan approximated $3.3 billion at Mar. 31, 2020. Deposits $5,000 to those borrowers were approx. $2.9 billion – pre PPP (March $4,000 31, 2020). $3,000 • At June 30, 2020, loans increased to those borrowers by $2.2 $ Millions $ $2,000 billion to $5.5 billion while deposits increased $1.7 billion to $1,000 $4.6 billion $0 31-Jan 31-Mar 30-Jun 29-Jul • At July 31, 2020, loans to these borrowers are basically flat with Loan Balance Deposit Balance June 30 while deposits are down approximately $100mm Quarterly Avg. FFS and IB Cash $3,000 3.00% • 2Q20 liquidity build status – estimated negative impact to NIM $2,500 2.50% yield quarterly Average was 0.30% $2,000 2.00% • Likely to gradually reduce liquidity through remainder of 2020 $1,500 1.50% as existing wholesale funds mature. $1,000 1.00% • Estimating a $400mm reduction in liquidity this quarter $500 0.50% $0 0.00% Average Average balances ($ millions) in Avg FFS and IB Cash Yield on FFS and IB Cash 9
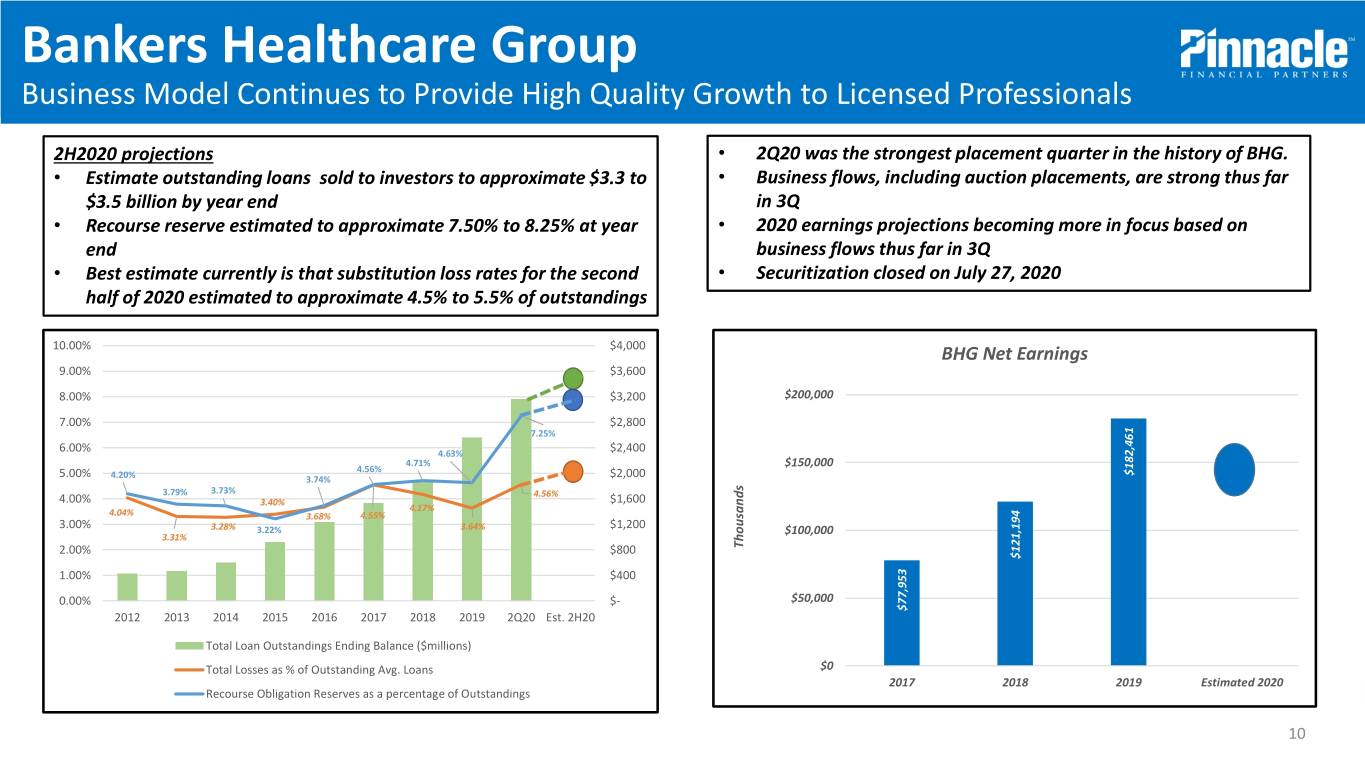
Bankers Healthcare Group Business Model Continues to Provide High Quality Growth to Licensed Professionals 2H2020 projections • 2Q20 was the strongest placement quarter in the history of BHG. • Estimate outstanding loans sold to investors to approximate $3.3 to • Business flows, including auction placements, are strong thus far $3.5 billion by year end in 3Q • Recourse reserve estimated to approximate 7.50% to 8.25% at year • 2020 earnings projections becoming more in focus based on end business flows thus far in 3Q • Best estimate currently is that substitution loss rates for the second • Securitization closed on July 27, 2020 half of 2020 estimated to approximate 4.5% to 5.5% of outstandings 10.00% $4,000 BHG Net Earnings 9.00% $3,600 8.00% $3,200 $200,000 7.00% $2,800 7.25% 6.00% 4.63% $2,400 4.71% $150,000 4.56% 5.00% 4.20% 3.74% $2,000 $182,461 3.79% 3.73% 4.56% 4.00% 3.40% $1,600 4.17% 4.04% 3.68% 4.55% 3.00% $1,200 3.28% 3.22% 3.64% $100,000 3.31% 2.00% $800 Thousands $121,194 1.00% $400 0.00% $- $50,000 $77,953 2012 2013 2014 2015 2016 2017 2018 2019 2Q20 Est. 2H20 Total Loan Outstandings Ending Balance ($millions) Total Losses as % of Outstanding Avg. Loans $0 2017 2018 2019 Estimated 2020 Recourse Obligation Reserves as a percentage of Outstandings 10
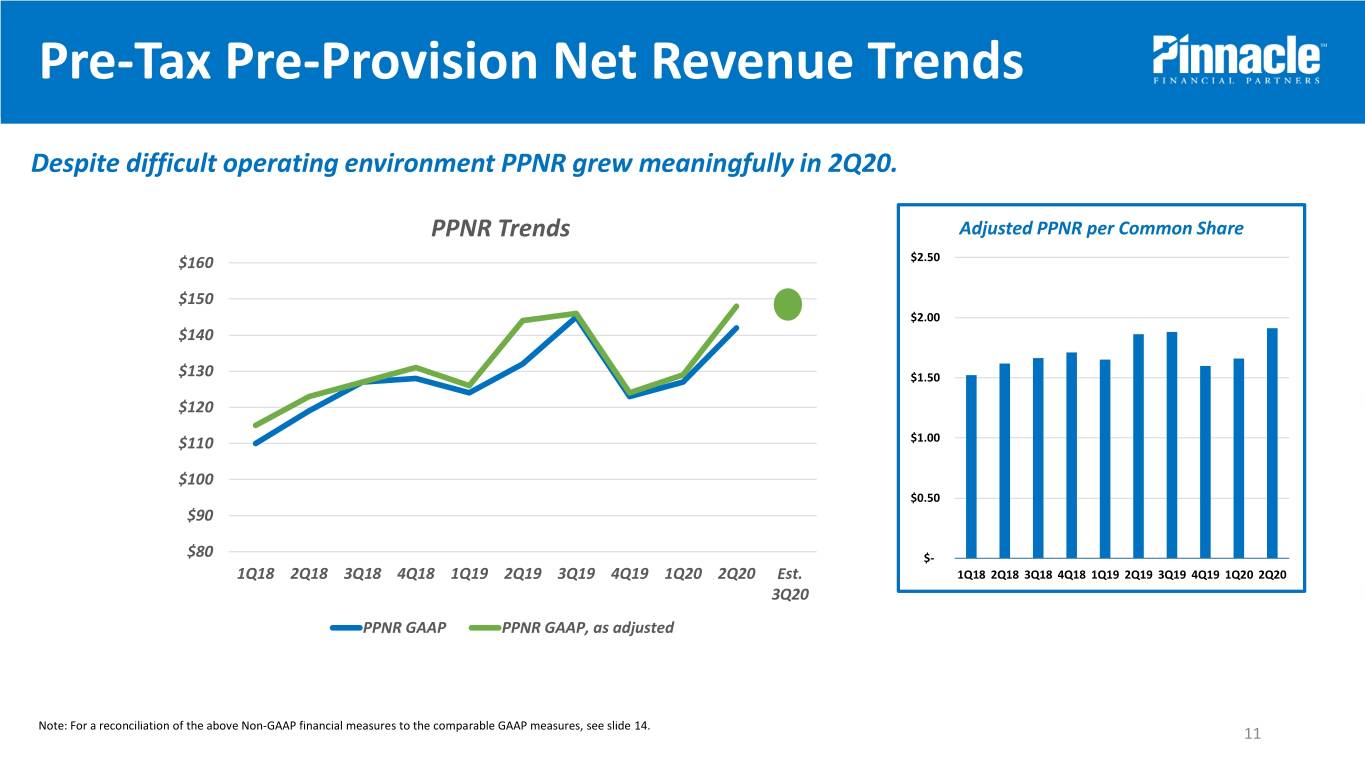
Pre-Tax Pre-Provision Net Revenue Trends Despite difficult operating environment PPNR grew meaningfully in 2Q20. PPNR Trends Adjusted PPNR per Common Share $160 $2.50 $150 $2.00 $140 $130 $1.50 $120 $110 $1.00 $100 $0.50 $90 $80 $- 1Q18 2Q18 3Q18 4Q18 1Q19 2Q19 3Q19 4Q19 1Q20 2Q20 Est. 1Q18 2Q18 3Q18 4Q18 1Q19 2Q19 3Q19 4Q19 1Q20 2Q20 3Q20 PPNR GAAP PPNR GAAP, as adjusted Note: For a reconciliation of the above Non-GAAP financial measures to the comparable GAAP measures, see slide 14. 11

PNFP will Continue to Focus on Soundness More than Growth in 3Q20 The Consumerlength and depth of the and pandemic Small are unknown, Business but we remain confidentPrograms in our model 3Q20 Outlook (in relation to Notes Full Year 2020 2Q20) Low to mid-single No meaningful PPP loan payoff/forgiveness anticipated in 3Q20 but do Average Loan Growth digit growth anticipate meaningful PPP payoff/forgiveness in 4Q20 (annualized) Low to mid-single Should experience some reduction in wholesale deposit balances in third Average Deposit Growth digit growth quarter. Additionally, anticipate reduction in PPP-related deposit balances (annualized) during 2H20 as borrowers use proceeds to support businesses. GAAP margin increase likely with recognition of PPP fee income beginning to Net interest income Up ramp up in 3Q20 Believe BHG performance will likely be consistent with 2Q20. Mortgage Fee income Flat to Down revenues likely to be down after record 2Q20 but still strong. Full Year Guidance Withheld at Expenses should be relatively stable with 2Q20. No meaningful change in this time Expenses Flat expense base contemplated at this time. Have throttled back hiring plans meaningfully for 2020. Net Charge offs Pending more information regarding pandemic’s depth and subsequent Return on Average Assets Withheld recovery prior to offering any prospective outlook Return on Tangible Common Equity Longer term Anticipate TCE to be within lower end of our longer-term operating range. Tangible Common Equity operating range of 8.75% to 9.75% 12
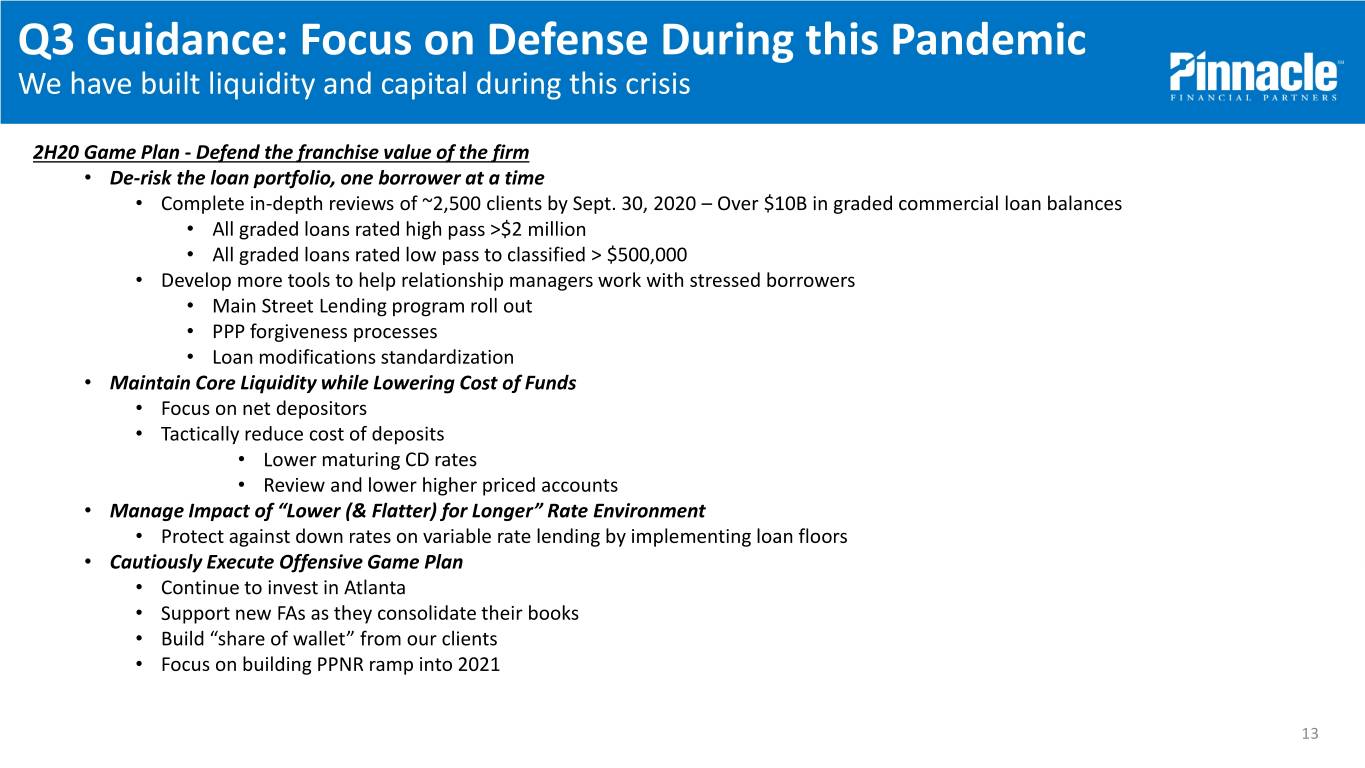
Q3 Guidance: Focus on Defense During this Pandemic WeConsumer have built liquidity and and capital Small during Business this crisis Programs 2H20 Game Plan - Defend the franchise value of the firm • De-risk the loan portfolio, one borrower at a time • Complete in-depth reviews of ~2,500 clients by Sept. 30, 2020 – Over $10B in graded commercial loan balances • All graded loans rated high pass >$2 million • All graded loans rated low pass to classified > $500,000 • Develop more tools to help relationship managers work with stressed borrowers • Main Street Lending program roll out • PPP forgiveness processes • Loan modifications standardization • Maintain Core Liquidity while Lowering Cost of Funds • Focus on net depositors • Tactically reduce cost of deposits • Lower maturing CD rates • Review and lower higher priced accounts • Manage Impact of “Lower (& Flatter) for Longer” Rate Environment • Protect against down rates on variable rate lending by implementing loan floors • Cautiously Execute Offensive Game Plan • Continue to invest in Atlanta • Support new FAs as they consolidate their books • Build “share of wallet” from our clients • Focus on building PPNR ramp into 2021 13
Reconciliation of Non-GAAP Financial Measures 14
