Attached files
| file | filename |
|---|---|
| EX-99.1 - EXHIBIT 99.1 - Avaya Holdings Corp. | ex991avayaq3fy20er.htm |
| 8-K - 8-K - Avaya Holdings Corp. | form8-kq3fy20earningsr.htm |

Investor Presentation 3Q FY20 August 10, 2020 © 2020 Avaya Inc. All rights reserved Exhibit 99.2
TEXT 0 – 0 – 0 204-0-0 127-127-127 17-114-210 80-200-74 86-183-242 247-150-70 Cautionary Note Regarding Forward-Looking Statements This release contains certain “forward-looking statements.” All statements other than statements of historical fact are “forward-looking” statements for purposes of the U.S. federal and state securities laws. These statements may be identified by the use of forward-looking terminology such as "anticipate," "believe," "continue," "could,“ "estimate," "expect," "intend," "may," "might," “our vision,” "plan," "potential," "preliminary," "predict," "should,“ "will," or “would” or the negative thereof or other variations thereof or comparable terminology. The Company has based these forward-looking statements on its current expectations, assumptions, estimates and projections. These statements, including the Company’s outlook, do not include the potential impact of any business combinations, asset acquisitions, divestitures, strategic investments or other strategic transactions completed after the date hereof. While the Company believes these expectations, assumptions, estimates and projections are reasonable, such forward-looking statements are only predictions and involve known and unknown risks and uncertainties, many of which are beyond its control. Risks and uncertainties that may cause these forward-looking statements to be inaccurate include, among others, the duration, severity and impact of the coronavirus pandemic (“COVID-19”), as well as governmental and business responses to COVID-19, and the impact the pandemic and such responses have on our business, financial performance, liquidity and other factors discussed in the Company's Annual Report on Form 10-K and subsequent quarterly reports on Form 10-Q filed with the Securities and Exchange Commission (the “SEC”). These risks and uncertainties may cause the Company’s actual results, performance or achievements to differ materially from any future results, performance or achievements expressed or implied by these forward-looking statements. For a further list and description of such risks and uncertainties, please refer to the Company’s filings with the SEC that are available at www.sec.gov. The Company cautions you that the list of important factors included in the Company’s SEC filings may not contain all of the material factors that are important to you. In addition, in light of these risks and uncertainties, the matters referred to in the forward-looking statements contained in this presentation may not in fact occur. The Company undertakes no obligation to publicly update or revise any forward-looking statement as a result of new information, future events or otherwise, except as otherwise required by law. These slides, as well as current and historical financial data, are available on our website at investors.avaya.com. None of the information included on the Company's website is incorporated by reference in this presentation. © 2020 Avaya Inc. All rights reserved 2
TEXT 0 – 0 – 0 204-0-0 127-127-127 17-114-210 80-200-74 86-183-242 247-150-70 Use of non-GAAP (Adjusted) Financial Measures The information furnished in this presentation includes non-GAAP financial measures that differ from measures calculated in accordance with generally accepted accounting principles in the United States of America (“GAAP”). EBITDA is defined as net income (loss) before income taxes, interest expense, interest income and depreciation and amortization. Adjusted EBITDA is EBITDA further adjusted to exclude certain charges and other adjustments described in our SEC filings and the tables in the Appendix hereto. We believe that including supplementary information concerning adjusted EBITDA is appropriate because it serves as a basis for determining management and employee compensation and it is used as a basis for calculating covenants in our credit agreements. In addition, we believe adjusted EBITDA provides more comparability between our historical results and results that reflect purchase accounting and our current capital structure. We also present adjusted EBITDA because we believe analysts and investors utilize these measures in analyzing our results. Adjusted EBITDA measures our financial performance based on operational factors that management can impact in the short-term, such as our pricing strategies, volume, costs and expenses of the organization, and it presents our financial performance in a way that can be more easily compared to prior quarters or fiscal years. EBITDA and adjusted EBITDA have limitations as analytical tools. EBITDA measures do not represent net income (loss) or cash flow from operations as those terms are defined by GAAP and do not necessarily indicate whether cash flows will be sufficient to fund cash needs. Adjusted EBITDA excludes the impact of earnings or charges resulting from matters that we do not consider indicative of our ongoing operations but that still affect our net income. In particular, our formulation of adjusted EBITDA allows adjustment for certain amounts that are included in calculating net income (loss), however, these are expenses that may recur, may vary and are difficult to predict. In addition, these terms are not necessarily comparable to other similarly titled captions of other companies due to the potential inconsistencies in the method of calculation. We also present the measures non-GAAP revenue, non-GAAP gross margin, non-GAAP operating income and non-GAAP operating margin as a supplement to our unaudited condensed consolidated financial statements presented in accordance with GAAP. We believe these non-GAAP measures are the most meaningful for period to period comparisons because they exclude the impact of the earnings and charges noted in the applicable tables in the Appendix to this presentation that resulted from matters that we consider not to be indicative of our ongoing operations. In addition, we present the liquidity measure of free cash flow. Free cash flow is calculated by subtracting capital expenditures from Net cash provided by operating activities. We believe free cash flow is a measure often used by analysts and investors to compare the cash flow and liquidity of companies in the same industry. The presentation of these non-GAAP financial measures is not intended to be considered in isolation from, as substitute for, or superior to, the financial information prepared and presented in accordance with GAAP and may be different from the non-GAAP financial measures used by other companies. In addition, these non-GAAP measures have limitations in that they do not reflect all of the amounts associated with the Company’s results of operations as determined in accordance with GAAP. The Appendix to this presentation includes tables that reconcile historical GAAP measures to non-GAAP measures. © 2020 Avaya Inc. All rights reserved 3
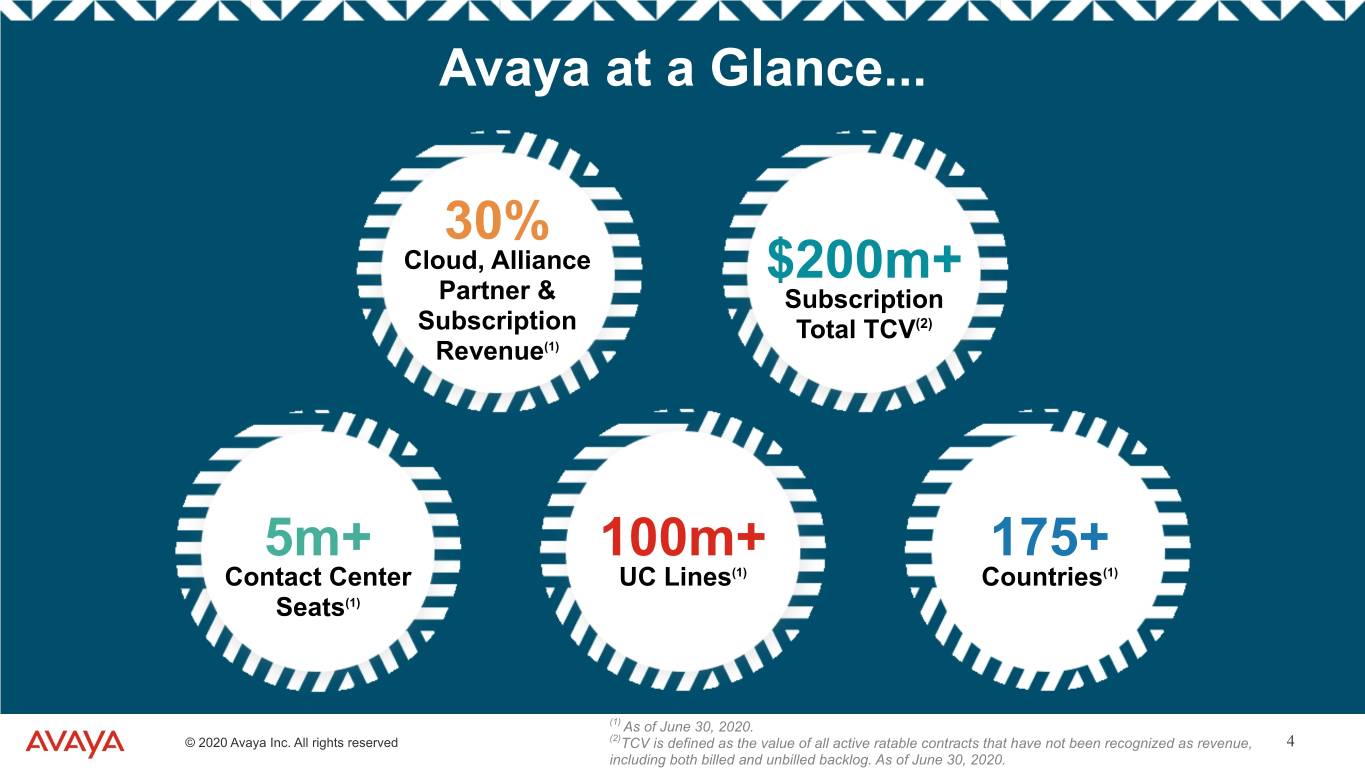
TEXT 0 – 0 – 0 204-0-0 127-127-127 17-114-210 80-200-74 86-183-242 247-150-70 Avaya at a Glance... 30% Cloud, Alliance $200m+ Partner & Subscription Subscription Total TCV(2) Revenue(1) 5m+ 100m+ 175+ Contact Center UC Lines(1) Countries(1) Seats(1) (1) As of June 30, 2020. © 2020 Avaya Inc. All rights reserved (2)TCV is defined as the value of all active ratable contracts that have not been recognized as revenue, 4 including both billed and unbilled backlog. As of June 30, 2020.
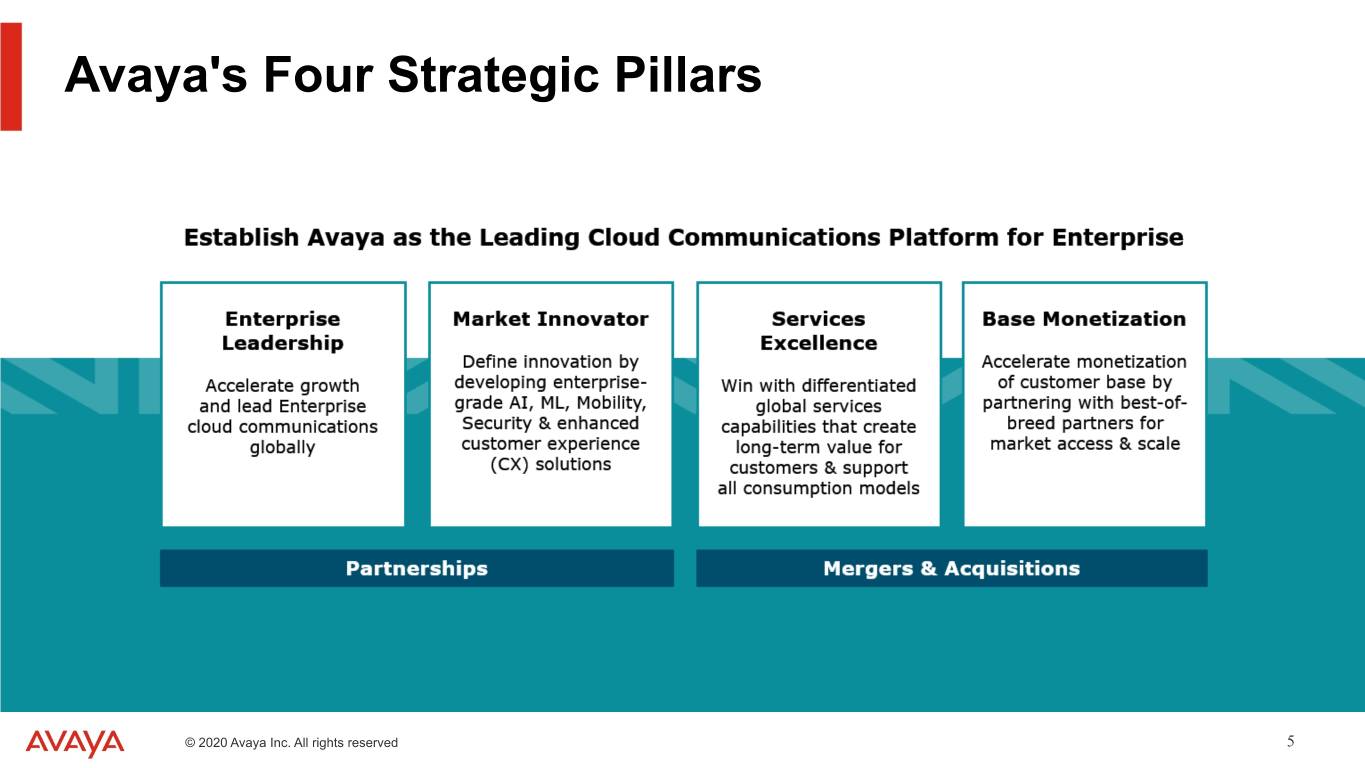
TEXT 0 – 0 – 0 204-0-0 127-127-127 17-114-210 80-200-74 86-183-242 247-150-70 Avaya's Four Strategic Pillars © 2020 Avaya Inc. All rights reserved 5
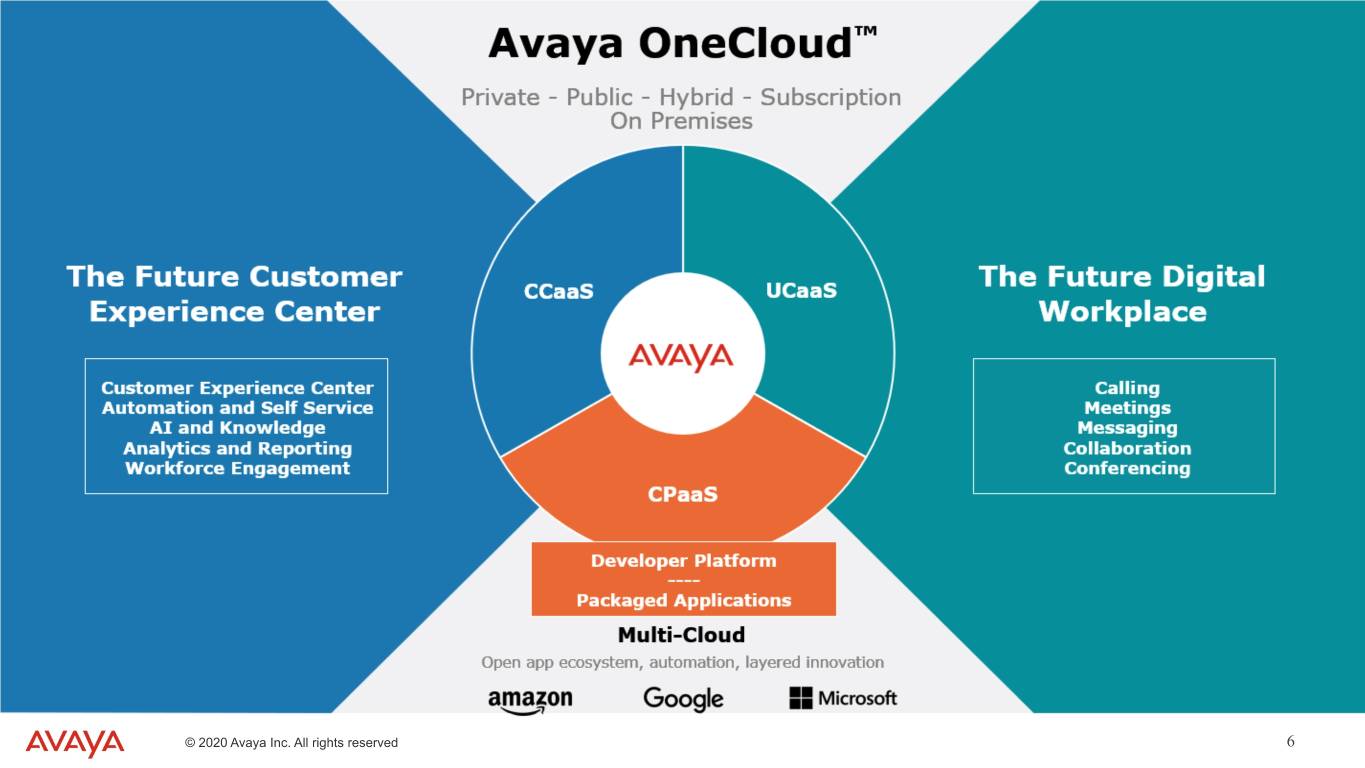
TEXT 0 – 0 – 0 204-0-0 127-127-127 17-114-210 80-200-74 86-183-242 247-150-70 © 2020 Avaya Inc. All rights reserved 6
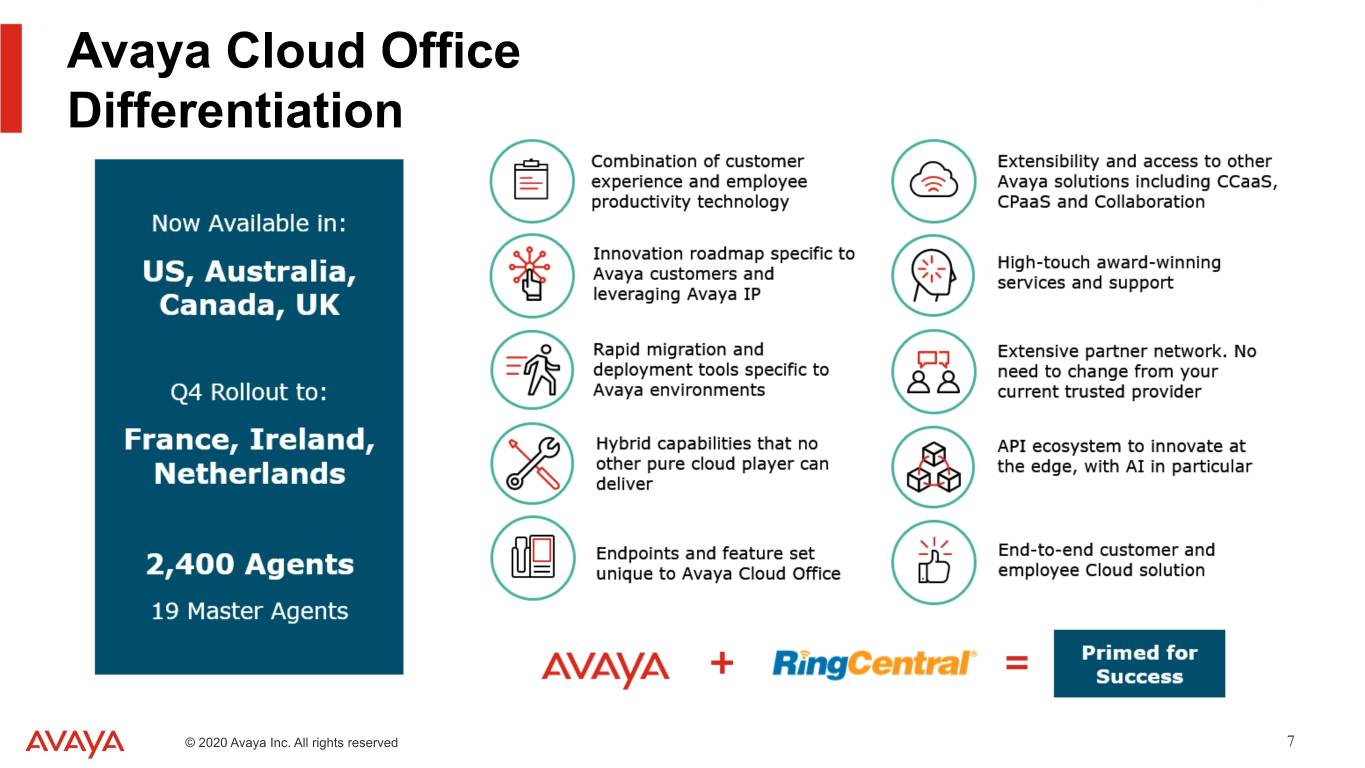
TEXT 0 – 0 – 0 204-0-0 127-127-127 17-114-210 80-200-74 86-183-242 247-150-70 Avaya Cloud Office Differentiation © 2020 Avaya Inc. All rights reserved 7
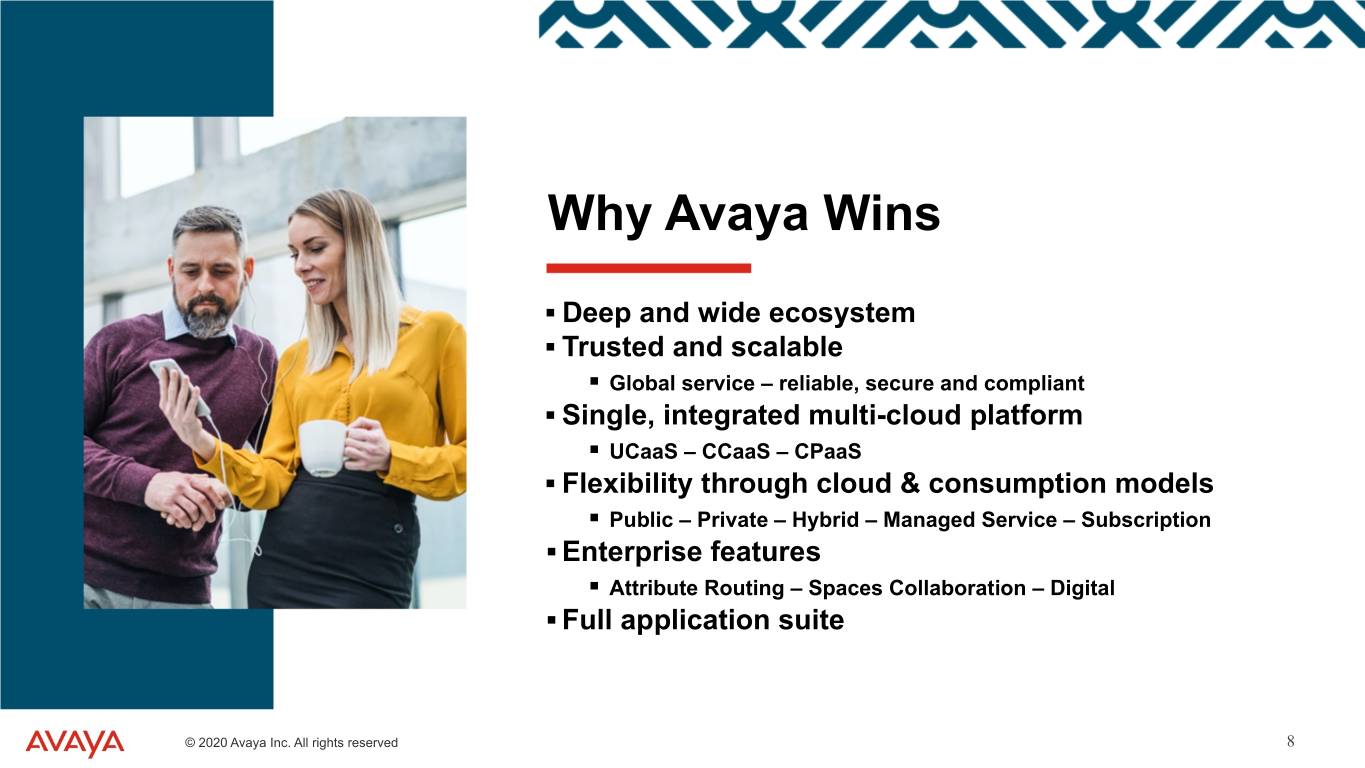
TEXT 0 – 0 – 0 204-0-0 127-127-127 17-114-210 80-200-74 86-183-242 247-150-70 Why Avaya Wins ▪ Deep and wide ecosystem ▪ Trusted and scalable ▪ Global service – reliable, secure and compliant ▪ Single, integrated multi-cloud platform ▪ UCaaS – CCaaS – CPaaS ▪ Flexibility through cloud & consumption models ▪ Public – Private – Hybrid – Managed Service – Subscription ▪ Enterprise features ▪ Attribute Routing – Spaces Collaboration – Digital ▪ Full application suite © 2020 Avaya Inc. All rights reserved 8

TEXT 0 – 0 – 0 204-0-0 127-127-127 17-114-210 80-200-74 86-183-242 247-150-70 Financial Overview 3Q FY20 © 2020 Avaya Inc. All rights reserved 9
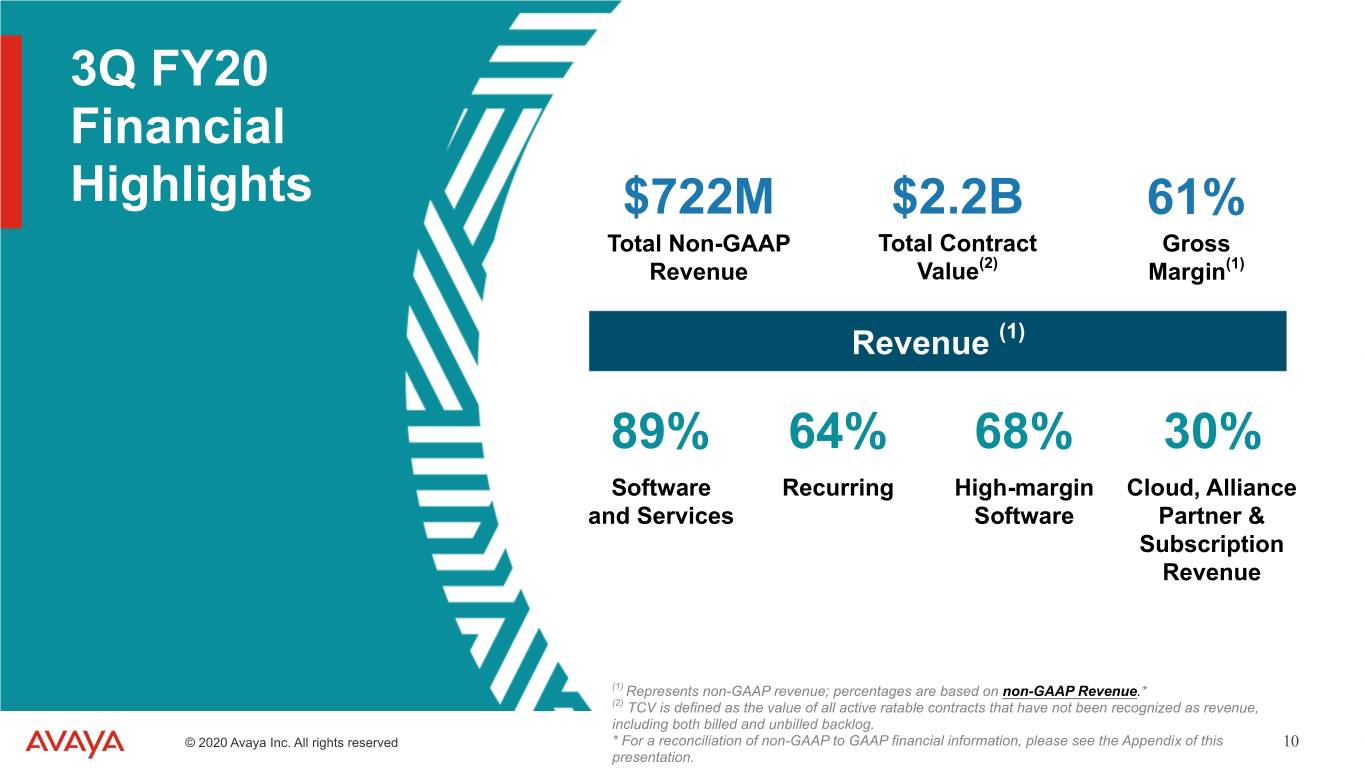
TEXT 0 – 0 – 0 204-0-0 127-127-127 17-114-210 80-200-74 86-183-242 247-150-70 3Q FY20 Financial Highlights $722M $2.2B 61% Total Non-GAAP Total Contract Gross Revenue Value(2) Margin(1) Revenue (1) 89% 64% 68% 30% Software Recurring High-margin Cloud, Alliance and Services Software Partner & Subscription Revenue (1) Represents non-GAAP revenue; percentages are based on non-GAAP Revenue.* (2) TCV is defined as the value of all active ratable contracts that have not been recognized as revenue, including both billed and unbilled backlog. © 2020 Avaya Inc. All rights reserved * For a reconciliation of non-GAAP to GAAP financial information, please see the Appendix of this 10 presentation.
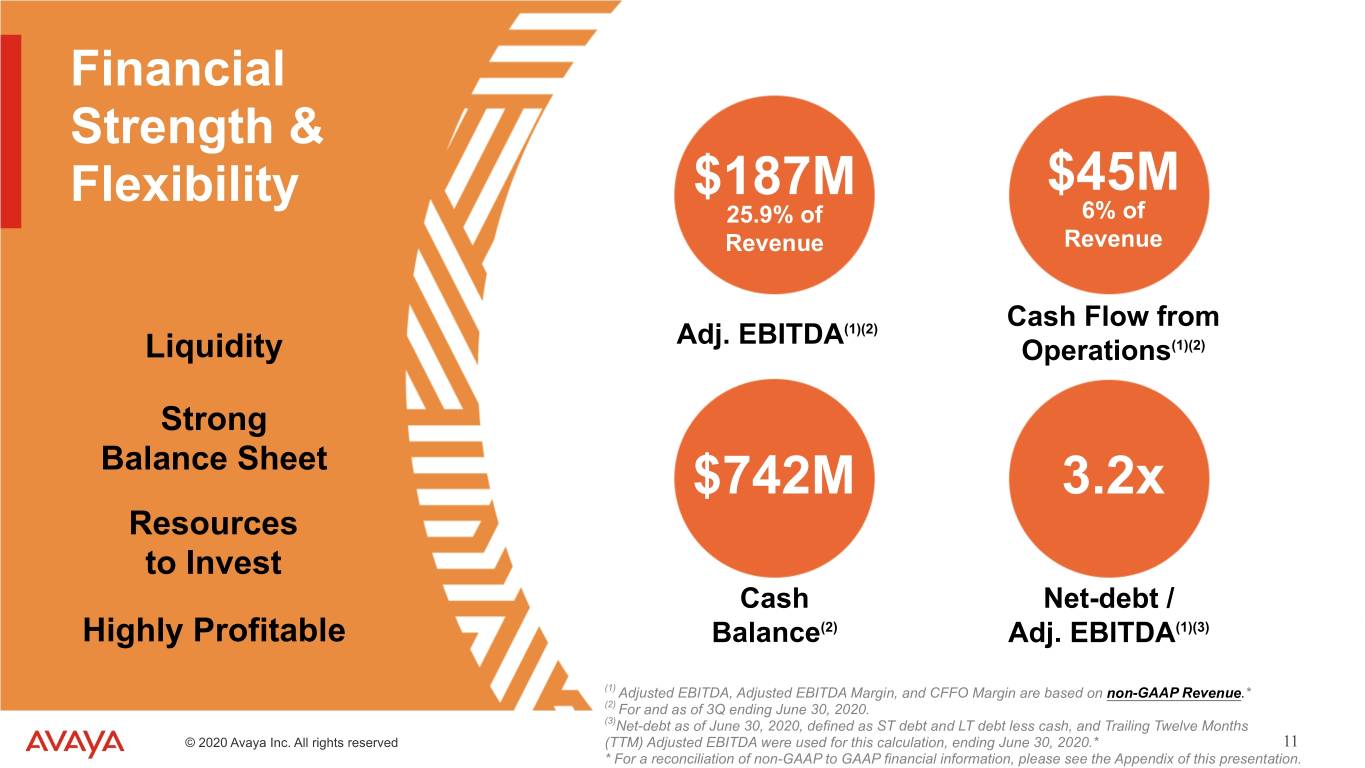
TEXT 0 – 0 – 0 204-0-0 127-127-127 17-114-210 80-200-74 86-183-242 247-150-70 Financial Strength & Flexibility $187M $45M 25.9% of 6% of Revenue Revenue Cash Flow from Adj. EBITDA(1)(2) Liquidity Operations(1)(2) Strong Balance Sheet $742M 3.2x Resources to Invest Cash Net-debt / Highly Profitable Balance(2) Adj. EBITDA(1)(3) (1) Adjusted EBITDA, Adjusted EBITDA Margin, and CFFO Margin are based on non-GAAP Revenue.* (2) For and as of 3Q ending June 30, 2020. (3)Net-debt as of June 30, 2020, defined as ST debt and LT debt less cash, and Trailing Twelve Months © 2020 Avaya Inc. All rights reserved (TTM) Adjusted EBITDA were used for this calculation, ending June 30, 2020.* 11 * For a reconciliation of non-GAAP to GAAP financial information, please see the Appendix of this presentation.
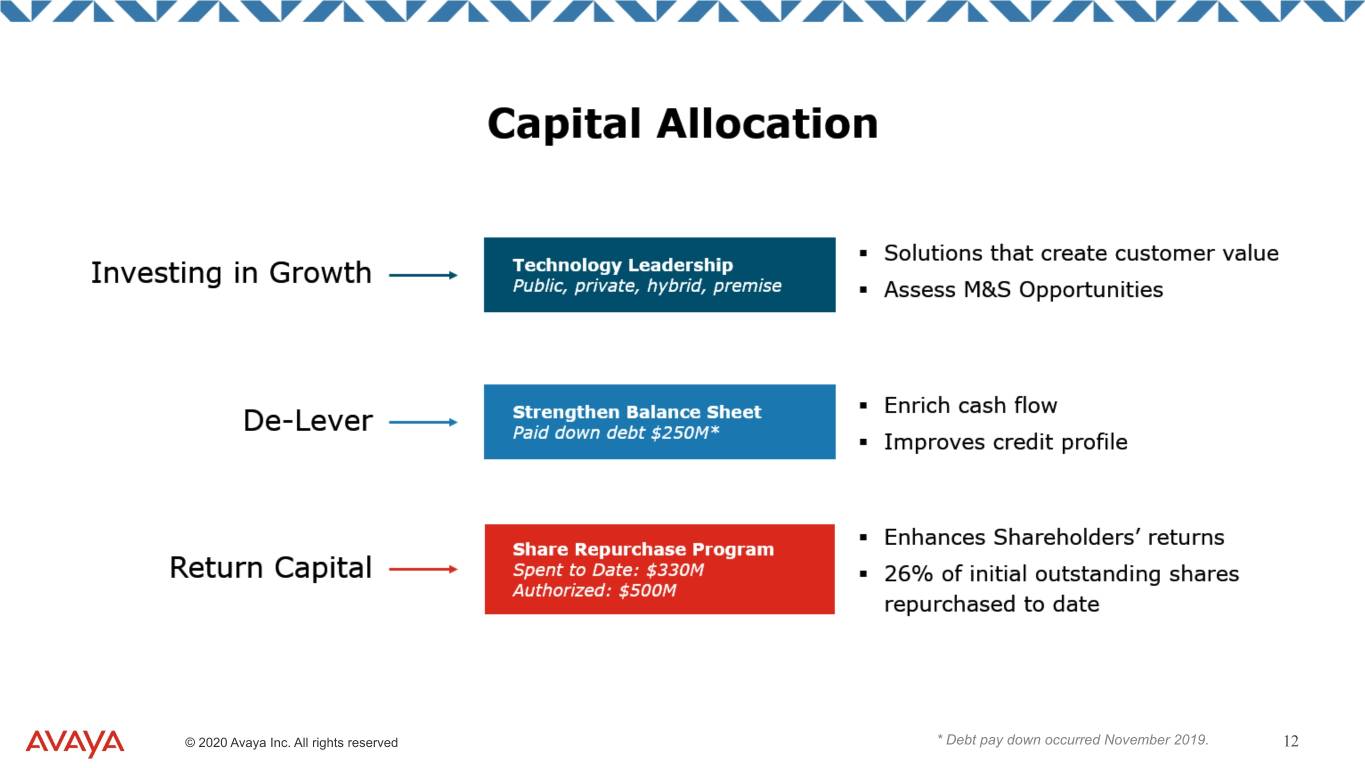
TEXT 0 – 0 – 0 204-0-0 127-127-127 17-114-210 80-200-74 86-183-242 247-150-70 Capital Allocation © 2020 Avaya Inc. All rights reserved * Debt pay down occurred November 2019. 12
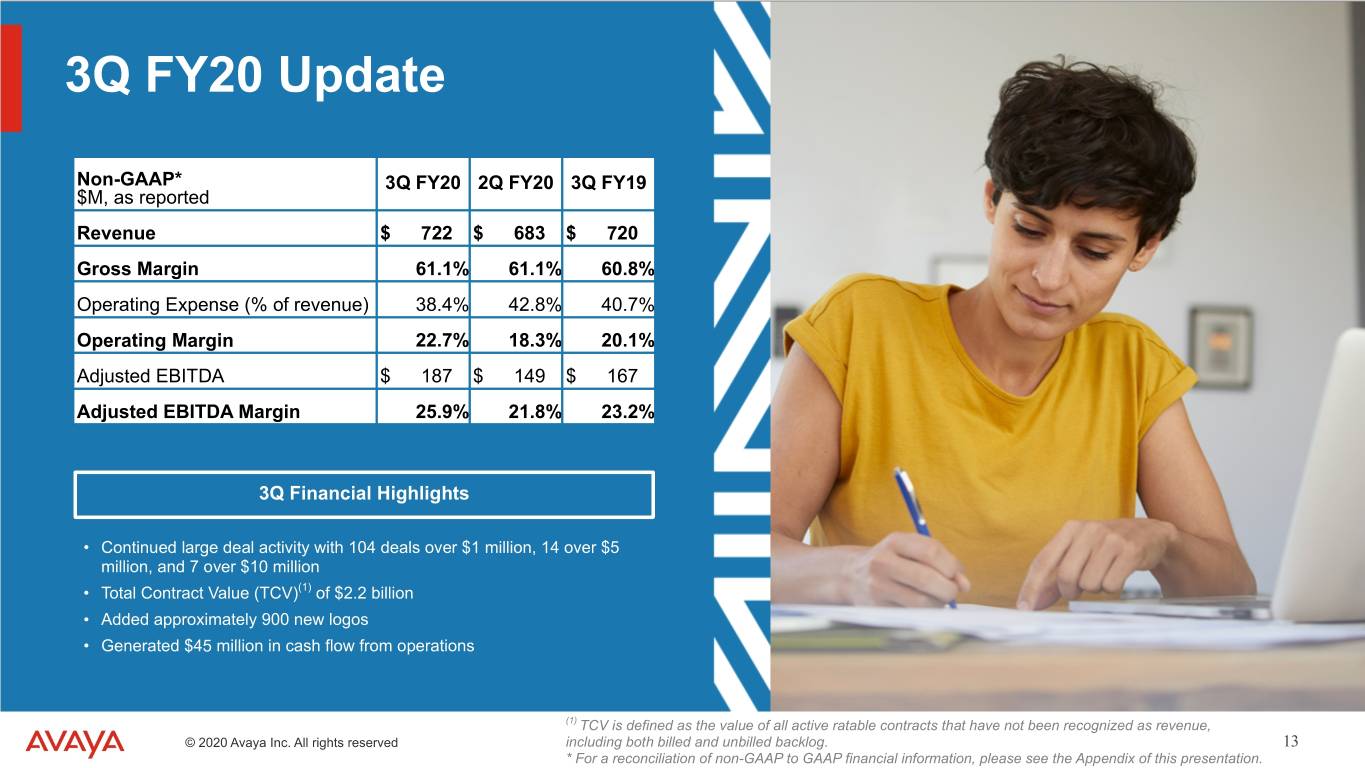
TEXT 0 – 0 – 0 204-0-0 127-127-127 17-114-210 80-200-74 86-183-242 247-150-70 3Q FY20 Update Non-GAAP* 3Q FY20 2Q FY20 3Q FY19 $M, as reported Revenue $ 722 $ 683 $ 720 Gross Margin 61.1% 61.1% 60.8% Operating Expense (% of revenue) 38.4% 42.8% 40.7% Operating Margin 22.7% 18.3% 20.1% Adjusted EBITDA $ 187 $ 149 $ 167 Adjusted EBITDA Margin 25.9% 21.8% 23.2% 3Q Financial Highlights • Continued large deal activity with 104 deals over $1 million, 14 over $5 million, and 7 over $10 million • Total Contract Value (TCV)(1) of $2.2 billion • Added approximately 900 new logos • Generated $45 million in cash flow from operations (1) TCV is defined as the value of all active ratable contracts that have not been recognized as revenue, © 2020 Avaya Inc. All rights reserved including both billed and unbilled backlog. 13 * For a reconciliation of non-GAAP to GAAP financial information, please see the Appendix of this presentation.
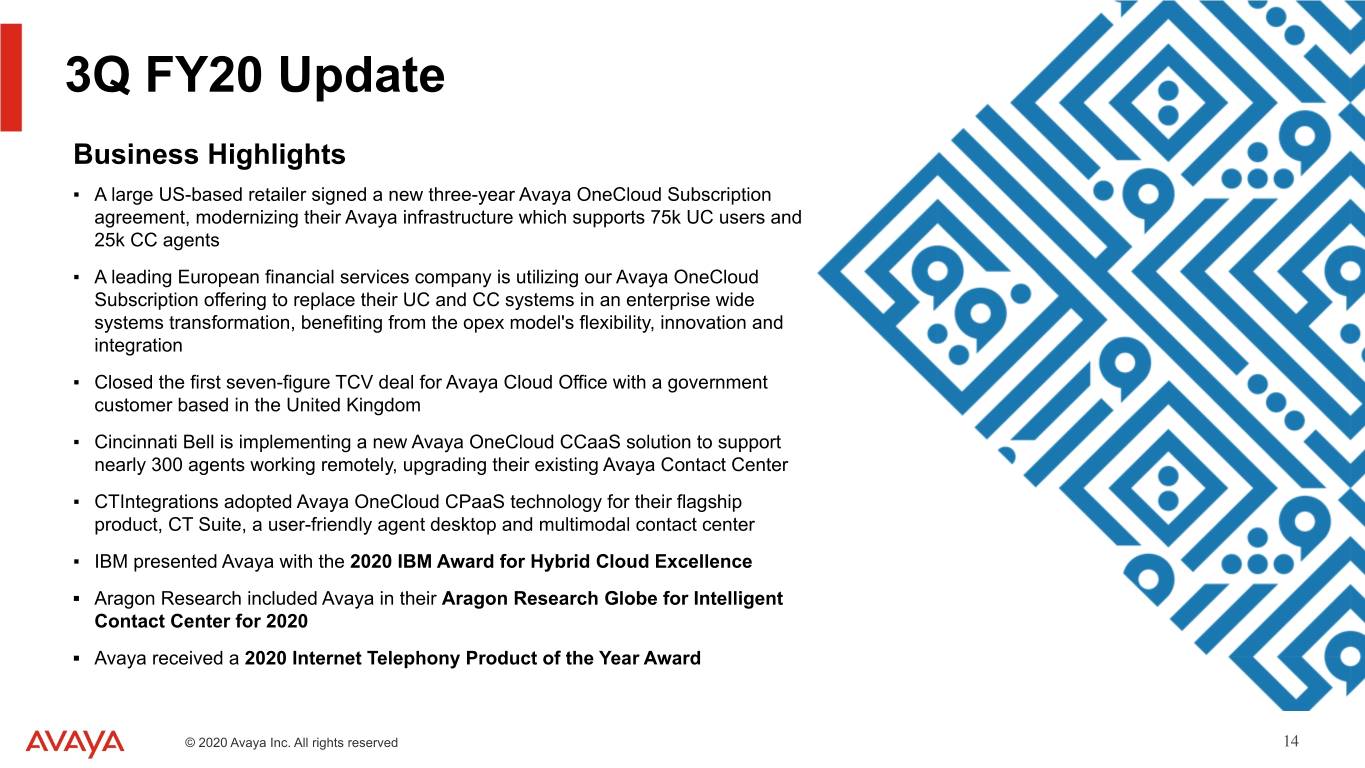
TEXT 0 – 0 – 0 204-0-0 127-127-127 17-114-210 80-200-74 86-183-242 247-150-70 3Q FY20 Update Business Highlights ▪ A large US-based retailer signed a new three-year Avaya OneCloud Subscription agreement, modernizing their Avaya infrastructure which supports 75k UC users and 25k CC agents ▪ A leading European financial services company is utilizing our Avaya OneCloud Subscription offering to replace their UC and CC systems in an enterprise wide systems transformation, benefiting from the opex model's flexibility, innovation and integration ▪ Closed the first seven-figure TCV deal for Avaya Cloud Office with a government customer based in the United Kingdom ▪ Cincinnati Bell is implementing a new Avaya OneCloud CCaaS solution to support nearly 300 agents working remotely, upgrading their existing Avaya Contact Center ▪ CTIntegrations adopted Avaya OneCloud CPaaS technology for their flagship product, CT Suite, a user-friendly agent desktop and multimodal contact center ▪ IBM presented Avaya with the 2020 IBM Award for Hybrid Cloud Excellence ▪ Aragon Research included Avaya in their Aragon Research Globe for Intelligent Contact Center for 2020 ▪ Avaya received a 2020 Internet Telephony Product of the Year Award © 2020 Avaya Inc. All rights reserved 14
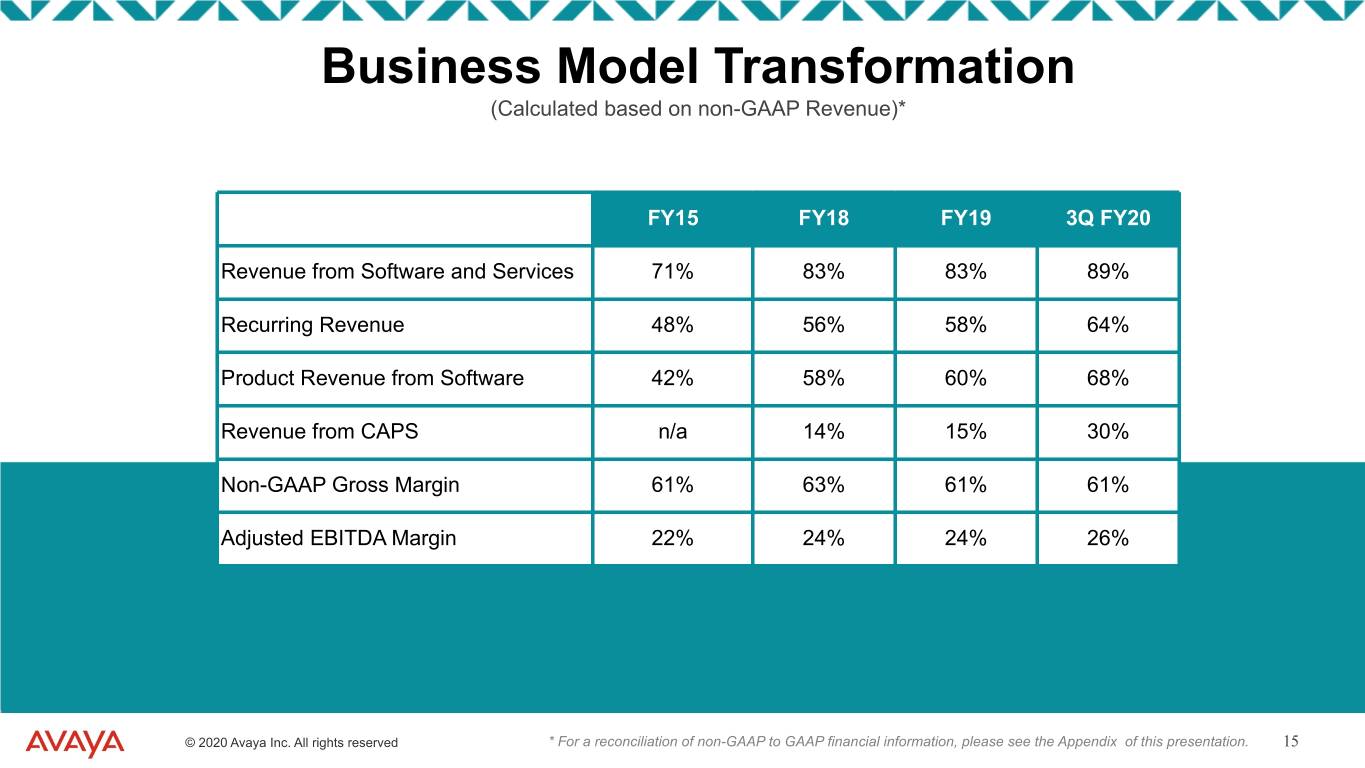
TEXT 0 – 0 – 0 204-0-0 127-127-127 17-114-210 80-200-74 86-183-242 247-150-70 Business Model Transformation (Calculated based on non-GAAP Revenue)* FY15 FY18 FY19 3Q FY20 Revenue from Software and Services 71% 83% 83% 89% Recurring Revenue 48% 56% 58% 64% Product Revenue from Software 42% 58% 60% 68% Revenue from CAPS n/a 14% 15% 30% Non-GAAP Gross Margin 61% 63% 61% 61% Adjusted EBITDA Margin 22% 24% 24% 26% © 2020 Avaya Inc. All rights reserved * For a reconciliation of non-GAAP to GAAP financial information, please see the Appendix of this presentation. 15
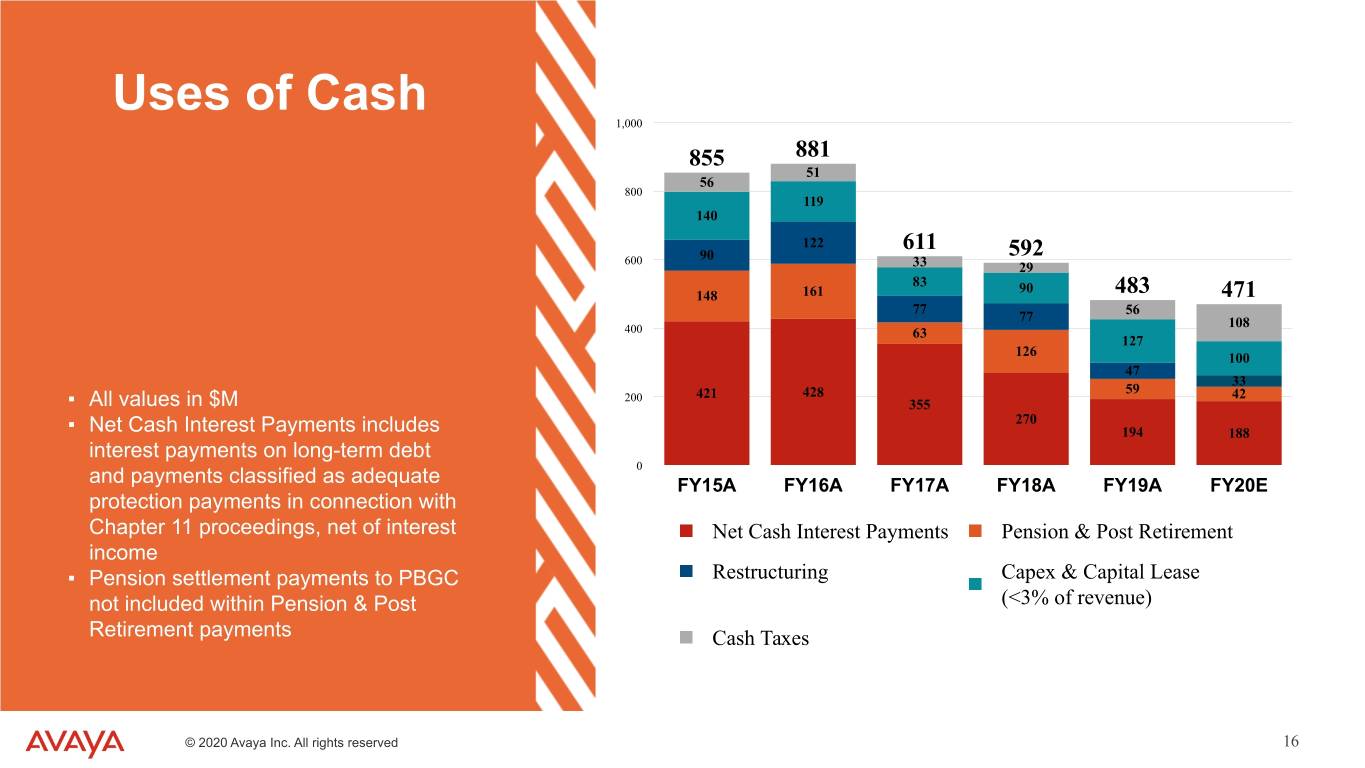
TEXT 0 – 0 – 0 204-0-0 127-127-127 17-114-210 80-200-74 86-183-242 247-150-70 Uses of Cash 1,000 855 881 51 56 800 119 140 122 611 592 600 90 33 29 83 90 148 161 483 471 77 56 77 108 400 63 127 126 100 47 33 59 200 421 428 42 ▪ All values in $M 355 270 ▪ Net Cash Interest Payments includes 194 188 interest payments on long-term debt 0 and payments classified as adequate FY15A FY16A FY17A FY18A FY19A FY20E protection payments in connection with Chapter 11 proceedings, net of interest Net Cash Interest Payments Pension & Post Retirement income ▪ Pension settlement payments to PBGC Restructuring Capex & Capital Lease not included within Pension & Post (<3% of revenue) Retirement payments Cash Taxes © 2020 Avaya Inc. All rights reserved 16
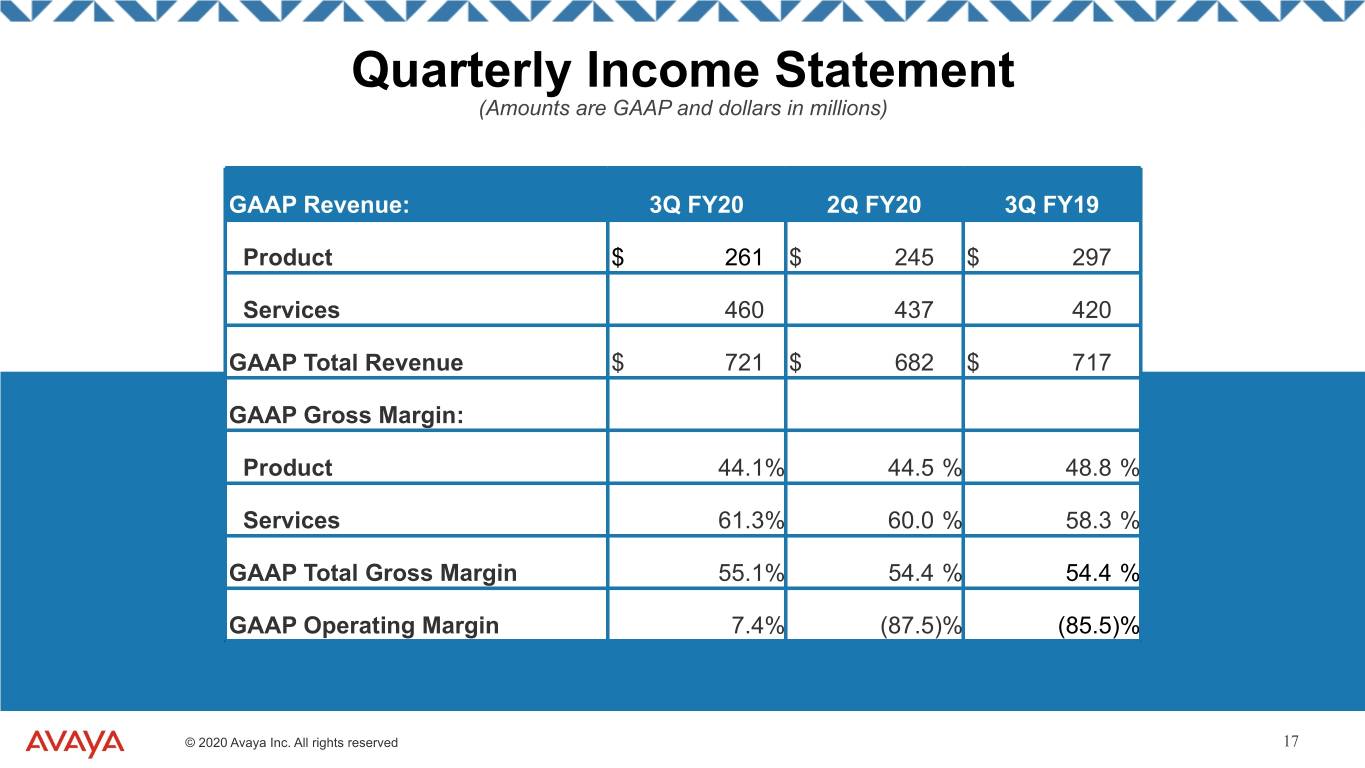
TEXT 0 – 0 – 0 204-0-0 127-127-127 17-114-210 80-200-74 86-183-242 247-150-70 Quarterly Income Statement (Amounts are GAAP and dollars in millions) GAAP Revenue: 3Q FY20 2Q FY20 3Q FY19 Product $ 261 $ 245 $ 297 Services 460 437 420 GAAP Total Revenue $ 721 $ 682 $ 717 GAAP Gross Margin: Product 44.1% 44.5 % 48.8 % Services 61.3% 60.0 % 58.3 % GAAP Total Gross Margin 55.1% 54.4 % 54.4 % GAAP Operating Margin 7.4% (87.5)% (85.5)% © 2020 Avaya Inc. All rights reserved 17
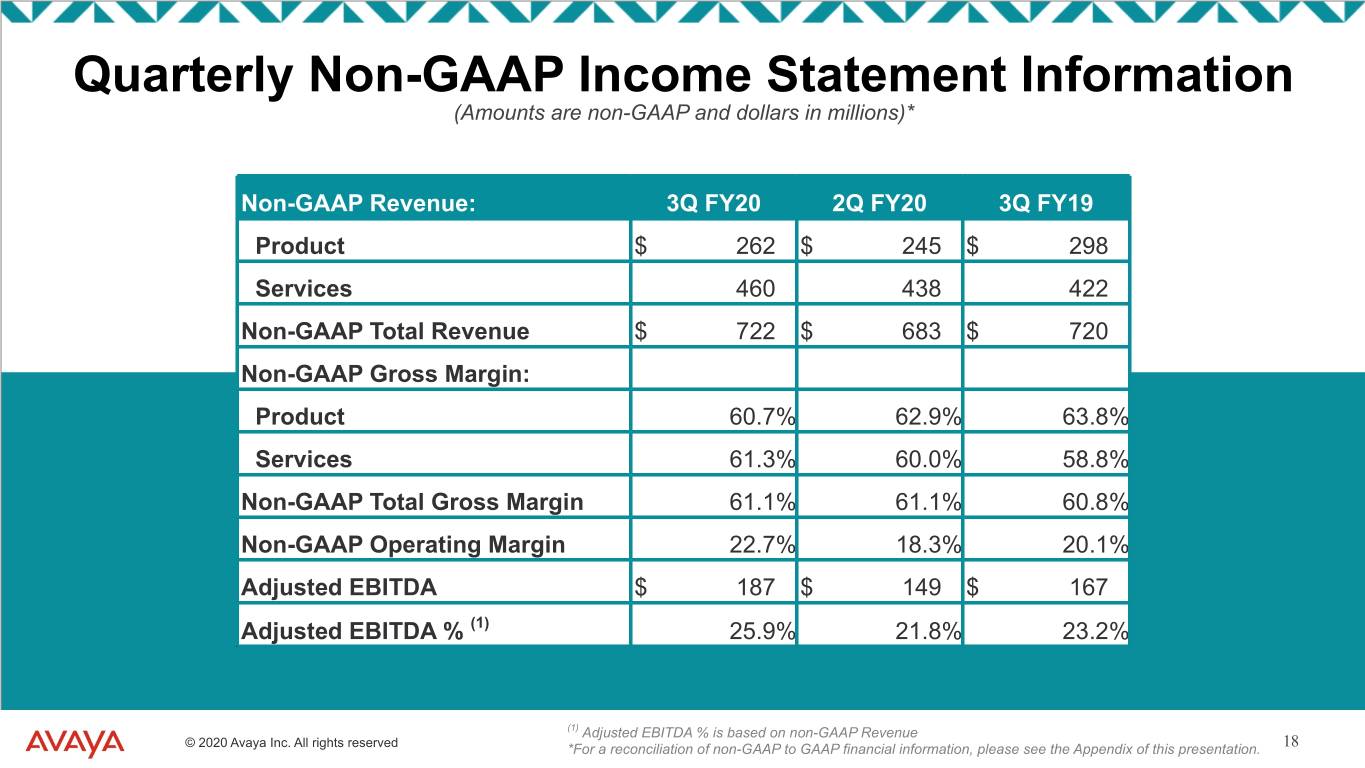
TEXT 0 – 0 – 0 204-0-0 127-127-127 17-114-210 80-200-74 86-183-242 247-150-70 Quarterly Non-GAAP Income Statement Information (Amounts are non-GAAP and dollars in millions)* Non-GAAP Revenue: 3Q FY20 2Q FY20 3Q FY19 Product $ 262 $ 245 $ 298 Services 460 438 422 Non-GAAP Total Revenue $ 722 $ 683 $ 720 Non-GAAP Gross Margin: Product 60.7% 62.9% 63.8% Services 61.3% 60.0% 58.8% Non-GAAP Total Gross Margin 61.1% 61.1% 60.8% Non-GAAP Operating Margin 22.7% 18.3% 20.1% Adjusted EBITDA $ 187 $ 149 $ 167 Adjusted EBITDA % (1) 25.9% 21.8% 23.2% (1) Adjusted EBITDA % is based on non-GAAP Revenue © 2020 Avaya Inc. All rights reserved *For a reconciliation of non-GAAP to GAAP financial information, please see the Appendix of this presentation. 18
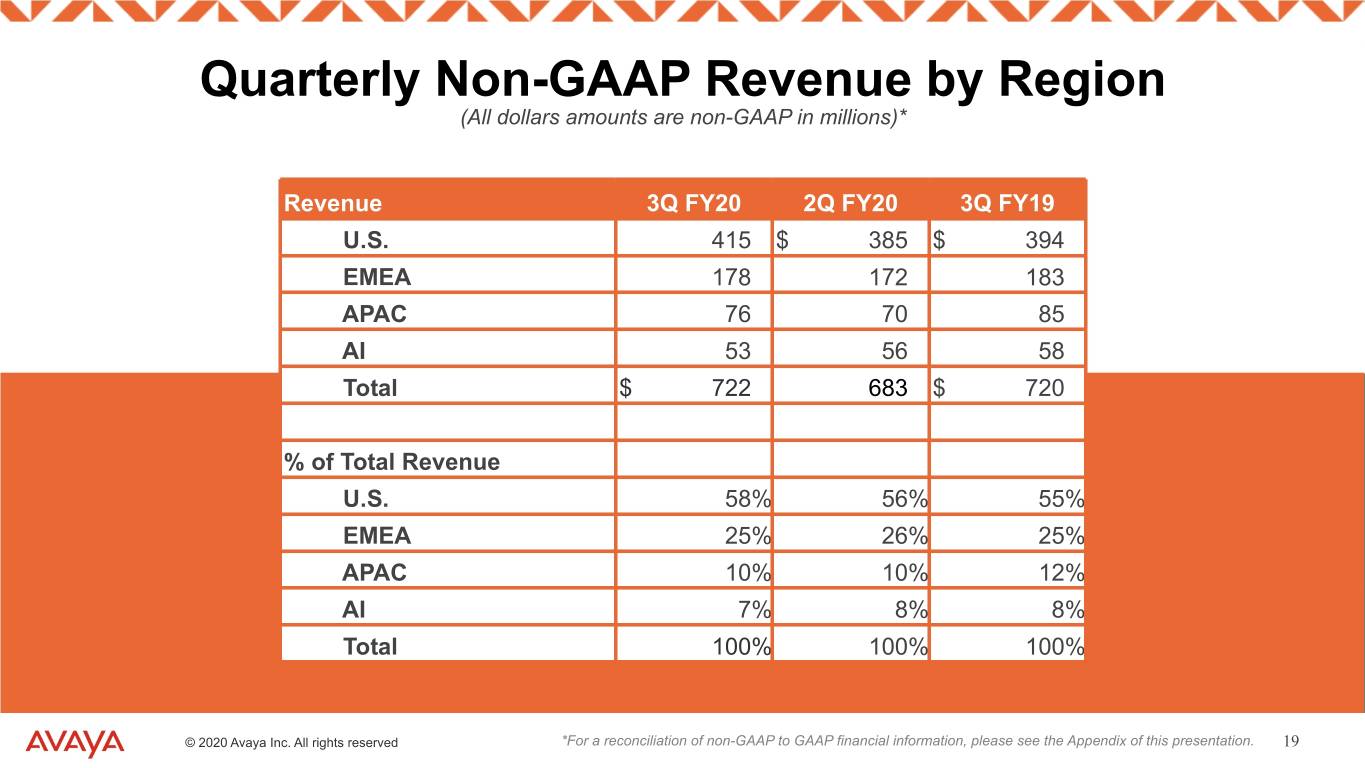
TEXT 0 – 0 – 0 204-0-0 127-127-127 17-114-210 80-200-74 86-183-242 247-150-70 Quarterly Non-GAAP Revenue by Region (All dollars amounts are non-GAAP in millions)* Revenue 3Q FY20 2Q FY20 3Q FY19 U.S. 415 $ 385 $ 394 EMEA 178 172 183 APAC 76 70 85 AI 53 56 58 Total $ 722 683 $ 720 % of Total Revenue U.S. 58% 56% 55% EMEA 25% 26% 25% APAC 10% 10% 12% AI 7% 8% 8% Total 100% 100% 100% © 2020 Avaya Inc. All rights reserved *For a reconciliation of non-GAAP to GAAP financial information, please see the Appendix of this presentation. 19
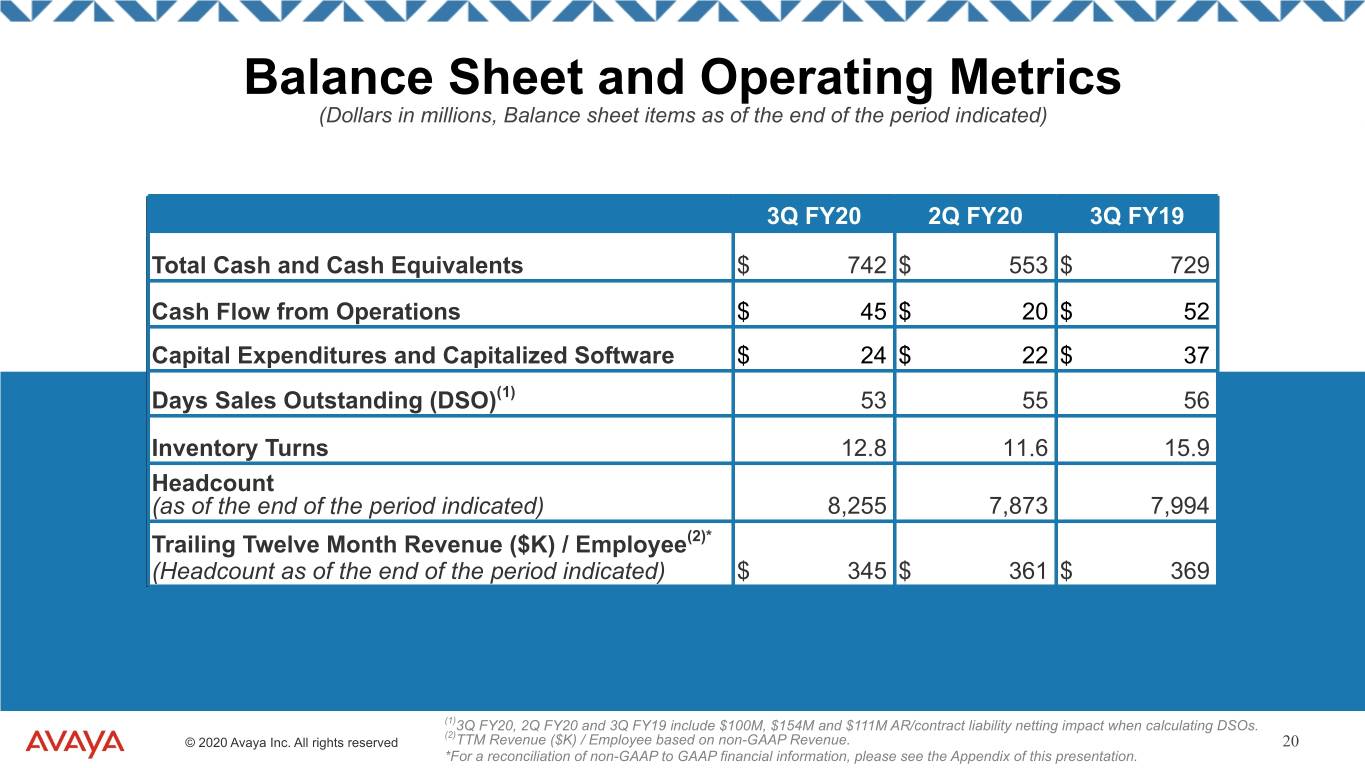
TEXT 0 – 0 – 0 204-0-0 127-127-127 17-114-210 80-200-74 86-183-242 247-150-70 Balance Sheet and Operating Metrics (Dollars in millions, Balance sheet items as of the end of the period indicated) 3Q FY20 2Q FY20 3Q FY19 Total Cash and Cash Equivalents $ 742 $ 553 $ 729 Cash Flow from Operations $ 45 $ 20 $ 52 Capital Expenditures and Capitalized Software $ 24 $ 22 $ 37 Days Sales Outstanding (DSO)(1) 53 55 56 Inventory Turns 12.8 11.6 15.9 Headcount (as of the end of the period indicated) 8,255 7,873 7,994 Trailing Twelve Month Revenue ($K) / Employee(2)* (Headcount as of the end of the period indicated) $ 345 $ 361 $ 369 (1)3Q FY20, 2Q FY20 and 3Q FY19 include $100M, $154M and $111M AR/contract liability netting impact when calculating DSOs. (2) © 2020 Avaya Inc. All rights reserved TTM Revenue ($K) / Employee based on non-GAAP Revenue. 20 *For a reconciliation of non-GAAP to GAAP financial information, please see the Appendix of this presentation.

TEXT 0 – 0 – 0 204-0-0 127-127-127 17-114-210 80-200-74 86-183-242 247-150-70 Appendix © 2020 Avaya Inc. All rights reserved 21
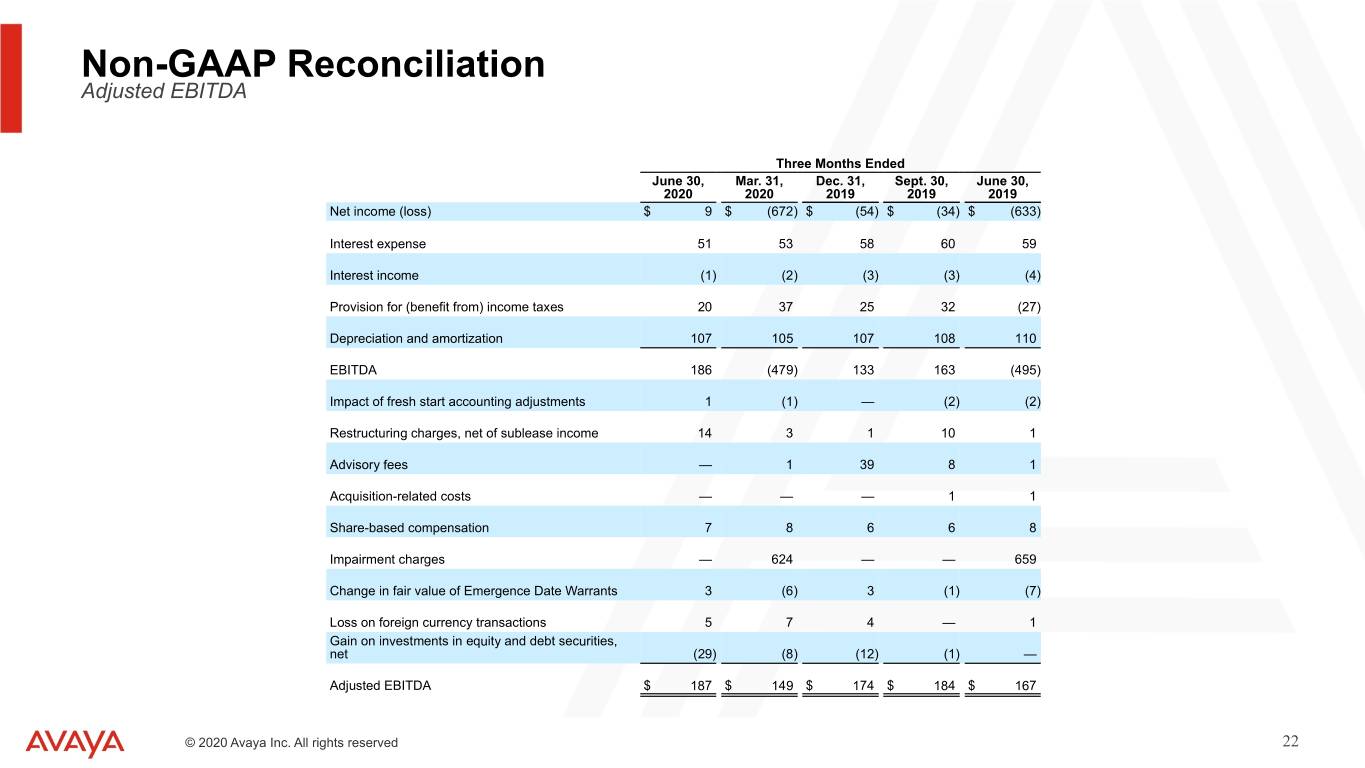
TEXT 0 – 0 – 0 204-0-0 127-127-127 17-114-210 80-200-74 86-183-242 247-150-70 Non-GAAP Reconciliation Adjusted EBITDA Three Months Ended June 30, Mar. 31, Dec. 31, Sept. 30, June 30, 2020 2020 2019 2019 2019 Net income (loss) $ 9 $ (672) $ (54) $ (34) $ (633) Interest expense 51 53 58 60 59 Interest income (1) (2) (3) (3) (4) Provision for (benefit from) income taxes 20 37 25 32 (27) Depreciation and amortization 107 105 107 108 110 EBITDA 186 (479) 133 163 (495) Impact of fresh start accounting adjustments 1 (1) — (2) (2) Restructuring charges, net of sublease income 14 3 1 10 1 Advisory fees — 1 39 8 1 Acquisition-related costs — — — 1 1 Share-based compensation 7 8 6 6 8 Impairment charges — 624 — — 659 Change in fair value of Emergence Date Warrants 3 (6) 3 (1) (7) Loss on foreign currency transactions 5 7 4 — 1 Gain on investments in equity and debt securities, net (29) (8) (12) (1) — Adjusted EBITDA $ 187 $ 149 $ 174 $ 184 $ 167 © 2020 Avaya Inc. All rights reserved 22
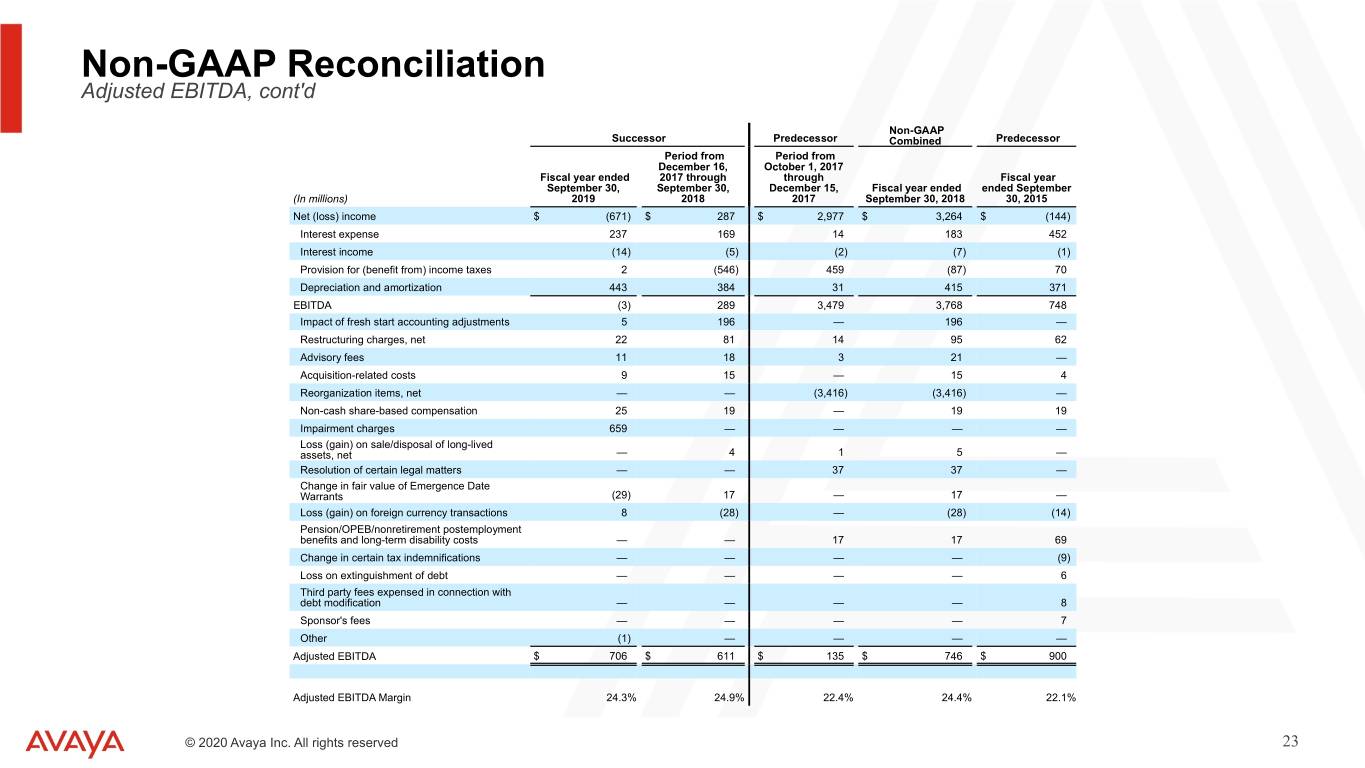
TEXT 0 – 0 – 0 204-0-0 127-127-127 17-114-210 80-200-74 86-183-242 247-150-70 Non-GAAP Reconciliation Adjusted EBITDA, cont'd Non-GAAP Successor Predecessor Combined Predecessor Period from Period from December 16, October 1, 2017 Fiscal year ended 2017 through through Fiscal year September 30, September 30, December 15, Fiscal year ended ended September (In millions) 2019 2018 2017 September 30, 2018 30, 2015 Net (loss) income $ (671) $ 287 $ 2,977 $ 3,264 $ (144) Interest expense 237 169 14 183 452 Interest income (14) (5) (2) (7) (1) Provision for (benefit from) income taxes 2 (546) 459 (87) 70 Depreciation and amortization 443 384 31 415 371 EBITDA (3) 289 3,479 3,768 748 Impact of fresh start accounting adjustments 5 196 — 196 — Restructuring charges, net 22 81 14 95 62 Advisory fees 11 18 3 21 — Acquisition-related costs 9 15 — 15 4 Reorganization items, net — — (3,416) (3,416) — Non-cash share-based compensation 25 19 — 19 19 Impairment charges 659 — — — — Loss (gain) on sale/disposal of long-lived assets, net — 4 1 5 — Resolution of certain legal matters — — 37 37 — Change in fair value of Emergence Date Warrants (29) 17 — 17 — Loss (gain) on foreign currency transactions 8 (28) — (28) (14) Pension/OPEB/nonretirement postemployment benefits and long-term disability costs — — 17 17 69 Change in certain tax indemnifications — — — — (9) Loss on extinguishment of debt — — — — 6 Third party fees expensed in connection with debt modification — — — — 8 Sponsor's fees — — — — 7 Other (1) — — — — Adjusted EBITDA $ 706 $ 611 $ 135 $ 746 $ 900 Adjusted EBITDA Margin 24.3% 24.9% 22.4% 24.4% 22.1% © 2020 Avaya Inc. All rights reserved 23
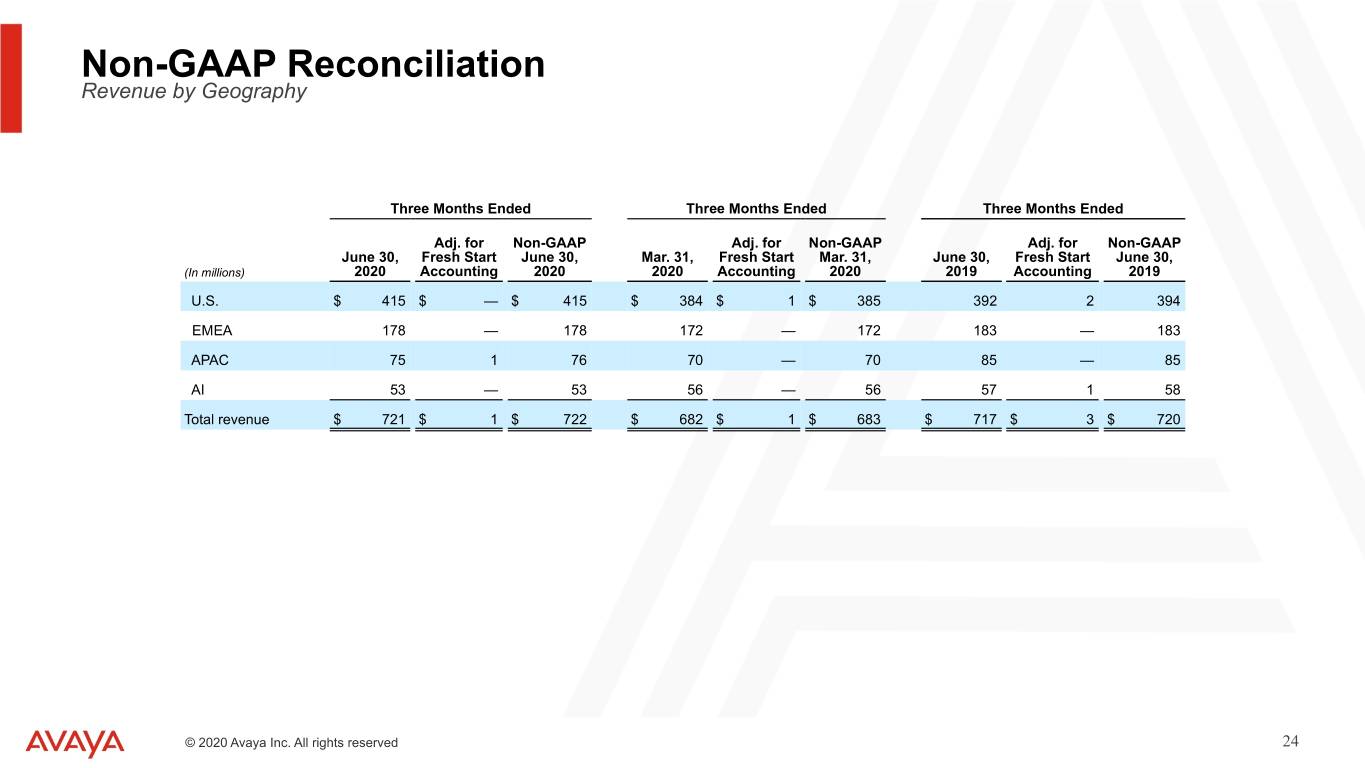
TEXT 0 – 0 – 0 204-0-0 127-127-127 17-114-210 80-200-74 86-183-242 247-150-70 Non-GAAP Reconciliation Revenue by Geography Three Months Ended Three Months Ended Three Months Ended Adj. for Non-GAAP Adj. for Non-GAAP Adj. for Non-GAAP June 30, Fresh Start June 30, Mar. 31, Fresh Start Mar. 31, June 30, Fresh Start June 30, (In millions) 2020 Accounting 2020 2020 Accounting 2020 2019 Accounting 2019 U.S. $ 415 $ — $ 415 $ 384 $ 1 $ 385 392 2 394 EMEA 178 — 178 172 — 172 183 — 183 APAC 75 1 76 70 — 70 85 — 85 AI 53 — 53 56 — 56 57 1 58 Total revenue $ 721 $ 1 $ 722 $ 682 $ 1 $ 683 $ 717 $ 3 $ 720 © 2020 Avaya Inc. All rights reserved 24
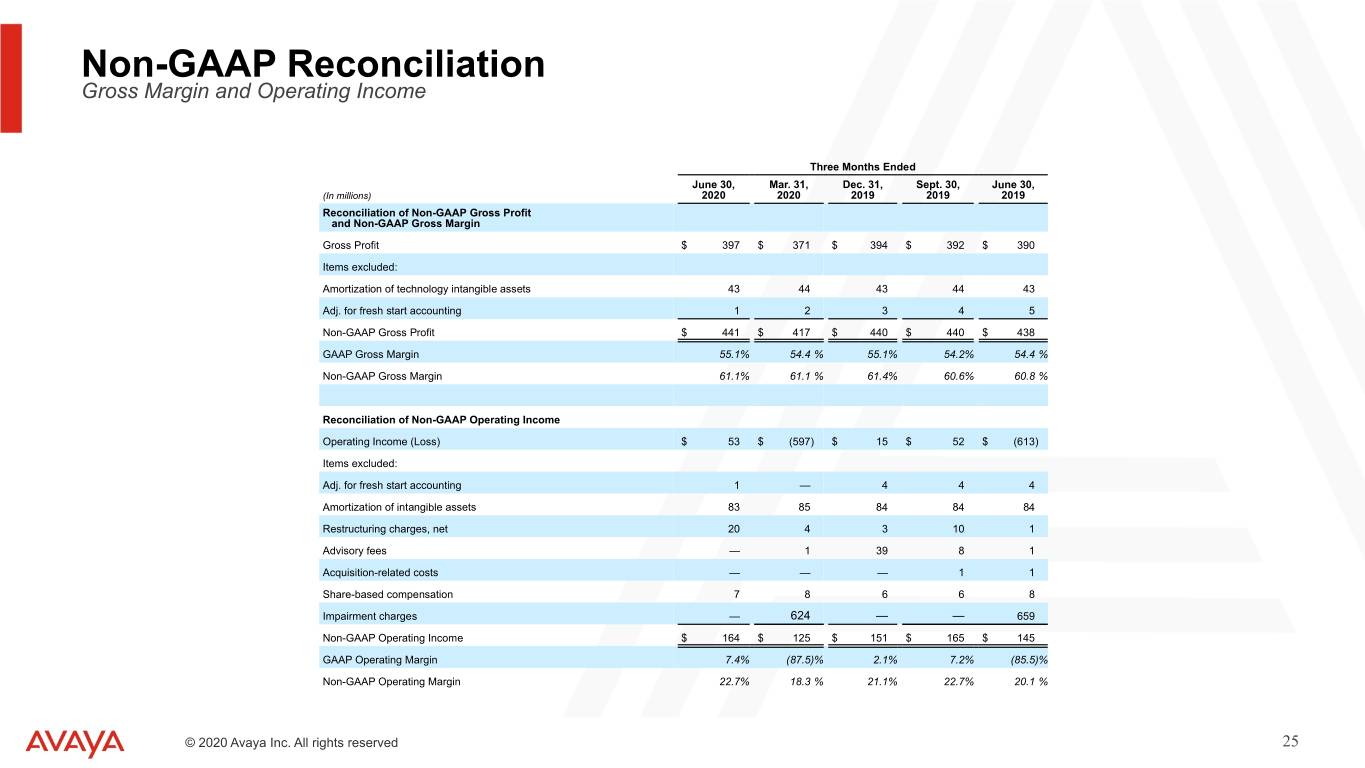
TEXT 0 – 0 – 0 204-0-0 127-127-127 17-114-210 80-200-74 86-183-242 247-150-70 Non-GAAP Reconciliation Gross Margin and Operating Income Three Months Ended June 30, Mar. 31, Dec. 31, Sept. 30, June 30, (In millions) 2020 2020 2019 2019 2019 Reconciliation of Non-GAAP Gross Profit and Non-GAAP Gross Margin Gross Profit $ 397 $ 371 $ 394 $ 392 $ 390 Items excluded: Amortization of technology intangible assets 43 44 43 44 43 Adj. for fresh start accounting 1 2 3 4 5 Non-GAAP Gross Profit $ 441 $ 417 $ 440 $ 440 $ 438 GAAP Gross Margin 55.1% 54.4 % 55.1% 54.2% 54.4 % Non-GAAP Gross Margin 61.1% 61.1 % 61.4% 60.6% 60.8 % Reconciliation of Non-GAAP Operating Income Operating Income (Loss) $ 53 $ (597) $ 15 $ 52 $ (613) Items excluded: Adj. for fresh start accounting 1 — 4 4 4 Amortization of intangible assets 83 85 84 84 84 Restructuring charges, net 20 4 3 10 1 Advisory fees — 1 39 8 1 Acquisition-related costs — — — 1 1 Share-based compensation 7 8 6 6 8 Impairment charges — 624 — — 659 Non-GAAP Operating Income $ 164 $ 125 $ 151 $ 165 $ 145 GAAP Operating Margin 7.4% (87.5)% 2.1% 7.2% (85.5)% Non-GAAP Operating Margin 22.7% 18.3 % 21.1% 22.7% 20.1 % © 2020 Avaya Inc. All rights reserved 25
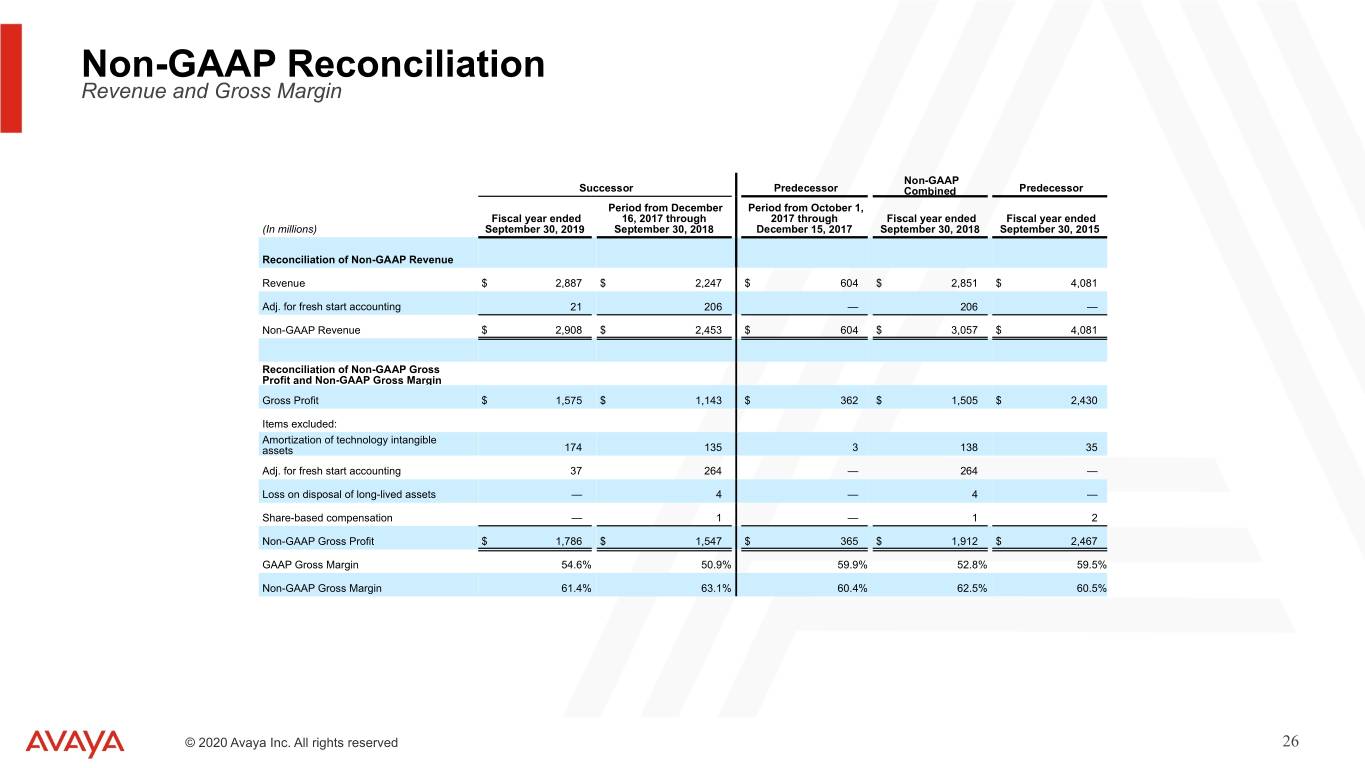
TEXT 0 – 0 – 0 204-0-0 127-127-127 17-114-210 80-200-74 86-183-242 247-150-70 Non-GAAP Reconciliation Revenue and Gross Margin Non-GAAP Successor Predecessor Combined Predecessor Period from December Period from October 1, Fiscal year ended 16, 2017 through 2017 through Fiscal year ended Fiscal year ended (In millions) September 30, 2019 September 30, 2018 December 15, 2017 September 30, 2018 September 30, 2015 Reconciliation of Non-GAAP Revenue Revenue $ 2,887 $ 2,247 $ 604 $ 2,851 $ 4,081 Adj. for fresh start accounting 21 206 — 206 — Non-GAAP Revenue $ 2,908 $ 2,453 $ 604 $ 3,057 $ 4,081 Reconciliation of Non-GAAP Gross Profit and Non-GAAP Gross Margin Gross Profit $ 1,575 $ 1,143 $ 362 $ 1,505 $ 2,430 Items excluded: Amortization of technology intangible assets 174 135 3 138 35 Adj. for fresh start accounting 37 264 — 264 — Loss on disposal of long-lived assets — 4 — 4 — Share-based compensation — 1 — 1 2 Non-GAAP Gross Profit $ 1,786 $ 1,547 $ 365 $ 1,912 $ 2,467 GAAP Gross Margin 54.6% 50.9% 59.9% 52.8% 59.5% Non-GAAP Gross Margin 61.4% 63.1% 60.4% 62.5% 60.5% © 2020 Avaya Inc. All rights reserved 26
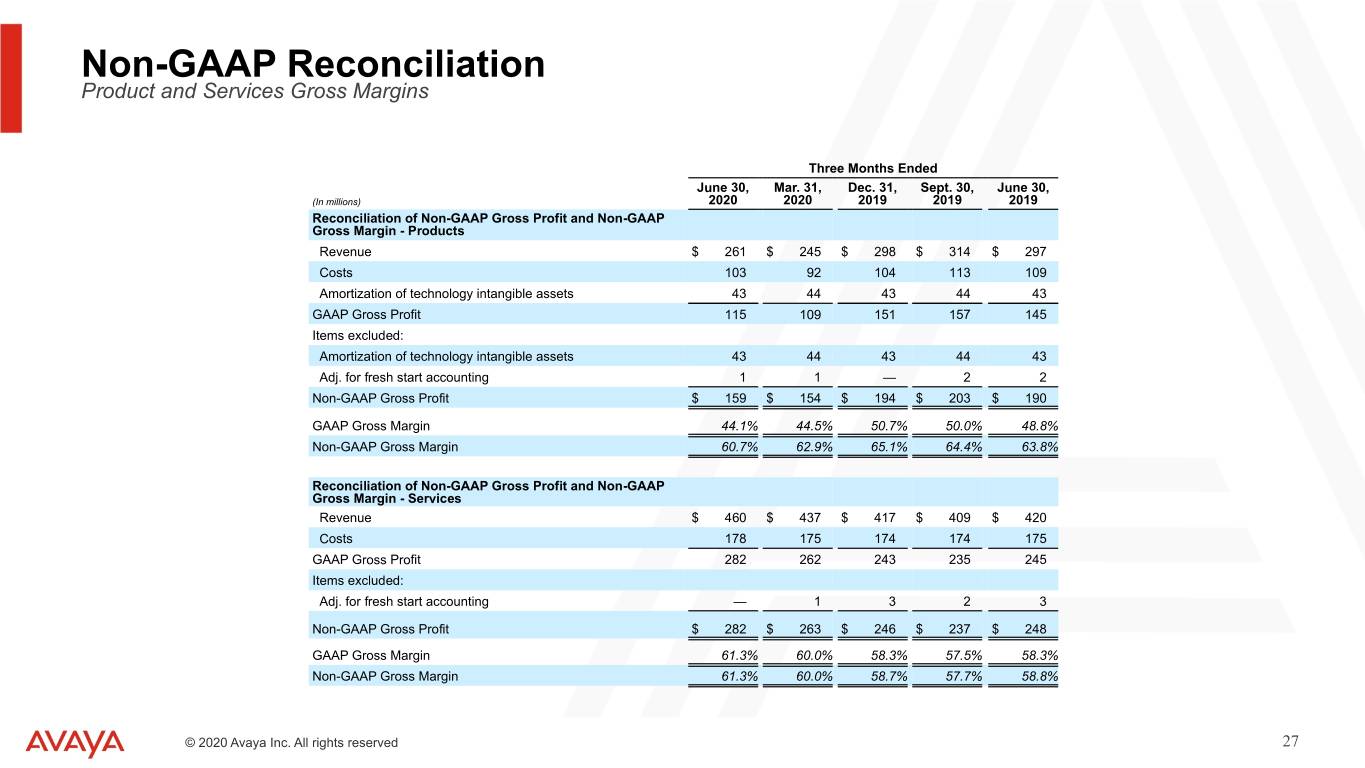
TEXT 0 – 0 – 0 204-0-0 127-127-127 17-114-210 80-200-74 86-183-242 247-150-70 Non-GAAP Reconciliation Product and Services Gross Margins Three Months Ended June 30, Mar. 31, Dec. 31, Sept. 30, June 30, (In millions) 2020 2020 2019 2019 2019 Reconciliation of Non-GAAP Gross Profit and Non-GAAP Gross Margin - Products Revenue $ 261 $ 245 $ 298 $ 314 $ 297 Costs 103 92 104 113 109 Amortization of technology intangible assets 43 44 43 44 43 GAAP Gross Profit 115 109 151 157 145 Items excluded: Amortization of technology intangible assets 43 44 43 44 43 Adj. for fresh start accounting 1 1 — 2 2 Non-GAAP Gross Profit $ 159 $ 154 $ 194 $ 203 $ 190 GAAP Gross Margin 44.1% 44.5% 50.7% 50.0% 48.8% Non-GAAP Gross Margin 60.7% 62.9% 65.1% 64.4% 63.8% Reconciliation of Non-GAAP Gross Profit and Non-GAAP Gross Margin - Services Revenue $ 460 $ 437 $ 417 $ 409 $ 420 Costs 178 175 174 174 175 GAAP Gross Profit 282 262 243 235 245 Items excluded: Adj. for fresh start accounting — 1 3 2 3 Non-GAAP Gross Profit $ 282 $ 263 $ 246 $ 237 $ 248 GAAP Gross Margin 61.3% 60.0% 58.3% 57.5% 58.3% Non-GAAP Gross Margin 61.3% 60.0% 58.7% 57.7% 58.8% © 2020 Avaya Inc. All rights reserved 27
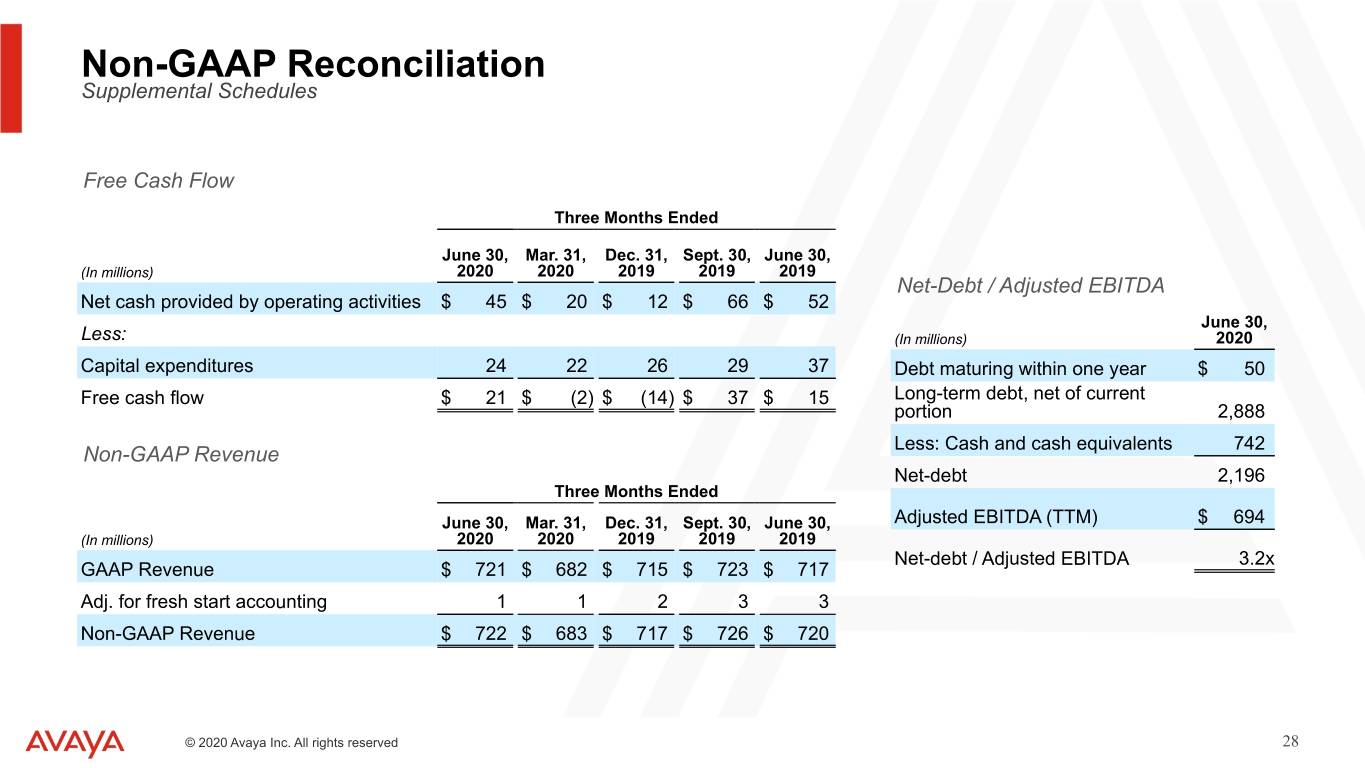
TEXT 0 – 0 – 0 204-0-0 127-127-127 17-114-210 80-200-74 86-183-242 247-150-70 Non-GAAP Reconciliation Supplemental Schedules Free Cash Flow Three Months Ended June 30, Mar. 31, Dec. 31, Sept. 30, June 30, (In millions) 2020 2020 2019 2019 2019 Net-Debt / Adjusted EBITDA Net cash provided by operating activities $ 45 $ 20 $ 12 $ 66 $ 52 June 30, Less: (In millions) 2020 Capital expenditures 24 22 26 29 37 Debt maturing within one year $ 50 Free cash flow $ 21 $ (2) $ (14) $ 37 $ 15 Long-term debt, net of current portion 2,888 Less: Cash and cash equivalents 742 Non-GAAP Revenue Net-debt 2,196 Three Months Ended June 30, Mar. 31, Dec. 31, Sept. 30, June 30, Adjusted EBITDA (TTM) $ 694 (In millions) 2020 2020 2019 2019 2019 Net-debt / Adjusted EBITDA 3.2x GAAP Revenue $ 721 $ 682 $ 715 $ 723 $ 717 Adj. for fresh start accounting 1 1 2 3 3 Non-GAAP Revenue $ 722 $ 683 $ 717 $ 726 $ 720 © 2020 Avaya Inc. All rights reserved 28
