Attached files
| file | filename |
|---|---|
| EX-32.1 - EXHIBIT 32.1 - Watford Holdings Ltd. | exhibit321q2202010q.htm |
| EX-32.2 - EXHIBIT 32.2 - Watford Holdings Ltd. | exhibit322q2202010q.htm |
| EX-31.2 - EXHIBIT 31.2 - Watford Holdings Ltd. | exhibit312q2202010q.htm |
| EX-31.1 - EXHIBIT 31.1 - Watford Holdings Ltd. | exhibit311q2202010q.htm |
| EX-10.2 - EXHIBIT 10.2 - Watford Holdings Ltd. | exhibit102q2202010q.htm |
| EX-10.1 - EXHIBIT 10.1 - Watford Holdings Ltd. | exhibit101q2202010q.htm |
UNITED STATES
SECURITIES AND EXCHANGE COMMISSION
Washington, D.C. 20549
FORM 10-Q
☒ QUARTERLY REPORT PURSUANT TO SECTION 13 OR 15(d) OF THE SECURITIES EXCHANGE ACT OF 1934
For the quarterly period ended June 30, 2020
OR
☐ TRANSITION REPORT PURSUANT TO SECTION 13 OR 15(d) OF THE SECURITIES EXCHANGE ACT OF 1934
Commission file number: 001-38788

Watford Holdings Ltd.
(Exact Name of Registrant as Specified in its Charter)
Bermuda (State or other jurisdiction of incorporation or organization) | 98-1155442 (I.R.S. Employer Identification Number) |
Waterloo House, 1st Floor 100 Pitts Bay Road, Pembroke HM 08, Bermuda (Address of principal executive offices) | (441) 278-3455 (Registrant’s telephone number, including area code) |
Indicate by check mark whether the registrant (1) has filed all reports required to be filed by Section 13 or 15(d) of the Exchange Act during the preceding 12 months (or for such shorter period that the registrant was required to file such reports), and (2) has been subject to such filing requirements for the past 90 days. Yes ☒ No ☐
Indicate by check mark whether the registrant has submitted electronically every Interactive Data File required to be submitted pursuant to Rule 405 of Regulation S-T (§232.405 of this chapter) during the preceding 12 months (or for such shorter period that the registrant was required to submit such files). Yes ☒ No ☐
Indicate by check mark whether the registrant is a large accelerated filer, an accelerated filer, a non-accelerated filer, smaller reporting company, or an emerging growth company. See the definitions of “large accelerated filer,” “accelerated filer,” “smaller reporting company,” and “emerging growth company” in Rule 12b-2 of the Exchange Act.
Large accelerated filer ☐ | Accelerated filer ☐ | Non-accelerated filer ☒ | Smaller reporting company ☐ | Emerging growth company ☒ |
If an emerging growth company, indicate by check mark if the registrant has elected not to use the extended transition period for complying with any new or revised financial accounting standards provided pursuant to Section 13(a) of the Exchange Act. ☒
Indicate by check mark whether the registrant is a shell company (as defined in Rule 12b-2 of the Exchange Act). Yes ☐ No ☒
Securities registered pursuant to Section 12(b) of the Act:
Title of each class | Trading Symbol(s) | Name of each exchange on which registered | ||
Common Shares | WTRE | Nasdaq Global Select Market | ||
8½% Cumulative Redeemable Preference Shares | WTREP | Nasdaq Global Select Market | ||
As of August 7, 2020, there were 19,886,979 common shares, $0.01 par value per share, of the registrant outstanding.
Watford Holdings Ltd. | ||
Index to Form 10-Q | ||
Page | ||
Part I. | ||
Item 1. | ||
Item 2. | ||
Item 3. | ||
Item 4. | ||
Part II. | ||
Item 1. | ||
Item 1A. | ||
Item 2. | ||
Item 3. | ||
Item 4. | ||
Item 5. | ||
Item 6. | ||
1
Explanatory note - Certain defined terms
Unless the context suggests otherwise, any reference in this report to:
• | “ACGL” refers to Arch Capital Group Ltd. and its controlled subsidiaries; |
• | “Arch” refers to any one or more of the following direct or indirect subsidiaries of ACGL, as applicable in the context in which such term appears: |
• | Arch Investment Management Ltd., or AIM, which manages the majority of our investment grade portfolio; |
• | Arch Reinsurance Company, or ARC, which is a party to certain quota share agreements with one or more of our operating subsidiaries and a services agreement with Watford Holdings (U.S.) Inc.; |
• | Arch Reinsurance Ltd., or ARL, which is a party to certain quota share agreements with one or more of our operating subsidiaries and owned approximately 12.6% of our outstanding common shares as of June 30, 2020; |
• | Arch Underwriters Inc., or AUI, which manages the underwriting business of our U.S. operating subsidiaries; |
• | Arch Underwriters Ltd., or AUL, which manages the underwriting business of our non-U.S. operating subsidiaries, including Watford Re; |
• | “HPS” refers to HPS Investment Partners, LLC (formerly known as Highbridge Principal Strategies, LLC), which manages our non-investment grade portfolio, as well as accounts in our investment grade portfolio; |
• | our “Investment Managers” refers to AIM, HPS or any other investment managers that manage our investment grade portfolio or our non-investment grade portfolio from time to time; |
• | “Watford,” “we,” “us” and “our” refers to Watford Holdings Ltd. and its subsidiaries; |
• | “Watford Holdings” refers to our company, Watford Holdings Ltd., a Bermuda exempted company; |
• | “Watford Re” refers to Watford Re Ltd., a Bermuda domiciled insurance company and a wholly-owned subsidiary of our company; |
• | “Watford Trust” refers to Watford Asset Trust I, a statutory trust organized under the laws of the State of Delaware; |
• | “WIC” refers to Watford Insurance Company, a New Jersey domiciled insurance company and a wholly-owned subsidiary of our company; |
• | “WICE” refers to Watford Insurance Company Europe Limited, a Gibraltar domiciled insurance company and a wholly-owned subsidiary of our company; and |
• | “WSIC” refers to Watford Specialty Insurance Company, a New Jersey domiciled insurance company and a wholly-owned subsidiary of our company. |
2
Part I. Financial information
Cautionary note regarding forward-looking statements
The Private Securities Litigation Reform Act of 1995 (or the PSLRA) provides a “safe harbor” for forward-looking statements. This report contains forward-looking statements that are intended to enhance the reader’s ability to assess our future financial and business performance. These statements are based on the beliefs and assumptions of our management, and are subject to risks and uncertainties. Generally, statements that are not about historical facts, including statements concerning our possible or assumed future actions or results of operations are forward-looking statements. Forward-looking statements include, but are not limited to, statements that represent our beliefs, expectations or estimates concerning future operations, strategies, financial results or performance, financings, investments, acquisitions, expenditures or other developments and anticipated trends and competition in the markets in which we operate. Forward-looking statements, for purposes of the PSLRA or otherwise, can also be identified by the use of forward-looking terminology such as “may,” “believes,” “intends,” “anticipates,” “plans,” “estimates,” “expects,” “should” or similar expressions.
Forward-looking statements involve our current assessment of risks and uncertainties. Actual events and results may differ materially from those expressed or implied in these statements. Important factors that could cause actual events or results to differ materially from those indicated in such statements are discussed below and elsewhere in this report and in our other reports and other documents filed with the Securities and Exchange Commission, or the SEC, and include:
• | our limited operating history; |
• | fluctuations in the results of our operations; |
• | our ability to compete successfully with more established competitors; |
• | our losses exceeding our reserves; |
• | downgrades, potential downgrades or other negative actions by rating agencies, including the recent announcements by A.M. Best Company, or A.M. Best, that it has placed under review with negative implications our financial strength and credit ratings and Kroll Bond Rating Agency, or KBRA, that it has revised the outlook of our financial strength and credit ratings to negative; |
• | our dependence on key executives and inability to attract qualified personnel, or the potential loss of suitably qualified personnel as a result of Bermuda employment and immigration restrictions; |
• | our dependence on letter of credit facilities and borrowing facilities that may not be available on commercially acceptable terms; |
• | our potential inability to pay dividends or distributions; |
• | our potential need for additional capital in the future and the potential unavailability of such capital to us on favorable terms or at all; |
• | our dependence on clients’ evaluations of risks associated with such clients’ insurance underwriting; |
• | the suspension or revocation of our subsidiaries’ insurance licenses; |
• | Watford Holdings potentially being deemed an investment company under U.S. federal securities law; |
3
• | the potential characterization of us and/or any of our subsidiaries as a passive foreign investment company, or PFIC; |
• | our dependence on Arch for services critical to our underwriting operations; |
• | changes to our strategic relationship with Arch or the termination by Arch of any of our services agreements or quota share agreements; |
• | our dependence on HPS and AIM to implement our investment strategy; |
• | the termination by HPS or AIM of any of our investment management agreements; |
• | risks associated with our investment strategy being greater than those faced by competitors; |
• | changes in the regulatory environment; |
• | our potentially becoming subject to U.S. federal income taxation; |
• | our potentially becoming subject to U.S. withholding and information reporting requirements under the U.S. Foreign Account Tax Compliance Act, or FATCA, provisions; |
• | our ability to complete acquisitions and integrate businesses successfully; |
• | adverse general, societal, economic and market conditions, including those caused by pandemics, including the current global pandemic related to the novel coronavirus, or COVID-19, and government actions in response thereto; and |
• | the other matters set forth under Item 1A “Risk factors,” Item 7 “Management’s discussion and analysis of financial condition and results of operations,” and other sections of the Company’s Annual Report on Form 10-K for the year ended December 31, 2019, Part II Item 1A “Risk factors” and Part I Item 2 “Management’s discussion and analysis of financial condition and results of operations” of this Quarterly Report on Form 10-Q as well as the other factors set forth in the Company’s other documents on file with the SEC, and management’s response to any of the aforementioned factors. |
Consequently, such forward-looking statements should be regarded solely as our current plans, estimates or belief as of the date of this report. All subsequent forward-looking statements attributable to us or persons acting on our behalf are expressly qualified in their entirety by these cautionary statements. The foregoing review of important factors should not be construed as exhaustive and should be read in conjunction with other cautionary statements that are included herein or elsewhere. We do not intend, and do not undertake, any obligation to update any forward-looking statements to reflect future events or circumstances after the date of this report.
4
Item 1. Consolidated financial statements
Page | |
June 30, 2020 (unaudited) and December 31, 2019 | |
For the three and six months ended June 30, 2020 and 2019 (unaudited) | |
For the three and six months ended June 30, 2020 and 2019 (unaudited) | |
For the three and six months ended June 30, 2020 and 2019 (unaudited) | |
For the six months ended June 30, 2020 and 2019 (unaudited) | |
Notes to the Consolidated Financial Statements (unaudited) | |
5
WATFORD HOLDINGS LTD.
CONSOLIDATED BALANCE SHEETS
(U.S. dollars in thousands, except share data)
(Unaudited) | |||||||
June 30, | December 31, | ||||||
2020 | 2019 | ||||||
Assets | |||||||
Investments: | |||||||
Term loans, fair value option (Amortized cost: $991,130 and $1,113,212) | $ | 875,560 | $ | 1,061,934 | |||
Fixed maturities, fair value option (Amortized cost: $611,265 and $432,576) | 548,010 | 416,594 | |||||
Short-term investments, fair value option (Cost: $370,976 and $325,542) | 370,066 | 329,303 | |||||
Equity securities, fair value option | 58,898 | 59,799 | |||||
Other investments, fair value option (1) | 34,142 | 30,461 | |||||
Investments, fair value option | 1,886,676 | 1,898,091 | |||||
Fixed maturities, available for sale (Amortized cost: $698,897 and $739,456) | 690,225 | 745,708 | |||||
Equity securities, fair value through net income | 62,444 | 65,338 | |||||
Total investments (1) | 2,639,345 | 2,709,137 | |||||
Cash and cash equivalents | 107,653 | 102,437 | |||||
Accrued investment income | 14,364 | 14,025 | |||||
Premiums receivable (1) | 258,178 | 273,657 | |||||
Reinsurance recoverable on unpaid and paid losses and loss adjustment expenses (1) | 229,746 | 170,974 | |||||
Prepaid reinsurance premiums (1) | 131,919 | 132,577 | |||||
Deferred acquisition costs, net (1) | 64,149 | 64,044 | |||||
Receivable for securities sold | 31,314 | 16,288 | |||||
Intangible assets | 7,650 | 7,650 | |||||
Funds held by reinsurers (1) | 41,112 | 42,505 | |||||
Other assets | 22,328 | 17,562 | |||||
Total assets | $ | 3,547,758 | $ | 3,550,856 | |||
Liabilities | |||||||
Reserve for losses and loss adjustment expenses (1) | $ | 1,353,049 | $ | 1,263,628 | |||
Unearned premiums (1) | 456,170 | 438,907 | |||||
Losses payable (1) | 58,292 | 61,314 | |||||
Reinsurance balances payable (1) | 72,776 | 77,066 | |||||
Payable for securities purchased | 67,272 | 18,180 | |||||
Payable for securities sold short | 29,289 | 66,257 | |||||
Revolving credit agreement borrowings | 472,361 | 484,287 | |||||
Senior notes (1) | 172,554 | 172,418 | |||||
Amounts due to affiliates (1) | 4,542 | 4,467 | |||||
Investment management and performance fees payable (1) | 5,511 | 17,762 | |||||
Other liabilities (1) | 27,440 | 21,912 | |||||
Total liabilities | $ | 2,719,256 | $ | 2,626,198 | |||
Commitments and contingencies | |||||||
Contingently redeemable preference shares (1) | 52,351 | 52,305 | |||||
Shareholders’ equity | |||||||
Common shares ($0.01 par; shares authorized: 120 million; shares issued: 22,804,128 and 22,692,300) | 227 | 227 | |||||
Additional paid-in capital | 898,935 | 898,083 | |||||
Retained earnings (deficit) | (35,909 | ) | 43,470 | ||||
Accumulated other comprehensive income (loss) | (9,179 | ) | 5,629 | ||||
Common shares held in treasury, at cost (shares: 2,917,149 and 2,789,405) | (77,923 | ) | (75,056 | ) | |||
Total shareholders’ equity | 776,151 | 872,353 | |||||
Total liabilities, contingently redeemable preference shares and shareholders’ equity | $ | 3,547,758 | $ | 3,550,856 | |||
(1) See Note 12, “Transactions with related parties” for disclosure of related party amounts.
6
WATFORD HOLDINGS LTD.
CONSOLIDATED STATEMENTS OF INCOME (LOSS)
(U.S. dollars in thousands, except share and per share data)
(Unaudited) | (Unaudited) | ||||||||||||||
Three Months Ended June 30, | Six Months Ended June 30, | ||||||||||||||
2020 | 2019 | 2020 | 2019 | ||||||||||||
Revenues | |||||||||||||||
Gross premiums written (1) | $ | 157,927 | $ | 161,978 | $ | 392,829 | $ | 348,667 | |||||||
Gross premiums ceded (1) | (52,071 | ) | (42,608 | ) | (100,273 | ) | (83,910 | ) | |||||||
Net premiums written | 105,856 | 119,370 | 292,556 | 264,757 | |||||||||||
Change in unearned premiums (1) | 25,679 | 31,948 | (20,982 | ) | 32,655 | ||||||||||
Net premiums earned (1) | 131,535 | 151,318 | 271,574 | 297,412 | |||||||||||
Other underwriting income (loss) | 868 | 673 | 1,001 | 1,265 | |||||||||||
Interest income | 36,453 | 38,596 | 74,277 | 81,737 | |||||||||||
Investment management fees - related parties (1) | (4,262 | ) | (4,570 | ) | (8,614 | ) | (8,979 | ) | |||||||
Borrowing and miscellaneous other investment expenses | (4,763 | ) | (7,611 | ) | (10,432 | ) | (15,909 | ) | |||||||
Net interest income | 27,428 | 26,415 | 55,231 | 56,849 | |||||||||||
Realized and unrealized gains (losses) on investments | 172,063 | (936 | ) | (118,439 | ) | 32,784 | |||||||||
Investment performance fees - related parties (1) | — | (1,692 | ) | — | (7,492 | ) | |||||||||
Net investment income (loss) | 199,491 | 23,787 | (63,208 | ) | 82,141 | ||||||||||
Total revenues | 331,894 | 175,778 | 209,367 | 380,818 | |||||||||||
Expenses | |||||||||||||||
Loss and loss adjustment expenses (1) | (104,786 | ) | (111,416 | ) | (215,462 | ) | (222,266 | ) | |||||||
Acquisition expenses (1) | (29,486 | ) | (35,417 | ) | (57,853 | ) | (69,391 | ) | |||||||
General and administrative expenses (1) | (7,841 | ) | (9,751 | ) | (14,980 | ) | (16,991 | ) | |||||||
Interest expense (1) | (2,911 | ) | — | (5,823 | ) | — | |||||||||
Net foreign exchange gains (losses) | 2,665 | (441 | ) | 7,678 | (878 | ) | |||||||||
Total expenses | (142,359 | ) | (157,025 | ) | (286,440 | ) | (309,526 | ) | |||||||
Income (loss) before income taxes | 189,535 | 18,753 | (77,073 | ) | 71,292 | ||||||||||
Income tax benefit (expense) | 402 | (20 | ) | 402 | (20 | ) | |||||||||
Net income (loss) before preference dividends | 189,937 | 18,733 | (76,671 | ) | 71,272 | ||||||||||
Preference dividends (1) | (1,109 | ) | (4,908 | ) | (2,280 | ) | (9,815 | ) | |||||||
Net income (loss) available to common shareholders | $ | 188,828 | $ | 13,825 | $ | (78,951 | ) | $ | 61,457 | ||||||
Earnings (loss) per common share: | |||||||||||||||
Basic and diluted | $ | 9.51 | $ | 0.61 | $ | (3.97 | ) | $ | 2.71 | ||||||
Weighted average number of common shares used in the determination of earnings (loss) per share: | |||||||||||||||
Basic | 19,863,048 | 22,740,762 | 19,907,490 | 22,711,833 | |||||||||||
Diluted | 19,863,048 | 22,747,033 | 19,907,490 | 22,714,969 | |||||||||||
(1) See Note 12, “Transactions with related parties” for disclosure of related party amounts.
See Notes to Consolidated Financial Statements
7
WATFORD HOLDINGS LTD.
CONSOLIDATED STATEMENTS OF COMPREHENSIVE INCOME (LOSS)
(U.S. dollars in thousands)
(Unaudited) | (Unaudited) | ||||||||||||||
Three Months Ended June 30, | Six Months Ended June 30, | ||||||||||||||
2020 | 2019 | 2020 | 2019 | ||||||||||||
Comprehensive income (loss) | |||||||||||||||
Net income (loss) available to common shareholders | $ | 188,828 | $ | 13,825 | $ | (78,951 | ) | $ | 61,457 | ||||||
Other comprehensive income (loss) net of income tax: | |||||||||||||||
Available for sale investments: | |||||||||||||||
Unrealized holding gains (losses) arising during the period | 31,240 | 6,532 | 2,809 | 10,613 | |||||||||||
Unrealized foreign currency gains (losses) arising during the period | 279 | (1,678 | ) | (7,420 | ) | (548 | ) | ||||||||
Credit loss recognized in net income (loss) | (212 | ) | — | 351 | — | ||||||||||
Reclassification of net realized (gains) losses, included in net income (loss) | (8,331 | ) | (1,816 | ) | (10,736 | ) | (2,211 | ) | |||||||
Unrealized holding gains (losses) of available for sale investments | 22,976 | 3,038 | (14,996 | ) | 7,854 | ||||||||||
Foreign currency translation adjustments | 51 | 212 | 188 | 47 | |||||||||||
Other comprehensive income (loss) net of income tax | 23,027 | 3,250 | (14,808 | ) | 7,901 | ||||||||||
Comprehensive income (loss) | $ | 211,855 | $ | 17,075 | $ | (93,759 | ) | $ | 69,358 | ||||||
See Notes to Consolidated Financial Statements
8
WATFORD HOLDINGS LTD.
CONSOLIDATED STATEMENTS OF CHANGES IN SHAREHOLDERS’ EQUITY
(U.S. dollars in thousands)
(Unaudited) | (Unaudited) | ||||||||||||||
Three Months Ended June 30, | Six Months Ended June 30, | ||||||||||||||
2020 | 2019 | 2020 | 2019 | ||||||||||||
Common shares | |||||||||||||||
Balance at beginning of period | $ | 227 | $ | 227 | $ | 227 | $ | 227 | |||||||
Common shares issued | — | — | — | — | |||||||||||
Balance at end of period | 227 | 227 | 227 | 227 | |||||||||||
Additional paid-in capital | |||||||||||||||
Balance at beginning of period | 898,693 | 895,386 | 898,083 | 895,386 | |||||||||||
Common shares issued under share plans | 241 | 250 | 491 | 250 | |||||||||||
Share-based compensation | 1 | 2,080 | 361 | 2,080 | |||||||||||
Balance at end of period | 898,935 | 897,716 | 898,935 | 897,716 | |||||||||||
Accumulated other comprehensive income (loss) | |||||||||||||||
Balance at beginning of period | (32,206 | ) | (79 | ) | 5,629 | (4,730 | ) | ||||||||
Unrealized holding gains (losses) of available for sale investments: | |||||||||||||||
Balance at beginning of period | (31,720 | ) | 658 | 6,252 | (4,158 | ) | |||||||||
Unrealized holding gains (losses) of available for sale investments, net of reclassification adjustments | 22,976 | 3,038 | (14,996 | ) | 7,854 | ||||||||||
Balance at end of period | (8,744 | ) | 3,696 | (8,744 | ) | 3,696 | |||||||||
Currency translation adjustment: | |||||||||||||||
Balance at beginning of period | (486 | ) | (737 | ) | (623 | ) | (572 | ) | |||||||
Currency translation adjustment | 51 | 212 | 188 | 47 | |||||||||||
Balance at end of period | (435 | ) | (525 | ) | (435 | ) | (525 | ) | |||||||
Balance at end of period | (9,179 | ) | 3,171 | (9,179 | ) | 3,171 | |||||||||
Common shares held in treasury, at cost | |||||||||||||||
Balance at beginning of period | (77,923 | ) | — | (75,056 | ) | — | |||||||||
Shares repurchased for treasury | — | — | (2,867 | ) | — | ||||||||||
Balance at end of period | (77,923 | ) | — | (77,923 | ) | — | |||||||||
Retained earnings (deficit) | |||||||||||||||
Balance at beginning of period | (224,737 | ) | 46,357 | 43,470 | (1,275 | ) | |||||||||
Cumulative effect of adoption of updated accounting guidance for credit losses at January 1, 2020 | — | — | (428 | ) | — | ||||||||||
Net income (loss) before preference dividends | 189,937 | 18,733 | (76,671 | ) | 71,272 | ||||||||||
Preference share dividends paid and accrued | (1,109 | ) | (4,908 | ) | (2,280 | ) | (9,815 | ) | |||||||
Balance at end of period | (35,909 | ) | 60,182 | (35,909 | ) | 60,182 | |||||||||
Total shareholders’ equity | $ | 776,151 | $ | 961,296 | $ | 776,151 | $ | 961,296 | |||||||
See Notes to Consolidated Financial Statements
9
WATFORD HOLDINGS LTD.
CONSOLIDATED STATEMENTS OF CASH FLOWS
(U.S. dollars in thousands)
(Unaudited) | |||||||
Six Months Ended June 30, | |||||||
2020 | 2019 | ||||||
Operating Activities | |||||||
Net income (loss) before preference dividends | $ | (76,671 | ) | $ | 71,272 | ||
Adjustments to reconcile net income (loss) to net cash provided by operating activities: | |||||||
Net realized and unrealized (gains) losses on investments | 118,439 | (32,784 | ) | ||||
Amortization of fixed assets | 3 | 72 | |||||
Share-based compensation | 852 | 2,330 | |||||
Changes in: | |||||||
Accrued investment income | (349 | ) | 2,548 | ||||
Premiums receivable | 8,621 | (60 | ) | ||||
Reinsurance recoverable on unpaid and paid losses and loss adjustment expenses | (54,442 | ) | (37,611 | ) | |||
Prepaid reinsurance premiums | 658 | (17,926 | ) | ||||
Deferred acquisition costs, net | (2,385 | ) | 9,396 | ||||
Reserve for losses and loss adjustment expenses | 110,913 | 93,421 | |||||
Unearned premiums | 20,324 | (14,729 | ) | ||||
Reinsurance balances payable | (5,530 | ) | 2,379 | ||||
Funds held with reinsurers | (263 | ) | (10,890 | ) | |||
Other liabilities | (20,087 | ) | 48,743 | ||||
Other items | (12,740 | ) | (274 | ) | |||
Net Cash Provided By Operating Activities | 87,343 | 115,887 | |||||
Investing Activities | |||||||
Purchase of term loans | (159,650 | ) | (233,730 | ) | |||
Purchase of fixed maturity investments | (902,584 | ) | (746,930 | ) | |||
Purchase of short-term investments with maturities over three months | (7,048 | ) | — | ||||
Proceeds from sale, redemptions and maturity of term loans | 267,393 | 189,576 | |||||
Proceeds from sales, redemptions and maturities of fixed maturity investments | 760,494 | 778,128 | |||||
Proceeds from sales, redemptions and maturities of other investments | — | 24,636 | |||||
Proceeds from sales, redemptions and maturities of short-term investments with maturities over three months | 23,202 | 21,909 | |||||
Net (purchases) sales of short-term investments with maturities less than three months | (45,871 | ) | 26,694 | ||||
Purchases of equity securities | (6,213 | ) | (52,179 | ) | |||
Proceeds from sales of equity securities | 9,118 | 26,421 | |||||
Net settlements of derivative instruments | 2,444 | 619 | |||||
Purchases of furniture, equipment and other assets | (2 | ) | — | ||||
Net Cash Provided by (Used For) Investing Activities | (58,717 | ) | 35,144 | ||||
Financing Activities | |||||||
Dividends paid on redeemable preference shares | (2,233 | ) | (9,632 | ) | |||
Repayments on borrowings | (165,000 | ) | (198,426 | ) | |||
Proceeds from borrowings | 153,048 | 62,800 | |||||
Purchases of common shares under share repurchase program | (2,867 | ) | — | ||||
Net Cash Provided By (Used For) Financing Activities | (17,052 | ) | (145,258 | ) | |||
Effects of exchange rate changes on foreign currency cash | (6,358 | ) | (325 | ) | |||
Increase (decrease) in cash | 5,216 | 5,448 | |||||
Cash and cash equivalents, beginning of period | 102,437 | 63,529 | |||||
Cash and cash equivalents, end of period | $ | 107,653 | $ | 68,977 | |||
Supplementary information | |||||||
Income taxes paid | $ | — | $ | 20 | |||
Interest paid | $ | 9,579 | $ | 15,103 | |||
Non-cash exchange of investments | $ | 33,236 | $ | — | |||
See Notes to Consolidated Financial Statements
10
WATFORD HOLDINGS LTD.
NOTES TO THE CONSOLIDATED FINANCIAL STATEMENTS (UNAUDITED)
(U.S. dollars in thousands, except share data)
1. Organization
Watford Holdings Ltd. (the “Parent”) and its wholly-owned subsidiary, Watford Re Ltd. (“Watford Re”), were incorporated under the laws of Bermuda on July 19, 2013.
As used herein, the terms “Company” or “Companies,” or “we,” “us” and “our,” collectively refer to the Parent and/or, as applicable, its subsidiaries. Watford Re is licensed as a Class 4 multi-line insurer under the Insurance Act 1978 of Bermuda, as amended, and related regulations (the “Insurance Act”) and is licensed to underwrite general business on an insurance and reinsurance basis. Through Watford Re, the Company primarily underwrites reinsurance on exposures worldwide.
On March 28, 2019, the Company completed a direct listing of its common shares on the Nasdaq Global Select Market. On June 28, 2019, the Company completed a direct listing of its 8½% Cumulative Redeemable Preference Shares (the “preference shares”) on the Nasdaq Global Select Market. The Company did not issue any new common shares or preference shares, nor did the Company receive any proceeds from the sale of common shares or preference shares by the selling shareholders.
Watford Re and Watford Insurance Company Europe Limited (“WICE”) have engaged Arch Underwriters Ltd. (“AUL”), a company incorporated in Bermuda and a wholly-owned subsidiary of Arch Capital Group Ltd. (“ACGL”), to act as their insurance and reinsurance manager pursuant to services agreements between AUL and Watford Re and WICE, respectively. AUL manages the day-to-day underwriting activities of Watford Re and WICE, subject to the provisions of the services agreement and the oversight of our board of directors. See Note 12, “Transactions with related parties” for further details.
In May 2018, WICE formed a branch in Romania and commenced underwriting operations in June 2018. WICE is a wholly-owned subsidiary of Watford Re.
Watford Specialty Insurance Company (“WSIC”) and Watford Insurance Company (“WIC”), which are wholly-owned, indirect subsidiaries of Watford Re, have engaged Arch Underwriters Inc. (“AUI”), a company incorporated in Delaware and a wholly-owned subsidiary of ACGL, to act as their insurance and reinsurance manager pursuant to services agreements between AUI and WSIC and WIC, respectively. AUI manages the day-to-day underwriting activities of WSIC and WIC, subject to the provisions of the services agreement and the oversight of our board of directors. See Note 12, “Transactions with related parties” for further details.
The Company has engaged HPS Investment Partners, LLC (“HPS”), as Investment Manager of the assets in its non-investment grade portfolio pursuant to various investment management agreements. HPS invests the Company’s non-investment grade assets and a portion of its investment grade assets, subject to the terms of the applicable investment management agreements. See Note 12, “Transactions with related parties” for further details.
The Company has engaged Arch Investment Management Ltd. (“AIM”), a Bermuda exempted company and a subsidiary of ACGL, as Investment Manager of assets in its investment grade portfolio pursuant to various investment management agreements. AIM manages the majority of the Company’s investment grade assets pursuant to the terms of the investment management agreements with AIM. See Note 12, “Transactions with related parties” for further details.
The results for the three and six months ended June 30, 2020 are not necessarily indicative of the results expected for the full calendar year, especially when considering the risks and uncertainties associated with the COVID-19 global pandemic and the impact it may have on our business, results of operations and financial condition.
11
WATFORD HOLDINGS LTD.
NOTES TO THE CONSOLIDATED FINANCIAL STATEMENTS (UNAUDITED)
(U.S. dollars in thousands, except share data)
2. Basis of presentation and significant accounting policies
There has been no material change to the Company’s significant accounting policies as described in its audited consolidated financial statements and the accompanying notes as of December 31, 2019 and 2018 and for each of the years in the periods ended December 31, 2019, 2018 and 2017, except as noted below.
(a) Basis of presentation
The unaudited interim consolidated financial statements have been prepared in conformity with accounting principles generally accepted in the United States of America (“GAAP”) on a basis consistent with reporting interim financial information in accordance with instructions to Form 10-Q and Article 10 of Regulation S-X under the Securities and Exchange Act of 1934, as amended. All significant intercompany transactions and balances have been eliminated on consolidation. The preparation of financial statements in conformity with GAAP requires management to make estimates and assumptions that affect the reported amounts of assets and liabilities and disclosure of contingent assets and liabilities at the date of the financial statements and the reported amounts of revenues and expenses during the reporting period. Actual results could differ from those estimates and assumptions. In the opinion of management, the accompanying unaudited interim consolidated financial statements reflect all adjustments (consisting of recurring accruals) necessary for a fair statement of results on an interim basis.
Certain information and footnote disclosures normally included in financial statements prepared in accordance with GAAP have been condensed or omitted; however management believes that the disclosures are adequate to make the information presented not misleading. These unaudited interim financial statements should be read in conjunction with the Company’s audited consolidated financial statements and the accompanying notes for the years ended December 31, 2019, 2018 and 2017.
To facilitate comparison of information across periods, certain reclassifications have been made to prior year amounts to conform to the current year’s presentation.
(b) Recent accounting pronouncements
Issued and effective as of June 30, 2020 - Credit Losses
Financial Instruments - Credit Losses: Measurement of Credit Losses on Financial Instruments
The Company adopted ASU 2016-13, Financial Instruments - Credit Losses (Topic 326) (“ASU 2016-13”) which was issued in June 2016. This ASU applies a new credit loss model (current expected credit losses, or “CECL”) for determining credit-related impairments for financial instruments measured at amortized cost (including reinsurance recoverables) and requires an entity to estimate the credit losses expected over the life of an exposure or pool of exposures. The estimate of expected credit losses should consider historical information, current information, as well as reasonable and supportable forecasts, including estimates of prepayments. The expected credit losses, and subsequent adjustments to such losses, are recorded through an allowance account that is deducted from the amortized cost basis of the financial asset, with the net carrying value of the financial asset presented on the Company’s consolidated balance sheet.
This ASU also amends the previous other-than-temporary impairment model for available for sale debt securities by requiring the recognition of impairments relating to credit losses through an allowance account and limiting the amount of credit loss to the difference between a security’s amortized cost basis and its fair value. In addition, the length of time a security has been in an unrealized loss position will no longer impact the determination of whether a credit loss exists.
The Company adopted this ASU as of January 1, 2020. For available for sale debt securities, the updated guidance was applied prospectively. For financial instruments measured at amortized cost,
12
WATFORD HOLDINGS LTD.
NOTES TO THE CONSOLIDATED FINANCIAL STATEMENTS (UNAUDITED)
(U.S. dollars in thousands, except share data)
the updated guidance was applied by recognizing a cumulative effect adjustment of $0.4 million, net of tax, to the opening balance of retained earnings as of January 1, 2020, the beginning of the period of adoption. This adjustment is associated with “premiums receivable” and “reinsurance recoverables on unpaid and paid losses and loss adjustment expenses” in the Company’s consolidated balance sheets. The cumulative effect of the adjustment decreased retained earnings as of January 1, 2020 and increased the allowance for estimated uncollectible reinsurance.
The following accounting policies have been updated to reflect the Company’s adoption of ASU 2016-13, as described above. Results for the reporting periods beginning January 1, 2020 and thereafter are presented under ASC 326, while prior period amounts continue to be reported in accordance with previous applicable GAAP.
Investment Impairments
The Company conducts a periodic review to identify and evaluate invested assets that may have credit impairments.
Credit Impairments of Available For Sale Fixed Maturities
The Company derives estimated credit losses for fixed maturities by comparing expected future cash flows to be collected to the amortized cost of the security. Estimates of expected future cash flows consider among other things, macroeconomic conditions as well as the financial condition of the issuer, near-term and long-term prospects for the issuer, and the likelihood of the recoverability of principal and interest.
Beginning on January 1, 2020, credit losses are recognized through an allowance account subject to reversal, rather than a reduction in amortized cost. Declines in value attributable to factors other than credit are reported in other comprehensive income while the allowance for credit loss is charged to “realized and unrealized gains (losses) on investments” in the Company’s consolidated statements of income (loss).
For fixed maturity investments the Company intends to sell or for which it is more likely than not that the Company will be required to sell before an anticipated recovery in value, the full amount of the impairment is included in “realized and unrealized gains (losses) on investments” on the Company’s consolidated statements of income (loss). The new cost basis of the investment is the previous amortized cost basis less the impairment recognized in “realized and unrealized gains (losses) on investments.” The new cost basis is not adjusted for any subsequent recoveries in fair value.
The Company reports accrued investment income separately from available for sale fixed maturities, and has elected not to measure an allowance for credit losses for accrued investment income. Uncollectible accrued interest is written off when the Company determines that no additional interest payments will be received.
Reinsurance Recoverables
In the normal course of business, the Company’s subsidiaries cede a portion of their premium and losses through pro rata and excess of loss reinsurance agreements on a treaty or facultative basis. Reinsurance recoverables are recorded as assets, predicated on the reinsurers’ ability to meet their obligations under the reinsurance agreements. In certain instances, the Company obtains collateral, including letters of credit and trust accounts, to further reduce the credit exposure on its reinsurance recoverables. The Company reports its reinsurance recoverables net of an allowance for expected credit loss in the Company’s consolidated balance sheets. The allowance is based upon the Company’s ongoing review of amounts outstanding, the financial condition of its reinsurers, amounts and form of collateral obtained and other relevant factors. A ratings based probability-of-default and loss-given-default methodology is used to estimate the allowance for expected credit loss. Any allowance for credit losses is charged to the Company’s consolidated statements of income
13
WATFORD HOLDINGS LTD.
NOTES TO THE CONSOLIDATED FINANCIAL STATEMENTS (UNAUDITED)
(U.S. dollars in thousands, except share data)
(loss) in the period the recoverable is recorded and revised in subsequent periods to reflect changes in the Company’s estimate of expected credit losses.
Premiums receivable and unearned premium reserves
Premiums are recognized as revenues pro rata over the policy period. Unearned premium reserves represent the unexpired portion of policy premiums. Accrued retrospective premiums are included in premiums receivable balances. Premiums receivable balances are reported net of an allowance for expected credit losses. The Company monitors credit risk associated with premiums receivable through its ongoing review of amounts outstanding, aging of the receivable, historical loss data and counterparty financial strength measures. The allowance also includes estimated uncollectible amounts related to dispute risk. Amounts deemed to be uncollectible, are written off against the allowance. In certain instances, credit risk may be reduced by the Company’s right to offset loss obligations or unearned premiums against premiums receivable. Any allowance for credit losses is charged to the Company’s consolidated statements of income (loss) in the period the receivable is recorded and revised in subsequent periods to reflect changes in the Company’s estimate of expected credit losses.
Issued and effective as of June 30, 2020
In August 2018, the FASB issued ASU 2018-13, Fair Value Measurement (Topic 820), Disclosure Framework - Changes to the Disclosure Requirements for Fair Value Measurements (“ASU 2018-13”). ASU 2018-13 modifies the disclosure requirements on fair value measurements. This ASU was adopted on January 1, 2020, and the Company considers the impact to be immaterial to the Company’s consolidated financial statements and disclosures.
In March 2020, the FASB issued ASU 2020-03, Codification Improvements (“ASU 2020-03”), which provides updates to a wide variety of Topics in the Codification. For public business entities, this ASU was effective upon issuance. This ASU was adopted upon issuance, and did not have a material impact on the Company’s consolidated financial statements.
In April 2019, the FASB issued ASU 2019-04, which identified and clarified issues relevant to ASU 2017-12, Derivatives and Hedging (Topic 815), Targeted Improvements to Accounting for Hedging Activities (“ASU 2017-12”). For amendments related to ASU 2017-12, the effective date is as of the beginning of the first annual reporting period beginning after April 25, 2019. This ASU was adopted on January 1, 2020 and did not have a material impact on the Company’s consolidated financial statements.
Recently issued accounting standards not yet adopted
In March 2020, the FASB issued ASU 2020-04, Reference Rate Reform (Topic 848) (“ASU 2020-04”). This ASU provides practical expedients and exceptions for applying GAAP to contracts and transactions affected by reference rate reform if such contracts or transactions reference LIBOR or another reference rate expected to be discontinued. Amendments in this ASU for contract modifications may be applied as of March 12, 2020 through December 31, 2022. Once adopted, this ASU must be applied prospectively for all eligible contract modifications. The Company is currently assessing the impact the implementation of this ASU will have on its consolidated financial statements and disclosures, but does not believe that such impact will be material.
For additional information regarding accounting standards that the Company has not yet adopted, see Note 2, “Basis of presentation and significant accounting policies” in the Company’s audited consolidated financial statements in Part II, Item 8 of the Company’s Annual Report on Form 10-K for the year ended December 31, 2019.
14
WATFORD HOLDINGS LTD.
NOTES TO THE CONSOLIDATED FINANCIAL STATEMENTS (UNAUDITED)
(U.S. dollars in thousands, except share data)
3. Segment information
The Company reports results under one segment, referred to as the “underwriting segment.” The underwriting segment captures the results of the Company’s underwriting lines of business, which are comprised of specialty products on a worldwide basis. Lines of business include: (i) casualty reinsurance; (ii) property catastrophe reinsurance; (iii) other specialty reinsurance; and (iv) insurance programs and coinsurance.
The accounting policies of the underwriting segment are the same as those used for the preparation of the Company’s consolidated financial statements.
The Company has a corporate function that includes certain general and administrative expenses related to corporate activities, interest expense (on its 6.5% senior notes due July 2, 2029), net foreign exchange gains (losses), income tax expense and items related to the Company’s preference shares.
The following table provides summary information regarding premiums written and earned by line of business and net premiums written by underwriting location:
Three Months Ended June 30, | Six Months Ended June 30, | ||||||||||||||
2020 | 2019 | 2020 | 2019 | ||||||||||||
($ in thousands) | |||||||||||||||
Gross premiums written: | |||||||||||||||
Casualty reinsurance | $ | 25,125 | $ | 32,557 | $ | 108,943 | $ | 108,158 | |||||||
Other specialty reinsurance | 21,080 | 37,836 | 57,960 | 62,134 | |||||||||||
Property catastrophe reinsurance | 11,253 | 5,929 | 21,085 | 11,921 | |||||||||||
Insurance programs and coinsurance | 100,469 | 85,656 | 204,841 | 166,454 | |||||||||||
Total | $ | 157,927 | $ | 161,978 | $ | 392,829 | $ | 348,667 | |||||||
Net premiums written: | |||||||||||||||
Casualty reinsurance | $ | 24,774 | $ | 32,077 | $ | 108,441 | $ | 107,142 | |||||||
Other specialty reinsurance | 19,843 | 36,523 | 55,327 | 59,705 | |||||||||||
Property catastrophe reinsurance | 10,506 | 5,621 | 20,338 | 11,603 | |||||||||||
Insurance programs and coinsurance | 50,733 | 45,149 | 108,450 | 86,307 | |||||||||||
Total | $ | 105,856 | $ | 119,370 | $ | 292,556 | $ | 264,757 | |||||||
Net premiums earned: | |||||||||||||||
Casualty reinsurance | $ | 48,146 | $ | 67,506 | $ | 100,911 | $ | 130,819 | |||||||
Other specialty reinsurance | 29,876 | 42,635 | 65,240 | 87,196 | |||||||||||
Property catastrophe reinsurance | 5,824 | 3,119 | 10,708 | 6,090 | |||||||||||
Insurance programs and coinsurance | 47,689 | 38,058 | 94,715 | 73,307 | |||||||||||
Total | $ | 131,535 | $ | 151,318 | $ | 271,574 | $ | 297,412 | |||||||
Net premiums written by underwriting location: | |||||||||||||||
United States | $ | 27,798 | $ | 22,385 | $ | 64,101 | $ | 40,787 | |||||||
Europe | 22,921 | 23,927 | 44,124 | 47,185 | |||||||||||
Bermuda | 55,137 | 73,058 | 184,331 | 176,785 | |||||||||||
Total | $ | 105,856 | $ | 119,370 | $ | 292,556 | $ | 264,757 | |||||||
15
WATFORD HOLDINGS LTD.
NOTES TO THE CONSOLIDATED FINANCIAL STATEMENTS (UNAUDITED)
(U.S. dollars in thousands, except share data)
4. Reinsurance
Through reinsurance agreements with Arch Reinsurance Ltd. (“ARL”) and Arch Reinsurance Company (“ARC”), which are subsidiaries of ACGL, as well as through other third-party reinsurance agreements, the Company cedes a portion of its premiums. The effects of reinsurance on the Company’s written and earned premiums, losses and loss adjustment expenses were as follows:
Three Months Ended June 30, | Six Months Ended June 30, | ||||||||||||||
2020 | 2019 | 2020 | 2019 | ||||||||||||
($ in thousands) | |||||||||||||||
Premiums written | |||||||||||||||
Direct | $ | 100,469 | $ | 85,656 | $ | 204,841 | $ | 166,454 | |||||||
Assumed | 57,458 | 76,322 | 187,988 | 182,213 | |||||||||||
Ceded | (52,071 | ) | (42,608 | ) | (100,273 | ) | (83,910 | ) | |||||||
Net | $ | 105,856 | $ | 119,370 | $ | 292,556 | $ | 264,757 | |||||||
Premiums earned | |||||||||||||||
Direct | $ | 89,553 | $ | 70,445 | $ | 178,089 | $ | 133,962 | |||||||
Assumed | 90,447 | 115,622 | 189,976 | 229,103 | |||||||||||
Ceded | (48,465 | ) | (34,749 | ) | (96,491 | ) | (65,653 | ) | |||||||
Net | $ | 131,535 | $ | 151,318 | $ | 271,574 | $ | 297,412 | |||||||
Losses and loss adjustment expenses | |||||||||||||||
Direct | $ | 82,291 | $ | 62,976 | $ | 170,985 | $ | 111,380 | |||||||
Assumed | 70,337 | 88,651 | 145,057 | 173,175 | |||||||||||
Ceded | (47,842 | ) | (40,211 | ) | (100,580 | ) | (62,289 | ) | |||||||
Net | $ | 104,786 | $ | 111,416 | $ | 215,462 | $ | 222,266 | |||||||
The Company monitors the financial condition of its reinsurers and attempts to place coverages only with financially sound carriers. At June 30, 2020 and December 31, 2019, approximately 100% of ceded loss and loss adjustment reserves were due from carriers which had an A.M. Best or a Standard & Poor’s rating of “A-” or better.
At June 30, 2020 and December 31, 2019, approximately 44% and 47%, respectively, of the Company’s reinsurance recoverables on paid and unpaid losses (not including prepaid reinsurance premiums) were due from ARL and ARC, each of which have ratings of “A+” from A.M. Best. Although the Company has not experienced any material credit losses to date, an inability of its reinsurers to meet their obligations to it over the relevant exposure periods for any reason could have a material adverse effect on its financial condition and results of operations.
16
WATFORD HOLDINGS LTD.
NOTES TO THE CONSOLIDATED FINANCIAL STATEMENTS (UNAUDITED)
(U.S. dollars in thousands, except share data)
5. Reserve for losses and loss adjustment expenses
The following table represents an analysis of losses and loss adjustment expenses and a reconciliation of the beginning and ending reserve for losses and loss adjustment expenses for the six months ended June 30, 2020 and 2019.
Six Months Ended June 30, | |||||||
2020 | 2019 | ||||||
($ in thousands) | |||||||
Gross reserve for losses and loss adjustment expenses at beginning of period | $ | 1,263,628 | $ | 1,032,760 | |||
Unpaid losses and loss adjustment expenses recoverable | 165,549 | 81,267 | |||||
Net reserve for losses and loss adjustment expenses at beginning of period | 1,098,079 | 951,493 | |||||
Net incurred losses and loss adjustment expenses relating to losses occurring in: | |||||||
Current period | 215,849 | 222,395 | |||||
Prior years | (387 | ) | (129 | ) | |||
Total net losses and loss adjustment expenses | 215,462 | 222,266 | |||||
Foreign exchange (gains) losses | (23,999 | ) | 64 | ||||
Net paid losses and loss adjustment expenses relating to losses occurring in: | |||||||
Current period | (27,050 | ) | (13,956 | ) | |||
Prior years | (128,021 | ) | (153,229 | ) | |||
Total paid losses and loss adjustment expenses | (155,071 | ) | (167,185 | ) | |||
Net reserve for losses and loss adjustment expenses at end of period | 1,134,471 | 1,006,638 | |||||
Unpaid losses and loss adjustment expenses recoverable | 218,578 | 119,442 | |||||
Gross reserve for losses and loss adjustment expenses at end of period | $ | 1,353,049 | $ | 1,126,080 | |||
During the six months ended June 30, 2020, the Company recorded net favorable development on prior year loss reserves of $0.4 million. Net favorable development was experienced on other specialty reinsurance losses of $4.1 million, casualty reinsurance losses of $3.7 million and property catastrophe reinsurance losses of $1.0 million, offset by unfavorable development on insurance losses of $8.4 million.
During the six months ended June 30, 2019, the Company recorded net favorable development on prior year loss reserves of $0.1 million. Net favorable development was experienced on casualty reinsurance losses of $2.2 million, offset by unfavorable development on insurance losses of $0.8 million, property catastrophe reinsurance losses of $0.7 million and other specialty reinsurance losses of $0.6 million.
17
WATFORD HOLDINGS LTD.
NOTES TO THE CONSOLIDATED FINANCIAL STATEMENTS (UNAUDITED)
(U.S. dollars in thousands, except share data)
6. Allowance for expected credit losses
Premiums Receivable
The following table presents the balances of premiums receivable, net of the allowance for expected credit losses, at January 1, 2020 and June 30, 2020 and changes in the allowance for expected credit losses for the three and six months ended June 30, 2020.
At and For the Three Months Ended June 30, 2020 | At and For the Six Months Ended June 30, 2020 | ||||||||||||||
Premiums Receivable, Net of Allowance | Allowance for Expected Credit Losses | Premiums Receivable, Net of Allowance | Allowance for Expected Credit Losses | ||||||||||||
($ in thousands) | |||||||||||||||
Balance at beginning of period | $ | 281,541 | $ | 156 | $ | 273,657 | $ | — | |||||||
Cumulative effect of adoption of updated accounting guidance for credit losses at January 1, 2020 | — | 156 | |||||||||||||
Current period change for expected credit losses | — | — | |||||||||||||
Write-offs charged against the allowance | — | — | |||||||||||||
Balance at end of period | $ | 258,178 | $ | 156 | $ | 258,178 | $ | 156 | |||||||
Reinsurance Recoverables
The following table presents the balances of reinsurance recoverables, net of the allowance for expected credit losses, at January 1, 2020 and June 30, 2020, and changes in the allowance for expected credit losses for the three and six months ended June 30, 2020.
At and For the Three Months Ended June 30, 2020 | At and For the Six Months Ended June 30, 2020 | ||||||||||||||
Reinsurance Recoverables, Net of Allowance | Allowance for Expected Credit Losses | Reinsurance Recoverables, Net of Allowance | Allowance for Expected Credit Losses | ||||||||||||
($ in thousands) | |||||||||||||||
Balance at beginning of period | $ | 197,458 | $ | 297 | $ | 170,974 | $ | — | |||||||
Cumulative effect of adoption of updated accounting guidance for credit losses at January 1, 2020 (1) | — | 297 | |||||||||||||
Current period change for expected credit losses | (16 | ) | (16 | ) | |||||||||||
Write-offs charged against the allowance | — | — | |||||||||||||
Balance at end of period | $ | 229,746 | $ | 281 | $ | 229,746 | $ | 281 | |||||||
(1) As at June 30, 2020, the allowance for credit losses is gross of deferred tax of $22 thousand.
18
WATFORD HOLDINGS LTD.
NOTES TO THE CONSOLIDATED FINANCIAL STATEMENTS (UNAUDITED)
(U.S. dollars in thousands, except share data)
7. Investment information
Available for Sale Investments
The following tables summarize the fair value of the Company’s securities classified as available for sale as of June 30, 2020 and December 31, 2019:
Cost or Amortized Cost | Gross Unrealized Gains | Gross Unrealized Losses (1) | Fair Value | ||||||||||||
($ in thousands) | |||||||||||||||
June 30, 2020 | |||||||||||||||
Fixed maturities: | |||||||||||||||
U.S. government and government agency bonds | $ | 215,127 | $ | 1,741 | $ | (4 | ) | $ | 216,864 | ||||||
Non-U.S. government and government agency bonds | 151,335 | 4,998 | (6,591 | ) | 149,742 | ||||||||||
Corporate bonds | 164,417 | 7,215 | (2,224 | ) | 169,408 | ||||||||||
Asset-backed securities | 141,760 | 134 | (11,567 | ) | 130,327 | ||||||||||
Mortgage-backed securities | 24,498 | 17 | (2,497 | ) | 22,018 | ||||||||||
Municipal government and government agency bonds | 1,760 | 106 | — | 1,866 | |||||||||||
Total investments, available for sale | $ | 698,897 | $ | 14,211 | $ | (22,883 | ) | $ | 690,225 | ||||||
(1) Effective January 1, 2020, the Company adopted ASU 2016-13, and as a result any credit impairment losses on the Company’s available for sale securities are recorded as an allowance, subject to reversal. See Note 2. “Basis of presentation and significant accounting policies-(b) Recent accounting pronouncements-Issued and effective as of June 30, 2020 - Credit Losses” above for more information about ASU 2016-13. Included within the gross unrealized losses for corporate bonds is a credit allowance of $0.4 million for securities with an unrealized loss of $2.6 million as of June 30, 2020.
Cost or Amortized Cost | Gross Unrealized Gains | Gross Unrealized Losses | Fair Value | ||||||||||||
($ in thousands) | |||||||||||||||
December 31, 2019 | |||||||||||||||
Fixed maturities: | |||||||||||||||
U.S. government and government agency bonds | $ | 282,076 | $ | 1,708 | $ | (137 | ) | $ | 283,647 | ||||||
Corporate bonds | 155,834 | 2,326 | (41 | ) | 158,119 | ||||||||||
Asset-backed securities | 145,555 | 614 | (735 | ) | 145,434 | ||||||||||
Non-U.S. government and government agency bonds | 129,456 | 3,530 | (1,033 | ) | 131,953 | ||||||||||
Mortgage-backed securities | 24,776 | 18 | (44 | ) | 24,750 | ||||||||||
Municipal government and government agency bonds | 1,759 | 46 | — | 1,805 | |||||||||||
Total investments, available for sale | $ | 739,456 | $ | 8,242 | $ | (1,990 | ) | $ | 745,708 | ||||||
19
WATFORD HOLDINGS LTD.
NOTES TO THE CONSOLIDATED FINANCIAL STATEMENTS (UNAUDITED)
(U.S. dollars in thousands, except share data)
The following table summarizes, for all available for sale securities in an unrealized loss position, the fair value and gross unrealized losses by length of time the security has been in a continual unrealized loss position:
Less than 12 Months | 12 Months or More | Total | |||||||||||||||||||||
Fair Value | Gross Unrealized Losses | Fair Value | Gross Unrealized Losses | Fair Value | Gross Unrealized Losses | ||||||||||||||||||
($ in thousands) | |||||||||||||||||||||||
June 30, 2020 | |||||||||||||||||||||||
Fixed maturities: | |||||||||||||||||||||||
U.S. government and government agency bonds | $ | 28,550 | $ | (4 | ) | $ | — | $ | — | $ | 28,550 | $ | (4 | ) | |||||||||
Non-U.S. government and government agency bonds | 121,648 | (6,591 | ) | — | — | 121,648 | (6,591 | ) | |||||||||||||||
Corporate bonds | 24,696 | (2,224 | ) | — | — | 24,696 | (2,224 | ) | |||||||||||||||
Asset-backed securities | 105,868 | (9,343 | ) | 16,135 | (2,224 | ) | 122,003 | (11,567 | ) | ||||||||||||||
Mortgage-backed securities | 21,415 | (2,497 | ) | — | — | 21,415 | (2,497 | ) | |||||||||||||||
Total | $ | 302,177 | $ | (20,659 | ) | $ | 16,135 | $ | (2,224 | ) | $ | 318,312 | $ | (22,883 | ) | ||||||||
December 31, 2019 | |||||||||||||||||||||||
Fixed maturities: | |||||||||||||||||||||||
U.S. government and government agency bonds | $ | 36,540 | $ | (137 | ) | $ | — | $ | — | $ | 36,540 | $ | (137 | ) | |||||||||
Non-U.S. government and government agency bonds | 51,779 | (1,027 | ) | 5,410 | (6 | ) | 57,189 | (1,033 | ) | ||||||||||||||
Corporate bonds | 9,854 | (41 | ) | — | — | 9,854 | (41 | ) | |||||||||||||||
Asset-backed securities | 55,194 | (504 | ) | 19,430 | (231 | ) | 74,624 | (735 | ) | ||||||||||||||
Mortgage-backed securities | 14,481 | (44 | ) | — | — | 14,481 | (44 | ) | |||||||||||||||
Total | $ | 167,848 | $ | (1,753 | ) | $ | 24,840 | $ | (237 | ) | $ | 192,688 | $ | (1,990 | ) | ||||||||
At June 30, 2020, 72 positions out of a total of 158 positions were in an unrealized loss position. The unrealized loss position increased during the six-month period from $2.0 million to $22.9 million. The decrease in value can be attributed to the market movements resulting from the COVID-19 global pandemic, which primarily impacted the asset-backed securities, and unfavorable foreign exchange rates impacting the non-U.S. government agency bonds during the period.
At December 31, 2019, 48 positions out of a total of 146 positions were in an unrealized loss position; however, the unrealized loss was less than 10% of the fair value for all 48 positions. The decrease in value can be attributed to movement in foreign exchange rates for the non-U.S. government agency bonds since purchase and the decrease in value for the asset-backed securities, primarily driven by market movements during the period. The Company believes that such securities were temporarily impaired at December 31, 2019.
Allowance for expected credit losses
The Company recognized changes in the allowance for expected credit losses on available for sale securities of $(0.2) million and $0.4 million for the three and six months ended June 30, 2020. The credit allowance as of June 30, 2020 and March 31, 2020 was $0.4 million and $0.6 million, respectively. No credit losses were previously recognized and there were no write-offs charged against the allowance. The change in allowance is recognized in “realized and unrealized gains (losses) on investments” in the Company’s consolidated statements of income (loss). There were no
20
WATFORD HOLDINGS LTD.
NOTES TO THE CONSOLIDATED FINANCIAL STATEMENTS (UNAUDITED)
(U.S. dollars in thousands, except share data)
impairments of securities which the Company intends to sell or more likely than not will be required to sell.
The amortized cost and fair value of our fixed maturities classified as available for sale, summarized by contractual maturity as of June 30, 2020 and December 31, 2019 are shown in the following tables.
June 30, 2020 | ||||||||||
Amortized Cost | Estimated Fair Value | % of Fair Value | ||||||||
($ in thousands) | ||||||||||
Due in one year or less | $ | 19,500 | $ | 19,525 | 2.8 | % | ||||
Due after one year through five years | 345,922 | 349,444 | 50.6 | % | ||||||
Due after five years through ten years | 152,830 | 155,652 | 22.6 | % | ||||||
Due after ten years | 14,387 | 13,259 | 1.9 | % | ||||||
Asset-backed securities | 141,760 | 130,327 | 18.9 | % | ||||||
Mortgage-backed securities | 24,498 | 22,018 | 3.2 | % | ||||||
Total investments, available for sale | $ | 698,897 | $ | 690,225 | 100.0 | % | ||||
December 31, 2019 | ||||||||||
Amortized Cost | Estimated Fair Value | % of Fair Value | ||||||||
($ in thousands) | ||||||||||
Due in one year or less | $ | 9,235 | $ | 9,248 | 1.3 | % | ||||
Due after one year through five years | 414,235 | 417,921 | 56.0 | % | ||||||
Due after five years through ten years | 133,822 | 136,329 | 18.3 | % | ||||||
Due after ten years | 11,833 | 12,026 | 1.6 | % | ||||||
Asset-backed securities | 145,555 | 145,434 | 19.5 | % | ||||||
Mortgage-backed securities | 24,776 | 24,750 | 3.3 | % | ||||||
Total investments, available for sale | $ | 739,456 | $ | 745,708 | 100.0 | % | ||||
21
WATFORD HOLDINGS LTD.
NOTES TO THE CONSOLIDATED FINANCIAL STATEMENTS (UNAUDITED)
(U.S. dollars in thousands, except share data)
Fair Value Option and Fair Value Through Net Income
The following table summarizes the fair value of the Company’s securities held as of June 30, 2020 and December 31, 2019, classified as fair value through net income or for which the fair value option was elected:
Cost or Amortized Cost | Gross Unrealized Gains | Gross Unrealized Losses | Fair Value | ||||||||||||
($ in thousands) | |||||||||||||||
June 30, 2020 | |||||||||||||||
Term loan investments | $ | 991,130 | $ | 1,959 | $ | (117,529 | ) | $ | 875,560 | ||||||
Fixed maturities: | |||||||||||||||
Corporate bonds | 403,424 | 11,858 | (36,589 | ) | 378,693 | ||||||||||
U.S. government and government agency bonds | 584 | 11 | — | 595 | |||||||||||
Asset-backed securities | 198,619 | 2,229 | (42,923 | ) | 157,925 | ||||||||||
Mortgage-backed securities | 6,950 | 2,257 | (43 | ) | 9,164 | ||||||||||
Non-U.S. government and government agency bonds | 1,437 | 52 | (107 | ) | 1,382 | ||||||||||
Municipal government and government agency bonds | 251 | — | — | 251 | |||||||||||
Short-term investments | 370,976 | 597 | (1,507 | ) | 370,066 | ||||||||||
Other investments | 28,673 | 5,469 | — | 34,142 | |||||||||||
Equities | 50,863 | 13,524 | (5,489 | ) | 58,898 | ||||||||||
Investments, fair value option | $ | 2,052,907 | $ | 37,956 | $ | (204,187 | ) | $ | 1,886,676 | ||||||
Fair Value Through Net Income: | |||||||||||||||
Equities, fair value through net income | $ | 72,892 | $ | 6,956 | $ | (17,404 | ) | $ | 62,444 | ||||||
22
WATFORD HOLDINGS LTD.
NOTES TO THE CONSOLIDATED FINANCIAL STATEMENTS (UNAUDITED)
(U.S. dollars in thousands, except share data)
Cost or Amortized Cost | Gross Unrealized Gains | Gross Unrealized Losses | Fair Value | ||||||||||||
($ in thousands) | |||||||||||||||
December 31, 2019 | |||||||||||||||
Term loan investments | $ | 1,113,212 | $ | 7,340 | $ | (58,618 | ) | $ | 1,061,934 | ||||||
Fixed maturities: | |||||||||||||||
Corporate bonds | 221,024 | 8,430 | (15,100 | ) | 214,354 | ||||||||||
U.S. government and government agency bonds | 1,963 | 1 | (2 | ) | 1,962 | ||||||||||
Asset-backed securities | 200,361 | 3,329 | (12,953 | ) | 190,737 | ||||||||||
Mortgage-backed securities | 7,399 | 712 | (405 | ) | 7,706 | ||||||||||
Non-U.S. government and government agency bonds | 1,449 | 18 | (11 | ) | 1,456 | ||||||||||
Municipal government and government agency bonds | 380 | — | (1 | ) | 379 | ||||||||||
Short-term investments | 325,542 | 3,817 | (56 | ) | 329,303 | ||||||||||
Other investments | 28,672 | 2,264 | (475 | ) | 30,461 | ||||||||||
Equities | 54,893 | 10,690 | (5,784 | ) | 59,799 | ||||||||||
Investments, fair value option | $ | 1,954,895 | $ | 36,601 | $ | (93,405 | ) | $ | 1,898,091 | ||||||
Fair Value Through Net Income: | |||||||||||||||
Equities, fair value through net income | $ | 78,031 | $ | 2,360 | $ | (15,053 | ) | $ | 65,338 | ||||||
23
WATFORD HOLDINGS LTD.
NOTES TO THE CONSOLIDATED FINANCIAL STATEMENTS (UNAUDITED)
(U.S. dollars in thousands, except share data)
The amortized cost and fair value of our term loans, fixed maturities and short-term investments, excluding securities classified as available for sale, summarized by contractual maturity as of June 30, 2020 and December 31, 2019 are shown in the following tables.
June 30, 2020 | ||||||||||
Amortized Cost | Estimated Fair Value | % of Fair Value | ||||||||
($ in thousands) | ||||||||||
Due in one year or less | $ | 423,881 | $ | 415,624 | 23.2 | % | ||||
Due after one year through five years | 797,528 | 708,229 | 39.5 | % | ||||||
Due after five years through ten years | 538,257 | 495,214 | 27.6 | % | ||||||
Due after ten years | 8,136 | 7,480 | 0.4 | % | ||||||
Asset-backed securities | 198,619 | 157,925 | 8.8 | % | ||||||
Mortgage-backed securities | 6,950 | 9,164 | 0.5 | % | ||||||
Total | $ | 1,973,371 | $ | 1,793,636 | 100.0 | % | ||||
December 31, 2019 | ||||||||||
Amortized Cost | Estimated Fair Value | % of Fair Value | ||||||||
($ in thousands) | ||||||||||
Due in one year or less | $ | 368,452 | $ | 370,479 | 20.5 | % | ||||
Due after one year through five years | 779,643 | 742,960 | 41.1 | % | ||||||
Due after five years through ten years | 514,961 | 495,416 | 27.4 | % | ||||||
Due after ten years | 514 | 533 | — | % | ||||||
Asset-backed securities | 200,361 | 190,737 | 10.6 | % | ||||||
Mortgage-backed securities | 7,399 | 7,706 | 0.4 | % | ||||||
Total | $ | 1,871,330 | $ | 1,807,831 | 100.0 | % | ||||
Variable Interest Entities
In the normal course of its investing activities, the Company invests in limited partnerships, limited liability companies and other investment securities. Due to the legal forms of the entities and the fact that the investors lack the ability, through voting rights or similar rights, to make decisions that have a significant effect on the entities, such investments are considered variable interest entities. Since the Company lacks the ability to control the activities that most significantly impact the economic performance of these variable interest entities, the Company is not considered the primary beneficiary and does not consolidate these investments.
The activities of these entities are generally limited to holding and managing the underlying investments. The Company’s maximum exposure to loss with respect to these investments is limited to the investment carrying amounts reported as “other investments” in the Company’s consolidated balance sheet and any unfunded commitments. Realized and unrealized gains and losses from such investments are included in “realized and unrealized gains (losses) on investments” in the Company’s consolidated statements of income (loss).
24
WATFORD HOLDINGS LTD.
NOTES TO THE CONSOLIDATED FINANCIAL STATEMENTS (UNAUDITED)
(U.S. dollars in thousands, except share data)
The table below summarizes the credit quality of our total investments as of June 30, 2020 and December 31, 2019, as rated by Standard & Poor’s Financial Services, LLC, or Standard & Poor’s, Moody’s Investors Service, or Moody’s, Fitch Ratings Inc., or Fitch, Kroll Bond Rating Agency, or KBRA, or DBRS Morningstar, or DBRS, as applicable:
Credit Rating (1) | |||||||||||||||||||||||||||||||||||||||||||||||
June 30, 2020 | Fair Value | AAA | AA | A | BBB | BB | B | CCC | CC | C | D | Not Rated | |||||||||||||||||||||||||||||||||||
($ in thousands) | |||||||||||||||||||||||||||||||||||||||||||||||
Term loan investments | $ | 875,560 | $ | — | $ | — | $ | — | $ | — | $ | 23,218 | $ | 530,118 | $ | 247,478 | $ | 15,191 | $ | 2,192 | $ | 28,046 | $ | 29,317 | |||||||||||||||||||||||
Fixed maturities: | |||||||||||||||||||||||||||||||||||||||||||||||
Corporate bonds | 548,101 | — | 16,032 | 90,087 | 96,231 | 55,066 | 152,648 | 113,723 | 6,268 | 5,585 | 3,956 | 8,505 | |||||||||||||||||||||||||||||||||||
U.S. government and government agency bonds | 217,459 | — | 217,459 | — | — | — | — | — | — | — | — | — | |||||||||||||||||||||||||||||||||||
Asset-backed securities | 288,252 | 1,377 | — | 23,475 | 207,617 | 23,675 | 8,767 | 1,663 | — | — | — | 21,678 | |||||||||||||||||||||||||||||||||||
Mortgage-backed securities | 31,182 | — | 602 | 4,794 | 16,622 | 1,292 | — | — | — | — | 3,224 | 4,648 | |||||||||||||||||||||||||||||||||||
Non-U.S. government and government agency bonds | 151,124 | — | 151,124 | — | — | — | — | — | — | — | — | — | |||||||||||||||||||||||||||||||||||
Municipal government and government agency bonds | 2,117 | 1,039 | 586 | 492 | — | — | — | — | — | — | — | — | |||||||||||||||||||||||||||||||||||
Total fixed income instruments | 2,113,795 | 2,416 | 385,803 | 118,848 | 320,470 | 103,251 | 691,533 | 362,864 | 21,459 | 7,777 | 35,226 | 64,148 | |||||||||||||||||||||||||||||||||||
Short-term investments | 370,066 | 38,307 | 194,822 | 60,880 | 73,874 | 502 | — | — | — | — | — | 1,681 | |||||||||||||||||||||||||||||||||||
Total fixed income instruments and short-term investments | 2,483,861 | 40,723 | 580,625 | 179,728 | 394,344 | 103,753 | 691,533 | 362,864 | 21,459 | 7,777 | 35,226 | 65,829 | |||||||||||||||||||||||||||||||||||
Other Investments | 34,142 | ||||||||||||||||||||||||||||||||||||||||||||||
Equities | 121,342 | ||||||||||||||||||||||||||||||||||||||||||||||
Total | $ | 2,639,345 | $ | 40,723 | $ | 580,625 | $ | 179,728 | $ | 394,344 | $ | 103,753 | $ | 691,533 | $ | 362,864 | $ | 21,459 | $ | 7,777 | $ | 35,226 | $ | 65,829 | |||||||||||||||||||||||
(1) For individual fixed maturity investments, Standard & Poor’s ratings are used. In the absence of a Standard & Poor’s rating, ratings from Moody’s are used, followed by ratings from Fitch, followed by ratings from KBRA, followed by ratings from DBRS.
25
WATFORD HOLDINGS LTD.
NOTES TO THE CONSOLIDATED FINANCIAL STATEMENTS (UNAUDITED)
(U.S. dollars in thousands, except share data)
Credit Rating (1) | |||||||||||||||||||||||||||||||||||||||||||||||
December 31, 2019 | Fair Value | AAA | AA | A | BBB | BB | B | CCC | CC | C | D | Not Rated | |||||||||||||||||||||||||||||||||||
($ in thousands) | |||||||||||||||||||||||||||||||||||||||||||||||
Term loan investments | $ | 1,061,934 | $ | — | $ | — | $ | — | $ | — | $ | 9,617 | $ | 761,168 | $ | 215,909 | $ | 6,823 | $ | 2,119 | $ | — | $ | 66,298 | |||||||||||||||||||||||
Fixed maturities: | |||||||||||||||||||||||||||||||||||||||||||||||
Corporate bonds | 372,473 | — | 36,128 | 81,401 | 41,103 | 9,003 | 58,345 | 135,613 | — | — | — | 10,880 | |||||||||||||||||||||||||||||||||||
U.S. government and government agency bonds | 285,609 | — | 285,609 | — | — | — | — | — | — | — | — | — | |||||||||||||||||||||||||||||||||||
Asset-backed securities | 336,171 | 2,006 | — | 29,179 | 223,956 | 29,695 | 18,381 | — | — | — | — | 32,954 | |||||||||||||||||||||||||||||||||||
Mortgage-backed securities | 32,456 | — | — | 1,100 | 23,650 | 976 | — | — | — | — | 2,497 | 4,233 | |||||||||||||||||||||||||||||||||||
Non-U.S. government and government agency bonds | 133,409 | — | 132,460 | — | 949 | — | — | — | — | — | — | — | |||||||||||||||||||||||||||||||||||
Municipal government and government agency bonds | 2,184 | 1,135 | 573 | 476 | — | — | — | — | — | — | — | — | |||||||||||||||||||||||||||||||||||
Total fixed income instruments | 2,224,236 | 3,141 | 454,770 | 112,156 | 289,658 | 49,291 | 837,894 | 351,522 | 6,823 | 2,119 | 2,497 | 114,365 | |||||||||||||||||||||||||||||||||||
Short-term investments | 329,303 | 25,783 | 136,842 | 34,903 | 115,155 | — | — | 8,359 | — | — | — | 8,261 | |||||||||||||||||||||||||||||||||||
Total fixed income instruments and short-term investments | 2,553,539 | 28,924 | 591,612 | 147,059 | 404,813 | 49,291 | 837,894 | 359,881 | 6,823 | 2,119 | 2,497 | 122,626 | |||||||||||||||||||||||||||||||||||
Other Investments | 30,461 | ||||||||||||||||||||||||||||||||||||||||||||||
Equities | 125,137 | ||||||||||||||||||||||||||||||||||||||||||||||
Total | $ | 2,709,137 | $ | 28,924 | $ | 591,612 | $ | 147,059 | $ | 404,813 | $ | 49,291 | $ | 837,894 | $ | 359,881 | $ | 6,823 | $ | 2,119 | $ | 2,497 | $ | 122,626 | |||||||||||||||||||||||
(1) For individual fixed maturity investments, Standard & Poor’s ratings are used. In the absence of a Standard & Poor’s rating, ratings from Moody’s are used, followed by ratings from Fitch, followed by ratings from KBRA, followed by ratings from DBRS.
26
WATFORD HOLDINGS LTD.
NOTES TO THE CONSOLIDATED FINANCIAL STATEMENTS (UNAUDITED)
(U.S. dollars in thousands, except share data)
Fair value option
The Company elected to carry the majority of fixed maturity securities and other investments at fair value under the fair value option afforded by accounting guidance regarding the fair value option for financial assets and liabilities. Changes in fair value of investments accounted for using the fair value option are included in “realized and unrealized gain (loss) on investments” in the Company’s consolidated statements of income (loss). The Company elected to use this option as investments are not necessarily held to maturity, and in order to address simplification and cost-benefit considerations.
Net investment income (loss)
The components of net investment income (loss) for the three and six months ended June 30, 2020 and 2019 were derived from the following sources:
Three Months Ended June 30, 2020 | |||||||||||||||
Net Interest Income | Net Unrealized Gains (Losses) | Net Realized Gains (Losses) | Net Investment Income (Loss) | ||||||||||||
($ in thousands) | |||||||||||||||
Net investment income (loss) by asset class: | |||||||||||||||
Term loan investments | $ | 18,022 | $ | 90,951 | $ | (6,142 | ) | $ | 102,831 | ||||||
Fixed maturities - Fair value option | 10,887 | 45,781 | 230 | 56,898 | |||||||||||
Fixed maturities - Available for sale (1) | 3,648 | — | 8,911 | 12,559 | |||||||||||
Short-term investments | 2,881 | 3,513 | 38 | 6,432 | |||||||||||
Equities (2) | — | 5,792 | (3,156 | ) | 2,636 | ||||||||||
Equities, fair value through net income (2) | 196 | 11,781 | (6,085 | ) | 5,892 | ||||||||||
Other investments | 819 | 3,463 | — | 4,282 | |||||||||||
Other (3) | — | 16,783 | 203 | 16,986 | |||||||||||
Investment management fees - related parties | (4,262 | ) | — | — | (4,262 | ) | |||||||||
Borrowing and miscellaneous other investment expenses | (4,763 | ) | — | — | (4,763 | ) | |||||||||
$ | 27,428 | $ | 178,064 | $ | (6,001 | ) | $ | 199,491 | |||||||
(1) Net realized gains (losses) from the fixed maturities available for sale portfolio consists of realized gains and realized losses of $9.5 million and $0.6 million, respectively. Realized gains include a reversal of the allowance for expected credit losses on available for sale securities of $0.2 million for the three months ended June 30, 2020.
(2) Net interest income includes dividends for securities held in long and short positions.
(3) Other includes unrealized gains and unrealized losses for total return swaps.
27
WATFORD HOLDINGS LTD.
NOTES TO THE CONSOLIDATED FINANCIAL STATEMENTS (UNAUDITED)
(U.S. dollars in thousands, except share data)
Three Months Ended June 30, 2019 | |||||||||||||||
Net Interest Income | Net Unrealized Gains (Losses) | Net Realized Gains (Losses) | Net Investment Income (Loss) | ||||||||||||
($ in thousands) | |||||||||||||||
Net investment income (loss) by asset class: | |||||||||||||||
Term loan investments | $ | 22,665 | $ | (11,437 | ) | $ | 148 | $ | 11,376 | ||||||
Fixed maturities - Fair value option | 9,592 | 8,995 | 1,655 | 20,242 | |||||||||||
Fixed maturities - Available for sale (1) | 4,411 | — | 1,816 | 6,227 | |||||||||||
Short-term investments | 1,055 | (48 | ) | 25 | 1,032 | ||||||||||
Equities (2) | 80 | (1,096 | ) | — | (1,016 | ) | |||||||||
Equities, fair value through net income (2) | 793 | 3,687 | (3,599 | ) | 881 | ||||||||||
Other investments | — | (2,213 | ) | (202 | ) | (2,415 | ) | ||||||||
Other (3) | — | 387 | 946 | 1,333 | |||||||||||
Investment management fees - related parties | (4,570 | ) | — | — | (4,570 | ) | |||||||||
Borrowing and miscellaneous other investment expenses | (7,611 | ) | — | — | (7,611 | ) | |||||||||
Investment performance fees - related parties | — | — | — | (1,692 | ) | ||||||||||
$ | 26,415 | $ | (1,725 | ) | $ | 789 | $ | 23,787 | |||||||
(1) Net realized gains (losses) from the fixed maturities available for sale portfolio consists of realized gains and realized losses of $1.9 million and $0.1 million, respectively.
(2) Net interest income includes dividends for securities held in long and short positions.
(3) Other includes unrealized gains and unrealized losses for total return swaps.
28
WATFORD HOLDINGS LTD.
NOTES TO THE CONSOLIDATED FINANCIAL STATEMENTS (UNAUDITED)
(U.S. dollars in thousands, except share data)
Six Months Ended June 30, 2020 | |||||||||||||||
Net Interest Income | Net Unrealized Gains (Losses) | Net Realized Gains (Losses) | Net Investment Income (Loss) | ||||||||||||
Net investment income (loss) by asset class: | ($ in thousands) | ||||||||||||||
Term loan investments | $ | 39,040 | $ | (64,282 | ) | $ | (14,287 | ) | $ | (39,529 | ) | ||||
Fixed maturities - Fair value option | 19,955 | (43,894 | ) | (1,014 | ) | (24,953 | ) | ||||||||
Fixed maturities - Available for sale (1) | 8,308 | — | 11,091 | 19,399 | |||||||||||
Short-term investments | 4,731 | 73 | 125 | 4,929 | |||||||||||
Equities (2) | — | 5,868 | (3,195 | ) | 2,673 | ||||||||||
Equities, fair value through net income (2) | 573 | (494 | ) | (5,217 | ) | (5,138 | ) | ||||||||
Other investments | 1,670 | 3,683 | — | 5,353 | |||||||||||
Other (3) | — | (8,346 | ) | 1,450 | (6,896 | ) | |||||||||
Investment management fees - related parties | (8,614 | ) | — | — | (8,614 | ) | |||||||||
Borrowing and miscellaneous other investment expenses | (10,432 | ) | — | — | (10,432 | ) | |||||||||
$ | 55,231 | $ | (107,392 | ) | $ | (11,047 | ) | $ | (63,208 | ) | |||||
(1) Net realized gains (losses) from the fixed maturities available for sale portfolio consists of realized gains and realized losses of $12.8 million and $1.7 million, respectively. Realized losses include an allowance for expected credit losses on available for sale securities of $0.4 million for the six months ended June 30, 2020.
(2) Net interest income includes dividends for securities held in long and short positions.
(3) Other includes unrealized gains and unrealized losses for total return swaps.
29
WATFORD HOLDINGS LTD.
NOTES TO THE CONSOLIDATED FINANCIAL STATEMENTS (UNAUDITED)
(U.S. dollars in thousands, except share data)
Six Months Ended June 30, 2019 | |||||||||||||||
Net Interest Income | Net Unrealized Gains (Losses) | Net Realized Gains (Losses) | Net Investment Income (Loss) | ||||||||||||
($ in thousands) | |||||||||||||||
Net investment income (loss) by asset class: | |||||||||||||||
Term loan investments | $ | 45,075 | $ | (2,071 | ) | $ | 212 | $ | 43,216 | ||||||
Fixed maturities - Fair value option | 25,635 | 28,970 | 906 | 55,511 | |||||||||||
Fixed maturities - Available for sale (1) | 7,833 | — | 2,211 | 10,044 | |||||||||||
Short-term investments | 1,579 | (496 | ) | 25 | 1,108 | ||||||||||
Equities (2) | 200 | 1,062 | — | 1,262 | |||||||||||
Equities, fair value through net income (2) | 1,415 | 1,698 | (2,027 | ) | 1,086 | ||||||||||
Other investments | — | (419 | ) | (202 | ) | (621 | ) | ||||||||
Other (3) | — | 1,969 | 946 | 2,915 | |||||||||||
Investment management fees - related parties | (8,979 | ) | — | — | (8,979 | ) | |||||||||
Borrowing and miscellaneous other investment expenses | (15,909 | ) | — | — | (15,909 | ) | |||||||||
Investment performance fees - related parties | — | — | — | (7,492 | ) | ||||||||||
$ | 56,849 | $ | 30,713 | $ | 2,071 | $ | 82,141 | ||||||||
(1) Net realized gains (losses) from the fixed maturities available for sale portfolio consists of realized gains and realized losses of $2.4 million and $0.2 million, respectively.
(2) Net interest income includes dividends for securities held in long and short positions.
(3) Other includes unrealized gains and unrealized losses for total return swaps.
Pledged and restricted assets
For the benefit of certain Arch entities and other third parties that cede business to the Company, the Company is required to post and maintain collateral to support its potential obligations under reinsurance contracts written. This collateral can be in the form of either investment assets held in collateral trust accounts or letters of credit. Under its secured credit facilities, in order for the Company to have the bank issue a letter of credit to the Company’s reinsurance contract counterparty, the Company must post investment assets or cash as collateral to the bank. In either case, the amounts remain restricted for the duration of the term of the trust or letter of credit, as applicable.
At June 30, 2020 and December 31, 2019, the Company held $2.2 billion and $2.1 billion, respectively, in pledged assets in support of insurance and reinsurance liabilities as well as to collateralize the Company’s secured credit facilities and investment derivatives. Included within total pledged assets, the Company held $6.7 million and $6.4 million, respectively, in deposits with U.S. regulatory authorities.
Non-cash investing activities
During the first half of 2020, $33.2 million of investments converted or exchanged in non-cash transactions from fixed maturities or preferred equity positions to short term investments, fixed maturities or common stock equity positions, as presented on the consolidated statement of cash flows.
30
WATFORD HOLDINGS LTD.
NOTES TO THE CONSOLIDATED FINANCIAL STATEMENTS (UNAUDITED)
(U.S. dollars in thousands, except share data)
During 2019, the Company exchanged a preference share position of $28.7 million, which was held within “equity securities, fair value through net income,” for a limited partnership interest of $28.7 million, held under “other investments, fair value option.” HPS acts as the general partner and manager of the limited partnership.
During 2019, as a result of the restructuring of an investment position held by the Company, $16.9 million of term loans were converted to $23.0 million of common and preferred stock held within “equity securities, fair value through net income,” along with cash funding from short-term investments of $6.5 million.
8. Fair value
Fair value hierarchy
Accounting guidance regarding fair value measurements addresses how companies should measure fair value when they are required to use a fair value measure for recognition or disclosure purposes under GAAP and provides a common definition of fair value to be used throughout GAAP. It defines fair value as the price that would be received to sell an asset or paid to transfer a liability in an orderly transaction between market participants at the measurement date. In addition, it establishes a three-level valuation hierarchy for the disclosure of fair value measurements. The valuation hierarchy is based upon the transparency of inputs to the valuation of an asset or liability as of the measurement date. The level in the hierarchy within which a given fair value measurement falls is determined based on the lowest level input that is significant to the measurement (Level 1 being the highest priority and Level 3 being the lowest priority).
The levels in the hierarchy are defined as follows:
• | Level 1: Inputs to the valuation methodology are observable inputs that reflect quoted prices (unadjusted) for identical assets or liabilities in active markets; |
• | Level 2: Inputs to the valuation methodology include quoted prices for similar assets and liabilities in active markets and inputs that are observable for the asset or liability, either directly or indirectly, for substantially the full term of the financial instrument; and |
• | Level 3: Inputs to the valuation methodology are unobservable and significant to the fair value measurement. |
The availability of observable inputs can vary by financial instrument and is affected by a wide variety of factors including, for example, the type of financial instrument, whether the financial instrument is new and not yet established in the marketplace, and other characteristics particular to the transaction. To the extent that valuation is based on models or inputs that are less observable or unobservable in the market, the determination of fair value requires significantly more judgment. The degree of judgment exercised by the Company in determining fair value is greatest for financial instruments categorized in Level 3. In periods of market dislocation, the observability of prices and inputs may be reduced for many financial instruments. This may lead to a change in the valuation techniques used to estimate the fair value measurement and cause an instrument to be reclassified between levels within the fair value hierarchy.
Fair value measurements on a recurring basis
The following is a description of the valuation methodologies used for securities measured at fair value, as well as the general classification of such securities pursuant to the valuation hierarchy.
The Company determines the existence of an active market based on its judgment as to whether transactions for the financial instrument occur in such market with sufficient frequency and volume to provide reliable pricing information. The independent pricing sources obtain market quotations and actual transaction prices for securities that have quoted prices in active markets. The Company uses quoted values and other data provided by nationally recognized independent pricing sources
31
WATFORD HOLDINGS LTD.
NOTES TO THE CONSOLIDATED FINANCIAL STATEMENTS (UNAUDITED)
(U.S. dollars in thousands, except share data)
as inputs into its process for determining fair values of its fixed maturity investments. Each price source has its own proprietary method for determining the fair value of securities that are not actively traded. In general, these methods involve the use of “matrix pricing” in which the independent pricing source uses observable market inputs including, but not limited to, investment yields, credit risks and spreads, benchmarking of like securities, broker-dealer quotes, reported trades and sector groupings to determine a reasonable fair value.
Where multiple quotes or prices are obtained, a price source hierarchy is maintained in order to determine which price source would be used (i.e., a price obtained from a pricing service with more seniority in the hierarchy will be used over a less senior one in all cases). The hierarchy prioritizes pricing services based on availability and reliability and assigns the highest priority to index providers. Based on the above review, the Company will challenge any prices for a security or portfolio which are considered not to be representative of fair value.
In certain circumstances, when fair values are unavailable from these independent pricing sources, quotes are obtained directly from broker-dealers who are active in the corresponding markets. Such quotes are subject to the validation procedures noted above. Where quotes are unavailable, fair value is determined by the Investment Manager using quantitative and qualitative assessments such as internally modeled values, which are reviewed by the Company’s management.
Of the $2.6 billion of net financial assets and liabilities measured at fair value at June 30, 2020, approximately $121.1 million, or 4.7%, were priced using non-binding broker-dealer quotes or modeled valuations. Of the $2.6 billion of net financial assets and liabilities measured at fair value at December 31, 2019, approximately $131.8 million, or 5.0%, were priced using non-binding broker-dealer quotes or modeled valuations.
The Company reviews its securities measured at fair value and discusses the proper classification of such investments with its Investment Managers and others. A discussion of the general classification of the Company’s financial instruments follows:
Fixed Maturities. The Company uses the market approach valuation technique to estimate the fair value of its fixed maturity securities, when possible. The market approach includes obtaining prices from independent pricing services, such as index providers and pricing vendors, as well as to a lesser extent quotes from broker-dealers. The independent pricing sources obtain market quotations and actual transaction prices for securities that have quoted prices in active markets. Each source has its own proprietary method for determining the fair value of securities that are not actively traded. In general, these methods involve the use of “matrix pricing” in which the independent pricing source uses observable market inputs including, but not limited to, investment yields, credit risks and spreads, benchmarking of like securities, broker-dealer quotes, reported trades and sector groupings to determine a reasonable fair value.
The following describes the significant inputs generally used to determine the fair value of the Company’s investment securities by asset class:
Term Loans. Fair values are estimated by using quoted prices obtained from independent pricing services for term loan investments with similar characteristics, pricing models or matrix pricing. Such investments are generally classified within Level 2. The fair values for certain of the Company’s term loans are determined by the Investment Manager using quantitative and qualitative assessments such as internally modeled values, which are reviewed by the Company’s management. The modeled values are based on peer loans and comparison to industry-specific market data. Significant unobservable inputs used to price these securities may include changes in peer and/or comparable credit spreads, accretion of any original issue discount and changes in the issuer’s debt leverage since issue. Changes in peer credit spreads, comparable credits spreads, and issuer debt leverage are negatively correlated with the modeled fair value measurement. Such investments are generally classified within Level 3.
32
WATFORD HOLDINGS LTD.
NOTES TO THE CONSOLIDATED FINANCIAL STATEMENTS (UNAUDITED)
(U.S. dollars in thousands, except share data)
Corporate Bonds. Valuations are provided by independent pricing services, substantially all through index providers and pricing vendors, with a small amount through broker-dealers. The fair values of these securities are generally determined using the spread above the risk-free yield curve. These spreads are generally obtained from the new issue market, secondary trading and from broker-dealers who trade in the relevant security market. As the significant inputs used in the pricing process for corporate bonds are observable market inputs, the fair value of the majority of these securities are classified within Level 2. The fair values for certain of the Company’s corporate bonds are determined by the Investment Manager using quantitative and qualitative assessments such as internally modeled values, which are reviewed by the Company’s management. The modeled values are based on peer bonds and comparison to industry-specific market data. In addition, the Investment Manager assesses the fair value based on the valuation of the underlying holdings in accordance with the bonds’ governing documents. Significant unobservable inputs used to price these securities may include changes in peer and/or comparable credit spreads, accretion of any original issue discount and changes in the issuer’s debt leverage since issue. Changes in peer credit spreads, comparable credits spreads, and issuer debt leverage are negatively correlated with the modeled fair value measurement. Such investments are generally classified within Level 3.
Asset-Backed Securities. Valuations are provided by independent pricing services, substantially all through index providers and pricing vendors, with a small amount through broker-dealers. The fair values of these securities are generally determined through the use of pricing models (including option adjusted spread) which use spreads to determine the appropriate average life of the securities. These spreads are generally obtained from the new issue market, secondary trading and from broker-dealers who trade in the relevant security market. The pricing services also review prepayment speeds and other indicators, when applicable. As the significant inputs used in the pricing process for asset-backed securities are observable market inputs, the fair value of these securities are classified within Level 2.
Mortgage-Backed Securities. Valuations are provided by independent pricing services, substantially all through pricing vendors and index providers with a small amount through broker-dealers. The fair values of these securities are generally determined through the use of pricing models (including option adjusted spread) which use spreads to determine the expected average life of the securities. These spreads are generally obtained from the new issue market, secondary trading and from broker-dealers who trade in the relevant security market. The pricing services also review prepayment speeds and other indicators, when applicable. As the significant inputs used in the pricing process for mortgage-backed securities are observable market inputs, the fair value of these securities are classified within Level 2.
U.S. Government and Government Agencies. Valuations are provided by independent pricing services, with all prices provided through index providers and pricing vendors. The Company determined that all U.S. Treasuries would be classified as Level 1 securities due to observed levels of trading activity, the high number of strongly correlated pricing quotes received on U.S. Treasuries and other factors. The fair values of U.S. government agency securities are generally determined using the spread above the risk-free yield curve. As the yields for the risk-free yield curve and the spreads for these securities are observable market inputs, the fair values of U.S. government agency securities are classified within Level 2.
Non-U.S. Government Securities. Valuations are provided by independent pricing services, with all prices provided through index providers and pricing vendors. The fair values of these securities are generally based on international indices or valuation models which include daily observed yield curves, cross-currency basis index spreads and country credit spreads. As the significant inputs used in the pricing process for non-U.S. government securities are observable market inputs, the fair value of these securities are classified within Level 2.
Municipal Government Bonds. Valuations are provided by independent pricing services, with all prices provided through index providers and pricing vendors. The fair values of these securities are
33
WATFORD HOLDINGS LTD.
NOTES TO THE CONSOLIDATED FINANCIAL STATEMENTS (UNAUDITED)
(U.S. dollars in thousands, except share data)
generally determined using spreads obtained from broker-dealers who trade in the relevant security market, trade prices and the new issue market. As the significant inputs used in the pricing process for municipal bonds are observable market inputs, the fair value of these securities are classified within Level 2.
Short-Term Investments. The Company determined that certain of its short-term investments, held in highly liquid money market-type funds, and equities would be included in Level 1 as their fair values are based on quoted market prices in active markets. The fair values of other short-term investments are generally determined using the spread above the risk-free yield curve and are classified within Level 2.
Equity Securities. The Company determined that exchange-traded equity securities would be included in Level 1 as their values are based on quoted market prices in active markets. Other equity securities are initially valued at cost which approximates fair value. In subsequent measurement periods, the fair values of these securities are determined using non-binding broker-dealer quotes. These equity securities are included in Level 2 of the valuation hierarchy. Where such quotes are unavailable, fair value is determined by the Investment Manager using quantitative and qualitative assessments such as internally modeled values, which are reviewed by the Company’s management. As the significant inputs used to price these securities are unobservable, the fair value of these securities are classified as Level 3. Significant unobservable inputs used to price preferred stock may include changes in peer and/or comparable credit spreads, accretion of any original issue discount and changes in the issuer’s debt leverage since issue. Changes in peer credit spreads, comparable credit spreads and issuer debt leverage are negatively correlated with the modeled fair value measurement.
Underwriting Derivative Instruments. The Company values the government-sponsored enterprise credit-risk sharing transactions using a valuation methodology based on observable inputs from non-binding broker-dealer quotes and/or recent trading activity. As the inputs used in the valuation process are observable market inputs, the fair value of these securities are classified within Level 2. Refer to Note 9, “Derivative instruments” for more information.
Investment Derivative Instruments. The Company values the investment derivatives, including total return swaps and options, at fair value. As the underlying investments have observable inputs, the fair value of these securities are classified within Level 2. Refer to Note 9, “Derivative instruments” for more information.
Other Investments. The fair value of the Company’s investments in private funds are measured using the most recently available net asset valuations, or NAVs, as advised by the third-party administrators.
Measuring the Fair Value of Other Investments Using Net Asset Valuations
The fair value of the Company’s investments in private funds are measured using the most recently available NAVs as advised by the third-party administrators. The fund NAVs are based on the administrator’s valuation of the underlying holdings in accordance with the fund’s governing documents and in accordance with GAAP.
The Company often does not have access to financial information relating to the underlying securities held within the fund therefore management is unable to corroborate the fair values placed on the securities underlying the asset valuations provided by the fund manager or fund administrator. In order to assess the reasonableness of the NAVs, the Company performs a number of monitoring procedures on a quarterly basis, to assess the quality of the information provided by the fund manager and fund administrator. These procedures include, but are not limited to, regular review and discussion of the fund’s performance with its manager.
The fair value of the private funds are measured using the NAVs as a practical expedient, therefore the fair value of the funds have not been categorized within the fair value hierarchy.
34
WATFORD HOLDINGS LTD.
NOTES TO THE CONSOLIDATED FINANCIAL STATEMENTS (UNAUDITED)
(U.S. dollars in thousands, except share data)
The following table presents the Company’s financial assets and liabilities measured at fair value by level as of June 30, 2020 and December 31, 2019:
Fair Value Measurement Using: | |||||||||||||||
June 30, 2020 | Estimated Fair Value | Quoted Prices in Active Markets for Identical Assets (Level 1) | Significant Other Observable Inputs (Level 2) | Significant Unobservable Inputs (Level 3) | |||||||||||
($ in thousands) | |||||||||||||||
Assets measured at fair value: | |||||||||||||||
Term loans | $ | 875,560 | $ | — | $ | 846,907 | $ | 28,653 | |||||||
Fixed maturities: | |||||||||||||||
Corporate bonds | 548,101 | — | 547,103 | 998 | |||||||||||
U.S. government and government agency bonds | 217,459 | 217,347 | 112 | — | |||||||||||
Asset-backed securities | 288,252 | — | 288,252 | — | |||||||||||
Mortgage-backed securities | 31,182 | — | 31,182 | — | |||||||||||
Non-U.S. government and government agency bonds | 151,124 | — | 151,124 | — | |||||||||||
Municipal government and government agency bonds | 2,117 | — | 2,117 | — | |||||||||||
Short-term investments | 370,066 | 368,384 | 1,682 | — | |||||||||||
Equities | 121,342 | 12,402 | 1,096 | 107,844 | |||||||||||
Other underwriting derivative assets | 6 | — | 6 | — | |||||||||||
Other investments measured at net asset value (1) | 34,142 | — | — | — | |||||||||||
Total assets measured at fair value | $ | 2,639,351 | $ | 598,133 | $ | 1,869,581 | $ | 137,495 | |||||||
Investment derivative liabilities (2) | $ | 6,935 | $ | — | $ | 6,935 | $ | — | |||||||
Payable for securities sold short: | |||||||||||||||
Corporate bonds | 23,166 | — | 23,166 | — | |||||||||||
U.S. government and government agency bonds | 6,123 | 6,123 | — | — | |||||||||||
Total liabilities measured at fair value | $ | 36,224 | $ | 6,123 | $ | 30,101 | $ | — | |||||||
(1) In accordance with applicable accounting guidance, other investments that are measured at fair value using the net asset value practical expedient have not been classified in the fair value hierarchy. The fair value amounts presented in this table are intended to permit reconciliation of the fair value hierarchy to the amounts presented in the consolidated balance sheets.
(2) Investment derivative assets and liabilities represent the fair value of total return swaps, which are recorded in other assets and other liabilities, respectively, in the consolidated balance sheets as of June 30, 2020.
35
WATFORD HOLDINGS LTD.
NOTES TO THE CONSOLIDATED FINANCIAL STATEMENTS (UNAUDITED)
(U.S. dollars in thousands, except share data)
Fair Value Measurement Using: | |||||||||||||||
December 31, 2019 | Estimated Fair Value | Quoted Prices in Active Markets for Identical Assets (Level 1) | Significant Other Observable Inputs (Level 2) | Significant Unobservable Inputs (Level 3) | |||||||||||
($ in thousands) | |||||||||||||||
Assets measured at fair value: | |||||||||||||||
Term loans | $ | 1,061,934 | $ | — | $ | 1,025,886 | $ | 36,048 | |||||||
Fixed maturities: | |||||||||||||||
Corporate bonds | 372,473 | — | 371,540 | 933 | |||||||||||
U.S. government and government agency bonds | 285,609 | 285,500 | 109 | — | |||||||||||
Asset-backed securities | 336,171 | — | 336,171 | — | |||||||||||
Mortgage-backed securities | 32,456 | — | 32,456 | — | |||||||||||
Non-U.S. government and government agency bonds | 133,409 | — | 133,409 | — | |||||||||||
Municipal government and government agency bonds | 2,184 | — | 2,184 | — | |||||||||||
Short-term investments | 329,303 | 318,012 | 11,291 | — | |||||||||||
Equities | 125,137 | 13,548 | 2,998 | 108,591 | |||||||||||
Other underwriting derivative assets | 148 | — | 148 | — | |||||||||||
Investment derivative assets (1) | 1,667 | — | 1,667 | — | |||||||||||
Other investments measured at net asset value (2) | 30,461 | — | — | — | |||||||||||
Total assets measured at fair value | $ | 2,710,952 | $ | 617,060 | $ | 1,917,859 | $ | 145,572 | |||||||
Investment derivative liabilities (1) | 257 | — | 257 | — | |||||||||||
Payable for securities sold short: | |||||||||||||||
Corporate bonds | 66,257 | — | 66,257 | — | |||||||||||
Total liabilities measured at fair value | $ | 66,514 | $ | — | $ | 66,514 | $ | — | |||||||
(1) Investment derivative assets and liabilities represent the fair value of total return swaps, which are recorded in “other assets” and “other liabilities,” respectively, in the consolidated balance sheets as of December 31, 2019.
(2) In accordance with applicable accounting guidance, other investments that are measured at fair value using the net asset value practical expedient have not been classified in the fair value hierarchy. The fair value amounts presented in this table are intended to permit reconciliation of the fair value hierarchy to the amounts presented in the consolidated balance sheets.
When the fair value of financial assets and financial liabilities cannot be derived from active markets, the fair value is determined using a variety of valuation techniques that include the use of models. The inputs to these models are taken from observable markets where possible, but where this is not feasible, estimation is required to establish fair values. Changes in assumptions about these factors could affect the reported fair value of financial instruments and the level where the instruments are disclosed in the fair value hierarchy.
36
WATFORD HOLDINGS LTD.
NOTES TO THE CONSOLIDATED FINANCIAL STATEMENTS (UNAUDITED)
(U.S. dollars in thousands, except share data)
The following table presents a reconciliation of the beginning and ending balances for all the financial assets measured at fair value on a recurring basis using Level 3 inputs for the three and six months ended June 30, 2020 and 2019:
Three Months Ended June 30, 2020 | Beginning Balance | Net Purchases (Sales)(1) | Net Unrealized Gains (Losses)(2) | Net Unrealized Foreign Exchange Gains (Losses) | Ending Balance | ||||||||||||||
($ in thousands) | |||||||||||||||||||
Term loans | $ | 35,945 | $ | (7,184 | ) | $ | (108 | ) | $ | — | $ | 28,653 | |||||||
Corporate bonds | 965 | 33 | — | — | 998 | ||||||||||||||
Equities | 110,090 | (15,449 | ) | 13,203 | — | 107,844 | |||||||||||||
Total | $ | 147,000 | $ | (22,600 | ) | $ | 13,095 | $ | — | $ | 137,495 | ||||||||
Three Months Ended June 30, 2019 | Beginning Balance | Net Purchases (Sales)(1) | Net Unrealized Gains (Losses)(2) | Net Unrealized Foreign Exchange Gains (Losses) | Ending Balance | ||||||||||||||
($ in thousands) | |||||||||||||||||||
Term loans | $ | 47,368 | $ | 170 | $ | 1,047 | $ | — | $ | 48,585 | |||||||||
Corporate bonds | 23,719 | — | (110 | ) | 311 | 23,920 | |||||||||||||
Equities | 100,651 | — | 1,555 | — | 102,206 | ||||||||||||||
Total | $ | 171,738 | $ | 170 | $ | 2,492 | $ | 311 | $ | 174,711 | |||||||||
(1) For the three months ended June 30, 2020, the net purchases (sales) consisted of sales of equities of $25.1 million and sales, calls and redemptions of $7.2 million of term loans, offset by purchases of $9.6 million of equities and $33.0 thousand of corporate bonds. For the three months ended June 30, 2019, the net purchases (sales) consisted of purchases of $0.2 million of term loans, offset in part by calls and redemptions of $0.1 million.
(2) Realized and unrealized gains or losses on Level 3 investments are included in “realized and unrealized gain (loss) on investments” in the Company’s consolidated statements of income (loss).
Six Months Ended June 30, 2020 | Beginning Balance | Net Purchases (Sales)(2) | Net Unrealized Gains (Losses)(3) | Net Unrealized Foreign Exchange Gains (Losses) | Ending Balance | ||||||||||||||
($ in thousands) | |||||||||||||||||||
Term loans | $ | 36,048 | $ | (7,258 | ) | $ | (137 | ) | $ | — | $ | 28,653 | |||||||
Corporate bonds | 933 | 65 | — | — | 998 | ||||||||||||||
Equities | 108,591 | (12,172 | ) | 11,425 | — | 107,844 | |||||||||||||
Total | $ | 145,572 | $ | (19,365 | ) | $ | 11,288 | $ | — | $ | 137,495 | ||||||||
Six Months Ended June 30, 2019 | Beginning Balance | Transfers in (out) of Level 3 (1) | Net Purchases (Sales)(2) | Net Unrealized Gains (Losses)(3) | Net Unrealized Foreign Exchange Gains (Losses) | Ending Balance | |||||||||||||||||
($ in thousands) | |||||||||||||||||||||||
Term loans | $ | 47,479 | $ | — | $ | 333 | $ | 773 | $ | — | $ | 48,585 | |||||||||||
Corporate bonds | 24,277 | — | (90 | ) | (179 | ) | (88 | ) | 23,920 | ||||||||||||||
Asset-backed securities | 22,560 | (22,560 | ) | — | — | — | — | ||||||||||||||||
Equities | 70,451 | — | 30,534 | 1,221 | — | 102,206 | |||||||||||||||||
Total | $ | 164,767 | $ | (22,560 | ) | $ | 30,777 | $ | 1,815 | $ | (88 | ) | $ | 174,711 | |||||||||
(1) During the six months ended June 30, 2019, the Company obtained pricing for an asset-backed security, for which pricing was not available as of December 31, 2018. As such, the security was transferred from Level 3 to Level 2 at its fair value as of December 31, 2018.
37
WATFORD HOLDINGS LTD.
NOTES TO THE CONSOLIDATED FINANCIAL STATEMENTS (UNAUDITED)
(U.S. dollars in thousands, except share data)
(2) For the six months ended June 30, 2020, the net purchases (sales) consisted of sales of $25.1 million of equities and $7.3 million of sales, calls and redemptions of term loans, offset by purchases of $12.9 million of equities and $65.0 thousand of corporate bonds. For the six months ended June 30, 2019, the net purchases (sales) consisted of purchases of $37.8 million of equities and $0.5 million of term loans, offset in part by the sale of $7.3 million of equities, $0.1 million of redemptions of term loans and $0.1 million of corporate bonds.
(3) Realized and unrealized gains or losses on Level 3 investments are included in “realized and unrealized gain (loss) on investments” in the Company’s consolidated statements of income (loss).
Financial instruments disclosed, but not carried, at fair value
The Company uses various financial instruments in the normal course of its business. The carrying values of cash and cash equivalents, accrued investment income, receivable for securities sold, certain other assets, payable for securities purchased and certain other liabilities approximated their fair values at June 30, 2020 and December 31, 2019 due to their respective short maturities. As these financial instruments are not actively traded, their respective fair values are classified within Level 2.
On July 2, 2019, the Company completed a private offering of $175.0 million in aggregate principal amount of its 6.5% senior notes due July 2, 2029 (the “senior notes”). At June 30, 2020, the Company’s senior notes were carried at cost, net of debt issuance costs, of $172.6 million and had a fair value of $176.4 million. The fair value of the senior notes was obtained from a third party pricing service and was based on observable market inputs. As such, the fair values of the senior notes are classified within Level 2.
Fair value measurements on a non-recurring basis
The Company measures the fair value of certain assets on a non-recurring basis, generally quarterly, annually, or when events or changes in circumstances indicate that the carrying amount of the assets may not be recoverable. The Company uses a variety of techniques to determine the fair value of these assets when appropriate, as described below.
Intangible Assets
The Company tests intangible assets for impairment whenever events or changes in circumstances indicate the carrying amount may not be recoverable. When the Company determines intangible assets may be impaired, the Company uses techniques including discounted expected future cash flows, to measure fair value. There were no such triggering events or changes in circumstances as of June 30, 2020. There were no additional assets measured at fair value on a non-recurring basis as of June 30, 2020 and December 31, 2019.
9. Derivative instruments
Underwriting Derivatives
The Company’s underwriting strategy allows it to enter into government-sponsored enterprise credit-risk sharing transactions. These transactions are accounted for as derivatives. The derivative assets and derivative liabilities relating to these transactions are included in “other assets” and “other liabilities,” respectively, in the Company’s consolidated balance sheets. Realized and unrealized gains and losses from other derivatives are included in “other underwriting income (loss)” in the Company’s consolidated statements of income (loss). The risk in force of these transactions is considered the notional amount.
As of June 30, 2020 and December 31, 2019, the Company posted $11.8 million and $13.1 million, respectively, in assets as collateral. These assets are included in “fixed maturities,” which are recorded at fair value in the Company’s consolidated balance sheets.
Investment Derivatives
The Company’s investment strategy allows for the use of derivative securities. The Company invests in call options to manage specific market risks; such derivative instruments are recorded at fair
38
WATFORD HOLDINGS LTD.
NOTES TO THE CONSOLIDATED FINANCIAL STATEMENTS (UNAUDITED)
(U.S. dollars in thousands, except share data)
value, and shown as part of “payable for securities sold short” on its consolidated balance sheets. Such call options were purchased and sold in the first quarter of 2020.
Additionally, beginning in the fourth quarter of 2018, the Company invested in put options to manage specific market risks; such derivative instruments are recorded at fair value, and shown as part of “equity securities” on its consolidated balance sheets. Such put options were sold in the first quarter of 2019.
The Company began investing in total return swaps (“swaps”) during 2018, through a Master Confirmation of Total Return Swap Transactions agreement, and recognizes the swap derivatives at fair value. The derivative assets and derivative liabilities relating to these transactions are included in “other assets” and “other liabilities,” respectively, in the Company’s consolidated balance sheets. At June 30, 2020 and December 31, 2019, the Company had collateral funds held by the counterparty of $60.7 million and $64.1 million included in “short-term investments” in the Company’s consolidated balance sheets.
The fair value of such swaps are based on observable inputs and classified in Level 2 of the valuation hierarchy. Realized and unrealized gains and losses from investment derivatives are included in “realized and unrealized gains (losses)” on investments in the Company’s consolidated statements of income (loss).
The Company did not hold any derivatives designated as hedging instruments at June 30, 2020 and December 31, 2019.
The following table summarizes information on the fair values and notional amount of the Company’s derivative instruments at June 30, 2020 and December 31, 2019:
Estimated Fair Value | |||||||||||||||
Asset Derivatives | Liability Derivatives | Net Derivatives | Notional Amount (1) | ||||||||||||
($ in thousands) | |||||||||||||||
June 30, 2020 | |||||||||||||||
Other underwriting derivatives | $ | 6 | $ | — | $ | 6 | $ | 52,970 | |||||||
Total return swaps | — | 6,935 | (6,935 | ) | 122,792 | ||||||||||
Total | $ | 6 | $ | 6,935 | $ | (6,929 | ) | $ | 175,762 | ||||||
December 31, 2019 | |||||||||||||||
Other underwriting derivatives | $ | 148 | $ | — | $ | 148 | $ | 59,879 | |||||||
Total return swaps | 1,667 | 257 | 1,410 | 162,678 | |||||||||||
Total | $ | 1,815 | $ | 257 | $ | 1,558 | $ | 222,557 | |||||||
(1) The notional amount represents the absolute value of all outstanding contracts.
39
WATFORD HOLDINGS LTD.
NOTES TO THE CONSOLIDATED FINANCIAL STATEMENTS (UNAUDITED)
(U.S. dollars in thousands, except share data)
The realized and unrealized gains and losses on the Company’s derivative instruments are reflected in the consolidated statements of income (loss), as summarized in the following table:
Three Months Ended June 30, | Six Months Ended June 30, | ||||||||||||||
2020 | 2019 | 2020 | 2019 | ||||||||||||
($ in thousands) | |||||||||||||||
Underwriting derivatives: | |||||||||||||||
Other underwriting income (loss) | $ | 868 | $ | 673 | $ | 1,001 | $ | 1,265 | |||||||
Investment derivatives: | |||||||||||||||
Net realized and unrealized gains (losses): | |||||||||||||||
Options | — | (2 | ) | 1,081 | 799 | ||||||||||
Total return swaps | 16,986 | 1,333 | (6,896 | ) | 2,915 | ||||||||||
10. Earnings per common share
The following table sets forth the computation of basic and diluted earnings per common share:
Three Months Ended June 30, | Six Months Ended June 30, | ||||||||||||||
2020 | 2019 | 2020 | 2019 | ||||||||||||
($ in thousands except share and per share data) | |||||||||||||||
Numerator: | |||||||||||||||
Net income (loss) before preference dividends | $ | 189,937 | $ | 18,733 | $ | (76,671 | ) | $ | 71,272 | ||||||
Preference dividends | (1,109 | ) | (4,908 | ) | (2,280 | ) | (9,815 | ) | |||||||
Net income (loss) available to common shareholders | 188,828 | 13,825 | (78,951 | ) | 61,457 | ||||||||||
Denominator: | |||||||||||||||
Weighted average common shares outstanding - basic | 19,863,048 | 22,740,762 | 19,907,490 | 22,711,833 | |||||||||||
Effect of dilutive common share equivalents: | |||||||||||||||
Weighted average non-vested restricted share units (1)(2) | — | 6,271 | — | 3,136 | |||||||||||
Weighted average common shares outstanding - diluted (3) | 19,863,048 | 22,747,033 | 19,907,490 | 22,714,969 | |||||||||||
Earnings (loss) per common share: | |||||||||||||||
Basic and diluted | $ | 9.51 | $ | 0.61 | $ | (3.97 | ) | $ | 2.71 | ||||||
(1) During the three months ended June 30, 2020, the Company issued 100,958 common shares, relating to restricted share units granted in the second quarter of 2019. Of these shares, 27,456 common shares vested during the three months ended June 30, 2020.
(2) During the three months ended June 30, 2020, the Company did not grant any restricted share units or common shares. During the six months ended June 30, 2020 and June 30, 2019, the Company granted an aggregate of 63,591 and 165,287, respectively, of restricted share units and common shares to certain employees and directors. Of the total restricted share units and common shares granted, 103,820 are non-vested as of June 30, 2020. The weighted average non-vested restricted share units of 6,864 are excluded from the calculation of diluted weighted average common shares outstanding for the six months ended June 30, 2020, due to a net loss reported. Refer to Note 17, “Share transactions” for further details.
(3) Warrants held by Arch and HPS were not included in the computation of diluted earnings because the exercise price of the warrants exceeded the market price of the common shares during the period and the exercise of the warrants would have been anti-dilutive. The warrants expired on March 25, 2020. The number of common shares issuable upon exercise of the warrants that was excluded was 1,704,691 common shares.
11. Income taxes
Watford Holdings and Watford Re are incorporated under the laws of Bermuda and, under current law, are not obligated to pay any taxes in Bermuda based upon income or capital gains. In the event that any legislation is enacted in Bermuda imposing such taxes, a written undertaking has been
40
WATFORD HOLDINGS LTD.
NOTES TO THE CONSOLIDATED FINANCIAL STATEMENTS (UNAUDITED)
(U.S. dollars in thousands, except share data)
received from the Bermuda Minister of Finance under the Exempted Undertakings Tax Protection Act 1966 that such taxes will not be applicable to Watford Holdings and Watford Re until March 31, 2035.
WICE is incorporated under the laws of Gibraltar and regulated by the Gibraltar Financial Services Commission (the “FSC”) under the Financial Services (Insurance Company) Act (the “Gibraltar Act”). In addition to its operations in Gibraltar, WICE operates a branch in Romania. The current rates of tax on applicable profits in Gibraltar and Romania are 10% and 16%, respectively. The open tax years that are potentially subject to examination are 2018 through 2020 in Gibraltar and 2018 through 2020 in Romania.
Watford Holdings (U.K.) Limited is incorporated in the United Kingdom and is subject to U.K. corporate income tax. The open tax years that are potentially subject to examination by U.K. tax authorities are 2018 through 2020.
Watford Holdings (U.S.) Inc. is incorporated in the United States and files a consolidated U.S. federal tax return with its subsidiaries, WSIC, WIC, and Watford Services Inc. The U.S. federal tax rate is 21% for tax years beginning after December 31, 2017. The open tax years that are potentially subject to examination by U.S. tax authorities are 2016 through 2020.
The Company provides a valuation allowance to reduce certain deferred tax assets to an amount which management expects to more likely than not be realized. As of June 30, 2020 and December 31, 2019, the Company’s valuation allowance was $1.5 million and $1.3 million, respectively. The valuation allowance includes U.S. operating loss carry-forwards that begin to expire in 2037. After consideration of the valuation allowance, the Company had net deferred tax assets of $0.4 million and $Nil as of June 30, 2020 and December 31, 2019, respectively.
After taking into account the impact of the change in the valuation allowance, the Company recognized income tax expense (benefit) of $(0.4) million and $0.02 million in the consolidated statements of income (loss) and income tax expense (benefit) of $0.4 million and $Nil in the consolidated statements of comprehensive income (loss) during the three months and six months ended June 30, 2020 and 2019.
The Company recognizes a tax benefit where it concludes that it is more likely than not that the tax benefit will be sustained on audit by the taxing authority based solely on the technical merits of the associated tax position. The Company records interest and penalties related to unrecognized tax benefits in the provision for income taxes. As of both June 30, 2020 and December 31, 2019, the Company’s total unrecognized tax benefits, including interest and penalties, were $Nil.
12. Transactions with related parties
In March 2014, ARL invested $100.0 million in the Company and acquired approximately 11% of its common equity.
AUL acts as the insurance and reinsurance manager for Watford Re and WICE while AUI acts as the insurance and reinsurance manager for WSIC and WIC, all under separate long-term services agreements. HPS manages the Company’s non-investment grade portfolio and a portion of the Company’s investment grade portfolio as Investment Manager and AIM manages a portion of the Company’s investment grade portfolio as Investment Manager, each under separate long-term services agreements. ARL and HPS were granted warrants to purchase additional common equity based on performance criteria. In recognition of the sizable ownership interest, two senior executives of ACGL were appointed to the Company’s board of directors. The services agreements with AUL and AUI and the investment management agreements with HPS and AIM provide for services for an extended period of time with limited termination rights by the Company. In addition, these agreements allow for AUL, AUI and HPS to participate in the favorable results of the Company in the form of performance fees.
41
WATFORD HOLDINGS LTD.
NOTES TO THE CONSOLIDATED FINANCIAL STATEMENTS (UNAUDITED)
(U.S. dollars in thousands, except share data)
ACGL and affiliates
At June 30, 2020, ARL held approximately 12.6% of the Company’s common equity. Affiliates of ACGL held approximately 6.6% of the Company’s preference shares.
On July 2, 2019, affiliates of ACGL purchased $35 million in aggregate principal amount of the Company’s 6.5% senior notes due July 2, 2029. On August 1, 2019, affiliates of ACGL received $11.5 million in connection with the Company’s redemption of its preference shares.
Certain directors, executive officers and management of ACGL own common and preference shares of the Company.
The related balances presented in the consolidated statements of income (loss) for the three and six months ended June 30, 2020 and 2019 were as follows:
Three Months Ended June 30, | Six Months Ended June 30, | ||||||||||||||
2020 | 2019 | 2020 | 2019 | ||||||||||||
($ in thousands) | |||||||||||||||
Consolidated statements of income (loss) items: | |||||||||||||||
Interest expense | $ | 582 | $ | — | $ | 1,164 | $ | — | |||||||
Preference dividends | 73 | 325 | 151 | 650 | |||||||||||
AUL and AUI
Watford Re and WICE entered into services agreements with AUL. WSIC and WIC entered into services agreements with AUI. AUL and AUI provide services related to the management of the underwriting portfolio for a term ending in December 2025. The services agreements perpetually renew automatically in five-year increments unless either the Company or Arch gives notice to not renew at least 24 months before the end of the then-current term.
As part of the services agreements, AUL and AUI make available to the Companies, on a non-exclusive basis, certain designated employees who serve as officers of the Companies and underwrite business on behalf of the Companies (the “Designated Employees”). AUL and AUI also provide portfolio management, Designated Employee supervision, exposure modeling, loss reserve recommendations, claims-handling, accounting and other related services as part of the services agreements.
In return for their services, AUL and AUI receive fees from the Companies, including an underwriting fee and profit commission, as well as reimbursement for the services of the Designated Employees and reimbursements for an allocated portion of the expenses related to seconded employees, plus other expenses incurred on behalf of the Company.
42
WATFORD HOLDINGS LTD.
NOTES TO THE CONSOLIDATED FINANCIAL STATEMENTS (UNAUDITED)
(U.S. dollars in thousands, except share data)
The related AUL and AUI fees and reimbursements incurred in the consolidated statements of income (loss) for the three and six months ended June 30, 2020 and 2019 were as follows:
Three Months Ended June 30, | Six Months Ended June 30, | ||||||||||||||
2020 | 2019 | 2020 | 2019 | ||||||||||||
($ in thousands) | |||||||||||||||
Consolidated statements of income (loss) items: | |||||||||||||||
Acquisition expenses | $ | 6,942 | $ | 5,861 | $ | 13,505 | $ | 10,809 | |||||||
General and administrative expenses | 1,148 | 2,008 | 2,136 | 4,019 | |||||||||||
Total | $ | 8,090 | $ | 7,869 | $ | 15,641 | $ | 14,828 | |||||||
Reinsurance transactions with ACGL affiliates
The Company reinsures ARL and other ACGL subsidiaries and affiliates for property and casualty risks on a quota share basis. ACGL cedes business to the Company pursuant to inward retrocession agreements the Company’s operating subsidiaries have entered into with ACGL. Pursuant to these inward retrocession agreements, the Company pays a ceding fee based on the business ceded and the terms of the applicable retrocession agreement. Such fees, in addition to origination fees, are reflected in “acquisition expenses” on the Company’s consolidated statements of income (loss).
The related consolidated statements of income (loss) for the three and six months ended June 30, 2020 and 2019 were as follows:
Three Months Ended June 30, | Six Months Ended June 30, | ||||||||||||||
2020 | 2019 | 2020 | 2019 | ||||||||||||
($ in thousands) | |||||||||||||||
Consolidated statements of income (loss) items: | |||||||||||||||
Gross premiums written | $ | 30,371 | $ | 38,890 | $ | 111,719 | $ | 110,895 | |||||||
Net premiums earned | 51,067 | 66,913 | 109,853 | 128,751 | |||||||||||
Losses and loss adjustment expenses | 40,759 | 54,894 | 87,300 | 100,263 | |||||||||||
Acquisition expenses (1) | 13,153 | 20,890 | 27,006 | 40,805 | |||||||||||
(1) Acquisition expenses relating to the ACGL inward quota share agreements referred to above. For the three months ended June 30, 2020 and 2019, the Company incurred ceding fees to Arch, in aggregate, of $3.8 million and $4.8 million, respectively, under these inward retrocession agreements. For the six months ended June 30, 2020 and 2019, the Company incurred ceding fees to Arch, in aggregate, of $7.8 million and $9.0 million, respectively, under these inward retrocession agreements.
Separately, the Company’s operating subsidiaries have entered into outward quota share retrocession or reinsurance agreements with ACGL subsidiaries. Specifically, each of Watford Re and WICE has entered into a separate outward quota share retrocession or reinsurance agreement with ARL, and each of WSIC and WIC has entered into a separate outward quota share reinsurance agreement with ARC.
43
WATFORD HOLDINGS LTD.
NOTES TO THE CONSOLIDATED FINANCIAL STATEMENTS (UNAUDITED)
(U.S. dollars in thousands, except share data)
The related consolidated statements of income (loss) for the three and six months ended June 30, 2020 and 2019 for the outward retrocession transactions were as follows:
Three Months Ended June 30, | Six Months Ended June 30, | ||||||||||||||
2020 | 2019 | 2020 | 2019 | ||||||||||||
($ in thousands) | |||||||||||||||
Consolidated statements of income (loss) items: | |||||||||||||||
Gross premiums ceded | $ | (17,174 | ) | $ | (15,844 | ) | $ | (37,002 | ) | $ | (32,834 | ) | |||
Net premiums earned | (20,261 | ) | (14,411 | ) | (40,049 | ) | (27,351 | ) | |||||||
Losses and loss adjustment expenses | (17,558 | ) | (15,784 | ) | (33,373 | ) | (24,921 | ) | |||||||
Acquisition expenses (1) | (3,319 | ) | (3,584 | ) | (7,857 | ) | (6,688 | ) | |||||||
(1) Acquisition expenses relating to the ACGL outward quota share agreements referred to above.
The related consolidated balance sheet account balances as of June 30, 2020 and December 31, 2019 were as follows:
June 30, | December 31, | ||||||
2020 | 2019 | ||||||
($ in thousands) | |||||||
Consolidated balance sheet items: | |||||||
Total investments | $ | 775,016 | $ | 815,528 | |||
Premiums receivable | 96,475 | 106,462 | |||||
Reinsurance recoverable on unpaid and paid losses and loss adjustment expenses | 101,356 | 79,597 | |||||
Prepaid reinsurance premiums | 71,578 | 75,249 | |||||
Deferred acquisition costs, net | 29,894 | 31,609 | |||||
Funds held by reinsurers | 29,629 | 29,867 | |||||
Reserve for losses and loss adjustment expenses | 680,444 | 693,861 | |||||
Unearned premiums | 139,632 | 143,852 | |||||
Losses payable | 47,812 | 39,619 | |||||
Reinsurance balances payable | 53,387 | 62,301 | |||||
Senior notes | 34,511 | 34,484 | |||||
Amounts due to affiliates | 4,542 | 4,467 | |||||
Other liabilities - contingent commissions | 4,033 | 5,516 | |||||
Contingently redeemable preference shares | 3,465 | 3,462 | |||||
AIM
Watford Re, WSIC, WICE and WIC entered into investment management agreements with AIM pursuant to which AIM manages a portion of our investment grade portfolio. Each of the Watford Re, WICE, WSIC and WIC investment management agreements with AIM has a one-year term, with the terms ending annually on March 31, July 31, January 31 and July 31, respectively. The terms will continue to renew for successive one-year periods; provided, however, that either party may terminate any of the investment management agreements with AIM at any time upon 45 days prior written notice. To date, there has been no such notice filed under such agreements.
44
WATFORD HOLDINGS LTD.
NOTES TO THE CONSOLIDATED FINANCIAL STATEMENTS (UNAUDITED)
(U.S. dollars in thousands, except share data)
In return for its investment management services, AIM receives a monthly management fee. The management fee is based on a percentage of the aggregate asset value of the AIM managed portfolio. For the purposes of calculating the management fees, asset value is determined by AIM in accordance with the investment management agreements and is measured before deduction of any management fees or expense reimbursement. The Company has also agreed to reimburse AIM for additional services related to investment consulting and oversight services, administrative operations and risk analytic support services related to the management of the Company’s portfolio, as set forth in the investment management agreements.
The related consolidated statements of income (loss) for the three and six months ended June 30, 2020 and 2019 were as follows:
Three Months Ended June 30, | Six Months Ended June 30, | ||||||||||||||
2020 | 2019 | 2020 | 2019 | ||||||||||||
Consolidated statements of income (loss) items: | ($ in thousands) | ||||||||||||||
Investment management fees - related parties | $ | 223 | $ | 273 | $ | 476 | $ | 535 | |||||||
HPS
Certain HPS principals and management own common and preference shares of the Company.
In return for its investment services, HPS receives a management fee, a performance fee and allocated operating expenses. The management fee is calculated at an annual rate of 1.0% of the aggregate net asset value of the assets that are managed by HPS for the first $1.5 billion in net asset value, and 0.75% of the aggregate net value of assets exceeding $1.5 billion, payable quarterly in arrears. For purposes of calculating the management fees, net asset value is determined by HPS in accordance with the investment management agreements and is measured before reduction for any management fees, performance fees or any expense reimbursement and is adjusted for any non-routine intra-month withdrawals. The Company has also agreed to reimburse HPS for certain expenses related to the management of the Company’s investment portfolios as set forth in the investment management agreements.
The base performance fee is equal to 10% of the Income (as defined in the investment management agreements relating to Watford Re, WICE and Watford Trust) or Aggregate Income (as defined in the investment management agreements relating to WSIC and WIC), as applicable, if any, on the assets managed by HPS, calculated and payable as of each fiscal year-end and the date on which the investment management agreements are terminated and not renewed, and HPS is eligible to earn an additional performance fee equal to 25% of any Excess Income (as defined in the investment management agreements) in excess of a net 10% return to Watford after deduction for paid and accrued management fees and base performance fees, with the total performance fees not to exceed 17.5% of the Income or Aggregate Income, as applicable. No performance fees will be paid to HPS if the high water mark (as described in the investment management agreements with HPS) is not met.
During 2017, the Company invested $50.0 million in a private fund (“Master Fund”) as part of HPS’s investment strategy. HPS acts as the Trading Manager and provides certain administrative management services to the Master Fund. During 2019, the Company fully redeemed its investment in the Master Fund.
During 2019, the Company invested $28.7 million in a limited partnership as part of HPS’s investment strategy. HPS acts as the general partner and manager of the limited partnership. At June 30, 2020, the Company’s investment had a fair value of $34.1 million and represented approximately 12% of the outstanding partnership interests. The management fees and
45
WATFORD HOLDINGS LTD.
NOTES TO THE CONSOLIDATED FINANCIAL STATEMENTS (UNAUDITED)
(U.S. dollars in thousands, except share data)
performance fees on the limited partnership will be subject to the existing fee structure of the existing investment management agreement between the Company and HPS, as discussed above.
The related consolidated statements of income (loss) for the three and six months ended June 30, 2020 and 2019, and consolidated balance sheet account balances for HPS management fees and performance fees as of June 30, 2020 and December 31, 2019 were as follows:
Three Months Ended June 30, | Six Months Ended June 30, | ||||||||||||||
2020 | 2019 | 2020 | 2019 | ||||||||||||
($ in thousands) | |||||||||||||||
Consolidated statements of income (loss) items: | |||||||||||||||
Investment management fees - related parties | $ | 4,039 | $ | 4,297 | $ | 8,138 | $ | 8,444 | |||||||
Investment performance fees - related parties | — | 1,692 | — | 7,492 | |||||||||||
$ | 4,039 | $ | 5,989 | $ | 8,138 | $ | 15,936 | ||||||||
June 30, | December 31, | ||||||
2020 | 2019 | ||||||
($ in thousands) | |||||||
Consolidated balance sheet items: | |||||||
Other investments, at fair value | $ | 34,142 | $ | 30,461 | |||
Investment management and performance fees payable | 5,511 | 17,762 | |||||
Artex
In 2015, WICE and AUL entered into an insurance management services agreement with Artex Risk Solutions (Gibraltar) Limited, or Artex, pursuant to which Artex provides services to WICE relating to management, secretarial, governance, underwriting, claims, reinsurance, financial management, investment, regulatory, compliance, risk management and Solvency II. In addition, two principals of Artex have been appointed directors of WICE. In exchange for these services, the Company pays Artex fees based on WICE’s gross premiums written, subject to a minimum amount of £150,000 per annum and a maximum amount of £400,000 per annum, in each case subject to an inflation increase on an annual basis. The insurance management services agreement may be terminated by either Artex or WICE upon twelve months prior written notice; provided that the agreement is subject to earlier termination by WICE or Artex upon the occurrence of certain events.
The table below provides the aggregate fees the Company paid to Artex under the insurance management services agreement for the three and six months ended June 30, 2020 and 2019.
Three Months Ended June 30, | Six Months Ended June 30, | ||||||||||||||
2020 | 2019 | 2020 | 2019 | ||||||||||||
($ in thousands) | |||||||||||||||
Fees paid to Artex under insurance management services agreement | $ | 166 | $ | 45 | $ | 252 | $ | 176 | |||||||
For the three and six months ended June 30, 2020 and 2019, the Company paid no fees to Arch under this insurance management services agreement.
46
WATFORD HOLDINGS LTD.
NOTES TO THE CONSOLIDATED FINANCIAL STATEMENTS (UNAUDITED)
(U.S. dollars in thousands, except share data)
13. Commitments and contingencies
Concentrations of credit risk
For our reinsurance agreements, the creditworthiness of a counterparty is evaluated by the Company, taking into account credit ratings assigned by independent agencies. The credit approval process involves an assessment of factors, including, among others, the counterparty country and industry exposures. Collateral may be required, at the discretion of the Company, on certain transactions based on the creditworthiness of the counterparty.
The areas where significant concentrations of credit risk may exist include unpaid losses and loss adjustment expenses recoverable, prepaid reinsurance premiums and paid losses and loss adjustment expenses recoverable net of reinsurance balances payable (collectively, “net reinsurance recoverables”), investments and cash and cash equivalent balances.
The Company’s reinsurance recoverables, and prepaid reinsurance premiums, net of reinsurance balances payable, resulting from reinsurance agreements entered into with ARL and ARC as of June 30, 2020 and December 31, 2019 amounted to $119.5 million and $92.5 million, respectively. ARL and ARC have “A+” credit ratings from A.M. Best.
A credit exposure exists with respect to reinsurance recoverables as they may become uncollectible. The Company manages its credit risk in its reinsurance relationships by transacting with reinsurers that it considers financially sound and, if necessary, the Company may hold collateral in the form of funds, trust accounts and/or irrevocable letters of credit. This collateral can be drawn on for amounts that remain unpaid beyond specified time periods on an individual reinsurer basis.
In addition, the Company underwrites a significant amount of its business through brokers and a credit risk exists should any of these brokers be unable to fulfill their contractual obligations with respect to the payments of insurance and reinsurance balances owed to the Company.
The Company’s investment portfolios are managed in accordance with investment guidelines that include standards of diversification, which limit the allowable holdings of any single issuer. There were no investments in any entity in excess of 10% of the Company’s shareholders’ equity at June 30, 2020 and December 31, 2019, other than cash and cash equivalents held in operating and investment accounts with financial institutions with credit ratings between “A” and “AA-.”
Lloyds letter of credit facility
On May 15, 2020, Watford Re renewed its letter of credit facility with Lloyds Bank Corporate Markets Plc, New York Branch (the “Lloyds Facility”). The Lloyds Facility amount is $100.0 million and was renewed through to May 16, 2021. Under the renewed Lloyds Facility, the Company may request an increase in the facility amount, up to an aggregate of $50.0 million. The principal purpose of the Lloyds Facility is to issue, as required, evergreen standby letters of credit in favor of primary insurance or reinsurance counterparties with which the Company has entered into reinsurance arrangements to ensure that such counterparties are permitted to take credit for reinsurance obtained from the Company as required under insurance regulations in the United States. The amount of letters of credit issued is driven by, among other things, the timing and payment of catastrophe losses, loss development of existing reserves, the payment pattern of such reserves, the further expansion of the Company’s business and the loss experience of such business. When issued, the letters of credit are secured by certificates of deposit or cash. In addition, the Lloyds Facility also requires the maintenance of certain covenants, with which the Company was in compliance at June 30, 2020 and December 31, 2019. At such dates, the Company had $48.7 million and $51.0 million, respectively, in restricted assets as collateral for outstanding letters of credit issued from the Lloyds Facility, which were secured by certificates of deposit. These collateral amounts are reflected as short-term investments in the Company’s consolidated balance sheets.
47
WATFORD HOLDINGS LTD.
NOTES TO THE CONSOLIDATED FINANCIAL STATEMENTS (UNAUDITED)
(U.S. dollars in thousands, except share data)
Unsecured letter of credit facility
On September 20, 2019, Watford Re signed a 364-day letter of credit agreement with Lloyds Bank Corporate Markets Plc and BMO Capital Markets Corp. (the “Unsecured Facility”). The Unsecured Facility amount is $100.0 million, and will be automatically extended for a period of one year unless canceled or not renewed by either counterparty prior to expiration. The principal purpose of the Unsecured Facility is to issue, as required, evergreen standby letters of credit in favor of primary insurance or reinsurance counterparties with which the Company has entered into reinsurance arrangements to ensure that such counterparties are permitted to take credit for reinsurance obtained from the Company as required under insurance regulations in the United States. The amount of letters of credit issued is driven by, among other things, the timing and payment of catastrophe losses, loss development of existing reserves, the payment pattern of such reserves, the further expansion of the Company’s business and the loss experience of such business. The Unsecured Facility requires the maintenance of certain covenants, as well as certain representations and warranties that are customary for facilities of this type. At June 30, 2020 and December 31, 2019, the Company had $25.2 million and $19.3 million, respectively, in outstanding letters of credit issued from the Unsecured Facility, and was in compliance with the Unsecured Facility requirements. At such dates, the Company had $25.2 million and $Nil, respectively, in certificates of deposit held as restricted collateral related to outstanding letters of credit issued from the Unsecured Facility. These collateral amounts are reflected as short-term investments in the Company’s consolidated balance sheets.
Bank of America secured credit facility
On November 30, 2017, Watford Re amended and restated its $800.0 million secured credit facility (the “Secured Facility”) with Bank of America, N.A., which expires on November 30, 2021. The purpose of the Secured Facility is to provide borrowings, backed by Watford Re’s investment portfolios. In addition, the Secured Facility allows for Watford Re to issue up to $400.0 million in evergreen standby letters of credit in favor of primary insurance or reinsurance counterparties with which the Company has entered into reinsurance arrangements. At June 30, 2020, Watford Re had $335.6 million and $52.5 million in borrowings and outstanding letters of credit, respectively. At December 31, 2019, Watford Re had $484.3 million and $52.5 million in borrowings and outstanding letters of credit, respectively. At June 30, 2020 and December 31, 2019, Watford Re was in compliance with all covenants contained in the Secured Facility.
Custodian bank facilities
As of June 30, 2020 and December 31, 2019, Watford Re had $136.8 million and $Nil, respectively, in borrowings from our custodian banks to purchase U.S. dollar denominated securities.
As of June 30, 2020, the total borrowed amount of $136.8 million included 0.6 million Euros, or EUR, (U.S. dollar equivalent of $0.7 million) to purchase EUR-denominated securities. The Company pays interest based on 3-month LIBOR plus a margin and the borrowed amount is payable upon demand. The foreign exchange gain or loss on revaluation on the non-U.S. dollar-denominated borrowed funds is included as a component of “net foreign exchange gains (losses)” included in the Company’s consolidated statements of net income (loss).
The custodian banks require the Company to hold cash and investments on deposit, or in an investment account with respect to the borrowed funds. At June 30, 2020 and December 31, 2019, the Company was required to hold $214.9 million and $Nil, respectively, in such deposits and investment accounts.
Employment and other arrangements
The Company has employment agreements with certain of its executive officers. Such employment arrangements provide for compensation in the form of base salary, annual bonus, participation in
48
WATFORD HOLDINGS LTD.
NOTES TO THE CONSOLIDATED FINANCIAL STATEMENTS (UNAUDITED)
(U.S. dollars in thousands, except share data)
the Company’s employee benefit programs, the Company’s share-based compensation plans and the reimbursements of expenses.
Investment commitments
As of June 30, 2020, the Company had unfunded commitments of $23.1 million relating to equities within its investment portfolios. As of December 31, 2019, the Company had unfunded commitments of $8.4 million relating to term loans and $26.4 million relating to equities within its investment portfolios.
Acquisition commitments
The Company has entered into an agreement to acquire Axeria IARD, a property and casualty insurance company based in France. The Company has committed to acquiring 100% of the capital stock of Axeria IARD from the APRIL group. The completion of this transaction is subject to regulatory approval and other customary closing conditions, and is expected to close in the second half of 2020.
14. Leases
The Company has entered into a lease agreement for real estate that is used for office space in the ordinary course of business. The lease is accounted for as an operating lease, whereby the lease expense is recognized on a straight-line basis over the term of the lease.
The lease includes an option to extend or renew the lease term. The exercise of the renewal option is at the Company’s discretion. The operating lease liability includes lease payments related to options to extend or renew the lease term if the Company is reasonably certain of exercising those options. Such options relating to the extension or renewal of the lease term are not included in the operating lease liability at this time.
Lease expense is included in “general and administrative expenses” in the Company’s consolidated statements of net income (loss). Additional information regarding the Company’s real estate operating lease is as follows.
Three Months Ended June 30, 2020 | Six Months Ended June 30, 2020 | ||||||
($ in thousands) | |||||||
Lease cost: | |||||||
Operating lease | $ | 62 | $ | 124 | |||
Other information on operating lease: | |||||||
Cash payments included in the measurement of lease liability reported in operating cash flows | 71 | 142 | |||||
Right-of-use assets (1) | 845 | 845 | |||||
Operating lease liability (2) | 845 | 845 | |||||
Weighted average discount rate | 3.9 | % | 3.9 | % | |||
Weighted average remaining lease term in years | 3.25 years | 3.25 years | |||||
(1) Included in “other assets” on the Company’s consolidated balance sheet.
(2) Included in “other liabilities” on the Company’s consolidated balance sheet.
49
WATFORD HOLDINGS LTD.
NOTES TO THE CONSOLIDATED FINANCIAL STATEMENTS (UNAUDITED)
(U.S. dollars in thousands, except share data)
The following tables present the contractual maturity of the Company’s lease liability:
June 30, 2020 | ||
($ in thousands) | ||
Remainder of 2020 | 142 | |
2021 | 283 | |
2022 | 283 | |
2023 | 189 | |
Total undiscounted lease payments | 897 | |
Less: present value adjustment | (52 | ) |
Operating lease liability | 845 | |
15. Senior notes
On July 2, 2019, the Company completed a private offering of $175.0 million in aggregate principal amount of its 6.5% senior notes due July 2, 2029. Interest on the senior notes is paid semi-annually in arrears on each January 2 and July 2, which commenced on January 2, 2020. The $172.3 million net proceeds from the offering were used to redeem a portion of the Company’s outstanding preference shares, as described in Note 16, “Contingently redeemable preference shares”. Affiliates of ACGL purchased $35 million in aggregate principal amount of the senior notes.
The senior notes are the Parent’s senior unsecured and unsubordinated obligations and rank equally with all of the other existing and future obligations of the Parent that are unsecured and unsubordinated. The Company may redeem the senior notes at any time, in whole or in part, prior to July 2, 2024, at “make-whole” redemption price, subject to BMA requirements. After July 2, 2024, the senior notes are redeemable, in whole or in part, at a redemption price equal to 100% of the principal amount, subject to BMA requirements. The indenture governing the senior notes contains certain customary covenants, including those related to the punctual payment of interest and principal amounts due. The Company was in compliance with such covenants at June 30, 2020.
As of June 30, 2020, the carrying amount of the senior notes was $172.6 million, presented net of unamortized debt issuance costs of $2.4 million. As of December 31, 2019, the carrying amount of the senior notes was $172.4 million, presented net of unamortized debt issuance costs of $2.6 million.
16. Contingently redeemable preference shares
In March 2014, the Company issued 9,065,200 8½% Cumulative Redeemable Preference Shares (the “preference shares”). The preference shares have a par value of $0.01 per share and a liquidation preference of $25.00 per share. The preference shares were issued at a discounted purchase price of $24.50 per share. Holders of the preference shares are entitled to receive, if declared by the board of directors, quarterly cash dividends on the last day of March, June, September and December of each year. Prior to June 30, 2019, dividends on the preference shares accrued at a fixed rate of 8.5% per annum (the “Fixed Rate Period”). Dividends accrue from (and including) June 30, 2019 (the “Floating Rate Period”), at a floating rate per annum (the “Floating Rate”) equal to three-month U.S. dollar LIBOR plus a margin of 667.85 basis points; provided, that, if, at any time, the three-month U.S. dollar LIBOR shall be less than 1%, then the three-month U.S. dollar LIBOR for purposes of calculating the Floating Rate at the time of such calculation shall be 1%. The preference shares may be redeemed by the Company on or after June 30, 2019 or at the option of the preference shareholders at any time on or after June 30, 2034 at the liquidation price of $25.00 per share. Because the redemption features are not solely within the control of the Company, the preference
50
WATFORD HOLDINGS LTD.
NOTES TO THE CONSOLIDATED FINANCIAL STATEMENTS (UNAUDITED)
(U.S. dollars in thousands, except share data)
shares have been recorded as mezzanine equity on the Company’s consolidated balance sheets in accordance with applicable accounting guidance. Preference share dividends, including the accretion of the discount and issuance costs, are included in “preference dividends” in the Company’s consolidated statements of income (loss).
On August 1, 2019, the Company redeemed 6,919,998 of its 9,065,200 total issued and outstanding preference shares, which were redeemed at a total redemption price of $25.19748 per share, inclusive of all declared and unpaid dividends, with accumulation of any undeclared dividends on or after June 30, 2019. After the redemption date, dividends on the preference shares that were redeemed ceased to accrue, and such redeemed preference shares ceased to be outstanding. Affiliates of Arch Capital Group Ltd. received $11.5 million in connection with the redemption of the preference shares.
For the three months ended June 30, 2020 and 2019, dividends paid on the preference shares totaled $1.1 million and $4.8 million, respectively. For the six months ended June 30, 2020 and 2019, dividends paid on the preference shares totaled $2.2 million and $9.6 million, respectively.
The following table presents a reconciliation of the preference shares for the six months ended June 30, 2020 and 2019:
Six Months Ended June 30, | |||||||
2020 | 2019 | ||||||
($ in thousands) | |||||||
Preference shares: | |||||||
Balance at the beginning of the period | $ | 52,305 | $ | 220,992 | |||
Accretion discount and issuance costs on remaining preference shares | 46 | 183 | |||||
Balance at the end of the period | $ | 52,351 | $ | 221,175 | |||
17. Share transactions
Share-based compensation
The Company uses share-based compensation plans for officers, other employees and directors of the Parent and its subsidiaries to provide competitive compensation opportunities, to encourage long-term service, to recognize individual contributions and reward achievement of performance goals and to promote the creation of long-term value for shareholders by aligning the interests of such persons with those of shareholders.
The 2018 Stock Incentive Plan (the “2018 Plan”) became effective as of March 28, 2019 following approval by the Board of Directors of the Company and the listing of the Company’s common shares on the Nasdaq Global Select Market. The 2018 Plan provides for the issuance of restricted share units, performance units, restricted shares, performance shares, share options and share appreciation rights and other equity-based awards to the Company’s employees and directors. The 2018 Plan authorizes the issuance of 907,315 common shares and will terminate on March 28, 2029. As of June 30, 2020, 678,437 shares were available for future issuance.
During the first quarter of 2020, the Company granted an aggregate of 63,591 restricted share units and common shares to certain officers, other employees and directors. On the grant date of March 1, 2020, the fair value of the restricted share units and common shares was approximately $23.00 per share. Of the total restricted share units and common shares granted, 14,675 were vested and fully expensed, including 10,870 common shares issued. The remaining 48,916 restricted share units are being amortized over a three-year vesting period, being the requisite service period. There were no forfeitures or expired awards during the second quarter of 2020.
51
WATFORD HOLDINGS LTD.
NOTES TO THE CONSOLIDATED FINANCIAL STATEMENTS (UNAUDITED)
(U.S. dollars in thousands, except share data)
During the second quarter of 2020, the Company issued 100,958 common shares, of which 27,456 were vested and fully expensed, relating to restricted share units granted on April 26, 2019.
The effect of compensation cost arising from share-based payment awards on the Company’s consolidated statements of income (loss), within “general and administrative expenses,” for the three months ended June 30, 2020 and 2019, was $0.2 million and $2.3 million, respectively. The effect of compensation cost arising from such share-based payment awards for the six months ended June 30, 2020 and 2019 was $0.9 million and $2.3 million, respectively. The compensation cost for the three and six months ended June 30, 2019 included a one-time accelerated long-term incentive expense recognition for retirement eligible employees.
Share repurchase program
In the first quarter of 2020, the board of directors of the Parent authorized the Company’s investment in its common shares through a share repurchase program under which the Company may repurchase up to $50 million of its outstanding common shares (the “current share repurchase program”).
During the first quarter of 2020, the Company purchased 127,744 shares at an average price per share of $22.42 under the current share repurchase program. As of June 30, 2020, approximately $47.1 million of unused share repurchase capacity remained available under the current share repurchase program. Since the inception of the share repurchase programs in 2019, the Company has repurchased a total of 2.9 million shares. At June 30, 2020, the shares are held in treasury, at an aggregate cost of $77.9 million (excluding transaction costs).
Repurchases under the current share repurchase program may be effected from time to time in open market or privately negotiated transactions. The timing and amount of repurchase transactions under this program will depend on a variety of factors, including market conditions and corporate and regulatory considerations. Repurchases of the Company’s common shares in connection with the current share repurchase program and other share-based transactions are recorded at cost and result in a reduction of the Company’s shareholders’ equity in its consolidated balance sheets.
18. Legal proceedings
The Company, in common with the insurance industry in general, is subject to litigation and arbitration in the normal course of its business. As of June 30, 2020, the Company was not a party to any litigation or arbitration, which is expected by management to have a material adverse effect on the Company’s results of operations or financial condition and liquidity.
52
Item 2. Management’s discussion and analysis of financial condition and results of operations
The following discussion and analysis of our financial condition and results of operations contains forward-looking statements, which involve inherent risks and uncertainties. All statements other than statements of historical fact are forward-looking statements. These statements are based on our current assessment of risks and uncertainties. Actual results may differ materially from those expressed or implied in these statements and, therefore, undue reliance should not be placed on them. Important factors that could cause actual events or results to differ materially from those indicated in such statements are discussed elsewhere in this report, including the sections entitled Part I “Financial information - Cautionary note regarding forward-looking statements” and Part II Item 1A “Risk factors.”
This discussion and analysis should be read in conjunction with our consolidated financial statements and notes thereto included in Part I Item 1 “Consolidated financial statements” of this report. Tabular amounts are in U.S. dollars in thousands, except share amounts, unless otherwise noted.
Overview
We are a global property and casualty, or P&C, insurance and reinsurance company with approximately $1.0 billion in capital as of June 30, 2020, comprised of $172.6 million of senior notes, $52.4 million of contingently redeemable preference shares and $776.2 million of common shareholders’ equity. Through operations in Bermuda, the United States and Europe, we write insurance and reinsurance on a worldwide basis. Our objective is to deliver attractive returns to shareholders by combining disciplined underwriting with superior investment management. Our strategy combines a diversified, casualty-focused underwriting portfolio, accessed through our multi-year, renewable strategic underwriting management relationship with Arch, with a disciplined investment strategy comprised primarily of non-investment grade corporate credit assets, managed by HPS. In addition, we have a services arrangement with AIM and other Investment Managers to manage our investment grade portfolio.
While we are positioned to provide a full range of P&C lines, we focus on writing specialty lines of business. We believe that our experienced management team, our relationship with Arch and our strong capital base have enabled us to successfully compete and establish a meaningful presence in the insurance and reinsurance markets in which we participate.
We seek to generate an attractive return on average equity across the relevant insurance and investment cycles. We opportunistically seek to underwrite new lines that fit our return profile while maintaining a disciplined underwriting approach.
Current outlook
The outbreak of COVID-19 began significantly impacting the U.S. and global markets during the 2020 first quarter. Following the 2020 first quarter, the COVID-19 global pandemic has continued to cause unprecedented economic volatility and disruption globally. We remain committed to the safety of our employees, including restricting travel and instituting an extensive work from home policy. These actions have helped prevent a major disruption to our operations or our ability to service our clients.
The impact of the COVID-19 global pandemic on the worldwide economy has changed some aspects of our outlook. There could be elevated claims activity in certain lines of business and growth in written premium may be harder to achieve in a recessionary economy. At this time, there continue to be significant uncertainty surrounding the ultimate number of insurance claims and scope of damage resulting from this pandemic. Our estimates across our insurance and reinsurance lines of business are based on currently available information derived from modeling techniques, preliminary claims information obtained from our clients and brokers, a review of relevant in-force
53
contracts with potential exposure to the pandemic and estimates of reinsurance recoverables. These estimates include losses related only to claims incurred as of June 30, 2020. Actual losses from these events may vary materially from the estimates due to several factors, including the inherent uncertainties in making such determinations and the evolving nature of this pandemic. In spite of these challenges, we will continue to look for opportunities to find acceptable books of business to underwrite without sacrificing underwriting discipline and will continue to focus on writing medium to long tail business. The severity, duration and long-term impacts of the COVID-19 global pandemic are difficult to predict, but we remain committed to our clients and the markets we serve.
In the quarter, we recorded approximately $5.2 million for COVID-19 global pandemic losses, mainly arising from our property catastrophe line of business. These reserves were established for policies which may provide business interruption coverage, with a smaller provision for certain casualty lines. While it is difficult to accurately quantify our potential exposure to the pandemic, we established this provision during the quarter.
We believe that we are relatively less exposed to COVID-19 global pandemic-related underwriting losses than many industry peers. For example, we have either no, or de minimis, premium writings in life, accident and health, event cancellation, trade credit, travel or pandemic-specific coverages which are likely to respond directly to COVID-19 global pandemic-related losses. With regard to the potential exposure to business interruption losses, we write a limited amount of commercial property exposure, mainly emanating from our property catastrophe line of business, which is consistent with our strategy to target longer duration lines of business. During the second quarter of 2020, we recognized a COVID-19 loss provision of $5.2 million, or 4.0 loss ratio points, almost exclusively arising from business interruption coverage in our property catastrophe reinsurance line of business.
We believe that mortgage insurance may potentially be affected. We write U.S. mortgage risk through a government sponsored enterprise (or “GSE”) credit risk transfer program and have some international mortgage exposure. Most of our exposure is for mortgages that were originated prior to 2018. Based upon an internal actuarial review, we have increased our loss provision in the first six months to account for a potential increase in defaults in our mortgage insurance portfolio.
In April 2020, we significantly reduced our exposure to U.S. mortgage risk by transferring part of that risk to other parties. This action bolstered our economic capital position at a time of significant macro-economic uncertainty. While the transferred business had been profitable, we believe this was a prudent and responsible course of action given the negative and uncertain economic outlook created by the pandemic.
We believe the casualty lines most likely to be adversely affected by the COVID-19 global pandemic are professional and medical malpractice liability. Other than the nominal casualty provision mentioned earlier, we have not added IBNR above our loss reserves for COVID-19 global pandemic losses occurring prior to June 30, 2020.
On a brighter note, we believe the insurance and reinsurance market environment is showing signs of noticeable price improvement. Primary rates in most casualty lines, with the exception of workers’ compensation, continue to be strong, albeit, we believe, partly in response to higher perceived social inflation. Property catastrophe reinsurance rates are up meaningfully, retrocession capacity is shrinking, and ceding commissions have reduced modestly on some proportional casualty treaties. We believe the factors supporting a continued favorable pricing environment include the low interest rate environment, three consecutive years of significant multiple catastrophe events, and signs of weakness in the adequacy of prior period loss reserves for some industry participants.
Against this backdrop, we are selectively growing our business in areas that we believe present attractive opportunities and meet our risk and return criteria. In particular, we continue to see good growth opportunities in the insurance market. In particular, our insurance underwriting platforms in the United States continue their growth in premiums for 2020.
54
We also see opportunities on the reinsurance side in general liability, commercial auto liability and other casualty lines. Our current underwriting portfolio has concentrations in general liability, professional liability, multiline, workers’ compensation and motor product lines through reinsurance of third-party cedants and retrocessions from Arch.
Our outsourced business model
We have engaged Arch and HPS to perform certain services for us that are essential to the results of our operations, and have entered into long-term, renewable contracts with each in order to ensure continued access to these services. For our underwriting operations, Arch provides underwriting services including sourcing and evaluating underwriting opportunities as well as related services such as claims-handling, loss control, exposure management, portfolio management, modeling, statistical, actuarial and administrative support services, in each case, subject to our underwriting and operational guidelines and the oversight of our senior management and board of directors. With regard to our investments, HPS manages our non-investment grade portfolio while AIM manages the largest portion of our investment grade portfolio, in each case subject to compliance with our investment guidelines and the oversight of our senior management and board of directors. We outsource these functions in order to cost-effectively leverage the respective expertise and strong market positions of our trusted partners. Through our association with Arch, we access Arch’s worldwide platform on a variable cost basis, thus avoiding the fixed expense of maintaining a multi-line platform for our underwriting operations. Similarly, we believe that the terms of service and structure of the compensation we pay to HPS and AIM provide benefits to us both in terms of cost-effective access to the expertise required to execute our investment strategy and in aligning interests.
Natural catastrophe risk
While we are more casualty-focused and assume less catastrophe exposure than many of our peers, we do underwrite a limited amount of natural catastrophe risk in order to balance and diversify our underwriting portfolio. We carefully monitor our natural catastrophe risk globally for all perils and regions where we believe our underwriting portfolio might have significant exposure. Recently, Arch has been increasing its writings in this line in response to an improving rate environment and, as a result, our premiums have grown in proportion.
Limited operating history and comparability of results
We were incorporated in July 2013 and completed our initial funding and began underwriting business in the first quarter of 2014. Our initial underwriting activities focused on writing reinsurance. In 2015, we began our insurance business in connection with the establishment of our U.S. and European insurance platforms. As a result, we have a limited operating history and, given our underwriting and investment strategies, are exposed to volatility in our results of operations that may not be apparent from a review of our historical results. Period-to-period comparisons of our results of operations may not be meaningful. In addition, the amount of premiums written may vary from year to year and period to period as a result of any number of factors, including changes in market conditions and our view of the long-term profit potential of individual lines of business.
Financial measures and ratios
Our management and board of directors use financial indicators and ratios in evaluating our performance and measuring the overall growth in value generated for our common shareholders. The key financial measures that we believe are meaningful in analyzing our performance are: underwriting income (loss), combined ratio, adjusted underwriting income (loss), adjusted combined ratio, net interest income, net interest income yield on average net assets (including the non-investment grade portfolio and investment grade portfolio components thereof), net investment income (loss), net investment income return on average net assets, net investment income return on average total investments (excluding accrued investment income), (including the
55
non-investment grade portfolio and investment grade portfolio components thereof), book value per diluted common share, growth in book value per diluted common share and return on average equity.
The table below shows the key performance indicators for the three and six months ended June 30, 2020 and 2019:
Three Months Ended June 30, | Six Months Ended June 30, | ||||||||||||||
2020 | 2019 | 2020 | 2019 | ||||||||||||
($ in thousands, except percentages and per share data) | |||||||||||||||
Key underwriting metrics: | |||||||||||||||
Underwriting income (loss) | $ | (10,578 | ) | $ | (5,266 | ) | $ | (16,721 | ) | $ | (11,236 | ) | |||
Combined ratio | 108.0 | % | 103.5 | % | 106.2 | % | 103.8 | % | |||||||
Adjusted underwriting income (loss) | $ | (6,267 | ) | $ | 202 | $ | (9,281 | ) | $ | (3,213 | ) | ||||
Adjusted combined ratio | 104.7 | % | 99.9 | % | 103.4 | % | 101.1 | % | |||||||
Key investment return metrics: | |||||||||||||||
Net interest income | $ | 27,428 | $ | 26,415 | $ | 55,231 | $ | 56,849 | |||||||
Net interest income yield on average net assets (1) | 1.4 | % | 1.2 | % | 2.7 | % | 2.7 | % | |||||||
Non-investment grade portfolio (1) | 1.8 | % | 1.6 | % | 3.5 | % | 3.5 | % | |||||||
Investment grade portfolio (1) | 0.4 | % | 0.6 | % | 1.0 | % | 1.2 | % | |||||||
Net investment income (loss) | $ | 199,491 | $ | 23,787 | $ | (63,208 | ) | $ | 82,141 | ||||||
Net investment income return on average net assets (1) | 10.0 | % | 1.1 | % | (3.1 | )% | 3.9 | % | |||||||
Non-investment grade portfolio (1) | 13.1 | % | 1.2 | % | (5.2 | )% | 4.6 | % | |||||||
Investment grade portfolio (1) | 1.6 | % | 1.0 | % | 2.4 | % | 2.1 | % | |||||||
Net investment income return on average total investments (excluding accrued investment income) (2) | 7.7 | % | 0.8 | % | (2.4 | )% | 2.9 | % | |||||||
Non-investment grade portfolio (2) | 10.6 | % | 1.0 | % | (4.3 | )% | 3.7 | % | |||||||
Investment grade portfolio (2) | 1.6 | % | 1.0 | % | 2.4 | % | 2.1 | % | |||||||
Key shareholders’ value creation metrics: | |||||||||||||||
Book value per diluted common share (3) | $ | 38.82 | $ | 42.07 | $ | 38.82 | $ | 42.07 | |||||||
Growth in book value per diluted share (3) | 37.6 | % | 1.3 | % | (10.7 | )% | 7.3 | % | |||||||
Annualized return on average equity (4) | N.M. | 5.8 | % | (23.6 | )% | 13.2 | % | ||||||||
N.M. Ratio is not meaningful.
(1) Net interest income yield on average net assets and net investment income return on average net assets are calculated by dividing net interest income, and net investment income (loss), respectively, by average net assets. Net assets is calculated as the sum of total investments, accrued investment income and receivables for securities sold, less revolving credit agreement borrowings, payable for securities purchased and payable for securities sold short. For the three and six month periods, average net assets is calculated using the averages of each quarterly period. However, for the investment grade portfolio component of these returns, the impact of the revolving credit agreement borrowings is not subtracted from net interest income, net investment income (loss), or the net assets calculation. The separate components of these returns (non-investment grade portfolio and investment grade portfolio) are non-U.S. GAAP financial measures. Refer to “-Reconciliation of non-U.S. GAAP financial measures” for a reconciliation of these components of our net interest income yield on average net assets and net investment income return on average net assets.
(2) Net investment income return on average total investments (excluding accrued investment income) is calculated by dividing net investment income by average total investments. For the three and six month periods, average total investments is calculated using the averages of each quarterly period. However, for the investment grade portfolio component of these returns, the impact of revolving credit agreement borrowings is not subtracted from net investment income. The separate components of these returns (non-investment grade portfolio and investment grade portfolio) are non-U.S. GAAP financial measures. Refer to “-Reconciliation of non-U.S. GAAP financial measures” for a reconciliation of these components of our net investment income return on average total investments (excluding accrued investment income).
(3) Book value per diluted common share is calculated by dividing total shareholders’ equity by the number of diluted common shares outstanding at the end of each reporting period. Growth in book value per diluted common share is calculated as the percentage change in value of beginning and ending book value per diluted common share over the reporting period.
(4) Annualized return on average equity represents net income (loss) expressed as a percentage of average total shareholders’ equity during the period. Annualized return on average equity for the three and six months ended June 30, 2020 and 2019 is calculated by extrapolating the quarterly return on average equity over a twelve-month period. For the three and six month periods, the average total shareholders’ equity is calculated as the average of the beginning and ending total shareholders’ equity of each quarterly
56
period. Due to the net realized and unrealized gains on investments, the annualized return on average equity calculation is not meaningful for the three months ended June 30, 2020. For the three months ended June 30, 2020 and 2019, the return on average equity was 28.2% and 1.5%, respectively.
Underwriting income (loss)
Underwriting income (loss) is a non-U.S. GAAP financial measure. We define underwriting income (loss) as net premiums earned less loss and loss adjustment expenses, acquisition expenses and general and administrative expenses. Underwriting income (loss) is one of the ways we evaluate the performance of our underwriting segment, and does not include other underwriting income (loss), net investment income (loss), interest expense, net foreign exchange gains (losses), income tax expense (benefit) and preference dividends. Although these items are an integral part of our operations, with the exception of other underwriting income (loss), they are independent of the underwriting process and result, in large part, from general economic and financial market conditions. We include other underwriting income (loss) in our adjusted underwriting income (loss), as described in more detail below. See “-Reconciliation of non-U.S. GAAP financial measures” for a reconciliation of underwriting income to net income (loss) available to common shareholders.
Combined ratio
The combined ratio is calculated as the sum of loss and loss adjustment expenses, acquisition expenses and general and administrative expenses, divided by net premiums earned, or equivalently, as the sum of the loss ratio, acquisition expense ratio and general and administrative expense ratio. The combined ratio is a measure of underwriting profitability but does not include other underwriting income or net investment income earned on underwriting cash flows.
Adjusted underwriting income (loss)
Adjusted underwriting income (loss) is a non-U.S. GAAP financial measure. We define adjusted underwriting income (loss) as underwriting income (loss) plus other underwriting income (loss) less certain corporate expenses. Adjusted underwriting income (loss) is one of the ways we evaluate the performance of our underwriting segment. We include other underwriting income (loss), as our underwriting strategy allows us to enter into government-sponsored enterprise credit-risk sharing transactions. Certain corporate expenses are generally comprised of costs associated with the ongoing operations of the holding company, such as compensation of certain executives and costs associated with the initial setup of subsidiaries. See “-Reconciliation of non-U.S. GAAP financial measures” for a reconciliation of adjusted underwriting income to net income (loss) available to common shareholders.
Adjusted combined ratio
Adjusted combined ratio is a non-U.S. GAAP financial measure. The adjusted combined ratio is calculated as the sum of loss and loss adjustment expenses, acquisition expenses and general and administrative expenses less certain corporate expenses, divided by the sum of net premiums earned and other underwriting income (loss). This ratio is a measure of our underwriting and operational profitability but does not include certain corporate expenses or net investment income earned on underwriting cash flows. Certain corporate expenses are generally comprised of costs associated with the ongoing operations of the holding company, such as compensation of certain executives and costs associated with the initial setup of subsidiaries. See “-Reconciliation of non-U.S. GAAP financial measures” for a reconciliation of our adjusted combined ratio to our combined ratio.
57
Net interest income and net investment income (loss)
Net interest income and net investment income (loss) are important contributors to our financial results. These key investment metrics are impacted by the performance of our Investment Managers as well as the state of the overall financial markets.
Net interest income yield on average net assets
Net interest income yield on average net assets is calculated by dividing net interest income by average net assets. Net assets is calculated as the sum of total investments, accrued investment income and receivables for securities sold, less revolving credit agreement borrowings, payable for securities purchased and payable for securities sold short. Net interest income yield on average net assets is a key indicator by which we measure the performance of our Investment Managers.
Net investment income return on average net assets
Net investment income return on average net assets is calculated by dividing net investment income (loss) by average net assets. Net assets is calculated as the sum of total investments, accrued investment income and receivables for securities sold, less revolving credit agreement borrowings, payable for securities purchased and payable for securities sold short. Net investment income return on average net assets is a key indicator by which we measure the performance of our Investment Managers.
Net investment income return on average total investments (excluding accrued investment income)
Net investment income return on average total investments (excluding accrued investment income) is calculated by dividing net investment income (loss) by average total investments. Net investment income return on average total investments (excluding accrued investment income) is a key indicator by which we measure the performance of our Investment Managers.
Non-investment grade portfolio and investment grade portfolio components of certain of our investment metrics
In order to provide further detail regarding our key investment metrics, we also present the non-investment grade portfolio and investment grade portfolio components of our net interest income yield on average net assets, net investment income return on average net assets and net investment income return on average total investments (excluding accrued investment income). In the calculation of the investment grade portfolio component of our net interest income yield on average net assets and net investment income return on average net assets, the impact of the revolving credit agreement borrowings is not subtracted from net interest income, net investment income (loss) or the net assets calculation. The separate components of these returns are non-U.S. GAAP financial measures. See “-Reconciliation of non-U.S. GAAP financial measures” for a reconciliation of these components of our net interest income yield on average net assets, net investment income return on average net assets and net investment income return on average total investments (excluding accrued investment income).
Growth in book value per diluted common share
Book value per diluted common share is calculated by dividing total shareholders’ equity by the number of diluted common shares outstanding at the end of each reporting period. We calculate growth in book value per diluted common share as the percentage change in value of beginning and ending book value per diluted share over the reporting period. Book value per diluted common share is impacted by, among other factors, our underwriting results, our investment returns and our share repurchase activity, which has an accretive or dilutive impact on book value per diluted common share depending on the purchase price.
We measure our long-term financial success by our ability to compound growth in book value per diluted common share at an attractive rate of return. We believe that long-term growth in book
58
value per diluted common share is the most comprehensive measure of our success because it includes all underwriting, operating and investing results.
Return on average equity
Return on average equity is net income (loss) expressed as a percentage of average total shareholders’ equity during the period and is used to measure profitability. Our goal is to generate an attractive long-term return on our common shareholders’ equity.
Comment on non-U.S. GAAP financial measures
Throughout this report, we present our operations in the way we believe will be the most meaningful and useful to investors, analysts, rating agencies and others who will use our financial information in evaluating the performance of our company. This presentation includes the use of underwriting income (loss), adjusted underwriting income (loss), adjusted combined ratio and the separate components of our investment returns (non-investment grade investment portfolio and investment grade investment portfolio). The presentation of these metrics constitutes non-U.S. GAAP financial measures as defined by applicable SEC rules. We believe that this presentation enables investors and other users of our financial information to analyze our performance in a manner similar to how management analyzes performance. We also believe that this presentation follows industry practice and, therefore, allows the equity analysts and certain rating agencies that follow us and the insurance industry as a whole, as well as other users of our financial information to compare our performance with our industry peer group. See “-Reconciliation of non-U.S. GAAP financial measures” for reconciliations of such measures to the most directly comparable U.S. GAAP financial measures, in accordance with applicable SEC rules.
Components of our results of operations
Revenues
We derive our revenues from two principal sources:
• | premiums from our insurance and reinsurance lines of business; and |
• | income from investments. |
Premiums from our insurance and reinsurance lines of business are directly related to the number, type, size and pricing of contracts we write. Premiums are earned over the contract period in proportion to the period of risk covered which is typically 12 to 24 months.
Income from our investments is comprised of interest income and net realized and unrealized gains (losses), less investment related expenses as described below.
Expenses
Our expenses consist primarily of the following:
• | loss and loss adjustment expenses; |
• | acquisition expenses; |
• | general and administrative expenses; |
• | investment related expenses; and |
• | interest expense. |
Loss and loss adjustment expenses are a function of the amount and type of contracts and policies we write and of the loss experience of the underlying coverage. Loss and loss adjustment expenses are based on an actuarial analysis of the estimated losses, including losses incurred during the
59
period and changes in estimates from prior periods. Depending on the nature of the contract, loss and loss adjustment expenses may be paid over a period of years.
Acquisition expenses consist primarily of brokerage fees, ceding commissions, premium taxes, underwriting fees payable to Arch under our services agreements and other direct expenses that relate to our contracts and policies and are presented net of commissions received from reinsurance we purchase. We amortize deferred acquisition expenses over the related contract term in the same proportion that the premiums are earned. Our acquisition expenses may also include profit commissions paid to our sources of business in the event of favorable underwriting experience.
General and administrative expenses consist of salaries and benefits and related costs, legal and accounting fees, travel and client entertainment, fees relating to our letter of credit facilities, information technology, occupancy, the cost of employees made available to us by Arch under the services agreements, and other general operating expenses.
Investment-related expenses primarily consist of management and performance fees we pay to our Investment Managers, as well as interest and other expenses on borrowings from our credit facilities when used to finance a portion of our investments. The fee structure that we pay to HPS related to our non-investment grade portfolio was reduced beginning on January 1, 2018. We currently pay a management fee to HPS related to its management of our non-investment grade portfolio on a quarterly basis equal to 1.0% of net assets. Beginning January 1, 2020, to the extent the aggregate net asset value of the HPS-managed non-investment grade portfolio assets exceeds $1.5 billion, the management fee shall be calculated at a blended annual rate equal to (i) 1.0% of the initial $1.5 billion in net asset value plus (ii) seventy-five basis points (0.75%) of the excess of aggregate net asset value over $1.5 billion, subject to a minimum blended management fee rate of eighty-five basis points (0.85%) on the aggregate net asset value of the HPS-managed non-investment grade portfolio assets. In addition, on an annual basis, subject to then-applicable high water marks, HPS receives a base performance fee equal to 10% of the income generated on the non-investment grade portfolio, and is eligible to earn an additional performance fee equal to 25% of any such investment income in excess of a net 10% return to us after deduction for paid and accrued management fees and base performance fees, with the total performance fees not to exceed 17.5% of the Income (as defined in the investment management agreements relating to Watford Re, WICE and Watford Trust) or Aggregate Income (as defined in the investment management agreements relating to WSIC and WIC), as applicable.
We have also engaged HPS to manage a portion of our investment grade portfolio as a separate managed account. We pay HPS a management fee equal to 0.60% per annum on the assets in the separate managed account. We also pay AIM monthly asset management fees related to the assets it manages for us. We are not obligated to pay performance fees to any of the Investment Managers managing our investment grade portfolios. We include the HPS non-investment grade portfolio base management fee and the AIM investment grade portfolio management fee in “investment management fees - related parties” in our consolidated statements of income (loss), and as management fees are accrued and paid to HPS in connection with its management of a portion of our investment grade portfolio, we will include such fees therein as well. We include interest and other expenses on borrowings in “borrowing and miscellaneous other investment expenses” in our consolidated statements of income (loss). The HPS non-investment grade portfolio performance fee, if applicable, is shown on a separate line in our consolidated statements of income (loss).
Interest expense consists of interest incurred on the $175.0 million aggregate principal amount of 6.5% senior notes due July 2, 2029, or the senior notes, that we issued on July 2, 2019. Interest on the senior notes is paid semi-annually in arrears on each January 2 and July 2, which commenced on January 2, 2020.
60
Reportable segment
We report results under one segment, which we refer to as our “underwriting segment.” Our underwriting segment captures the results of our underwriting lines of business, which are comprised of specialty products on a worldwide basis. We also have a corporate function that includes accelerated expense for the unamortized original issue discount and underwriting fees relating to the partial redemption of our 8½% cumulative redeemable preference shares, or the preference shares, and interest expense on our senior notes as well as certain operating expenses related to corporate activities referred to as certain corporate expenses. Certain corporate expenses are generally comprised of costs associated with the ongoing operations of the holding company, such as compensation of certain executives and costs associated with the initial setup of subsidiaries (refer to “- Reconciliation of non-U.S. GAAP financial measures” for a discussion about certain corporate expenses).
Recent developments
In December 2019, we entered into an agreement to acquire Axeria IARD, a P&C insurance company based in France. The completion of this acquisition is subject to regulatory approval (which, as of the date of this report, had not been received) and other customary closing conditions, and is expected to close in the second half of 2020. If this pending acquisition is consummated, consistent with our business model, our strategy will be to work closely with Arch to enable Axeria IARD to grow its existing business in France, as well as to develop new insurance opportunities throughout the European Union.
John Rathgeber retired as Chief Executive Officer on March 31, 2020. Mr. Rathgeber served as a senior advisor to the Company from April 1, 2020 to June 30, 2020, and remains a member of Watford’s board of directors. Jonathan D. Levy succeeded Mr. Rathgeber as our Chief Executive Officer. Mr. Levy’s appointment is subject to Bermuda immigration approval.
61
Consolidated results - for the three and six months ended June 30, 2020 and 2019
The following table summarizes our results of operations for the three and six months ended June 30, 2020 and 2019:
Three Months Ended June 30, | Six Months Ended June 30, | ||||||||||||||||||||
2020 | % Change | 2019 | 2020 | % Change | 2019 | ||||||||||||||||
($ in thousands) | |||||||||||||||||||||
Gross premiums written | $ | 157,927 | (2.5 | )% | $ | 161,978 | $ | 392,829 | 12.7 | % | $ | 348,667 | |||||||||
Gross premiums ceded | (52,071 | ) | (42,608 | ) | (100,273 | ) | (83,910 | ) | |||||||||||||
Net premiums written | 105,856 | (11.3 | )% | 119,370 | 292,556 | 10.5 | % | 264,757 | |||||||||||||
Net premiums earned | 131,535 | (13.1 | )% | 151,318 | 271,574 | (8.7 | )% | 297,412 | |||||||||||||
Loss and loss adjustment expenses | (104,786 | ) | (111,416 | ) | (215,462 | ) | (222,266 | ) | |||||||||||||
Acquisition expenses | (29,486 | ) | (35,417 | ) | (57,853 | ) | (69,391 | ) | |||||||||||||
General and administrative expenses (1) | (7,841 | ) | (9,751 | ) | (14,980 | ) | (16,991 | ) | |||||||||||||
Underwriting income (loss) (2) | (10,578 | ) | 100.9 | % | (5,266 | ) | (16,721 | ) | 48.8 | % | (11,236 | ) | |||||||||
Other underwriting income (loss) | 868 | 673 | 1,001 | 1,265 | |||||||||||||||||
Interest income | 36,453 | 38,596 | 74,277 | 81,737 | |||||||||||||||||
Investment management fees - related parties | (4,262 | ) | (4,570 | ) | (8,614 | ) | (8,979 | ) | |||||||||||||
Borrowing and miscellaneous other investment expenses | (4,763 | ) | (7,611 | ) | (10,432 | ) | (15,909 | ) | |||||||||||||
Net interest income | 27,428 | 26,415 | 55,231 | 56,849 | |||||||||||||||||
Realized and unrealized gain (loss) on investments | 172,063 | (936 | ) | (118,439 | ) | 32,784 | |||||||||||||||
Investment performance fees - related parties | — | (1,692 | ) | — | (7,492 | ) | |||||||||||||||
Net investment income (loss) | 199,491 | N.M. | 23,787 | (63,208 | ) | N.M. | 82,141 | ||||||||||||||
Interest expense | (2,911 | ) | — | (5,823 | ) | — | |||||||||||||||
Net foreign exchange gains (losses) | 2,665 | (441 | ) | 7,678 | (878 | ) | |||||||||||||||
Income tax (expense) benefit | 402 | (20 | ) | 402 | (20 | ) | |||||||||||||||
Net income (loss) before preference dividends | 189,937 | 18,733 | (76,671 | ) | 71,272 | ||||||||||||||||
Preference dividends | (1,109 | ) | (4,908 | ) | (2,280 | ) | (9,815 | ) | |||||||||||||
Net income (loss) available to common shareholders | $ | 188,828 | N.M. | $ | 13,825 | $ | (78,951 | ) | N.M. | $ | 61,457 | ||||||||||
N.M. - Percentage change is not meaningful.
62
Three Months Ended June 30, | Six Months Ended June 30, | ||||||||||||||||||||
2020 | Change | 2019 | 2020 | Change | 2019 | ||||||||||||||||
($ in thousands) | |||||||||||||||||||||
Loss ratio | 79.7 | % | 6.1 | % | 73.6 | % | 79.3 | % | 4.6 | % | 74.7 | % | |||||||||
Acquisition expense ratio | 22.4 | % | (1.0 | )% | 23.4 | % | 21.3 | % | (2.0 | )% | 23.3 | % | |||||||||
General & administrative expense ratio | 5.9 | % | (0.6 | )% | 6.5 | % | 5.6 | % | (0.2 | )% | 5.8 | % | |||||||||
Combined ratio | 108.0 | % | 4.5 | % | 103.5 | % | 106.2 | % | 2.4 | % | 103.8 | % | |||||||||
Adjusted underwriting income (loss)(2) | $ | (6,267 | ) | $ | 202 | $ | (9,281 | ) | $ | (3,213 | ) | ||||||||||
Adjusted combined ratio (2) | 104.7 | % | 4.8 | % | 99.9 | % | 103.4 | % | 2.3 | % | 101.1 | % | |||||||||
Annualized return on average equity (3) | N.M. | 5.8 | % | (23.6 | )% | 13.2 | % | ||||||||||||||
N.M. - Ratio is not meaningful.
(1) General and administrative expenses include certain corporate expenses. Refer to “Reconciliation of non-U.S. GAAP financial measures-Reconciliation of the adjusted combined ratio,” for a discussion of these certain corporate expenses.
(2) Underwriting income (loss), adjusted underwriting income (loss) and the adjusted combined ratio are non-U.S. GAAP financial measures. Refer to “Reconciliation of non-U.S. GAAP financial measures” for a reconciliation of our underwriting income (loss) to net income (loss) available to common shareholders in accordance with U.S. GAAP, a reconciliation of our adjusted underwriting income (loss) to underwriting income (loss) and a reconciliation of our adjusted combined ratio to our combined ratio.
(3) Annualized return on average equity represents net income (loss) expressed as a percentage of average total shareholders’ equity during the period. Annualized return on average equity for the three and six months ended June 30, 2020 and 2019 is calculated by extrapolating the quarterly return on average equity over a twelve-month period. For the three and six month periods, the average total shareholders’ equity is calculated as the average of the beginning and ending total shareholders’ equity of each quarterly period. Due to the net realized and unrealized gains on investments, the annualized return on average equity calculation is not meaningful for the three months ended June 30, 2020. For the three months ended June 30, 2020 and 2019, the return on average equity was 28.2% and 1.5%, respectively.
Results for the three months ended June 30, 2020 versus 2019:
Net income attributable to common shareholders was $188.8 million for the three months ended June 30, 2020, compared to net income of $13.8 million for the three months ended June 30, 2019. The 2020 second quarter net income increase was primarily driven by an increase in net investment income and an increase in foreign exchange gains, offset in part by an increased underwriting loss, compared to the 2019 second quarter.
During the 2020 second quarter, net investment income increased by $175.7 million versus the prior year quarter, to $199.5 million. The increase in net investment income was due to net realized and unrealized gains increasing by $173.0 million, compared to the 2019 second quarter. The 2020 second quarter net investment income reflected a partial recovery in the credit markets during the quarter, following the initial adverse impact of the COVID-19 global pandemic during the 2020 first quarter. The 2020 second quarter increase of underwriting losses of $5.3 million was primarily the result of an increase in the loss ratio offset in part by reductions in the acquisition and general and administrative expense ratios, compared to the 2019 second quarter.
The 2020 second quarter loss ratio was 79.7%, 6.1 points higher than the 2019 second quarter. In the 2020 second quarter, the increase in loss ratio was primarily driven by a COVID-19 global pandemic loss provision of $5.2 million, or 4.0 points, mainly arising from business interruption coverage in the property catastrophe reinsurance business. Other movements in the loss and acquisition expense ratios reflected changes in the mix and type of business. The prior year loss reserve development for both the 2020 and 2019 second quarters was essentially flat.
The 2020 second quarter general and administrative expense ratio was 5.9%, 0.6 points lower than the 2019 second quarter. The decrease versus the prior year second quarter was primarily attributable to a one-time accelerated long-term incentive expense recognized in the 2019 second quarter with no comparable expense booked this quarter.
63
Results for the six months ended June 30, 2020 versus 2019:
Net loss attributable to common shareholders was $79.0 million for the six months ended June 30, 2020, compared to net income of $61.5 million for the six months ended June 30, 2019. The six months ended June 30, 2020 net loss was driven by a decrease in net investment income and an increase in underwriting loss, offset in part by an increase in foreign exchange gains.
During the six months ended June 30, 2020, net investment loss was $63.2 million, versus the prior year comparable period net investment gain of $82.1 million. The net investment loss was primarily due to an increase in net realized and unrealized losses in the 2020 first quarter. The increase in net realized and unrealized losses on investments in the 2020 first quarter reflected the impact of the COVID-19 global pandemic and the adverse economic and market conditions that followed. Conditions partially improved during the 2020 second quarter, resulting in a net realized and unrealized gain of $172.1 million, reducing the year to date net realized and unrealized loss to $118.4 million.
The underwriting loss of $16.7 million for the six months ended June 30, 2020, compared to the underwriting loss of $11.2 million for the six months ended June 30, 2019, was primarily the result of an increase in the loss ratio, offset in part by a reduction in the acquisition expense ratio compared to the 2019 first half.
The loss ratio for the six months ended June 30, 2020 was 79.3%, 4.6 points higher than a year ago. The increase in the loss ratio partly reflected a COVID-19 global pandemic-related loss provision of $9.6 million, or 3.5 points, recognized during the period. Approximately $2.0 million, or 0.7 points, of the increase in losses was offset by loss sensitive commission decreases, which are reflected as benefits to the acquisition expense ratio. Other movements in the loss and acquisition expense ratios reflected changes in the mix and type of business. The prior year loss reserve development for both the six months ended June 30, 2020 and 2019 was essentially flat.
Premiums
Our underwriting segment captures the results of our underwriting lines of business, which are comprised of specialty products on a worldwide basis. Our four major lines of business are described as follows:
• | Casualty reinsurance: coverage provided to ceding company clients on third-party liability and workers’ compensation exposures, primarily on a treaty basis. Business written includes coverages such as: executive assurance, medical malpractice liability, other professional liability, workers’ compensation, excess and umbrella liability and excess auto liability. |
• | Other specialty reinsurance: coverage provided to ceding company clients for personal and commercial auto (other than excess auto liability), mortgage, surety, accident and health, workers’ compensation catastrophe, agriculture, marine and aviation. |
• | Property catastrophe reinsurance: protects ceding company clients for most catastrophic losses that are covered in the underlying policies. Perils covered may include hurricane, earthquake, flood, tornado, hail and fire, and coverage for other perils on a case-by-case basis. Property catastrophe reinsurance provides coverage on an excess of loss basis when aggregate losses and loss adjustment expense from a single occurrence of a covered peril exceed the retention specified in the contract. |
• | Insurance programs and coinsurance: targeting program managers and/or coinsurers with unique expertise and niche products offering primary and excess general liability, umbrella liability, professional liability, workers’ compensation, personal and commercial automobile, inland marine and property business with minimal catastrophe exposure. |
64
Gross premiums written
Gross premiums written for the three and six months ended June 30, 2020 and 2019 were as follows:
Three Months Ended June 30, | Six Months Ended June 30, | ||||||||||||||||||||||||||
2020 | 2019 | 2020 | 2019 | ||||||||||||||||||||||||
Amount | % | Amount | % | Amount | % | Amount | % | ||||||||||||||||||||
($ in thousands) | |||||||||||||||||||||||||||
Casualty reinsurance | $ | 25,125 | 15.9 | % | $ | 32,557 | 20.1 | % | $ | 108,943 | 27.7 | % | $ | 108,158 | 31.0 | % | |||||||||||
Other specialty reinsurance | 21,080 | 13.4 | % | 37,836 | 23.4 | % | 57,960 | 14.8 | % | 62,134 | 17.8 | % | |||||||||||||||
Property catastrophe reinsurance | 11,253 | 7.1 | % | 5,929 | 3.7 | % | 21,085 | 5.4 | % | 11,921 | 3.4 | % | |||||||||||||||
Insurance programs and coinsurance | 100,469 | 63.6 | % | 85,656 | 52.8 | % | 204,841 | 52.1 | % | 166,454 | 47.8 | % | |||||||||||||||
Total | $ | 157,927 | 100.0 | % | $ | 161,978 | 100.0 | % | $ | 392,829 | 100.0 | % | $ | 348,667 | 100.0 | % | |||||||||||
Results for the three months ended June 30, 2020 versus 2019:
Gross premiums written were $157.9 million for the three months ended June 30, 2020 compared to $162.0 million for the three months ended June 30, 2019, a decrease of $4.1 million, or 2.5%. Premium decreases in casualty reinsurance and other specialty reinsurance were offset in part by premium increases in insurance programs and coinsurance and property catastrophe reinsurance.
Our insurance programs and coinsurance line of business gross premiums written increased $14.8 million, or 17.3%, to $100.5 million. The premium growth was driven by the continued expansion of our U.S. and European insurance programs and coinsurance. During the 2020 second quarter, the U.S. platform increased gross premiums written by $10.1 million, or 34.2%, to $39.7 million. Premium growth in the United States was driven by increased writings for commercial auto, where we are seeing significant rate improvement. This growth was partially offset by premium reductions in one U.S. insurance program in which the underlying insureds either reported lower revenues or canceled their policies in the face of the economic shutdown related to the COVID-19 global pandemic. In addition, during the 2020 second quarter, the European platform increased its insurance gross premiums written by $4.7 million, or 8.4%, to $60.8 million. The increase in gross premiums written primarily related to increased U.K. motor writings.
Our property catastrophe reinsurance gross premiums written increased 89.8% over the prior year quarter, from $5.9 million to $11.3 million. Our primary involvement in this line of business is a 7.5% quota share participation of ARL’s worldwide property catastrophe excess of loss portfolio. Recently, Arch has been increasing its writings in this line in response to an improving rate environment and, as a result, our premiums have grown in proportion.
Casualty and other specialty reinsurance gross premiums written were down $7.4 million and $16.8 million, or 22.8% and 44.3%, respectively, over the prior year quarter.
The casualty reinsurance decrease was primarily due to the continued impact of the 2019 first quarter non-renewal of one multi-line quota share contract as well as the continued impact of gradually reduced participations over time on one cedant’s professional liability reinsurance program, which was not renewed in the second quarter of 2020. In addition, the multi-line quota share contract included a $4 million negative premium adjustment for prior underwriting years. Partially offsetting these premium decreases, the casualty reinsurance line grew its U.K. motor excess-of-loss writings as a result of significant rate increases.
The other specialty reinsurance premium decrease was partially due to a $6.2 million contract written and earned in the prior year quarter with no comparable premium this quarter. In addition,
65
mortgage reinsurance premium decreased as a result of the reduction in our exposure to U.S. mortgage risk, which became effective this quarter. Lastly, we reduced our premium estimates on certain commercial auto quota share programs. The premium estimate reductions were primarily driven by reduced economic activity related to the COVID-19 global pandemic.
Results for the six months ended June 30, 2020 versus 2019:
Gross premiums written were $392.8 million for the six months ended June 30, 2020 compared to $348.7 million for the six months ended June 30, 2019, an increase of $44.2 million, or 12.7%.
The increase primarily related to premium increases in insurance programs and coinsurance and property catastrophe reinsurance, which were offset in part by a slight written premium reduction in other specialty reinsurance. Casualty reinsurance gross written premiums remained flat period over period.
The $38.4 million growth in our insurance programs and coinsurance line of business was driven by the continued expansion of our U.S. and European insurance programs and coinsurance. During the six months ended June 30, 2020, the U.S. business collectively grew its insurance programs’ gross premiums written by $36.8 million, or 66.2%, to $92.3 million. Premium growth in the United States was driven by increased writings for commercial auto, where there was significant rate improvement. In addition, during the six months ended June 30, 2020, our European business increased its insurance gross premiums written by $1.6 million, or 1.5%, to $112.5 million.
Our property catastrophe reinsurance gross premiums written increased 76.9% over the prior year period. Our primary involvement in this line of business is a 7.5% quota share participation of ARL’s worldwide property catastrophe excess of loss portfolio. Recently, Arch has been increasing its writings in this line in response to an improving rate environment and, as a result, our premiums have grown in proportion.
Premiums ceded
Premiums ceded were $52.1 million for the three months ended June 30, 2020, compared to $42.6 million for the three months ended June 30, 2019, an increase of $9.5 million. Premiums ceded were $100.3 million for the six months ended June 30, 2020, compared to $83.9 million for the six months ended June 30, 2019, an increase of $16.4 million. In each of the three and six month periods, the premiums ceded increased compared to the prior year periods, as our U.S. and European insurance gross premiums written have grown.
Net premiums written
Net premiums written for the three and six months ended June 30, 2020 and 2019 were as follows:
Three Months Ended June 30, | Six Months Ended June 30, | ||||||||||||||||||||||||||
2020 | 2019 | 2020 | 2019 | ||||||||||||||||||||||||
Amount | % | Amount | % | Amount | % | Amount | % | ||||||||||||||||||||
($ in thousands) | |||||||||||||||||||||||||||
Casualty reinsurance | $ | 24,774 | 23.4 | % | $ | 32,077 | 26.9 | % | $ | 108,441 | 37.0 | % | $ | 107,142 | 40.4 | % | |||||||||||
Other specialty reinsurance | 19,843 | 18.8 | % | 36,523 | 30.6 | % | 55,327 | 18.9 | % | 59,705 | 22.6 | % | |||||||||||||||
Property catastrophe reinsurance | 10,506 | 9.9 | % | 5,621 | 4.7 | % | 20,338 | 7.0 | % | 11,603 | 4.4 | % | |||||||||||||||
Insurance programs and coinsurance | 50,733 | 47.9 | % | 45,149 | 37.8 | % | 108,450 | 37.1 | % | 86,307 | 32.6 | % | |||||||||||||||
Total | $ | 105,856 | 100.0 | % | $ | 119,370 | 100.0 | % | $ | 292,556 | 100.0 | % | $ | 264,757 | 100.0 | % | |||||||||||
Results for the three months ended June 30, 2020 versus 2019:
66
Net premiums written were $105.9 million for the three months ended June 30, 2020 compared to $119.4 million for the three months ended June 30, 2019, a decrease of $13.5 million, or 11.3%. The decrease in our net premiums written was a result of the reduction in gross premiums written and the increase in premiums ceded, as discussed above.
Results for the six months ended June 30, 2020 versus 2019:
Net premiums written were $292.6 million for the six months ended June 30, 2020 compared to $264.8 million for the six months ended June 30, 2019, an increase of $27.8 million, or 10.5%. The increase in our net premiums written was in line with our gross premiums written and ceded premium movements discussed above.
Net premiums earned
Net premiums earned for the three and six months ended June 30, 2020 and 2019 were as follows:
Three Months Ended June 30, | Six Months Ended June 30, | ||||||||||||||||||||||||||
2020 | 2019 | 2020 | 2019 | ||||||||||||||||||||||||
Amount | % | Amount | % | Amount | % | Amount | % | ||||||||||||||||||||
($ in thousands) | |||||||||||||||||||||||||||
Casualty reinsurance | $ | 48,146 | 36.6 | % | $ | 67,506 | 44.5 | % | $ | 100,911 | 37.2 | % | $ | 130,819 | 44.1 | % | |||||||||||
Other specialty reinsurance | 29,876 | 22.7 | % | 42,635 | 28.2 | % | 65,240 | 24.0 | % | 87,196 | 29.3 | % | |||||||||||||||
Property catastrophe reinsurance | 5,824 | 4.4 | % | 3,119 | 2.1 | % | 10,708 | 3.9 | % | 6,090 | 2.0 | % | |||||||||||||||
Insurance programs and coinsurance | 47,689 | 36.3 | % | 38,058 | 25.2 | % | 94,715 | 34.9 | % | 73,307 | 24.6 | % | |||||||||||||||
Total | $ | 131,535 | 100.0 | % | $ | 151,318 | 100.0 | % | $ | 271,574 | 100.0 | % | $ | 297,412 | 100.0 | % | |||||||||||
Results for the three months ended June 30, 2020 versus 2019:
Net premiums earned were $131.5 million for the three months ended June 30, 2020 compared to $151.3 million for the three months ended June 30, 2019, a decrease of $19.8 million, or 13.1%. The decrease in net premiums earned reflected reduced participations and non-renewals for certain casualty reinsurance deals. In addition, the decrease in other specialty reinsurance premiums was driven by a contract written and earned in 2019, with no comparable premium this quarter, as well as a reduction in our exposure to U.S. mortgage risk. These decreases were partially offset by increased writings in insurance programs and coinsurance, and, to a lesser extent, greater assumed property catastrophe reinsurance during 2020.
Results for the six months ended June 30, 2020 versus 2019:
Net premiums earned were $271.6 million for the six months ended June 30, 2020 compared to $297.4 million for the six months ended June 30, 2019, a decrease of $25.8 million, or 8.7%. The decrease in net premiums earned reflected non-renewals and gradual reductions of participations in various contracts in the second half of 2019, as discussed in more detail above. This was partially offset by increased writings in insurance programs and coinsurance, and, to a lesser extent, greater assumed property catastrophe reinsurance during 2020.
67
Loss ratio
The following table shows the components of our loss and loss adjustment expenses for the three and six months ended June 30, 2020 and 2019:
Three Months Ended June 30, | Six Months Ended June 30, | ||||||||||||||||||||||||||
2020 | 2019 | 2020 | 2019 | ||||||||||||||||||||||||
Loss and Loss Adjustment Expenses | % of Earned Premiums | Loss and Loss Adjustment Expenses | % of Earned Premiums | Loss and Loss Adjustment Expenses | % of Earned Premiums | Loss and Loss Adjustment Expenses | % of Earned Premiums | ||||||||||||||||||||
($ in thousands) | |||||||||||||||||||||||||||
Current year | $ | 104,993 | 79.9 | % | $ | 111,494 | 73.7 | % | $ | 215,849 | 79.5 | % | $ | 222,395 | 74.8 | % | |||||||||||
Prior year development (favorable)/adverse | (207 | ) | (0.2 | )% | (78 | ) | (0.1 | )% | (387 | ) | (0.2 | )% | (129 | ) | (0.1 | )% | |||||||||||
Loss and loss adjustment expenses | $ | 104,786 | 79.7 | % | $ | 111,416 | 73.6 | % | $ | 215,462 | 79.3 | % | $ | 222,266 | 74.7 | % | |||||||||||
Results for the three months ended June 30, 2020 versus 2019:
Our loss ratio was 79.7% for the three months ended June 30, 2020, compared to 73.6% for the three months ended June 30, 2019, an increase of 6.1 points. The increase in loss ratio was primarily driven by COVID-19 global pandemic related losses of $5.2 million, or 4.0 points, which mainly impacted the business interruption coverage in our property catastrophe reinsurance business. Other movements reflected changes in the mix and type of business. The prior year loss reserve development for both the 2020 and 2019 second quarters was essentially flat.
Results for the six months ended June 30, 2020 versus 2019:
Our loss ratio was 79.3% for the six months ended June 30, 2020, compared to 74.7% for the six months ended June 30, 2019, an increase of 4.6 points. The increase in the loss ratio partly reflected losses incurred related to the COVID-19 global pandemic of $9.6 million, or 3.5 points, which impacted our property catastrophe business, and, to a lesser extent, mortgage reinsurance business and cyber reinsurance within our other specialty reinsurance line of business. Approximately $2.0 million, or 0.7 points, of the increase in losses was offset by loss sensitive commission decreases, which are reflected as benefits to the acquisition expense ratio. Other movements in the loss ratio reflected changes in mix and type of business. The prior year loss reserve development for the six months ended June 30, 2020 and 2019 was essentially flat.
Refer to Note 5, “Reserve for losses and loss adjustment expenses” to our consolidated financial statements for more information about our prior year reserve development.
Acquisition expense ratio
Results for the three months ended June 30, 2020 versus 2019:
Our acquisition expense ratio was 22.4% for the three months ended June 30, 2020, compared to 23.4% for the three months ended June 30, 2019, a decrease of 1.0 point. The lower acquisition expense ratio this quarter reflected changes in mix and type of business.
Results for the six months ended June 30, 2020 versus 2019:
Our acquisition expense ratio was 21.3% for the six months ended June 30, 2020, compared to 23.3% for the six months ended June 30, 2019, a decrease of 2.0 points. The lower acquisition expense ratio was driven by an increased percentage of insurance programs and coinsurance net premiums earned and its lower associated acquisition expense ratio, plus certain sliding scale commission reductions offsetting increases in losses incurred related to the COVID-19 global pandemic, as discussed above.
68
General and administrative expense ratio
Results for the three months ended June 30, 2020 versus 2019:
Our general and administrative expense ratio was 5.9% for the three months ended June 30, 2020, compared to 6.5% for the three months ended June 30, 2019. The 0.6 point decrease was primarily attributable to a one-time accelerated long-term incentive expense recognized in the 2019 second quarter with no comparable expense this quarter.
Results for the six months ended June 30, 2020 versus 2019:
Our general and administrative expense ratio was 5.6% for the six months ended June 30, 2020, compared to 5.8% for the six months ended June 30, 2019. The 0.2 point decrease was primarily attributable to a one-time accelerated long-term incentive expense recognized in the 2019 second quarter.
Combined ratio
Results for the three months ended June 30, 2020 versus 2019:
Our combined ratio was 108.0% for the three months ended June 30, 2020, compared to 103.5% for the three months ended June 30, 2019, an increase of 4.5%. In the 2020 second quarter, there was a 6.1 point increase in the loss expense ratio, offset in part by a 1.0 point decrease in the acquisition expense ratio and a 0.6 point decrease in the general and administrative expense ratio, versus the prior period, as described above.
Results for the six months ended June 30, 2020 versus 2019:
Our combined ratio was 106.2% for the six months ended June 30, 2020, compared to 103.8% for the six months ended June 30, 2019, an increase of 2.4%. In the first six months of 2020, there was a 4.6 point increase in the loss ratio, offset in part by a 2.0 point decrease in acquisition expense ratio and a 0.2 point decrease in the general and administrative expense ratio, versus the prior year period, as described above.
69
Investing results
The following table summarizes the components of total investment income:
Three Months Ended June 30, | Six Months Ended June 30, | ||||||||||||||
2020 | 2019 | 2020 | 2019 | ||||||||||||
($ in thousands) | |||||||||||||||
Interest income | $ | 36,453 | $ | 38,596 | $ | 74,277 | $ | 81,737 | |||||||
Investment management fees - related parties | (4,262 | ) | (4,570 | ) | (8,614 | ) | (8,979 | ) | |||||||
Borrowing and miscellaneous other investment expenses | (4,763 | ) | (7,611 | ) | (10,432 | ) | (15,909 | ) | |||||||
Net interest income | 27,428 | 26,415 | 55,231 | 56,849 | |||||||||||
Net realized gains (losses) on investments | (6,001 | ) | 789 | (11,047 | ) | 2,071 | |||||||||
Net unrealized gains (losses) on investments | 178,064 | (1,725 | ) | (107,392 | ) | 30,713 | |||||||||
Investment performance fees - related parties | — | (1,692 | ) | — | (7,492 | ) | |||||||||
Net investment income (loss) | $ | 199,491 | $ | 23,787 | $ | (63,208 | ) | $ | 82,141 | ||||||
Net interest income yield on average net assets (1) | 1.4 | % | 1.2 | % | 2.7 | % | 2.7 | % | |||||||
Non-investment grade portfolio (1) | 1.8 | % | 1.6 | % | 3.5 | % | 3.5 | % | |||||||
Investment grade portfolio (1) | 0.4 | % | 0.6 | % | 1.0 | % | 1.2 | % | |||||||
Net investment income return on average net assets (1) | 10.0 | % | 1.1 | % | (3.1 | )% | 3.9 | % | |||||||
Non-investment grade portfolio (1) | 13.1 | % | 1.2 | % | (5.2 | )% | 4.6 | % | |||||||
Investment grade portfolio (1) | 1.6 | % | 1.0 | % | 2.4 | % | 2.1 | % | |||||||
Net investment income return on average total investments (excluding accrued investment income) (2) | 7.7 | % | 0.8 | % | (2.4 | )% | 2.9 | % | |||||||
Non-investment grade portfolio (2) | 10.6 | % | 1.0 | % | (4.3 | )% | 3.7 | % | |||||||
Investment grade portfolio (2) | 1.6 | % | 1.0 | % | 2.4 | % | 2.1 | % | |||||||
(1) Net interest income yield on average net assets and net investment income return on average net assets are calculated by dividing net interest income, and net investment income (loss), respectively, by average net assets. Net assets is calculated as the sum of total investments, accrued investment income and receivables for securities sold, less revolving credit agreement borrowings, payable for securities purchased and payable for securities sold short. For the three and six month periods, average net assets is calculated using the averages of each quarterly period. However, for the investment grade portfolio component of these returns, the impact of the revolving credit agreement borrowings is not subtracted from net interest income, net investment income (loss), or the net assets calculation. The separate components of these returns (non-investment grade portfolio and investment grade portfolio) are non-U.S. GAAP financial measures. Refer to “-Reconciliation of non-U.S. GAAP financial measures” for a reconciliation of these components of our net interest income yield on average net assets and net investment income return on average net assets.
(2) Net investment income return on average total investments (excluding accrued investment income) is calculated by dividing net investment income by average total investments. For the three and six month periods, average total investments is calculated using the averages of each quarterly period. However, for the investment grade portfolio component of these returns, the impact of revolving credit agreement borrowings is not subtracted from net investment income. The separate components of these returns (non-investment grade portfolio and investment grade portfolio) are non-U.S. GAAP financial measures. Refer to “-Reconciliation of non-U.S. GAAP financial measures” for a reconciliation of these components of our net investment income return on average total investments (excluding accrued investment income).
Results for the three months ended June 30, 2020 versus 2019:
Net investment income was $199.5 million for the three months ended June 30, 2020 compared to net investment income of $23.8 million for the three months ended June 30, 2019, an increase of $175.7 million. The 2020 second quarter net investment income return on average net assets was 10.0% as compared to 1.1% for the prior period.
The 2020 second quarter net investment return was driven by net unrealized gains of $178.1 million which reflected a partial recovery of the credit market during the quarter, following the initial
70
adverse impact of the COVID-19 global pandemic during the 2020 first quarter. Net interest income increased to $27.4 million from $26.4 million, an increase of 3.8% quarter over quarter.
The 2020 second quarter non-investment grade portfolio net interest income was $25.7 million, compared to net interest income of $26.2 million in the first quarter of 2020 and $24.5 million in the second quarter of 2019. The slight decrease in net interest income in the 2020 second quarter versus the 2020 first quarter can be attributed to a portfolio shift to higher rated instruments, as well as a decrease in LIBOR through the second quarter. The net realized and unrealized gains reported in the 2020 second quarter were $163.1 million, reflective of the partial market recovery discussed above.
The 2020 second quarter investment grade portfolio net interest income yield was 0.4%, a decrease from 0.6% in the prior year quarter. The reduced yield this quarter reflected a reduction in interest rates versus the prior year quarter. In addition, the investment grade portfolio recognized $8.9 million of net realized gains in the quarter as compared to gains of $1.0 million in the second quarter of 2019. The investment grade results reflected collateral management actions in the quarter. We sold certain assets held in collateral trusts as the collateral requirements had changed. Given the interest rate movements in the quarter, these assets realized net gains on disposal.
Results for the six months ended June 30, 2020 versus 2019:
Net investment loss was $63.2 million for the six months ended June 30, 2020 compared to net investment income of $82.1 million in the prior year period, a decrease of $145.3 million. For the six months ended June 30, 2020, the net investment income return on average net assets was (3.1)% as compared to 3.9% for the prior year period.
The net investment loss for the six months ended June 30, 2020 was driven by net realized and unrealized losses of $118.4 million, compared to net realized and unrealized gains of $32.8 million in the prior year period. Net realized and unrealized losses in the first half of 2020 were driven by investment market volatility caused by the economic shutdown mandated by governments around the world related to the COVID-19 global pandemic, which partially recovered in the second quarter of 2020.
The non-investment grade portfolio net interest income yield for the six months ended June 30, 2020 was 3.5%, remaining consistent with the prior year period. Net investment income return on average net assets was (5.2)% for the six months ended June 30, 2020, compared to 4.6% in the prior year period. Net realized and unrealized losses reported through the six months ended June 30, 2020 totaled $129.6 million driven by investment market volatility caused by the economic shutdown mandated by governments around the world related to the COVID-19 global pandemic, which partially recovered in the second quarter of 2020.
The investment grade portfolio net interest income yield for the six months ended June 30, 2020 was 1.0%, a decrease from 1.2% in the prior year period. The reduction in net interest income yield was driven by lower interest rates period over period. In addition, the investment grade portfolio recognized $11.1 million of net realized gains in the first half of 2020 compared to gains of $1.0 million in the first half of 2019. The investment-grade results reflected collateral management actions in the second quarter. We sold certain assets that were held in collateral trust as the collateral requirements had changed. Given the interest rate movements in the period, these assets realized net gains on disposal.
Growth in book value per diluted common share
Results for the three months ended June 30, 2020 versus 2019:
Book value per diluted common share was $38.82 as of June 30, 2020, compared to $28.21 per share as of March 31, 2020, an increase of $10.61, or 37.6%. The increase was driven by the higher fair value of the investment portfolios as the credit markets partially recovered during the quarter,
71
resulting in net realized and unrealized gains of $172.1 million and other comprehensive income of $23.0 million.
Results for the six months ended June 30, 2020 versus 2019:
Book value per diluted common share was $38.82 as of June 30, 2020, compared to $43.49 per share as of December 31, 2019, a decrease of $4.67 or 10.7%. The decrease was primarily driven by a net investment loss of $63.2 million and other comprehensive losses of $14.8 million. The net realized and unrealized investment losses in the 2020 first quarter were offset in part by net realized and unrealized gains in the 2020 second quarter. The net realized and unrealized gains can be attributed to the partial recovery in the credit markets during the 2020 second quarter.
72
Reconciliation of non-U.S. GAAP financial measures
Underwriting income (loss), adjusted underwriting income (loss), adjusted combined ratio and the non-investment grade portfolio and investment grade portfolio components of our investment returns (net interest income yield on average net assets, and net investment income return on average net assets and on average total investments (excluding accrued investment income), respectively) are non-U.S. GAAP financial measures. We use these measures, together with the GAAP financial statements, to provide information that assists with analyzing our performance. As a result, certain income and expense items are excluded from these measures in an effort to allow an effective analysis. With respect to expenses, we do not view certain operating expenses related to corporate activities, referred to as certain corporate expenses, as part of our underwriting activities. These expenses are generally comprised of costs associated with the ongoing operations of the holding company, such as compensation of certain executives and costs associated with the initial setup of subsidiaries. The following are descriptions of each of the non-U.S. GAAP financial measures used by us.
Underwriting income (loss) is useful in evaluating our underwriting performance, without regard to other underwriting income (losses), net investment income (losses), interest expense, net foreign exchange gains (losses), income tax expense (benefit) and preference dividends.
Adjusted underwriting income (loss) is useful in evaluating our underwriting performance, without regard to net investment income (losses), interest expense, net foreign exchange gains (losses), income tax expense (benefit), preference dividends and certain corporate expenses (which are described in more detail above). We define underwriting income (loss) as net premiums earned, less loss and loss adjustment expenses, acquisition expenses and general and administrative expenses, and we define adjusted underwriting income (loss) as underwriting income (loss) plus other underwriting income (loss) less certain corporate expenses. Our adjusted combined ratio is a key indicator of our profitability, without regard to certain corporate expenses. We calculate the adjusted combined ratio by dividing the sum of loss and loss adjustment expenses, acquisition expenses and general and administrative expenses less certain corporate expenses by the sum of net premiums earned and other underwriting income (loss).
The non-investment grade portfolio and investment grade portfolio components of our investment returns (net interest income yield on average net assets, and net investment income return on average net assets and on average total investments (excluding accrued investment income), respectively) are useful in evaluating our investment performance. The non-investment grade portfolio component of these investment returns reflect the performance of our investment strategy under HPS, which includes the use of leverage. The investment grade portfolio component of these investment returns reflect the performance of the investment portfolios that predominantly support our underwriting collateral.
We use underwriting income (loss), adjusted underwriting income (loss) and the adjusted combined ratio and the separate components of our returns (non-investment grade portfolio and investment grade portfolio) as internal performance measures in the management of our operations because we believe they give us and users of our financial information useful insight into our results of operations and our underlying business performance. Underwriting income (loss) and adjusted underwriting (income) loss should not be viewed as a substitute for net income (loss) calculated in accordance with U.S. GAAP, and our adjusted combined ratio should not be viewed as a substitute for our combined ratio. Furthermore, other companies may define these measures differently.
73
Reconciliation of underwriting income (loss) and adjusted underwriting income (loss)
Underwriting income (loss) reconciles to net income (loss) available to common shareholders, and adjusted underwriting income (loss) reconciles to underwriting income (loss) for the three and six months ended June 30, 2020 and 2019 as follows:
Three Months Ended June 30, | Six Months Ended June 30, | ||||||||||||||
2020 | 2019 | 2020 | 2019 | ||||||||||||
($ in thousands) | |||||||||||||||
Net income (loss) available to common shareholders | $ | 188,828 | $ | 13,825 | $ | (78,951 | ) | $ | 61,457 | ||||||
Preference dividends | 1,109 | 4,908 | 2,280 | 9,815 | |||||||||||
Net income (loss) before preference dividends | 189,937 | 18,733 | (76,671 | ) | 71,272 | ||||||||||
Income tax expense (benefit) | (402 | ) | 20 | (402 | ) | 20 | |||||||||
Interest expense | 2,911 | — | 5,823 | — | |||||||||||
Net foreign exchange (gains) losses | (2,665 | ) | 441 | (7,678 | ) | 878 | |||||||||
Net investment (income) loss | (199,491 | ) | (23,787 | ) | 63,208 | (82,141 | ) | ||||||||
Other underwriting (income) loss | (868 | ) | (673 | ) | (1,001 | ) | (1,265 | ) | |||||||
Underwriting income (loss) | (10,578 | ) | (5,266 | ) | (16,721 | ) | (11,236 | ) | |||||||
Certain corporate expenses | 3,443 | 4,795 | 6,439 | 6,758 | |||||||||||
Other underwriting income (loss) | 868 | 673 | 1,001 | 1,265 | |||||||||||
Adjusted underwriting income (loss) | $ | (6,267 | ) | $ | 202 | $ | (9,281 | ) | $ | (3,213 | ) | ||||
74
Reconciliation of the adjusted combined ratio
The adjusted combined ratio reconciles to the combined ratio for the three and six months ended June 30, 2020 and 2019 as follows:
Three Months Ended June 30, | |||||||||||||||||||||||
2020 | 2019 | ||||||||||||||||||||||
Amount | Adjustment | As Adjusted | Amount | Adjustment | As Adjusted | ||||||||||||||||||
($ in thousands) | |||||||||||||||||||||||
Losses and loss adjustment expenses | $ | 104,786 | $ | — | $ | 104,786 | $ | 111,416 | $ | — | $ | 111,416 | |||||||||||
Acquisition expenses | 29,486 | — | 29,486 | 35,417 | — | 35,417 | |||||||||||||||||
General & administrative expenses (1) | 7,841 | (3,443 | ) | 4,398 | 9,751 | (4,795 | ) | 4,956 | |||||||||||||||
Net premiums earned (1)(2) | 131,535 | 868 | 132,403 | 151,318 | 673 | 151,991 | |||||||||||||||||
Loss ratio | 79.7 | % | 73.6 | % | |||||||||||||||||||
Acquisition expense ratio | 22.4 | % | 23.4 | % | |||||||||||||||||||
General & administrative expense ratio (1) | 5.9 | % | 6.5 | % | |||||||||||||||||||
Combined ratio | 108.0 | % | 103.5 | % | |||||||||||||||||||
Adjusted loss ratio | 79.1 | % | 73.3 | % | |||||||||||||||||||
Adjusted acquisition expense ratio | 22.3 | % | 23.3 | % | |||||||||||||||||||
Adjusted general & administrative expense ratio | 3.3 | % | 3.3 | % | |||||||||||||||||||
Adjusted combined ratio | 104.7 | % | 99.9 | % | |||||||||||||||||||
(1) Adjustments include certain corporate expenses, which are deducted from general and administrative expenses, and other underwriting income (loss), which is added to net premiums earned.
(2) The adjustment to net premiums earned relates to “other underwriting income” from underwriting contracts accounted for as derivatives.
75
Six Months Ended June 30, | |||||||||||||||||||||||
2020 | 2019 | ||||||||||||||||||||||
Amount | Adjustment | As Adjusted | Amount | Adjustment | As Adjusted | ||||||||||||||||||
($ in thousands) | |||||||||||||||||||||||
Losses and loss adjustment expenses | $ | 215,462 | $ | — | $ | 215,462 | $ | 222,266 | $ | — | $ | 222,266 | |||||||||||
Acquisition expenses | 57,853 | — | 57,853 | 69,391 | — | 69,391 | |||||||||||||||||
General & administrative expenses (1) | 14,980 | (6,439 | ) | 8,541 | 16,991 | (6,758 | ) | 10,233 | |||||||||||||||
Net premiums earned (1)(2) | 271,574 | 1,001 | 272,575 | 297,412 | 1,265 | 298,677 | |||||||||||||||||
Loss ratio | 79.3 | % | 74.7 | % | |||||||||||||||||||
Acquisition expense ratio | 21.3 | % | 23.3 | % | |||||||||||||||||||
General & administrative expense ratio (1) | 5.6 | % | 5.8 | % | |||||||||||||||||||
Combined ratio | 106.2 | % | 103.8 | % | |||||||||||||||||||
Adjusted loss ratio | 79.0 | % | 74.4 | % | |||||||||||||||||||
Adjusted acquisition expense ratio | 21.2 | % | 23.2 | % | |||||||||||||||||||
Adjusted general & administrative expense ratio | 3.2 | % | 3.5 | % | |||||||||||||||||||
Adjusted combined ratio | 103.4 | % | 101.1 | % | |||||||||||||||||||
(1) Adjustments include certain corporate expenses, which are deducted from general and administrative expenses, and other underwriting income (loss), which is added to net premiums earned.
(2) The adjustment to net premiums earned relates to “other underwriting income” from underwriting contracts accounted for as derivatives.
76
Reconciliation of the non-investment grade portfolio and investment grade portfolio components of our investment returns
The non-investment grade portfolio and the investment grade portfolio components of our investment returns for the three and six months ended June 30, 2020 and 2019 are as follows:
Three Months Ended June 30, 2020 | Three Months Ended June 30, 2019 | ||||||||||||||||||||||||||||||
Non-Investment Grade | Investment Grade | Cost of U/W Collateral (4) | Total | Non-Investment Grade | Investment Grade | Cost of U/W Collateral (4) | Total | ||||||||||||||||||||||||
($ in thousands) | |||||||||||||||||||||||||||||||
Interest income | $ | 32,410 | $ | 4,043 | $ | — | $ | 36,453 | $ | 32,492 | $ | 6,104 | $ | — | $ | 38,596 | |||||||||||||||
Investment management fees - related parties | (3,943 | ) | (319 | ) | — | (4,262 | ) | (4,171 | ) | (399 | ) | — | (4,570 | ) | |||||||||||||||||
Borrowing and miscellaneous other investment expenses | (2,741 | ) | (212 | ) | (1,810 | ) | (4,763 | ) | (3,809 | ) | (238 | ) | (3,564 | ) | (7,611 | ) | |||||||||||||||
Net interest income | 25,726 | 3,512 | (1,810 | ) | 27,428 | 24,512 | 5,467 | (3,564 | ) | 26,415 | |||||||||||||||||||||
Net realized gains (losses) on investments | (14,912 | ) | 8,911 | — | (6,001 | ) | (177 | ) | 966 | — | 789 | ||||||||||||||||||||
Net unrealized gains (losses) on investments (1) | 178,050 | 14 | — | 178,064 | (4,511 | ) | 2,786 | — | (1,725 | ) | |||||||||||||||||||||
Investment performance fees - related parties | — | — | — | — | (1,692 | ) | — | — | (1,692 | ) | |||||||||||||||||||||
Net investment income (loss) | $ | 188,864 | $ | 12,437 | $ | (1,810 | ) | $ | 199,491 | $ | 18,132 | $ | 9,219 | $ | (3,564 | ) | $ | 23,787 | |||||||||||||
Average total investments (excluding accrued investment income) (2) | $1,782,413 | $793,663 | $ | — | $2,576,076 | $1,871,286 | $928,850 | $ | — | $2,800,136 | |||||||||||||||||||||
Average net assets (3) | $1,446,900 | $800,175 | $(246,250) | $2,000,825 | $1,548,237 | $924,948 | $(327,619) | $2,145,566 | |||||||||||||||||||||||
Net interest income yield on average net assets (3) | 1.8 | % | 0.4 | % | 1.4 | % | 1.6 | % | 0.6 | % | 1.2 | % | |||||||||||||||||||
Net investment income return on average total investments (excluding accrued investment income) (2) | 10.6 | % | 1.6 | % | 7.7 | % | 1.0 | % | 1.0 | % | 0.8 | % | |||||||||||||||||||
Net investment income return on average net assets (3) | 13.1 | % | 1.6 | % | (0.7 | )% | 10.0 | % | 1.2 | % | 1.0 | % | (1.1 | )% | 1.1 | % | |||||||||||||||
(1) Net unrealized gains (losses) on investments excludes unrealized gains and losses from the available for sale portfolios, which are recorded in other comprehensive income.
(2) Net investment income return on average total investments (excluding accrued investment income) is calculated by dividing net investment income by average total investments. For the three-month period, average total investments is calculated using the average of the beginning and ending balance of each quarterly period. However, for the investment grade portfolio component of these returns, the impact of revolving credit agreement borrowings is not subtracted from net investment income.
(3) Net interest income yield on average net assets and net investment income return on average net assets are calculated by dividing net interest income, and net investment income (loss), respectively, by average net assets. For the non-investment grade component of investment returns and total investment returns, net assets is calculated as the sum of total investments, accrued investment income and receivables for securities sold, less total revolving credit agreement borrowings, payable for securities purchased and payable for securities sold short. However, for the investment grade portfolio component of these returns, the impact of the revolving credit agreement borrowings is not subtracted from net interest income, net investment income (loss), or the net assets calculation.
(4) The cost of underwriting collateral is calculated as the revolving credit agreement expenses for the investment grade portfolios divided by the average total revolving credit agreement borrowings for the investment grade portfolios during the period.
77
Six Months Ended June 30, 2020 | Six Months Ended June 30, 2019 | ||||||||||||||||||||||||||||||
Non-Investment Grade | Investment Grade | Cost of U/W Collateral (4) | Total | Non-Investment Grade | Investment Grade | Cost of U/W Collateral (4) | Total | ||||||||||||||||||||||||
($ in thousands) | |||||||||||||||||||||||||||||||
Interest income | $ | 65,174 | $ | 9,103 | $ | — | $ | 74,277 | $ | 69,831 | $ | 11,906 | $ | — | $ | 81,737 | |||||||||||||||
Investment management fees - related parties | (7,916 | ) | (698 | ) | — | (8,614 | ) | (8,242 | ) | (737 | ) | — | (8,979 | ) | |||||||||||||||||
Borrowing and miscellaneous other investment expenses | (5,332 | ) | (437 | ) | (4,663 | ) | (10,432 | ) | (8,667 | ) | (442 | ) | (6,800 | ) | (15,909 | ) | |||||||||||||||
Net interest income | 51,926 | 7,968 | (4,663 | ) | 55,231 | 52,922 | 10,727 | (6,800 | ) | 56,849 | |||||||||||||||||||||
Net realized gains (losses) on investments | (22,137 | ) | 11,090 | — | (11,047 | ) | 1,142 | 929 | — | 2,071 | |||||||||||||||||||||
Net unrealized gains (losses) on investments (1) | (107,443 | ) | 51 | — | (107,392 | ) | 23,114 | 7,599 | — | 30,713 | |||||||||||||||||||||
Investment performance fees - related parties | — | — | — | — | (7,492 | ) | — | — | (7,492 | ) | |||||||||||||||||||||
Net investment income (loss) | $ | (77,654 | ) | $ | 19,109 | $ | (4,663 | ) | $ | (63,208 | ) | $ | 69,686 | $ | 19,255 | $ | (6,800 | ) | $ | 82,141 | |||||||||||
Average total investments (excluding accrued investment income) (2) | $1,786,375 | $807,149 | $ | — | $2,593,524 | $1,883,565 | $908,637 | $ | — | $2,792,202 | |||||||||||||||||||||
Average net assets (3) | $1,488,863 | $813,118 | $(287,500) | $2,014,481 | $1,527,241 | $905,937 | $(322,303) | $2,110,875 | |||||||||||||||||||||||
Net interest income yield on average net assets (3) | 3.5 | % | 1.0 | % | 2.7 | % | 3.5 | % | 1.2 | % | 2.7 | % | |||||||||||||||||||
Net investment income return on average total investments (excluding accrued investment income) (2) | (4.3 | )% | 2.4 | % | (2.4 | )% | 3.7 | % | 2.1 | % | 2.9 | % | |||||||||||||||||||
Net investment income return on average net assets (3) | (5.2 | )% | 2.4 | % | (1.6 | )% | (3.1 | )% | 4.6 | % | 2.1 | % | (2.1 | )% | 3.9 | % | |||||||||||||||
(1) Net unrealized gains (losses) on investments excludes unrealized gains and losses from the available for sale portfolios, which are recorded in other comprehensive income.
(2) Net investment income return on average total investments is calculated by dividing net investment income by average total investments. For the six-month period, average total investments is calculated using the average of the beginning and ending balance of each quarterly period. However, for the investment grade portfolio component of these returns, the impact of revolving credit agreement borrowings is not subtracted from net investment income.
(3) Net interest income yield on average net assets and net investment income return on average net assets are calculated by dividing net interest income, and net investment income (loss), respectively, by average net assets. For the non-investment grade component of investment returns and total investment returns, net assets is calculated as the sum of total investments, accrued investment income and receivables for securities sold, less total revolving credit agreement borrowings, payable for securities purchased and payable for securities sold short. However, for the investment grade portfolio component of these returns, the impact of the revolving credit agreement borrowings is not subtracted from net interest income, net investment income (loss), or the net assets calculation.
(4) The cost of underwriting collateral is calculated as the revolving credit agreement expenses for the investment grade portfolios divided by the average total revolving credit agreement borrowings for the investment grade portfolios during the period.
78
As of June 30, 2020 | As of June 30, 2019 | ||||||||||||||||||||||||||||||
Non-Investment Grade | Investment Grade | Borrowings for U/W Collateral | Total | Non-Investment Grade | Investment Grade | Borrowings for U/W Collateral | Total | ||||||||||||||||||||||||
($ in thousands) | |||||||||||||||||||||||||||||||
Average total investments (excluding accrued investment income) - QTD | $ | 1,782,413 | $ | 793,663 | $ | — | $ | 2,576,076 | $ | 1,871,286 | $ | 928,850 | $ | — | $ | 2,800,136 | |||||||||||||||
Average total investments (excluding accrued investment income) - YTD | 1,786,375 | 807,149 | — | 2,593,524 | 1,883,565 | 908,637 | — | 2,792,202 | |||||||||||||||||||||||
Average net assets - QTD | 1,446,900 | 800,175 | (246,250 | ) | 2,000,825 | 1,548,237 | 924,948 | (327,619 | ) | 2,145,566 | |||||||||||||||||||||
Average net assets - YTD | 1,488,863 | 813,118 | (287,500 | ) | 2,014,481 | 1,527,241 | 905,937 | (322,303 | ) | 2,110,875 | |||||||||||||||||||||
Total investments | $ | 1,846,404 | $ | 792,941 | $ | — | $ | 2,639,345 | $ | 1,833,476 | $ | 936,629 | $ | — | $ | 2,770,105 | |||||||||||||||
Accrued Investment Income | 10,853 | 3,511 | — | 14,364 | 11,834 | 5,082 | — | 16,916 | |||||||||||||||||||||||
Receivable for Securities Sold | 28,298 | 3,016 | — | 31,314 | 29,367 | 58 | — | 29,425 | |||||||||||||||||||||||
Less: Payable for Securities Purchased | 67,272 | — | — | 67,272 | 46,412 | 4,804 | — | 51,216 | |||||||||||||||||||||||
Less: Payable for Securities Sold Short | 29,289 | — | — | 29,289 | 48,823 | — | — | 48,823 | |||||||||||||||||||||||
Less: Revolving credit agreement borrowings | 308,611 | — | 163,750 | 472,361 | 229,546 | — | 328,751 | 558,297 | |||||||||||||||||||||||
Net assets | $ | 1,480,383 | $ | 799,468 | $ | (163,750 | ) | $ | 2,116,101 | $ | 1,549,896 | $ | 936,965 | $ | (328,751 | ) | $ | 2,158,110 | |||||||||||||
Non-investment grade borrowing ratio (1) | 20.8 | % | 14.8 | % | |||||||||||||||||||||||||||
Unrealized gains on investments | $ | 44,845 | $ | 14,278 | $ | — | $ | 59,123 | $ | 27,068 | $ | 8,160 | $ | — | $ | 35,228 | |||||||||||||||
Unrealized losses on investments | (221,353 | ) | (23,121 | ) | — | (244,474 | ) | (109,200 | ) | (4,737 | ) | — | (113,937 | ) | |||||||||||||||||
Net unrealized gains (losses) on investments | $ | (176,508 | ) | $ | (8,843 | ) | $ | — | $ | (185,351 | ) | $ | (82,132 | ) | $ | 3,423 | $ | — | $ | (78,709 | ) | ||||||||||
(1) The non-investment grade borrowing ratio is calculated as revolving credit agreement borrowings divided by net assets.
79
Critical accounting policies, estimates and recent accounting pronouncements
The preparation of consolidated financial statements in accordance with GAAP requires us to make many estimates and judgments that affect the reported amounts of assets, liabilities (including reserves), revenues and expenses, and related disclosures of contingent liabilities. On an ongoing basis, we evaluate our estimates, including those related to revenue recognition, insurance and other reserves, reinsurance recoverables and fair value measurements. We base our estimates on historical experience, where possible, and on various other assumptions that we believe to be reasonable under the circumstances, which form the basis for our judgments about the carrying values of assets and liabilities that are not readily apparent from other sources. Estimates and judgments for a relatively new company, like our company, are even more difficult to make than those made in a mature company since we have compiled relatively limited historical information through June 30, 2020. Actual results will differ from these estimates and such differences may be material.
The critical accounting policies that we believe affect significant estimates used in the preparation of our consolidated financial statements, as well as certain recent accounting pronouncements, are discussed under the heading “Management’s discussion and analysis of financial condition and results of operations-Critical accounting policies, estimates and recent accounting pronouncements” contained in our Annual Report on Form 10-K for the year ended December 31, 2019, updated, where applicable, in the notes accompanying our consolidated financial statements included in this report, including Note 2, “Basis of presentation and significant accounting policies”.
Financial condition, liquidity and capital resources
General
We are a holding company whose assets primarily consist of the shares in our subsidiaries. Generally, we depend on our available cash resources, dividends or other distributions from subsidiaries to make payments, including the payment of interest on our senior notes, dividends on our preference shares and operating expenses we may incur. During the six months ended June 30, 2020 and the year ended December 31, 2019, we received dividends of $7.9 million and $13.4 million, respectively, from Watford Re, our Bermuda operating subsidiary.
The ability of our regulated operating subsidiaries to pay dividends or make distributions is dependent on their ability to meet applicable regulatory standards. Under Bermuda law, Watford Re is required to maintain an enhanced capital requirement, or ECR, which must equal or exceed its minimum solvency margin (in other words, the amount by which the value of its general business assets must exceed its general business liabilities). Watford Re is also required to maintain a minimum liquidity ratio whereby the value of its relevant assets is not less than 75% of the amount of its relevant liabilities for general business. Watford Re is prohibited from declaring or paying any dividends during any financial year if it is not in compliance with each of its ECR, minimum solvency margin and minimum liquidity ratio. In any financial year, Watford Re is prohibited from declaring or paying dividends of more than 25% of its total statutory capital and surplus (as shown on its previous financial year’s statutory balance sheet) unless it files, at least seven days before payment of such dividends, with the Bermuda Monetary Authority, or the BMA, an affidavit attesting that a dividend would not cause Watford Re to fail to meet its relevant margins. As of December 31, 2019, as determined under Bermuda law, Watford Re had a statutory capital and surplus of $1.1 billion and was in compliance with its ECR, minimum solvency margin and minimum liquidity ratio. Accordingly, as of December 31, 2019, Watford Re was able to pay dividends of up to $276.6 million to us during 2020 without the requirement of filing such an affidavit with the BMA. This is subject to ongoing monitoring of capital throughout 2020. In addition, Watford Re is prohibited, without prior approval of the BMA, from reducing by 15% or more its total statutory capital, as set out in its previous year’s statutory financial statements.
80
Our U.S. and Gibraltar insurance subsidiaries are subject to similar insurance laws and regulations in the jurisdictions in which they operate. The ability of these insurance subsidiaries to pay dividends or make distributions is also dependent on their ability to meet applicable regulatory standards.
Furthermore, the ability of our operating subsidiaries to pay dividends to us and to intermediate subsidiaries owned by us could be constrained by our dependence on financial strength ratings from independent rating agencies. Our ratings from these agencies depend to a large extent on the capitalization levels of our operating subsidiaries. We believe that we have sufficient cash resources and available dividend capacity to service our indebtedness, pay required dividends on our preference shares and satisfy other current outstanding obligations.
Financial condition
Shareholders’ equity
2020 versus 2019: Total shareholders’ equity was $776.2 million as of June 30, 2020, compared to $872.4 million as of December 31, 2019, a decrease of $96.2 million or 11.0%.
The decrease in shareholders’ equity was primarily driven by net investment loss of $63.2 million, an underwriting loss of $16.7 million, other comprehensive loss of $14.8 million, an interest expense of $5.8 million, preference dividends of $2.3 million, offset in part by net foreign exchange gains of $7.7 million and other underwriting income of $1.0 million. In addition, the repurchase of 127,744 common shares during the 2020 first quarter under our $50 million share repurchase program reduced shareholders’ equity by $2.9 million.
81
Investment portfolios
The table below summarizes the credit quality of our non-investment grade and investment grade portfolios as of June 30, 2020 and December 31, 2019, as rated by Standard & Poor’s Financial Services, LLC, or Standard & Poor’s, Moody’s Investors Service, or Moody’s, Fitch Ratings Inc., or Fitch, or Kroll Bond Rating Agency, or KBRA, DBRS Morningstar, or DBRS, as applicable:
Credit Rating (1) | |||||||||||||||||||||||||||||||||||||||||||||||
June 30, 2020 | Fair Value | AAA | AA | A | BBB | BB | B | CCC | CC | C | D | Not Rated | |||||||||||||||||||||||||||||||||||
($ in thousands) | |||||||||||||||||||||||||||||||||||||||||||||||
Non-Investment Grade Portfolio: | |||||||||||||||||||||||||||||||||||||||||||||||
Term loan investments | $ | 875,560 | $ | — | $ | — | $ | — | $ | — | $ | 23,218 | $ | 530,118 | $ | 247,478 | $ | 15,191 | $ | 2,192 | $ | 28,046 | $ | 29,317 | |||||||||||||||||||||||
Corporate bonds | 378,183 | — | — | — | 37,373 | 50,125 | 152,648 | 113,723 | 6,268 | 5,585 | 3,956 | 8,505 | |||||||||||||||||||||||||||||||||||
Asset-backed securities | 157,925 | — | — | 3,854 | 98,827 | 23,136 | 8,767 | 1,663 | — | — | — | 21,678 | |||||||||||||||||||||||||||||||||||
Mortgage-backed securities | 9,164 | — | — | — | — | 1,292 | — | — | — | — | 3,224 | 4,648 | |||||||||||||||||||||||||||||||||||
Short-term investments | 270,088 | 34,859 | 172,166 | 60,880 | — | 502 | — | — | — | — | — | 1,681 | |||||||||||||||||||||||||||||||||||
Total fixed income instruments and short-term investments | 1,690,920 | 34,859 | 172,166 | 64,734 | 136,200 | 98,273 | 691,533 | 362,864 | 21,459 | 7,777 | 35,226 | 65,829 | |||||||||||||||||||||||||||||||||||
Other Investments | 34,142 | ||||||||||||||||||||||||||||||||||||||||||||||
Equities | 121,342 | ||||||||||||||||||||||||||||||||||||||||||||||
Total Non-Investment Grade Portfolio | $ | 1,846,404 | $ | 34,859 | $ | 172,166 | $ | 64,734 | $ | 136,200 | $ | 98,273 | $ | 691,533 | $ | 362,864 | $ | 21,459 | $ | 7,777 | $ | 35,226 | $ | 65,829 | |||||||||||||||||||||||
Investment Grade Portfolio: | |||||||||||||||||||||||||||||||||||||||||||||||
Corporate bonds | $ | 169,918 | $ | — | $ | 16,032 | $ | 90,087 | $ | 58,858 | $ | 4,941 | $ | — | $ | — | $ | — | $ | — | $ | — | $ | — | |||||||||||||||||||||||
U.S. government and government agency bonds | 217,459 | — | 217,459 | — | — | — | — | — | — | — | — | — | |||||||||||||||||||||||||||||||||||
Asset-backed securities | 130,327 | 1,377 | — | 19,621 | 108,790 | 539 | — | — | — | — | — | — | |||||||||||||||||||||||||||||||||||
Mortgage-backed securities | 22,018 | — | 602 | 4,794 | 16,622 | — | — | — | — | — | — | — | |||||||||||||||||||||||||||||||||||
Non-U.S. government and government agency bonds | 151,124 | — | 151,124 | — | — | — | — | — | — | — | — | — | |||||||||||||||||||||||||||||||||||
Municipal government and government agency bonds | 2,117 | 1,039 | 586 | 492 | — | — | — | — | — | — | — | — | |||||||||||||||||||||||||||||||||||
Short-term investments | 99,978 | 3,448 | 22,656 | — | 73,874 | — | — | — | — | — | — | — | |||||||||||||||||||||||||||||||||||
Total Investment Grade Portfolio | $ | 792,941 | $ | 5,864 | $ | 408,459 | $ | 114,994 | $ | 258,144 | $ | 5,480 | $ | — | $ | — | $ | — | $ | — | $ | — | $ | — | |||||||||||||||||||||||
Total | $ | 2,639,345 | $ | 40,723 | $ | 580,625 | $ | 179,728 | $ | 394,344 | $ | 103,753 | $ | 691,533 | $ | 362,864 | $ | 21,459 | $ | 7,777 | $ | 35,226 | $ | 65,829 | |||||||||||||||||||||||
(1) For individual fixed maturity investments, Standard & Poor’s ratings are used. In the absence of a Standard & Poor’s rating, ratings from Moody’s are used, followed by ratings from Fitch, followed by ratings from KBRA, followed by ratings from DBRS.
82
Credit Rating (1) | |||||||||||||||||||||||||||||||||||||||||||||||
December 31, 2019 | Fair Value | AAA | AA | A | BBB | BB | B | CCC | CC | C | D | Not Rated | |||||||||||||||||||||||||||||||||||
($ in thousands) | |||||||||||||||||||||||||||||||||||||||||||||||
Non-Investment Grade Portfolio: | |||||||||||||||||||||||||||||||||||||||||||||||
Term loan investments | $ | 1,061,934 | $ | — | $ | — | $ | — | $ | — | $ | 9,617 | $ | 761,168 | $ | 215,909 | $ | 6,823 | $ | 2,119 | $ | — | $ | 66,298 | |||||||||||||||||||||||
Corporate bonds | 213,841 | — | — | — | — | 9,003 | 58,345 | 135,613 | — | — | — | 10,880 | |||||||||||||||||||||||||||||||||||
Asset-backed securities | 190,738 | — | — | 4,002 | 105,706 | 29,695 | 18,381 | — | — | — | — | 32,954 | |||||||||||||||||||||||||||||||||||
Mortgage-backed securities | 7,706 | — | — | — | — | 976 | — | — | — | — | 2,497 | 4,233 | |||||||||||||||||||||||||||||||||||
Short-term investments | 232,436 | — | 116,805 | 34,903 | 64,108 | — | — | 8,359 | — | — | — | 8,261 | |||||||||||||||||||||||||||||||||||
Total fixed income instruments and short-term investments | 1,706,655 | — | 116,805 | 38,905 | 169,814 | 49,291 | 837,894 | 359,881 | 6,823 | 2,119 | 2,497 | 122,626 | |||||||||||||||||||||||||||||||||||
Other Investments | 30,461 | ||||||||||||||||||||||||||||||||||||||||||||||
Equities | 125,137 | ||||||||||||||||||||||||||||||||||||||||||||||
Total Non-Investment Grade Portfolio | $ | 1,862,253 | $ | — | $ | 116,805 | $ | 38,905 | $ | 169,814 | $ | 49,291 | $ | 837,894 | $ | 359,881 | $ | 6,823 | $ | 2,119 | $ | 2,497 | $ | 122,626 | |||||||||||||||||||||||
Investment Grade Portfolio: | |||||||||||||||||||||||||||||||||||||||||||||||
Corporate bonds | $ | 158,632 | $ | — | $ | 36,128 | $ | 81,401 | $ | 41,103 | $ | — | $ | — | $ | — | $ | — | $ | — | $ | — | $ | — | |||||||||||||||||||||||
U.S. government and government agency bonds | 285,609 | — | 285,609 | — | — | — | — | — | — | — | — | — | |||||||||||||||||||||||||||||||||||
Asset-backed securities | 145,433 | 2,006 | — | 25,177 | 118,250 | — | — | — | — | — | — | — | |||||||||||||||||||||||||||||||||||
Mortgage-backed securities | 24,750 | — | — | 1,100 | 23,650 | — | — | — | — | — | — | — | |||||||||||||||||||||||||||||||||||
Non-U.S. government and government agency bonds | 133,409 | — | 132,460 | — | 949 | — | — | — | — | — | — | — | |||||||||||||||||||||||||||||||||||
Municipal government and government agency bonds | 2,184 | 1,135 | 573 | 476 | — | — | — | — | — | — | — | — | |||||||||||||||||||||||||||||||||||
Short-term investments | 96,867 | 25,783 | 20,037 | — | 51,047 | — | — | — | — | — | — | — | |||||||||||||||||||||||||||||||||||
Total Investment Grade Portfolio | $ | 846,884 | $ | 28,924 | $ | 474,807 | $ | 108,154 | $ | 234,999 | $ | — | $ | — | $ | — | $ | — | $ | — | $ | — | $ | — | |||||||||||||||||||||||
Total | $ | 2,709,137 | $ | 28,924 | $ | 591,612 | $ | 147,059 | $ | 404,813 | $ | 49,291 | $ | 837,894 | $ | 359,881 | $ | 6,823 | $ | 2,119 | $ | 2,497 | $ | 122,626 | |||||||||||||||||||||||
(1) For individual fixed maturity investments, Standard & Poor’s ratings are used. In the absence of a Standard & Poor’s rating, ratings from Moody’s are used, followed by ratings from Fitch, followed by ratings from KBRA, followed by ratings from DBRS.
83
The following tables summarize the composition of the Company’s non-investment grade and investment grade portfolios by sector as of June 30, 2020 and December 31, 2019:
June 30, 2020 | |||||||||||||||||||||||||||||||||||
Total | Financials | Health Care | Technology | Consumer Services | Industrials | Consumer Goods | Oil & Gas | All Other (1) | |||||||||||||||||||||||||||
($ in thousands) | |||||||||||||||||||||||||||||||||||
Non-Investment Grade Portfolio: | |||||||||||||||||||||||||||||||||||
Term loan investments | $ | 875,560 | $ | 188,970 | $ | 170,442 | $ | 186,367 | $ | 113,733 | $ | 90,250 | $ | 36,455 | $ | 29,573 | $ | 59,770 | |||||||||||||||||
Corporate bonds | 378,183 | 44,898 | 26,626 | 16,720 | 105,543 | 33,870 | 68,314 | 29,516 | 52,696 | ||||||||||||||||||||||||||
Equities - sector specific | 93,872 | 62,350 | 22,577 | 7,266 | — | 641 | — | 264 | 774 | ||||||||||||||||||||||||||
Short-term investments - sector specific | 2,184 | — | — | 1,682 | — | — | 502 | — | — | ||||||||||||||||||||||||||
Subtotal | 1,349,799 | 296,218 | 219,645 | 212,035 | 219,276 | 124,761 | 105,271 | 59,353 | 113,240 | ||||||||||||||||||||||||||
Equities - non-sector specific | 27,470 | ||||||||||||||||||||||||||||||||||
Short-term investments - non-sector specific | 267,904 | ||||||||||||||||||||||||||||||||||
Asset-backed securities | 157,925 | ||||||||||||||||||||||||||||||||||
Other investments | 34,142 | ||||||||||||||||||||||||||||||||||
Mortgage-backed securities | 9,164 | ||||||||||||||||||||||||||||||||||
Total Non-Investment Grade Portfolio | $ | 1,846,404 | $ | 296,218 | $ | 219,645 | $ | 212,035 | $ | 219,276 | $ | 124,761 | $ | 105,271 | $ | 59,353 | $ | 113,240 | |||||||||||||||||
Investment Grade Portfolio: | |||||||||||||||||||||||||||||||||||
Corporate bonds | $ | 169,918 | $ | 51,327 | $ | 10,834 | $ | 18,688 | $ | 22,738 | $ | 11,942 | $ | 35,818 | $ | 11,388 | $ | 7,183 | |||||||||||||||||
Short-term investments | 99,978 | ||||||||||||||||||||||||||||||||||
U.S. government and government agency bonds | 217,459 | ||||||||||||||||||||||||||||||||||
Non-U.S. government and government agency bonds | 151,124 | ||||||||||||||||||||||||||||||||||
Asset-backed securities | 130,327 | ||||||||||||||||||||||||||||||||||
Mortgage-backed securities | 22,018 | ||||||||||||||||||||||||||||||||||
Municipal government and government agency bonds | 2,117 | ||||||||||||||||||||||||||||||||||
Total Investment Grade Portfolio | $ | 792,941 | $ | 51,327 | $ | 10,834 | $ | 18,688 | $ | 22,738 | $ | 11,942 | $ | 35,818 | $ | 11,388 | $ | 7,183 | |||||||||||||||||
Total Investments | $ | 2,639,345 | $ | 347,545 | $ | 230,479 | $ | 230,723 | $ | 242,014 | $ | 136,703 | $ | 141,089 | $ | 70,741 | $ | 120,423 | |||||||||||||||||
(1) Includes telecommunications, utilities and basic materials.
84
December 31, 2019 | |||||||||||||||||||||||||||||||||||
Total | Financials | Health Care | Technology | Consumer Services | Industrials | Consumer Goods | Oil & Gas | All Other (1) | |||||||||||||||||||||||||||
($ in thousands) | |||||||||||||||||||||||||||||||||||
Non-Investment Grade Portfolio: | |||||||||||||||||||||||||||||||||||
Term loan investments | $ | 1,061,934 | $ | 212,800 | $ | 221,982 | $ | 232,659 | $ | 121,434 | $ | 111,912 | $ | 46,827 | $ | 52,200 | $ | 62,120 | |||||||||||||||||
Corporate bonds | 213,841 | 17,547 | 19,160 | 10,972 | 28,144 | 13,822 | 23,491 | 27,632 | 73,073 | ||||||||||||||||||||||||||
Equities - sector specific | 101,551 | 55,946 | 30,640 | 11,263 | — | 1,283 | — | 1,040 | 1,379 | ||||||||||||||||||||||||||
Short-term investments - sector specific | 16,620 | 8,261 | — | 3,030 | — | 5,329 | — | — | — | ||||||||||||||||||||||||||
Subtotal | 1,393,946 | 294,554 | 271,782 | 257,924 | 149,578 | 132,346 | 70,318 | 80,872 | 136,572 | ||||||||||||||||||||||||||
Equities - non-sector specific | 23,586 | ||||||||||||||||||||||||||||||||||
Short-term investments - non-sector specific | 215,816 | ||||||||||||||||||||||||||||||||||
Asset-backed securities | 190,738 | ||||||||||||||||||||||||||||||||||
Other investments | 30,461 | ||||||||||||||||||||||||||||||||||
Mortgage-backed securities | 7,706 | ||||||||||||||||||||||||||||||||||
Total Non-Investment Grade Portfolio | $ | 1,862,253 | $ | 294,554 | $ | 271,782 | $ | 257,924 | $ | 149,578 | $ | 132,346 | $ | 70,318 | $ | 80,872 | $ | 136,572 | |||||||||||||||||
Investment Grade Portfolio: | |||||||||||||||||||||||||||||||||||
Corporate bonds | $ | 158,632 | $ | 72,707 | $ | 12,087 | $ | 8,035 | $ | 11,752 | $ | 10,548 | $ | 32,046 | $ | 5,734 | $ | 5,723 | |||||||||||||||||
Short-term investments | 96,867 | ||||||||||||||||||||||||||||||||||
U.S. government and government agency bonds | 285,609 | ||||||||||||||||||||||||||||||||||
Non-U.S. government and government agency bonds | 133,409 | ||||||||||||||||||||||||||||||||||
Asset-backed securities | 145,433 | ||||||||||||||||||||||||||||||||||
Mortgage-backed securities | 24,750 | ||||||||||||||||||||||||||||||||||
Municipal government and government agency bonds | 2,184 | ||||||||||||||||||||||||||||||||||
Total Investment Grade Portfolio | $ | 846,884 | $ | 72,707 | $ | 12,087 | $ | 8,035 | $ | 11,752 | $ | 10,548 | $ | 32,046 | $ | 5,734 | $ | 5,723 | |||||||||||||||||
Total Investments | $ | 2,709,137 | $ | 367,261 | $ | 283,869 | $ | 265,959 | $ | 161,330 | $ | 142,894 | $ | 102,364 | $ | 86,606 | $ | 142,295 | |||||||||||||||||
(1) Includes telecommunications, utilities and basic materials.
85
The fair value of our term loans, fixed maturities and short-term investments in our non-investment grade and investment grade portfolios, summarized by contractual maturity as of June 30, 2020 and December 31, 2019 were as follows:
Contractual Maturity | |||||||||||||||||||||||
June 30, 2020 | Fair Value | Due in One Year or Less | Due After One Through Two Years | Due After Three Through Five Years | Due After Five Through Ten Years | Due After Ten Years | |||||||||||||||||
($ in thousands) | |||||||||||||||||||||||
Non-Investment Grade Portfolio: | |||||||||||||||||||||||
Term loan investments | $ | 875,560 | $ | 44,818 | $ | 235,683 | $ | 265,836 | $ | 329,223 | $ | — | |||||||||||
Corporate bonds | 378,183 | 28 | 64,440 | 140,246 | 165,990 | 7,479 | |||||||||||||||||
Short-term investments | 270,088 | 270,088 | — | — | — | — | |||||||||||||||||
Subtotal | 1,523,831 | 314,934 | 300,123 | 406,082 | 495,213 | 7,479 | |||||||||||||||||
Asset-backed securities | 157,925 | ||||||||||||||||||||||
Mortgage-backed securities | 9,164 | ||||||||||||||||||||||
Other Investments | 34,142 | ||||||||||||||||||||||
Equities | 121,342 | ||||||||||||||||||||||
Total Non-Investment Grade Portfolio | $ | 1,846,404 | $ | 314,934 | $ | 300,123 | $ | 406,082 | $ | 495,213 | $ | 7,479 | |||||||||||
Investment Grade Portfolio: | |||||||||||||||||||||||
Corporate bonds | $ | 169,918 | $ | 4,524 | $ | 22,282 | $ | 63,129 | $ | 66,723 | $ | 13,260 | |||||||||||
U.S. government and government agency bonds | 217,459 | 8,877 | 172,347 | 22,193 | 14,042 | — | |||||||||||||||||
Non-U.S. government and government agency bonds | 151,124 | 6,836 | 29,276 | 40,616 | 74,396 | — | |||||||||||||||||
Municipal government and government agency bonds | 2,117 | — | 251 | 1,374 | 492 | — | |||||||||||||||||
Short-term investments | 99,978 | 99,978 | — | — | — | — | |||||||||||||||||
Subtotal | 640,596 | 120,215 | 224,156 | 127,312 | 155,653 | 13,260 | |||||||||||||||||
Asset-backed securities | 130,327 | ||||||||||||||||||||||
Mortgage-backed securities | 22,018 | ||||||||||||||||||||||
Total - Investment Grade Portfolio | $ | 792,941 | $ | 120,215 | $ | 224,156 | $ | 127,312 | $ | 155,653 | $ | 13,260 | |||||||||||
Total | $ | 2,639,345 | $ | 435,149 | $ | 524,279 | $ | 533,394 | $ | 650,866 | $ | 20,739 | |||||||||||
86
Contractual Maturity | |||||||||||||||||||||||
December 31, 2019 | Fair Value | Due in One Year or Less | Due After One Through Two Years | Due After Three Through Five Years | Due After Five Through Ten Years | Due After Ten Years | |||||||||||||||||
($ in thousands) | |||||||||||||||||||||||
Non-Investment Grade Portfolio: | |||||||||||||||||||||||
Term loan investments | $ | 1,061,934 | $ | 23,683 | $ | 289,985 | $ | 314,908 | $ | 433,358 | $ | — | |||||||||||
Corporate bonds | 213,841 | 15,746 | 21,879 | 113,750 | 61,933 | 533 | |||||||||||||||||
Short-term investments | 232,436 | 232,436 | — | — | — | — | |||||||||||||||||
Subtotal | 1,508,211 | 271,865 | 311,864 | 428,658 | 495,291 | 533 | |||||||||||||||||
Asset-backed securities | 190,738 | ||||||||||||||||||||||
Mortgage-backed securities | 7,706 | ||||||||||||||||||||||
Other Investments | 30,461 | ||||||||||||||||||||||
Equities | 125,137 | ||||||||||||||||||||||
Total Non-Investment Grade Portfolio | $ | 1,862,253 | $ | 271,865 | $ | 311,864 | $ | 428,658 | $ | 495,291 | $ | 533 | |||||||||||
Investment Grade Portfolio: | |||||||||||||||||||||||
Corporate bonds | $ | 158,632 | $ | 2,760 | $ | 45,676 | $ | 54,584 | $ | 43,586 | $ | 12,026 | |||||||||||
U.S. government and government agency bonds | 285,609 | 1,490 | 212,884 | 41,976 | 29,259 | — | |||||||||||||||||
Non-U.S. government and government agency bonds | 133,409 | 6,745 | 31,443 | 32,213 | 63,008 | — | |||||||||||||||||
Municipal government and government agency bonds | 2,184 | — | 253 | 1,330 | 601 | — | |||||||||||||||||
Short-term investments | 96,867 | 96,867 | — | — | — | — | |||||||||||||||||
Subtotal | 676,701 | 107,862 | 290,256 | 130,103 | 136,454 | 12,026 | |||||||||||||||||
Asset-backed securities | 145,433 | ||||||||||||||||||||||
Mortgage-backed securities | 24,750 | ||||||||||||||||||||||
Total - Investment Grade Portfolio | 846,884 | $ | 107,862 | $ | 290,256 | $ | 130,103 | $ | 136,454 | $ | 12,026 | ||||||||||||
Total | $ | 2,709,137 | $ | 379,727 | $ | 602,120 | $ | 558,761 | $ | 631,745 | $ | 12,559 | |||||||||||
Actual maturities may differ from contractual maturities because some borrowers may have the right to call or prepay obligations with or without call or prepayment penalties.
87
The following chart shows the composition of our non-investment grade and investment grade portfolios as of June 30, 2020:
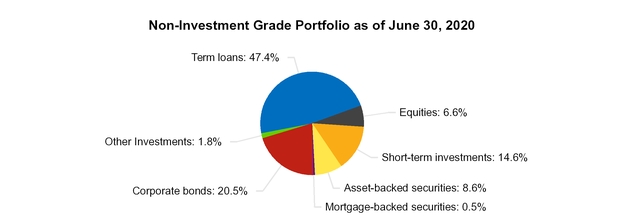
Total: $1,846.4 million
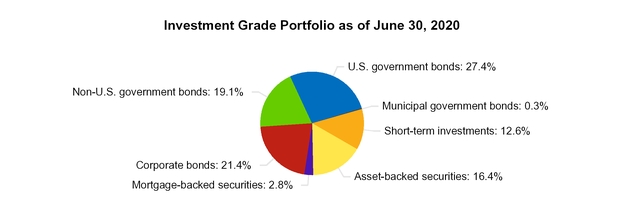
Total: $792.9 million
Liquidity and capital resources
Cash flows
Liquidity is a measure of our ability to access sufficient cash flows to meet the short-term and long-term cash requirements of our business operations. Our most significant source of operating cash flow is from premiums received from our insureds and reinsureds. Our underwriting operations provide liquidity in that premiums are received in advance, sometimes substantially in advance, of the time losses are paid. The period of time from the occurrence of a claim through the settlement of the resulting liability may extend many years into the future. We expect that our liquidity needs, including our anticipated insurance and reinsurance obligations and operating and capital expenditure needs, for at least the next 12 months, will be met by funds generated from underwriting activities and investment income, as well as by our balance of cash, short-term investments, proceeds on the sale or maturity of our investments and our credit facilities. For a discussion of the risks related to the potential future impacts of the COVID-19 global pandemic on our liquidity and capital resources, see Part II, Item 1A, “Risk Factors” in this report.
Our most significant operating cash outflow is for claim payments. Because the payment of claims occurs after the receipt of the premium, often years later, we invest the cash in various fixed income investments that earn interest. We also use cash to pay commissions to brokers, as well as to pay for
88
ongoing operating expenses such as salaries, rent and taxes, interest expense on our senior notes and dividends on our preference shares. We have reinsurance agreements with Arch and others through which we cede a portion of our business. In purchasing reinsurance, we pay part of our premiums to reinsurers and collect cash back when our reinsurers reimburse us for losses subject to our reinsurance coverage.
The timing of our cash flows from operating activities can vary among periods due to the timing by which payments are made or received. Some of our payments and receipts, including loss settlements and subsequent reinsurance receipts, can be significant, so their timing can influence cash flows from operating activities in any given period.
Sources of liquidity include cash flows from operations, financing arrangements and routine sales of investments. The following table summarizes our cash flows from operating, investing and financing activities for the six months ended June 30, 2020 and 2019:
Six Months Ended June 30, | |||||||
2020 | 2019 | ||||||
($ in thousands) | |||||||
Cash and cash equivalents provided by (used for): | |||||||
Operating activities | $ | 87,343 | $ | 115,887 | |||
Investing activities | (58,717 | ) | 35,144 | ||||
Financing activities | (17,052 | ) | (145,258 | ) | |||
Effects of exchange rate changes on foreign currency | (6,358 | ) | (325 | ) | |||
Change in cash and cash equivalents | $ | 5,216 | $ | 5,448 | |||
Results for the six months ended June 30, 2020:
• | Cash provided by operating activities for the six months ended June 30, 2020 was lower than the same period in 2019. We continued to generate strong operating cash inflows, primarily driven by our premium receipts exceeding the level of our paid claims and interest income received. |
• | Cash used for investing activities for the six months ended June 30, 2020 was higher than the same period in 2019 when cash was provided by investing activities, which was driven by an increase in net purchases in the 2020 period. There was an increase in net purchases of corporate bonds and a decrease in the net purchases of term loans for the six months ended June 30, 2020 than the same period in 2019. |
• | Cash used for financing activities for the six months ended June 30, 2020 was lower than the same period in 2019, due to increased use of the custodian bank facilities and lower borrowing repayments during the 2020 period. In addition, we purchased $2.9 million of our own common shares under our $50 million share repurchase program during the 2020 first quarter. |
Our investments in certain securities and loans may be illiquid due to contractual provisions or may prove to be illiquid in certain investment market conditions. Changes in general economic conditions could have a material adverse effect on the value and liquidity of the investments in our investment portfolios. The COVID-19 global pandemic has severely impacted the financial markets, which has had a material adverse effect on our non-investment grade portfolio, in particular. If we require significant amounts of cash on short notice in excess of our anticipated cash requirements, we may have difficulty selling these investments in a timely manner or may be forced to sell or otherwise liquidate them at unfavorable values.
The primary goals of our asset liability management process are to satisfy insurance liabilities and maintain sufficient liquidity to cover fluctuations in projected liability cash flows, including our debt service obligations and payment of dividends on our preference shares. We do not explicitly implement an exact cash flow match in each period. However, the substantial degree by which the
89
fair value of our investment portfolios exceeds the expected present value of the net underwriting liabilities, as well as the ongoing cash flow from premiums and contractual principal and interest payments received from our investment portfolios, strengthens our ability to fund the payment of claims and to service our other outstanding obligations without having to sell securities or loans at distressed prices. We believe that, generally, the combination of premium receipts and the expected principal and interest payments produced by our predominantly fixed income investment portfolios will adequately fund future claim payments and other liabilities when due.
Capital resources
In addition to the common shares and preference shares we issued in our initial funding, we have entered into credit facilities to support our business operations. Further, in July 2019, we issued our senior notes and used the net proceeds from the issuance to redeem 76.34% of our then outstanding preference shares, as described in more detail below. We believe that we hold sufficient capital to allow us to continue our business operations and execute our strategy, as well as to comply with all applicable statutory regulations.
We monitor our capital adequacy on a regular basis and will seek to adjust our capital base (up or down) according to the needs of our business. As part of our capital management program, we may seek to raise additional capital or may seek to return capital to our shareholders through share repurchases, cash dividends or other methods (or a combination of such methods). Any such determination will be at the discretion of our board of directors and will be dependent upon our profits, financial requirements and other factors, including legal restrictions, rating agency requirements and such other factors as our board of directors deems relevant.
In the first quarter of 2020, our board of directors authorized a share repurchase program, which allows us to make repurchases of up to $50 million of our common shares from time to time in open market or privately negotiated transactions. During the first quarter of 2020, we repurchased 127,744 common shares at an average price of $22.42 per share for an aggregate cost of $2.9 million. With the onset of the COVID-19 global pandemic, we temporarily halted repurchases under the program. We did not repurchase any of our common shares during the second quarter of 2020. As of June 30, 2020, approximately $47.1 million of unused share repurchase capacity remained available under the program. When there is more certainty in the global economies, we will reassess the temporary suspension of the program. Any repurchases under our share repurchase program will be in accordance with applicable laws, our organizational documents and the applicable terms of our outstanding securities. The timing and amount of the repurchase transactions under the share repurchase program will depend on a variety of factors, including market conditions, the level of future earnings, and rating agency and regulatory considerations. Other than pursuant to our share repurchase program, at the present time, we do not expect to repurchase common shares, declare or pay dividends on our common shares or otherwise return capital to our common shareholders for the foreseeable future.
90
The following table summarizes our consolidated capital position:
June 30, 2020 | December 31, 2019 | ||||||||||||
Amount | % of Total Capital | Amount | % of Total Capital | ||||||||||
($ in thousands) | |||||||||||||
Debt: | |||||||||||||
Senior notes | $ | 172,554 | 17.2 | % | $ | 172,418 | 15.7 | % | |||||
Shareholders’ equity: | |||||||||||||
Preference shares | 52,351 | 5.2 | % | 52,305 | 4.8 | % | |||||||
Shareholders’ equity | 776,151 | 77.6 | % | 872,353 | 79.5 | % | |||||||
Total shareholders’ equity | 828,502 | 82.8 | % | 924,658 | 84.3 | % | |||||||
Total capital available to Watford | $ | 1,001,056 | 100.0 | % | $ | 1,097,076 | 100.0 | % | |||||
The future capital requirements of our business will depend on many factors, including our ability to write new business successfully and to establish premium rates and reserves at levels sufficient to cover losses. Our ability to underwrite is largely dependent upon the quality of our claims paying and financial strength ratings as evaluated by independent rating agencies. In particular, we require (1) sufficient capital to maintain our financial strength ratings, as issued by ratings agencies, at a level considered necessary by management to enable our key operating subsidiaries to compete; (2) sufficient capital to enable our underwriting subsidiaries to meet the capital adequacy tests mandated by regulatory agencies in Bermuda, the United States and other key markets; and (3) sufficient letter of credit and other credit facilities to enable Watford Re to post regulatory and commercially required letters of credit and other forms of collateral that are necessary for it to write business. For more information regarding the current status of our ratings, see “-Ratings” below.
To the extent that our existing capital is insufficient to fund our future operating requirements or maintain such ratings, we may need to raise additional funds through financings or limit our growth. However, we can provide no assurance that, if needed, we would be able to obtain additional funds through financing on satisfactory terms or at all. Adverse developments in the financial markets, such as disruptions, uncertainty or volatility in the capital and credit markets may result in realized and unrealized capital losses that could have a material adverse effect on our results of operations, financial position and our businesses, and may also limit our access to capital required to operate our business.
If we are not able to obtain adequate capital, our business, results of operations and financial condition could be adversely affected, which could include, among other things, the following possible outcomes: (1) potential downgrades in the financial strength ratings assigned by ratings agencies to our operating subsidiaries, which could place those operating subsidiaries at a competitive disadvantage compared to higher-rated competitors; (2) reductions in the amount of business that our operating subsidiaries are able to write in order to meet capital adequacy-based tests enforced by regulatory agencies; and (3) any resultant ratings downgrades could, among other things, affect our ability to write business and increase the cost of bank credit and letters of credit. In addition, under certain of the reinsurance agreements assumed by our reinsurance operations, upon the occurrence of a ratings downgrade or other specified triggering event with respect to our reinsurance operations, such as a reduction in surplus by specified amounts during specified periods, our ceding company clients may be provided with certain rights, including, among other things, the right to terminate the subject reinsurance agreement and/or to require that our reinsurance operations post additional collateral.
Prior to August 1, 2019, we had a total of 9,065,200 preference shares that were issued and outstanding and, on August 1, 2019, we redeemed 76.34% of these preference shares as described
91
below. The holders of our remaining preference shares have the option, at any time on or after June 30, 2034, to redeem their preference shares at the liquidation price of $25.00 per share. We have the right to redeem any or all of our remaining preference shares at the original purchase price of $25.00 per share. On June 28, 2019, we completed a direct listing of our preference shares on the Nasdaq Global Select Market. Prior to June 30, 2019, dividends on our preference shares accrued at a fixed rate of 8½% per annum. On June 30, 2019, dividends on our preference shares began accruing at a floating rate. As noted above, on August 1, 2019, we redeemed 6,919,998 of our then outstanding preference shares. The preference shares were redeemed at a total redemption price of $25.19748 per share, inclusive of all declared and unpaid dividends, with accumulation of any undeclared dividends on or after June 30, 2019.
On July 2, 2019, we completed a private offering of $175.0 million in aggregate principal amount of our 6.5% senior notes due July 2, 2029. The aggregate principal amount was in line with our then-current limit on Tier 3 capital credit under the BMA’s regulatory framework. Interest on our senior notes is paid semi-annually in arrears on each January 2 and July 2, which commenced on January 2, 2020. Affiliates of ACGL purchased $35.0 million in aggregate principal amount of our senior notes. The $172.3 million net proceeds from the offering were used to redeem a portion of our outstanding preference shares, as described above.
As a result of the issuance of our senior notes and the redemption of our preference shares, we incur interest expenses and a reduction of preference dividends, with the cumulative effect resulting in substantial savings in our combined interest and preference dividend expense.
In addition to the capital provided by the sale of our common shares, preference shares and senior notes, we may depend on external sources of financing to support our underwriting activities, such as bank credit facilities providing loans and/or letters of credit, as well as additional note issuances. As noted above, additional equity or debt financing, if available at all, may be on terms that are unfavorable to us. In the case of equity financings, dilution to our shareholders could result, and, in any case, such securities might have rights, preferences and privileges that are senior to those of our outstanding securities.
Ratings
Our operating subsidiaries, Watford Re, WICE, WIC and WSIC, each carry a financial strength rating of “A-” (Excellent) from A.M. Best. A.M. Best assigns 16 ratings to insurance companies, which currently range from “A++” (Superior) to “F” (In Liquidation). “A-” (Excellent) is the fourth highest rating issued by A.M. Best. The “A-” (Excellent) rating is assigned to insurers that have, in A.M. Best’s opinion, an excellent ability to meet their ongoing obligations to policyholders. Each of our operating subsidiaries also carries a financial strength rating of “A” from KBRA. KBRA assigns 22 ratings to insurance companies, which currently range from “AAA” to “D”. The “A” rating, KBRA’s sixth highest rating category, is assigned to insurers for which, in KBRA’s opinion, the insurer’s financial condition is sound and the entity is likely to meet its policyholder obligations under difficult economic, financial and business conditions. These respective ratings are intended to provide an independent opinion of an insurer’s ability to meet its obligation to policyholders and neither is an evaluation directed at investors.
The financial strength ratings assigned by A.M. Best and KBRA, respectively, have an impact on the ability of Watford Re to attract reinsurance clients, and also on the ability of our insurance subsidiaries to attract and retain program administrators, agents, brokers and insureds. The A.M. Best “A-” (Excellent) rating and KBRA “A” rating obtained by Watford Re, WICE, WIC and WSIC are each consistent with our business plan and allow us to actively pursue relationships with the types of cedants, program administrators, agents, brokers and insureds targeted in our marketing plan.
In response to the unrealized, adverse mark-to-market impact on the valuation of our investment portfolios caused by the economic shutdown related to the COVID-19 global pandemic, A.M. Best and KBRA issued press releases noting potential future rating actions. In particular, on May 1, 2020,
92
A.M. Best announced that it had placed the “A-” financial strength ratings of our operating subsidiaries “under review with negative implications.” In addition, A.M. Best also placed “under review with negative implications” the long-term issuer credit rating of “BBB-” and the long-term issuer credit rating of “BB” on our cumulative contingently-redeemable preference shares. The designation of being “under review with negative implications” indicates that a previously-published rating has the potential for a near-term change (typically within six months) due to a recent event or abrupt change in the financial condition of the entity to which the rating applies. The rating remains under review until A.M. Best is able to determine the implications of the circumstances that facilitated the under review status, before making its final opinion. In addition, on June 17, 2020, after previously putting our ratings on “watch” status, KBRA reaffirmed the “A” insurance financial strength ratings of our operating subsidiaries and revised the outlook for all of our ratings to negative.
Underwriting, natural and man-made catastrophic events
The broader P&C insurance and reinsurance market in which we operate has long been subject to market cycles. “Soft” markets occur when the supply of insurance capital in a given market or territory is greater than the amount of insurance capital necessary to meet the coverage needs of the insureds in that market. When this occurs, insurance prices tend to decline and policy terms and conditions become more favorable to the insured. Conversely, there are periods when there is not enough insurance capital in the market to meet insureds’ needs, leading to a “hard” market during which insurance prices generally rise and policy terms and conditions become more favorable to the insurer.
In general, notwithstanding the prevailing global economic uncertainty related to the COVID-19 global pandemic, the current insurance and reinsurance market environment overall remains extremely competitive but is starting to show signs of hardening. Over the past several years, the industry has witnessed a gradual rate softening in response to a surplus of industry capital and a number of years of benign catastrophe activity. While the insurance and reinsurance market historically has been subject to pricing and capacity cycles, the overall market has not experienced true cyclicality in the period since the inception of our operations in 2014. However, due to recent property catastrophe losses, higher perceived social inflation, the reduction in risk free rates, and the uncertainty for the P&C business created by the COVID-19 global pandemic, pricing on certain product lines are firming and becoming more attractive on a risk adjusted basis.
In recent years, there have been certain product lines that have experienced a favorable hardening, such as U.K. and European motor insurance. The rates for these particular lines have been rising as a result of several years of higher than expected losses, as well as regulatory changes impacting loss costs. As rates and commensurate risk-adjusted returns have risen, we have increased our writings in those lines.
Since the formation of WICE, we have grown our European motor insurance business. Gross premiums written generated by WICE for the three months ended June 30, 2020 and 2019 were $60.8 million and $56.1 million, respectively. Gross premiums written by WICE for the six months ended June 30, 2020 and 2019 were $112.5 million and $110.9 million, respectively. The majority of such premiums relate to U.K. motor insurance.
We target a medium- to long-term, lower volatility underwriting portfolio with tightly managed natural catastrophe exposure in order to reduce the likelihood that our capital and/or liquidity position would be adversely affected by a catastrophe event. We seek to limit our modeled net PML, for property catastrophe exposures for each peak peril and peak zone from a modeled 1-in-250 year occurrence to no more than 10% of our total capital, which is less than most of our principal reinsurance competitors. As of June 30, 2020, our largest modeled peak peril and zone net occurrence PML was 4.5% of our total capital. Our conscious effort to limit our catastrophe exposure is designed to lower the volatility of our overall underwriting portfolio and to provide greater certainty as to future claims-related payout patterns and timing. Our casualty-focused
93
underwriting portfolio’s payout pattern is slower than that of most competitors due to the longer tail lines of business we write, and that slower payout pattern provides us with the potential for greater investment income on those premiums.
While we seek to limit our exposure to catastrophic events to a level we believe is acceptable, given the liquidity profile of our underwriting portfolio and investment portfolios, we do assume meaningful aggregate exposures to natural and man-made catastrophic events. Catastrophes can be caused by various events, including hurricanes, floods, windstorms, earthquakes, hailstorms, tornadoes, explosions, severe winter weather, fires, droughts and other natural disasters. Catastrophes can also cause losses in non-property business such as workers’ compensation or general liability. In addition to the general nature of the risks inherent in writing property business, we believe that economic and geographic trends affecting insured property, including inflation, property value appreciation and geographic concentration, tend to generally increase the size of losses from catastrophic events over time.
We monitor our exposure to catastrophic events, including earthquake and wind and periodically reevaluate the estimated PML for such exposures. Our estimated PML is determined through the use of modeling techniques, but such estimate does not represent our total potential loss for such exposures. Net PML estimates are net of expected reinsurance recoveries, before income tax and before excess reinsurance reinstatement premiums. Such modeled loss estimates are reflective of the zone indicated and not the entire portfolio. Since hurricanes and windstorms can affect more than one zone and make multiple landfalls, our loss estimates include clash estimates from other zones. Our loss estimates do not represent our maximum exposures and it is highly likely that our actual incurred losses would vary materially from the modeled estimates. There can be no assurances that we will not suffer pre-tax losses greater than 10% of total capital from one or more catastrophic events due to several factors, including the inherent uncertainties in estimating the frequency and severity of such events and the margin of error in making such determinations resulting from potential inaccuracies and inadequacies in the data provided by clients and brokers, the modeling techniques and the application of such techniques or as a result of a decision to change the percentage of shareholders’ equity exposed to a single catastrophic event. In addition, our actual losses may increase if our reinsurers fail to meet their obligations to us or the reinsurance protections purchased by us are exhausted or are otherwise unavailable. Depending on business opportunities and the mix of business that may comprise our underwriting portfolio, we may seek to adjust our self-imposed limitations on PML for catastrophe-exposed business.
For more information regarding our current outlook related to the impact of the COVID-19 global pandemic on the insurance and reinsurance industry and our business, see “-Current outlook” above.
Contractual obligations and commitments
Lloyds letter of credit facility
On May 15, 2020, Watford Re renewed its letter of credit facility with Lloyds Bank Corporate Markets Plc, New York Branch (the “Lloyds Facility”). The Lloyds Facility amount is $100.0 million and was renewed through to May 16, 2021. Under the renewed Lloyds Facility, we may request an increase in the facility amount, up to an aggregate of $50.0 million. The principal purpose of the Lloyds Facility is to issue, as required, evergreen standby letters of credit in favor of primary insurance or reinsurance counterparties with which we have entered into reinsurance arrangements to ensure that such counterparties are permitted to take credit for reinsurance obtained from us as required under insurance regulations in the United States. The amount of letters of credit issued is driven by, among other things, the timing and payment of catastrophe losses, loss development of existing reserves, the payment pattern of such reserves, the further expansion of our business and the loss experience of such business. When issued, the letters of credit are secured by certificates of deposit or cash. In addition, the Lloyds Facility also requires the maintenance of certain covenants, with which we were in compliance as of June 30, 2020 and December 31, 2019. At such dates, we
94
had approximately $48.7 million and $51.0 million, respectively, in restricted assets as collateral for outstanding letters of credit issued from the Lloyds Facility, which were secured by certificates of deposit. These collateral amounts are reflected as short-term investments in our consolidated balance sheets.
Unsecured letter of credit facility
On September 20, 2019, Watford Re signed a 364-day letter of credit agreement with Lloyds Bank Corporate Markets Plc and BMO Capital Markets Corp. (the “Unsecured Facility”). The Unsecured Facility amount is $100.0 million, and will be automatically extended for a period of one year unless canceled or not renewed by either counterparty prior to expiration. The principal purpose of the Unsecured Facility is to issue, as required, evergreen standby letters of credit in favor of primary insurance or reinsurance counterparties with which we have entered into reinsurance arrangements to ensure that such counterparties are permitted to take credit for reinsurance obtained from us as required under insurance regulations in the United States. The amount of letters of credit issued is driven by, among other things, the timing and payment of catastrophe losses, loss development of existing reserves, the payment pattern of such reserves, the further expansion of our business and the loss experience of such business. The Unsecured Facility requires the maintenance of certain covenants, as well as certain representations and warranties that are customary for facilities of this type. At June 30, 2020 and December 31, 2019, we had $25.2 million and $19.3 million, respectively, in outstanding letters of credit issued from the Unsecured Facility, and were in compliance with the Unsecured Facility requirements. At such dates, we had $25.2 million and $Nil, respectively, in certificates of deposit held as restricted collateral related to outstanding letters of credit issued from the Unsecured Facility. These collateral amounts are reflected as short-term investments in our consolidated balance sheets.
Bank of America secured credit facility
On November 30, 2017, Watford Re amended and restated its $800.0 million secured credit facility (the “Secured Facility”) with Bank of America, N.A. through Watford Trust, which had originally been entered into in June 2015. Watford Re owns all of the beneficial interests of Watford Trust. The Secured Facility expires on November 30, 2021 and is backed by a portion of Watford Re’s non-investment grade portfolio which has been transferred to Watford Trust and which continues to be managed by HPS pursuant to an investment management agreement between HPS and Watford Trust. The purpose of the Secured Facility is to provide borrowing capacity, including for the purchase of loans, securities and other assets and to distribute cash or any such loans, securities or other assets to Watford Re. Pursuant to this Secured Facility, the bank assigns borrowing or letter of credit capacity (or “advance rate”) for each eligible asset type held in the trust. Under our credit agreement, advance rates range from 100% for cash and 80% for certain first-lien loans to 40% for certain small-issue unsecured bonds.
Borrowings under the Secured Facility may be made at LIBOR or an alternative base rate at our option, in either case plus an applicable margin. The applicable margin varies based on the applicable base rate and, in the case of LIBOR rate borrowings, the currency in which the borrowing is denominated. In addition, the Secured Facility allows for us to issue up to $400.0 million in evergreen standby letters of credit in favor of primary insurance or reinsurance counterparties with which we have entered into reinsurance arrangements. We pay a fee on each letter of credit equal to the amount available to be drawn under such letter of credit multiplied by an applicable percentage. The applicable percentage varies based on the currency in which the letter of credit is denominated.
95
The borrowings and outstanding letters of credit from the Secured Facility were as follows:
June 30, | December 31, | ||||||
2020 | 2019 | ||||||
($ in thousands) | |||||||
Borrowings to purchase investments | $ | 171,837 | $ | 155,537 | |||
Borrowings to purchase collateral | 163,750 | 328,750 | |||||
Total secured credit facility borrowings | 335,587 | 484,287 | |||||
Outstanding letters of credit | 52,533 | 52,533 | |||||
The Secured Facility contains various affirmative and negative covenants. As of June 30, 2020 and December 31, 2019, Watford Re was in compliance with all covenants contained in the Secured Facility.
Custodian bank facilities
As of June 30, 2020 and December 31, 2019, we had borrowings of $136.8 million and $Nil, respectively, from our custodian banks to purchase U.S. dollar denominated securities. We pay interest based on 3-month LIBOR plus a margin and the borrowed amount is payable upon demand.
As of June 30, 2020, the total borrowed amount of $136.8 million included 0.6 million Euros, or EUR, (U.S. dollar equivalent of $0.7 million) to purchase EUR-denominated securities. We pay interest based on 3-month LIBOR plus a margin and the borrowed amount is payable upon demand. The foreign exchange gain or loss on revaluation on the non-U.S. dollar-denominated borrowed funds is included as a component of “net foreign exchange gains (losses)” included in the consolidated statements of net income (loss).
The custodian banks require us to hold cash and investments on deposit, or in an investment account with respect to the borrowed funds. At June 30, 2020 and December 31, 2019, we were required to hold $214.9 million and $Nil, respectively, in such deposits and investment accounts.
Senior notes
On July 2, 2019, we completed a private offering of $175.0 million in aggregate principal amount of our 6.5% senior notes, due July 2, 2029. Interest on the senior notes is paid semi-annually in arrears on each January 2 and July 2, which commenced on January 2, 2020. The senior notes are Watford Holding’s senior unsecured and unsubordinated obligations and rank equally with all of the other existing and future obligations of Watford Holdings that are unsecured and unsubordinated. We may redeem the senior notes at any time, in whole or in part, prior to July 2, 2024, at “make-whole” redemption price, subject to BMA requirements. The senior notes are redeemable, in whole or in part, at a redemption price equal to 100% of the principal amount, subject to BMA requirements, at any time after July 2, 2024. At June 30, 2020, the carrying amount of the senior notes was $172.6 million, presented net of unamortized debt issuance costs of $2.4 million.
Master confirmation of total return swap transactions
On August 13, 2018, Watford Re executed a Master Confirmation of Total Return Swap Transactions (the “Master TRS”) with Credit Suisse International (“CSI”) under the ISDA Master Agreement between Watford Re and CSI dated as of April 24, 2014. Under the Master TRS, we can from time to time execute total return swap transactions referencing loan obligations. The purpose of the Master TRS is to allow us to obtain leveraged exposure to loan obligations in a cash efficient manner. Since each transaction will be confirmed separately, the Master TRS is uncommitted and does not have a maximum facility size. Each confirmed transaction executed under the Master TRS will expire on the earlier of (i) the repayment date of the underlying reference loan or (ii) the date specified in the confirmation, which cannot be later than 360 days after the date of the confirmation, provided that
96
each transaction will automatically extend for a further 360 days unless certain events have occurred. Under the terms of the Master TRS, we are required to post collateral to CSI under our ISDA Credit Support Annex with CSI to support our obligations under each transaction. The collateral will comprise an initial amount, determined on a transaction-by-transaction basis, plus an amount calculated on the basis of the daily mark-to-market value of the transaction. Under each transaction, CSI will pay to us an amount equal to the amounts received by a lender of the specified principal amount under the relevant reference loan and, if the transaction is terminated before the loan is repaid, an amount based on the change in market value of the loan. We have the option to terminate any transaction at will, subject to paying a break fee, and CSI can terminate transactions if certain events occur, including the unavailability of market prices for the relevant loan, CSI being unable to hedge the relevant transaction or certain changes of law or regulation.
Pledged and restricted assets
For the benefit of certain Arch entities and other third parties that cede business to us, we are required to post and maintain collateral to support our potential obligations under reinsurance contracts that we write. This collateral can be in the form of either investment assets held in collateral trust accounts or letters of credit. Under our credit facilities, in order for us to have the bank issue a letter of credit to our reinsurance contract counterparty, we must post investment assets or cash as collateral to the bank. In either case, the amounts remain restricted for the duration of the term of the trust or letter of credit, as applicable. See Note 13, “Commitments and contingencies” in our consolidated financial statements in Part I, Item 1 of this report for further details.
As of June 30, 2020 and December 31, 2019, we held $2.2 billion and $2.1 billion, respectively, in pledged assets in support of insurance and reinsurance liabilities as well as to collateralize our credit facilities. Included within total pledged assets, we held $6.7 million and $6.4 million, respectively, in deposits with U.S. regulatory authorities.
The following table summarizes our assets pledged as collateral for credit and letter of credit facilities and total return swap transactions, assets held in trust for underwriting transactions and regulatory deposits as of June 30, 2020 and December 31, 2019:
June 30, | December 31, | ||||||
2020 | 2019 | ||||||
($ in thousands) | |||||||
Total investments held in trust as collateral for underwriting transactions and regulatory deposits | $ | 958,380 | $ | 1,087,707 | |||
Total investments pledged for Secured Facility | 859,496 | 935,132 | |||||
Total investments pledged for custodian banks | 214,870 | — | |||||
Total investments pledged for Lloyds Facilities | 73,873 | 51,047 | |||||
Total investments pledged for Master TRS | 60,666 | 64,107 | |||||
97
Contractual obligations and commitments
The following table illustrates our contractual obligations and commitments by due date as of June 30, 2020 and December 31, 2019:
Payments Due by Period | |||||||||||||||||||
Total | Less Than One Year | One Year to Less Than Three Years | Three Years to Less Than Five Years | More Than Five Years | |||||||||||||||
($ in thousands) | |||||||||||||||||||
June 30, 2020 | |||||||||||||||||||
Estimated gross payments for losses and loss adjustment expenses (1) | $ | 1,353,049 | $ | 338,760 | $ | 453,577 | $ | 237,731 | $ | 322,981 | |||||||||
Interest payments on senior notes (2) | 108,094 | 11,375 | 22,750 | 22,750 | 51,219 | ||||||||||||||
Senior notes (2) | 175,000 | — | — | — | 175,000 | ||||||||||||||
Revolving credit agreement borrowings (3) | 472,361 | 472,361 | — | — | — | ||||||||||||||
Operating lease obligations | 897 | 283 | 566 | 48 | — | ||||||||||||||
Total | $ | 2,109,401 | $ | 822,779 | $ | 476,893 | $ | 260,529 | $ | 549,200 | |||||||||
December 31, 2019 | |||||||||||||||||||
Estimated gross payments for losses and loss adjustment expenses (1) | $ | 1,263,628 | $ | 319,685 | $ | 415,163 | $ | 223,406 | $ | 305,374 | |||||||||
Interest payments on senior notes (2) | 108,094 | 11,375 | 22,750 | 22,750 | 51,219 | ||||||||||||||
Senior notes (2) | 175,000 | — | — | — | 175,000 | ||||||||||||||
Revolving credit agreement borrowings (3) | 484,287 | 484,287 | — | — | — | ||||||||||||||
Operating lease obligations | 1,038 | 283 | 566 | 189 | — | ||||||||||||||
Total | $ | 2,032,047 | $ | 815,630 | $ | 438,479 | $ | 246,345 | $ | 531,593 | |||||||||
(1) The estimated expected contractual commitments related to the reserves for loss and loss adjustment expenses are presented on a gross basis (not reflecting any corresponding reinsurance recoverable amounts that would be due to us). As of June 30, 2020, the modeled duration of our claims reserves was approximately 4.4 years.
(2) On July 2, 2019 we completed a private offering of $175.0 million aggregate principal amount of our 6.5% senior notes due July 2, 2029. Interest on the senior notes is paid semi-annually in arrears on each January 2 and July 2, which commenced on January 2, 2020.
(3) Revolving credit agreement borrowings include borrowings from our custodian bank to purchase securities, which is payable on demand. Therefore we have assumed that these payments will be made within one year, but payment may occur over a longer period of time.
Reserves for losses and loss adjustment expenses represent our best estimate of the ultimate cost of settling reported and unreported claims and related expenses. As discussed previously, the estimation of loss and loss expense reserves is based on various complex and subjective judgments. Actual losses and settlement expenses we are ultimately required to pay may deviate, perhaps substantially, from the reserve estimates reflected in our financial statements. Similarly, the timing for payment of our estimated losses is not fixed and is not determinable on an individual or aggregate basis. The assumptions used in estimating the payments due by period are based on industry and peer-group claims payment experience. Due to the uncertainty inherent in the process of estimating the timing of such payments, there is a risk that the amounts paid in any period can be significantly different than the amounts discussed above. Amounts discussed above are gross of anticipated amounts recoverable from reinsurers. Reinsurance balances recoverable on reserves for losses and loss adjustment expenses are reported separately as assets, instead of being netted with the related liabilities, since having purchased reinsurance does not discharge us of our liability to policyholders. Reinsurance balances recoverable on reserves for paid and unpaid losses and loss adjustment expenses as of June 30, 2020 and December 31, 2019 totaled $229.7 million and $171.0 million, respectively.
98
Inflation
The effects of inflation are considered implicitly in pricing our contracts and policies through the modeled components such as demand surge. Loss reserves are established to recognize likely loss settlements at the date payment is made. Those reserves inherently recognize the effects of inflation. The actual effects of inflation on our results cannot be accurately known, however, until claims are ultimately resolved.
Off-balance sheet arrangements
We are not party to any transaction, agreement or other contractual arrangement to which an entity unconsolidated with us is a party that management believes is reasonably likely to have a current or future effect on our financial condition, revenues or expenses, results of operations, liquidity, capital expenditures or capital resources that is material to investors.
99
Item 3. Quantitative and qualitative disclosures about market risk
We believe we are principally exposed to the following types of market risk:
• | foreign currency risk; |
• | interest rate risk; |
• | credit spread risk; |
• | credit risk; |
• | liquidity risk; and |
• | political risk. |
Foreign currency risk
Underwriting contracts and policies
Foreign currency rate risk is the potential change in value, income and cash flow arising from adverse changes in foreign currency exchange rates. We have foreign currency exposure related to non-U.S. dollar denominated contracts and policies. Of our gross premiums written from inception, $1.5 billion, or 40.7%, were written in currencies other than the U.S. dollar. For these contracts, non-U.S. dollar assets generally offset liabilities in the same non-U.S. dollar currencies resulting in minimal net exposure. As of June 30, 2020 and December 31, 2019, net loss and loss adjustment expense reserves included $435.8 million and $413.7 million, respectively, in foreign currencies.
Investments
We are exposed to foreign currency risk through cash and investments in loans and securities denominated in foreign currencies. Foreign currency exchange rate risk is the potential for adverse changes in the U.S. dollar value of investments (long and short) and foreign currency derivative instruments, which we may employ from a risk management perspective, due to a change in the exchange rate of the foreign currency in which cash and financial instruments are denominated. As of June 30, 2020 and December 31, 2019, our total net long exposure to foreign denominated investments represented 12.9% and 11.5% of our total investment portfolios of $2.6 billion and $2.7 billion, respectively.
100
The following table summarizes the net impact that a 10% increase and decrease in the value of the U.S. dollar against select foreign currencies in which we have written contracts and policies would have had on the value of our shareholders’ equity as of June 30, 2020 and December 31, 2019:
June 30, | December 31, | ||||||
2020 | 2019 | ||||||
(U.S. dollars in thousands, except per share data) | |||||||
Assets, net of insurance liabilities, denominated in foreign currencies, excluding shareholders’ equity and derivatives | $ | 90,587 | $ | 56,382 | |||
Shareholders’ equity denominated in foreign currencies (1) | (22,068 | ) | (26,529 | ) | |||
Net assets denominated in foreign currencies | $ | 68,519 | $ | 29,853 | |||
Pre-tax impact of a hypothetical 10% appreciation of the U.S. dollar against foreign currencies: | |||||||
Shareholders’ equity | $ | (6,852 | ) | $ | (2,985 | ) | |
Book value per diluted common share | $ | (0.34 | ) | $ | (0.15 | ) | |
Pre-tax impact of a hypothetical 10% decline of the U.S. dollar against foreign currencies: | |||||||
Shareholders’ equity | $ | 6,852 | $ | 2,985 | |||
Book value per diluted common share | $ | 0.34 | $ | 0.15 | |||
(1) Represents capital contributions held in the foreign currency of WICE.
Although we generally attempt to match the currency of our projected liabilities with investments in the same currencies, from time to time we may elect to over or underweight one or more currencies, which could increase our exposure to foreign currency fluctuations and increase the volatility of our shareholders’ equity. Historical observations indicate a low probability that all foreign currency exchange rates would shift against the U.S. dollar in the same direction and at the same time and, accordingly, the actual effect of foreign currency rate movements may differ materially from the amounts set forth above.
Interest rate risk
Our investment portfolios include interest rate sensitive securities, such as corporate and sovereign debt instruments and asset-backed securities. One key market risk exposure for any debt instrument is interest rate risk. As interest rates rise, the market value of our fixed income portfolio may fall, and the opposite is generally true when interest rates fall. Based on historical observations, there is a low probability that all interest rate yield curves would shift in the same direction at the same time. Furthermore, at times interest rate movements in certain credit sectors exhibit a much lower correlation to changes in U.S. Treasury yields. Accordingly, the actual effect of interest rate movements may differ materially from the amounts set forth in the following tables.
101
The following table estimates the impact that a 50 basis point and 100 basis point increase or decrease in interest rates would have had on the value of our investment portfolios as of June 30, 2020 and December 31, 2019:
Interest Rate Shift in Basis Points | |||||||||||||||||||
(U.S. dollars in millions) | -100 | -50 | 0 | +50 | +100 | ||||||||||||||
June 30, 2020 | |||||||||||||||||||
Total fair value | $ | 2,680 | $ | 2,662 | $ | 2,639 | $ | 2,612 | $ | 2,588 | |||||||||
Change from base | 1.6 | % | 0.9 | % | — | % | (1.0 | )% | (1.9 | )% | |||||||||
Change in unrealized value | $ | 41 | $ | 23 | $ | — | $ | (27 | ) | $ | (51 | ) | |||||||
December 31, 2019 | |||||||||||||||||||
Total fair value | $ | 2,739 | $ | 2,724 | $ | 2,709 | $ | 2,693 | $ | 2,679 | |||||||||
Change from base | 1.1 | % | 0.6 | % | — | % | (0.6 | )% | (1.1 | )% | |||||||||
Change in unrealized value | $ | 30 | $ | 15 | $ | — | $ | (16 | ) | $ | (30 | ) | |||||||
Credit spread risk
We invest in credit spread sensitive assets, primarily debt assets. We consider the effect of credit spread movements on the market value of our fixed maturity investments, short-term investments, and certain of our other investments and the corresponding change in market value. As credit spreads widen, the fair value of our fixed income investments falls, and the converse is also true. Based upon historical observations, there is a low probability that credit spreads would change in the same magnitude across asset classes, industries, credit ratings, jurisdictions and individual instruments. Accordingly, the actual effect of credit spread movements may differ materially from the amounts set forth in the following tables.
The following table summarizes the effect that an immediate, parallel shift in credit spreads in a static interest rate environment would have had on the value of our investment portfolios as of June 30, 2020 and December 31, 2019:
Percentage Shift in Credit Spreads | |||||||||||||||||||
(U.S. dollars in millions) | -50% | -10% | 0 | +10% | +50% | ||||||||||||||
June 30, 2020 | |||||||||||||||||||
Total fair value | $ | 2,861 | $ | 2,683 | $ | 2,639 | $ | 2,591 | $ | 2,419 | |||||||||
Change from base | 8.4 | % | 1.7 | % | — | % | (1.8 | )% | (8.3 | )% | |||||||||
Change in unrealized value | $ | 222 | $ | 44 | $ | — | $ | (48 | ) | $ | (220 | ) | |||||||
December 31, 2019 | |||||||||||||||||||
Total fair value | $ | 2,836 | $ | 2,735 | $ | 2,709 | $ | 2,681 | $ | 2,569 | |||||||||
Change from base | 4.7 | % | 1.0 | % | — | % | (1.0 | )% | (5.2 | )% | |||||||||
Change in unrealized value | $ | 127 | $ | 26 | $ | — | $ | (28 | ) | $ | (140 | ) | |||||||
Credit risk
Underwriting contracts and policies
We are exposed to credit risk from our clients relating to premiums receivable under our contracts and policies, and the possibility that counterparties may default on their obligations to us. The risk of counterparty default is partially mitigated by the fact that any amount owed to us from an
102
insurance or reinsurance counterparty would be netted against any losses we would pay in the future. We monitor the collectability of these premiums on a regular basis.
Investments
Our investment strategy is to invest primarily in the debt obligations of non-investment grade corporate issuers. We rely upon our Investment Managers to invest our funds in debt instruments that provide an attractive risk-adjusted return, but the value we ultimately receive from these debt instruments is dependent upon the performance of the issuers of such obligations. In addition, the securities and cash in our investment portfolios are held with several custodians and prime brokers, subjecting us to the related credit risk from the possibility that one or more of them may default on their obligations to us. Our Investment Managers regularly monitor the concentration of credit risk with each broker and if necessary, transfer cash or securities among brokers to diversify and mitigate our credit risk.
Liquidity risk
Certain of our investments are, or may become, illiquid. Disruptions in the credit markets may materially affect the liquidity of certain investments including our Level 3 (non-quoted) assets, which, as of June 30, 2020 and December 31, 2019, represented 5.2% and 5.4% of our total investments, respectively. If we require significant amounts of cash on short notice in excess of anticipated cash requirements, which could include the payment of claims expenses or to satisfy a requirement of rating agencies in a period of market illiquidity, certain of our investments may be difficult to sell in a timely manner and may have to be sold or otherwise liquidated for less than what may otherwise have been possible under normal market conditions.
Political risk
We are exposed to political risk to the extent that we underwrite business from entities located in foreign markets; we operate through subsidiaries located in Bermuda, the United States and Gibraltar, and to the extent that HPS or AIM trade securities or assets that are originated, listed or traded in various U.S. and foreign markets. The governments in any of these jurisdictions could impose restrictions, regulations or other measures which may have a material impact on our investment strategy, the value of our investments and our underwriting operations.
We do not currently write political risk coverage in our insurance or reinsurance contracts; however, changes in government law and regulation may impact our underwriting operations.
103
Item 4. Controls and procedures
Evaluation of Disclosure Controls and Procedures
We maintain disclosure controls and procedures that are designed to ensure that information required to be disclosed in the reports we file under the Securities Exchange Act on 1934, as amended, or the Exchange Act, is recorded, processed, summarized and reported within the time periods specified in the SEC’s rules and forms, and that such information is accumulated and communicated to our management, including our Chief Executive Officer and Chief Financial Officer, as appropriate, to allow timely decisions regarding required financial disclosure.
As of the end of the period covered by this report, we carried out an evaluation, under the supervision and with the participation of our management, including our Chief Executive Officer and Chief Financial Officer, of the effectiveness of the design and operation of our disclosure controls and procedures defined under Rules 13a-15(e) and 15d-15(e) under the Exchange Act. Based upon this evaluation, our Chief Executive Officer and Chief Financial Officer concluded that our disclosure controls and procedures were effective.
Changes in Internal Controls over Financial Reporting
There were no changes in our internal control over financial reporting (as defined in Rules 13a-15(f) and 15d-15(f) under the Exchange Act) that occurred during the fiscal quarter ended June 30, 2020 that have materially affected, or are reasonably likely to materially affect, our internal control over financial reporting. We have not experienced any material impact to our internal controls over financial reporting despite the fact that most employees of the Company and of our service providers have had to work from home during the COVID-19 global pandemic, though we will continue to assess the impact on the design and operating effectiveness of our internal controls.
Inherent Limitations on Effectiveness of Controls
The effectiveness of any system of controls and procedures is subject to certain limitations, and, as a result, there can be no assurance that our controls and procedures will detect all errors or fraud. A control system, no matter how well conceived and operated, can provide only reasonable, not absolute, assurance that the objectives of the control system will be attained.
104
Part II. Other information
Item 1. Legal proceedings
We, in common with the insurance industry in general, are subject to litigation and arbitration in the normal course of our business. As of June 30, 2020, we were not a party to any litigation or arbitration which is expected by management to have a material adverse effect on our results of operations and financial condition and liquidity.
Item 1A. Risk factors
Investing in our securities involves risks. For a discussion of the these potential risks or uncertainties, please see Part I—Item 1A—“Risk Factors” and Part II—Item 7—“Management’s Discussion and Analysis of Financial Condition and Results of Operations” in our Annual Report on Form 10-K for the year ended December 31, 2019 filed with the SEC (or our 2019 Annual Report), and Part I—Item 2—“Management’s Discussion and Analysis of Financial Condition and Results of Operations” in this report, in each case as updated by our subsequent periodic filings with the SEC.
Other than as described below, there have been no material changes from the risk factors previously disclosed in Part I—Item 1A, “Risk Factors” of our 2019 Annual Report.
The impact of the COVID-19 global pandemic and related risks could materially affect our results of operations, financial position and/or liquidity.
The continuing, global pandemic caused by the novel coronavirus COVID-19 has continued to impact the global economy, financial markets and our results of operations. In addition, the COVID-19 global pandemic could materially disrupt the business operations of Arch, HPS or other third parties with whom we interact. Because of the size and breadth of this pandemic, all of the direct and indirect consequences of the COVID-19 global pandemic are not yet known and are likely to continue to emerge for some time.
The pandemic could have a significant effect on our business, results of operations, and current and future financial performance. We may continue to experience higher levels of loss and claims activity in certain lines of business and our premiums written and earned could also be adversely affected by a suppression of global commercial activity that results in a reduction in insurable assets and other exposures. Conditions in the financial markets resulting from the COVID-19 global pandemic continue to have a negative effect on the value and quality of the assets we hold within our investment portfolios, thereby adversely affecting our investment income and increasing our credit and related risk. Certain lines of our business may require additional forms of collateral in the event of a decline in the fair value of investments and benchmarks to which those repayment mechanisms are linked. The continued impacts of the pandemic to the financial markets may also adversely affect our ability to access funding through public or private equity offerings, debt financings, and through other means at acceptable terms. In addition, in connection with our pending acquisition of Axeria IARD, we are also evaluating Axeria’s potential exposure to COVID-19 global pandemic related losses.
In particular, disruption in the financial markets related to the COVID-19 global pandemic has contributed to net realized and unrealized losses, due to the impact of changes in fair value on our non-investment grade investment portfolio, and, to a lesser extent, our investment grade investment portfolio. Our investment portfolios may continue to be adversely impacted by ratings downgrades, increased bankruptcies and credit spread widening in distressed industries, such as energy, gaming, lodging and leisure, autos, airlines and retail. Our investment portfolios also include mortgage-backed securities, which could continue to be adversely impacted by declines in
105
real estate valuations and/or financial market disruption, including a heightened collection risk on the underlying mortgages and on rent receivables. Further disruptions in global financial markets due to the continuing impact of the COVID-19 global pandemic could result in additional net realized and unrealized investment losses, including potential impairments in our investment portfolios. In addition, declines in fixed income yields would result in decreases in net investment income from future investment activity, including re-investments.
For further discussion of certain of the risks related to our underwriting and investment portfolios, see “Claims for natural catastrophic events or unanticipated losses from war, pandemic, terrorism and political instability could cause large losses and substantial volatility in our results of operations and could have a material adverse effect on our financial position and results of operations,” “Emerging claim and coverage issues may adversely affect our business,” “The performance of our investments is highly dependent upon conditions in the global economy or financial markets that are outside of our Investment Managers’ control and can be difficult to predict,” and “The determination of the amount of allowances and impairments taken on our investments is highly subjective and could materially impact our results of operations or financial position.” included in Part I—Item 1A—“Risk Factors” in our 2019 Form 10-K.
Governmental and regulatory actions in response to the COVID-19 global pandemic may adversely affect our financial performance and our ability to conduct our businesses as we have in the past.
Federal, state and/or local government actions in the United States and other countries where we do business to address and mitigate the impact of the COVID-19 global pandemic have adversely affected us and may adversely affect us in the future. For example, the coverages we provide are potentially subject to legislative and/or regulatory action that seeks to retroactively mandate coverage for losses which our (re)insurance policies were not designed or priced to cover. One such example of regulatory action is the ongoing U.K. Financial Conduct Authority test case on business interruption insurance coverage. Currently, in some states there is proposed legislation to require insurers to cover business interruption claims irrespective of terms, exclusions or other conditions included in the policies that would otherwise preclude coverage. In addition, a number of states have instituted, and other states are considering instituting, changes designed to effectively expand workers’ compensation coverage by creating presumptions of compensability of claims for certain types of workers. Regulatory restrictions or requirements have impacted or may impact pricing, risk selection and our rights and obligations with respect to our policies and insureds, including our ability to cancel and non-renew policies and to collect premiums. Several state regulators have issued orders requiring insurers to issue partial premium refunds, and regulators in other states could take similar actions. Many insurers, including us, have also voluntarily provided, and may further provide, partial premium refunds to their customers. It is also possible that changes in economic conditions and steps taken by federal, state and local governments in response to the COVID-19 global pandemic could require an increase in taxes at the federal, state and local levels, which could adversely impact our results of operations. In addition, in connection with our pending acquisition of Axeria IARD, we are also evaluating the potential impact such governmental actions, restrictions and requirements could have on Axeria’s business.
The disruption and other effects caused by the COVID-19 global pandemic could continue to adversely affect our business operations, financial performance and results.
To protect our employees and in response to the global and regional restrictions on interpersonal contact and travel because of the COVID-19 global pandemic, our work force is working remotely, placing increased demands on our IT systems. Remote working arrangements may increase the risk of cyber-security attacks or data security incidents. While we believe we have continued to conduct our business effectively, there is no assurance that our ability to continue to function in this new environment will not be adversely affected by an extended period of limited access to our physical facilities or by other developments such as an extended disruption to our systems that support our remote work capability. We also depend on Arch, HPS and other third-party platforms and
106
infrastructure to operate our business and provide certain of our products and services, and such third-party infrastructures face similar risks. In addition, the continuation of the COVID-19 global pandemic may continue to adversely affect our business operations, including our ability to carry on business development activities and unavailability of employees due to illness or quarantines, among others. In addition, in connection with our pending acquisition of Axeria IARD, we are also evaluating the potential impact of such disruptions and restrictions could have on Axeria’s operations. For a further discussion, see “We depend on our ability to maintain effective operating procedures, and our operational structure remains under development.” “Any acquisitions, growth or expansion of our operations may expose us to risks.” and “Technology breaches or failures, including those resulting from a cyberattack on us or our service providers and program administrators, could disrupt or otherwise negatively impact our business.” included in Part I-Item 1A-“Risk Factors” in our 2019 Form 10-K.
As a result of the above risks, the COVID-19 global pandemic could materially and adversely impact our results of operations, financial position and/or liquidity.
A ratings downgrade or other negative action by a rating agency could materially affect our business, financial condition and results of operations.
Various rating agencies review the financial performance and condition of insurance and reinsurance companies, including our operating subsidiaries, and publish their financial strength ratings as indicators of an insurer’s or reinsurer’s ability to fulfill its contractual obligations. These ratings are important to maintaining public confidence in our insurance and reinsurance products. A downgrade or other negative action by a rating agency with respect to the financial strength ratings of our operating subsidiaries could negatively affect us by limiting or restricting the ability of our operating subsidiaries to pay dividends to us and reducing our revenues by adversely affecting our ability to write insurance and reinsurance business.
Rating agencies also publish credit ratings for us. Credit ratings are indicators of a debt issuer’s ability to meet the terms of debt obligations in a timely manner. These ratings are important to our overall ability to access certain types of capital. Actual or anticipated downgrades in our credit ratings, or an announcement that our ratings are under further review for a downgrade, could potentially have a negative effect on our financial condition and results of operations. Such an event could limit our access to capital markets, increase the cost of debt, or impair our ability to raise capital to refinance maturing debt obligations, thereby potentially limiting our capacity to support growth at our operating subsidiaries or making it more difficult to maintain or improve the current financial strength ratings of our operating subsidiaries.
In particular, in May 2020, A.M. Best announced that it had placed the financial strength ratings of our operating subsidiaries and our credit ratings under review with negative implications. In addition, in June 2020, KBRA reaffirmed the “A” insurance financial strength ratings of our operating subsidiaries, and revised the outlook for all of the ratings to negative. For more information, see Part I, Item 2. “Management’s Discussion and Analysis of Financial Condition and Results of Operations-Financial Condition, Liquidity and Capital Resources- Liquidity and Capital Resources-Ratings” in this report.
Ratings reflect only a rating agency’s views and are not recommendations to buy, sell or hold our securities. Rating agencies assign ratings based upon several factors. While most of the factors relate to the rated company, some of the factors relate to the views of the rating agency, general economic conditions and circumstances outside the rated company’s control. In addition, rating agencies use various models and formulas to assess the strength of a rated company, and from time to time rating agencies have, in their discretion, altered the models. Changes to the models could impact a rating agency’s judgment of the rating to be assigned to the rated company. There can be no assurance that our current financial strength and credit ratings will remain in effect for any given period of time, particularly in light of the recent announcements by A.M. Best and KBRA, or that these ratings will not be lowered, suspended or withdrawn entirely by the rating agencies. We
107
cannot predict what actions A.M. Best, KBRA or other rating agencies may take, or what actions we may take in response to the actions of the rating agencies, which could negatively affect our business, financial condition and results of operations.
Shareholder activism, including public criticism of our company or our management team, may adversely affect us.
In May 2020, Capital Returns Management LLC published and delivered a letter to our Board of Directors that, among other things, urged our Board to undertake a strategic review of our company. Any perceived uncertainties as to our future direction, strategy or leadership created as a consequence of this letter or other activist shareholder initiatives may adversely affect our business or cause our share price to experience periods of volatility or stagnation.
108
Item 2. Unregistered sales of equity securities and use of proceeds
In the first quarter of 2020, our board of directors authorized a share repurchase program, which allows us to make repurchases of up to $50 million of our common shares from time to time in open market or privately negotiated transactions. For more information, see Part I Item 2 “Management’s discussion and analysis of financial condition and results of operations—Liquidity and capital resources—Capital resources.”
During the three months ended June 30, 2020, we did not repurchase any of our common shares under our share repurchase program and approximately $47.1 million of unused share repurchase capacity remained available under the program.
Issuer Purchases of Common Shares | ||||||||||||||
Period | Total Number of Shares Purchased | Average Price Paid Per Share | Total Number of Shares Purchased as Part of Publicly Announced Plans or Programs | Approximate Dollar Value of Shares that May Yet be Purchased Under the Plan or Program | ||||||||||
Beginning dollar amount available to be repurchased | $ | 47,136 | ||||||||||||
4/1/2020 - 4/30/2020 | — | $ | — | — | — | |||||||||
5/1/2020 - 5/31/2020 | — | — | — | — | ||||||||||
6/1/2020 - 6/30/2020 | — | — | — | — | ||||||||||
Total | — | $ | — | — | $ | 47,136 | ||||||||
Item 3. Defaults upon senior securities
None.
Item 4. Mine safety disclosures
None.
Item 5. Other information
On May 15, 2020, Watford Re renewed its letter of credit facility with Lloyds Bank Corporate Markets Plc, New York Branch from May 16, 2020 through to May 16, 2021. For additional information regarding the Lloyds Facility, see Part I Item 2 “Management’s discussion and analysis of financial condition and results of operations - Contractual obligations and commitments - Letter of credit facility.”
As previously disclosed, on March 31, 2020, Jonathan D. Levy was appointed as our Chief Executive Officer. Mr. Levy’s appointment is subject to Bermuda immigration approval. In connection with Mr. Levy's appointment, we entered into an amended and restated employment agreement, dated August 6, 2020, with Mr. Levy (the "Levy Employment Agreement").
The term of employment is three years commencing January 1, 2018, subject to automatic one-year extensions unless either we or Mr. Levy provide 90 days’ notice of non-renewal. For 2020, Mr. Levy’s
109
annual base salary is $475,000 and his annual target annual bonus is 70% of his base salary. In connection with and following the completion of the direct listing of our common shares on the Nasdaq Global Select Market on March 28, 2019, and pursuant to the terms of the Levy Employment Agreement, in May 2019, we granted restricted share units of our common shares to Mr. Levy with a value of $900,000 (based on the average of the closing price of our common shares on the first 20 trading days of our common shares on the Nasdaq Global Select Market). The restricted share units vest in equal annual installments on each of the first three anniversaries of April 26, 2019. Upon vesting, Mr. Levy receives a number of shares of common shares equal to the number of restricted share units that have vested. In addition, each calendar year beginning with 2020, we will grant to Mr. Levy restricted share units of our common shares with a target value of $300,000 based upon our compensation committee’s assessment of Mr. Levy’s performance, one-half of which will vest in equal annual installments on each of the first three anniversaries of the grant date and one-half of which will vest based on the achievement of performance goals established by our compensation committee. If we elect not to renew the term of the Levy Employment Agreement, if we terminate Mr. Levy’s employment without Cause or if Mr. Levy terminates his employment for Good Reason (as each term is defined in the Levy Employment Agreement), we will continue to pay Mr. Levy his base salary for 12 months (24 months if the termination follows a change in control of Watford Holdings Ltd.), pay him 100% of his target annual bonus (200% if the termination follows a change in control), and his outstanding unvested restricted share units will remain outstanding and continue to vest in accordance with their terms for 12 months (all unvested restricted share units will vest if the termination is following a change in control, with performance-vesting units vesting at “target” levels). Our severance obligation to Mr. Levy is conditioned on his compliance with the restrictive covenants set forth in the Levy Employment Agreement and his execution and non-revocation of a release of claims in favor of us. Mr. Levy is subject to non-competition and non-solicitation of employees and customers covenants for a period of 12 months following termination of employment. If we elect to enforce the non-competition covenant in circumstances where Mr. Levy is not paid severance, we must continue to pay Mr. Levy his base salary and provide medical insurance for 12 months, and pay him an amount equal to his target annual bonus.
The above summary description of certain terms contained in the Levy Employment Agreement does not purport to be complete and is qualified in its entirety by reference to the full text of the agreement, a copy of which is filed as Exhibit 10.2 hereto.
110
Item 6. Exhibit index
Incorporated by Reference | ||||||||
Exhibit Number | Exhibit Description | Form | Original Exhibit Number | Date Filed | Filed Herewith | |||
10.1 | X | |||||||
10.2 | X | |||||||
31.1 | X | |||||||
31.2 | X | |||||||
32.1 | X | |||||||
32.2 | X | |||||||
101 | The following financial information from Watford Holdings Ltd.’s Quarterly Report for the quarter ended June 30, 2020 formatted in XBRL: (i) Consolidated Balance Sheets at June 30, 2020 and December 31, 2019; (ii) Consolidated Statements of Income for the three and six months ended June 30, 2020 and 2019; (iii) Consolidated Statements of Comprehensive Income for the three and six months ended June 30, 2020 and 2019; (iv) Consolidated Statements of Changes in Shareholders’ Equity for the three and six months ended June 30, 2020 and 2019; (v) Consolidated Statements of Cash Flows for the three and six months ended June 30, 2020 and 2019; and (vi) Notes to Consolidated Financial Statements. | |||||||
111
Signatures
Pursuant to the requirements of the Securities Exchange Act of 1934, the registrant has duly caused this report to be signed on its behalf by the undersigned thereunto duly authorized.
WATFORD HOLDINGS LTD. | |||
(REGISTRANT) | |||
/s/ Jonathan D. Levy | |||
Date: | August 7, 2020 | Jonathan D. Levy, Chief Executive Officer | |
Date: | August 7, 2020 | /s/ Robert L. Hawley | |
Robert L. Hawley, Chief Financial Officer | |||
112