Attached files
| file | filename |
|---|---|
| 8-K - 8-K - CENTURY CASINOS INC /CO/ | cnty-20200807x8k.htm |
| EX-99.1 - EX-99.1 - CENTURY CASINOS INC /CO/ | cnty-20200807xex99_1.htm |
Exhibit 99.2
CENTURY CASINOS, INC. Financial Results Q2 2020 Century Casinos 1
Forward-Looking Statements, Business Environment and Risk Factors This presentation may contain “forward-looking statements” within the meaning of Section 27A of the Securities Act of 1933, as amended, Section 21E of the Securities Exchange Act of 1934, as amended (the “Exchange Act”), and the Private Securities Litigation Reform Act of 1995. In addition, Century Casinos, Inc. (together with its subsidiaries, the “Company”, “we”, “us”, “our”) may make other written and oral communications from time to time that contain such statements. Forward-looking statements include statements as to industry trends and future expectations of the Company and other matters that do not relate strictly to historical facts and are based on certain assumptions by management at the time such statements are made. Forward-looking statements in this presentation include statements regarding future results of operations, including the impact of the acquisition of Mountaineer Casino, Racetrack & Resort, Century Casino Cape Girardeau and Century Casino Caruthersville (the “Acquired Casinos”) on the Company’s results, the impact of the current coronavirus (COVID-19) pandemic, the adequacy of cash flows from operations and available cash to meet our future liquidity needs, particularly if we cannot operate our casinos due to COVID-19 or their operations are restricted, operating efficiencies, synergies and operational performance, the integration of the Acquired Casinos into the Company’s business, the prospects for and timing and costs of new projects, projects in development and other opportunities, the credit agreement with Macquarie (as defined herein) and obligations under our Master Lease (as defined herein) and the ability to repay debt and other obligations, investments in joint ventures, outcomes of legal proceedings, changes in our tax provisions or exposure to additional income tax liabilities, and plans for our casinos and our Company. These statements are often identified by the use of words such as “may,” “will,” “expect,” “believe,” “anticipate,” “intend,” “could,” “estimate,” or “continue,” and similar expressions or variations. These statements are based on the beliefs and assumptions of the management of the Company based on information currently available to management. Such forward-looking statements are subject to risks, uncertainties and other factors that could cause actual results to differ materially from future results expressed or implied by such forward-looking statements. Important factors that could cause actual results to differ materially from the forward-looking statements include, among others, the risks described in the section entitled “Risk Factors” under Item 1A in our Annual Report on Form 10-K for the year ended December 31, 2019 (the “2019 Annual Report”), in Item 8.01 of our Form 8-K filed with the Securities and Exchange Commission (“SEC”) on May 8, 2020, and our subsequent periodic and current reports filed with the SEC. We caution the reader to carefully consider such factors. Furthermore, such forward-looking statements speak only as of the date on which such statements are made. We undertake no obligation to update any forward-looking statements to reflect events or circumstances after the date of such statements. Century Casinos 2

Notes on Presentation In this presentation the term “USD” refers to US dollars, the term “CAD” refers to Canadian dollars and the term “PLN” refers to Polish zloty. Adjusted EBITDA and Adjusted EBITDA margin are non-GAAP financial measures. See Appendix A for the definition and reconciliation of Adjusted EBITDA and Adjusted EBITDA margin. Amounts presented are rounded. As such, rounding differences could occur in period-over-period changes and percentages reported throughout this presentation. The names of the Company’s subsidiaries and certain operating segments are abbreviated on certain of the following slides. See Appendix A for a list of the subsidiaries and their abbreviations. Century Casinos 3
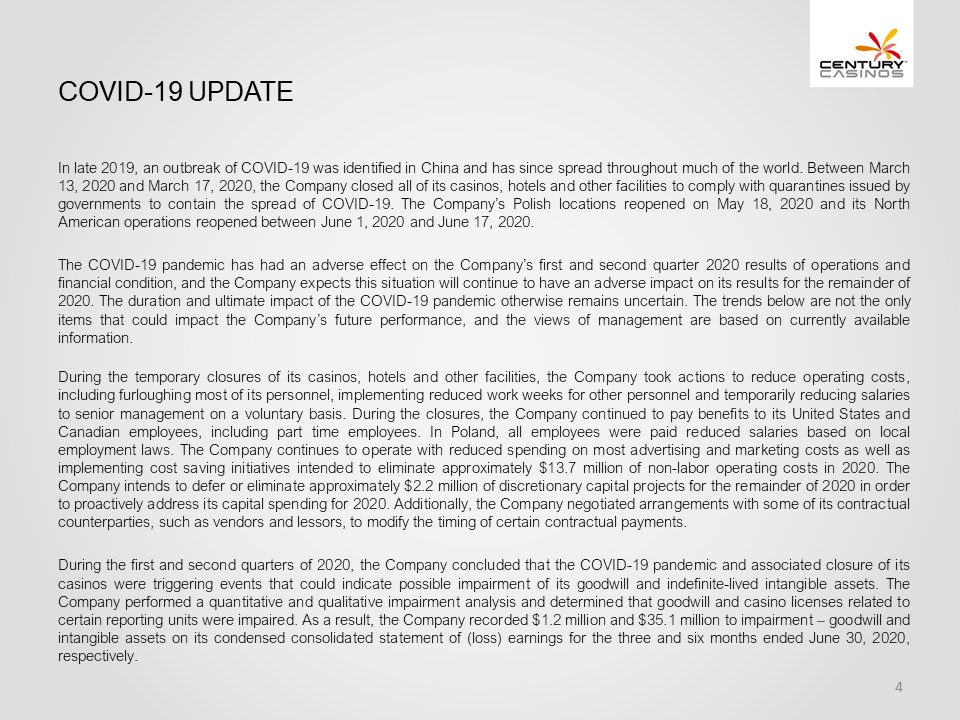
COVID-19 UPDATE In late 2019, an outbreak of COVID-19 was identified in China and has since spread throughout much of the world. Between March 13, 2020 and March 17, 2020, the Company closed all of its casinos, hotels and other facilities to comply with quarantines issued by governments to contain the spread of COVID-19. The Company’s Polish locations reopened on May 18, 2020 and its North American operations reopened between June 1, 2020 and June 17, 2020. The COVID-19 pandemic has had an adverse effect on the Company’s first and second quarter 2020 results of operations and financial condition, and the Company expects this situation will continue to have an adverse impact on its results for the remainder of 2020. The duration and ultimate impact of the COVID-19 pandemic otherwise remains uncertain. The trends below are not the only items that could impact the Company’s future performance, and the views of management are based on currently available information. During the temporary closures of its casinos, hotels and other facilities, the Company took actions to reduce operating costs, including furloughing most of its personnel, implementing reduced work weeks for other personnel and temporarily reducing salaries to senior management on a voluntary basis. During the closures, the Company continued to pay benefits to its United States and Canadian employees, including part time employees. In Poland, all employees were paid reduced salaries based on local employment laws. The Company continues to operate with reduced spending on most advertising and marketing costs as well as implementing cost saving initiatives intended to eliminate approximately $13.7 million of non-labor operating costs in 2020. The Company intends to defer or eliminate approximately $2.2 million of discretionary capital projects for the remainder of 2020 in order to proactively address its capital spending for 2020. Additionally, the Company negotiated arrangements with some of its contractual counterparties, such as vendors and lessors, to modify the timing of certain contractual payments. During the first and second quarters of 2020, the Company concluded that the COVID-19 pandemic and associated closure of its casinos were triggering events that could indicate possible impairment of its goodwill and indefinite-lived intangible assets. The Company performed a quantitative and qualitative impairment analysis and determined that goodwill and casino licenses related to certain reporting units were impaired. As a result, the Company recorded $1.2 million and $35.1 million to impairment – goodwill and intangible assets on its condensed consolidated statement of (loss) earnings for the three and six months ended June 30, 2020, respectively. Century Casions 4
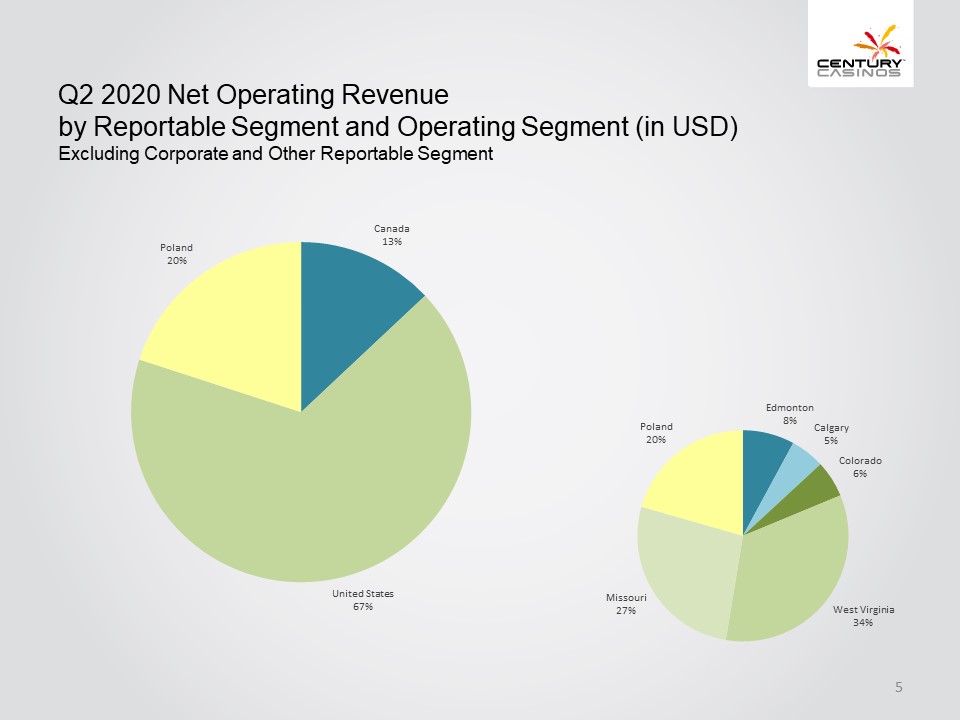
Q2 2020 Net Operating Revenue by Reportable Segment and Operating Segment (in USD) Excluding Corporate and Other Reportable Segment Poland 20% Canada 13% United States 67% Missouri 27% Poland 20% Edmonton 8% Calgary 5% Colorado 6% West Virginia 34% Century Casinos 5
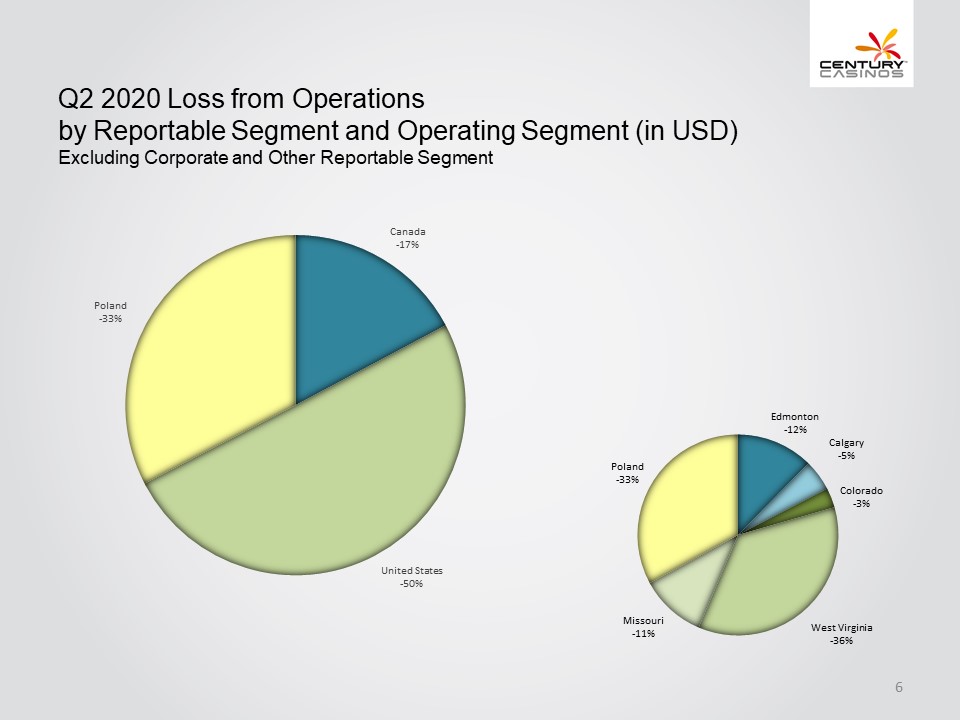
Q2 2020 Loss from Operations by Reportable Segment and Operating Segment (in USD) Excluding Corporate and Other Reportable Segment Poland -33% Canada -17% United States -50% Poland -33% Edmonton -12% Calgary -5% Colorado -3% West Virginia -36% Missouri -11% Century Casinos 6
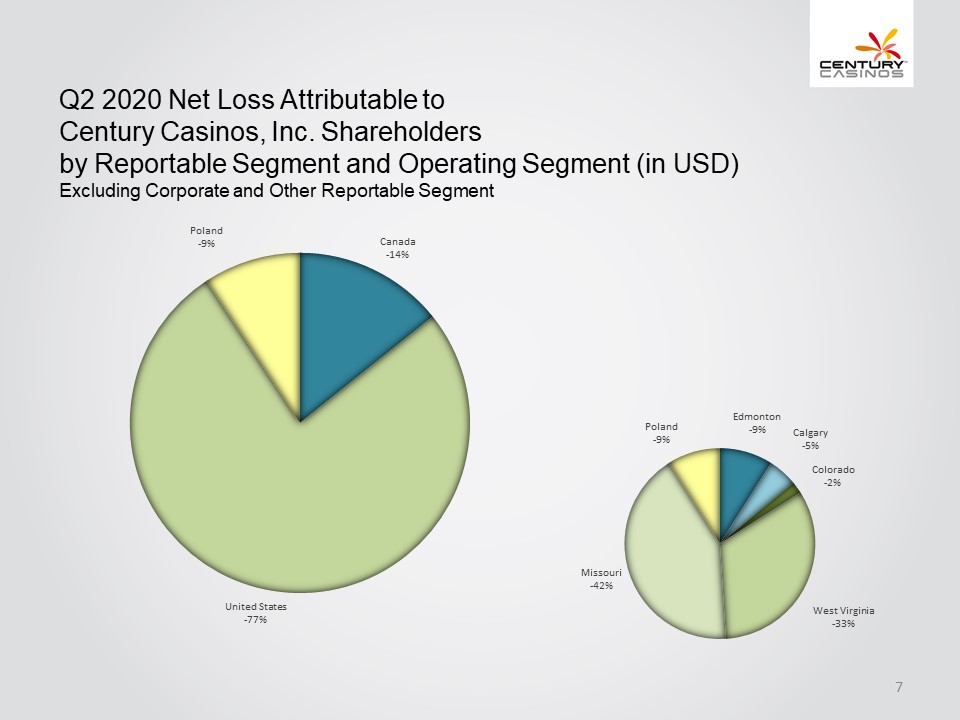
Q2 2020 Net Loss Attributable to Century Casinos, Inc. Shareholders by Reportable Segment and Operating Segment (in USD) Excluding Corporate and Other Reportable Segment Poland -9% Canada -14% United States -77% Missouri -42% Poland -9% Edmonton -9% Calgary -5% Colorado -2% West Virginia -33% Century Casino 7
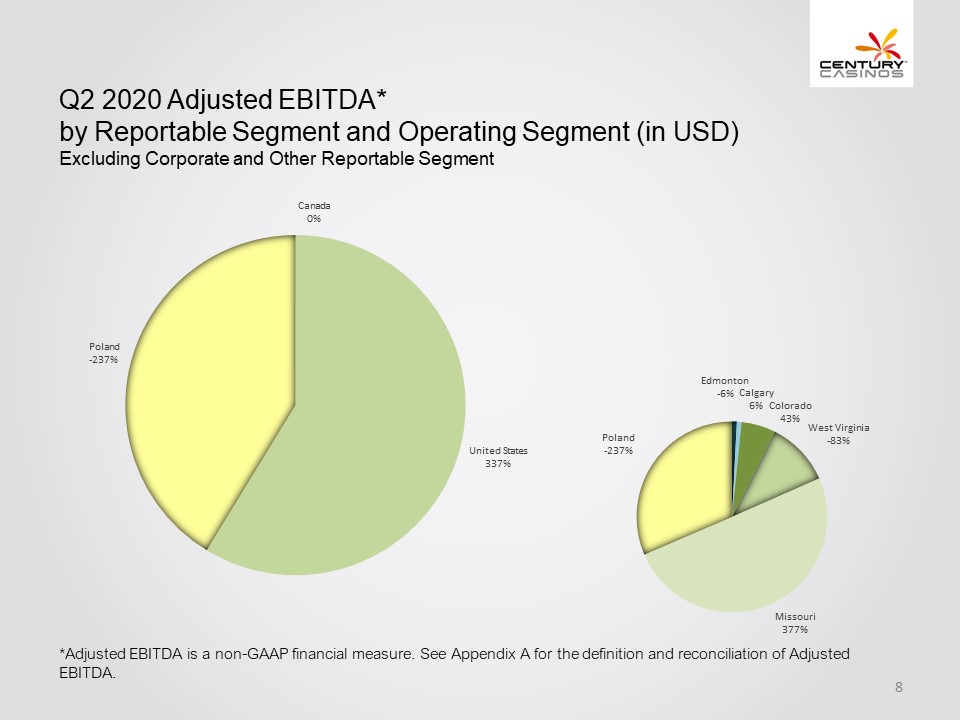
Q2 2020 Adjusted EBITDA* by Reportable Segment and Operating Segment (in USD) Excluding Corporate and Other Reportable Segment Poland -237% Canada 0% United States 337% Poland -237% Edmonton -6% Calgary 6% Colorado 43% West Virginia -83% Missouri 377% *Adjusted EBITDA is a non-GAAP financial measure. See Appendix A for the definition and reconciliation of Adjusted EBITDA. Century Casinos 8
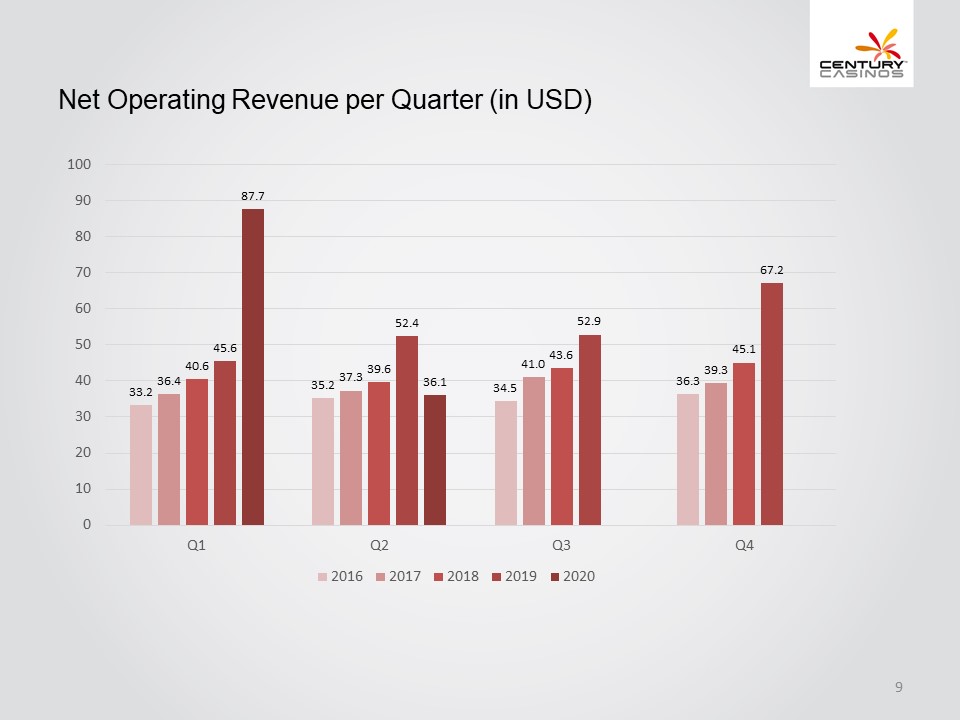
Net Operating Revenue per Quarter (in USD) 100 90 80 70 60 50 40 30 20 10 0 Q1 33.2 36.4 40.6 45.6 87.7 Q2 35.2 37.3 39.6 52.4 36.1 Q3 34.5 41.0 43.6 52.9 Q4 36.3 39.3 45.1 67.2 2016 2017 2018 2019 2020 Century Casinos 9
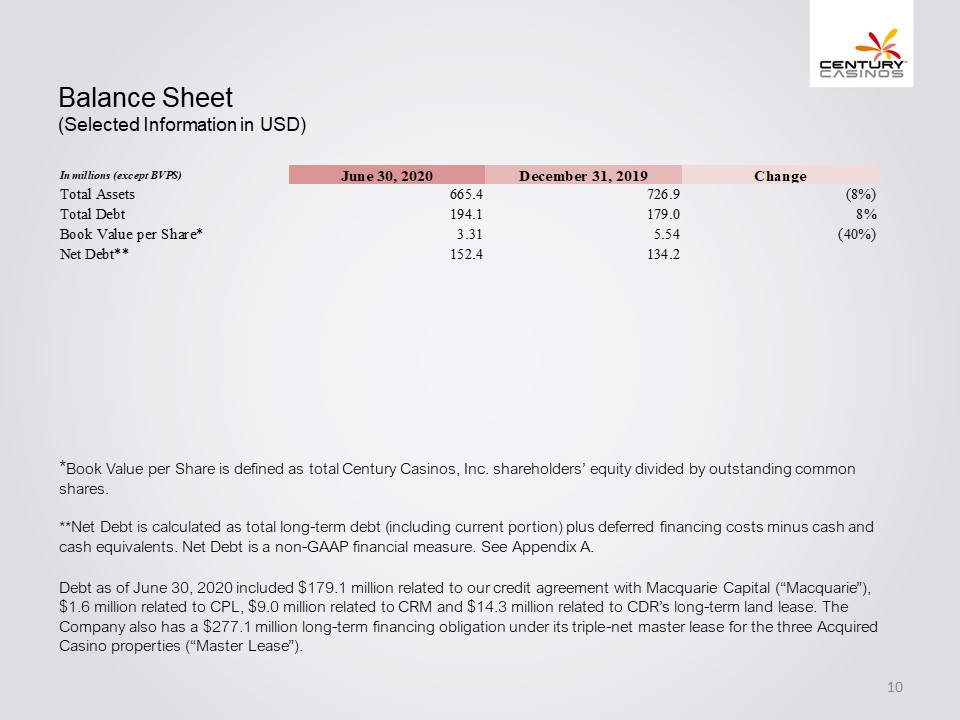
Balance Sheet (Selected Information in USD) In millions (except BVPS) June 30, 2020 December 31, 2019 Change Total Assets 665.4 726.9 (8%) Total Debt 194.1 179.0 8% Book Value per Share* 3.31 5.54 (40%) Net Debt** 152.4 134.2 *Book Value per Share is defined as total Century Casinos, Inc. shareholders’ equity divided by outstanding common shares. **Net Debt is calculated as total long-term debt (including current portion) plus deferred financing costs minus cash and cash equivalents. Net Debt is a non-GAAP financial measure. See Appendix A. Debt as of June 30, 2020 included $179.1 million related to our credit agreement with Macquarie Capital (“Macquarie”), $1.6 million related to CPL, $9.0 million related to CRM and $14.3 million related to CDR’s long-term land lease. The Company also has a $277.1 million long-term financing obligation under its triple-net master lease for the three Acquired Casino properties (“Master Lease”). Century Casinos 10
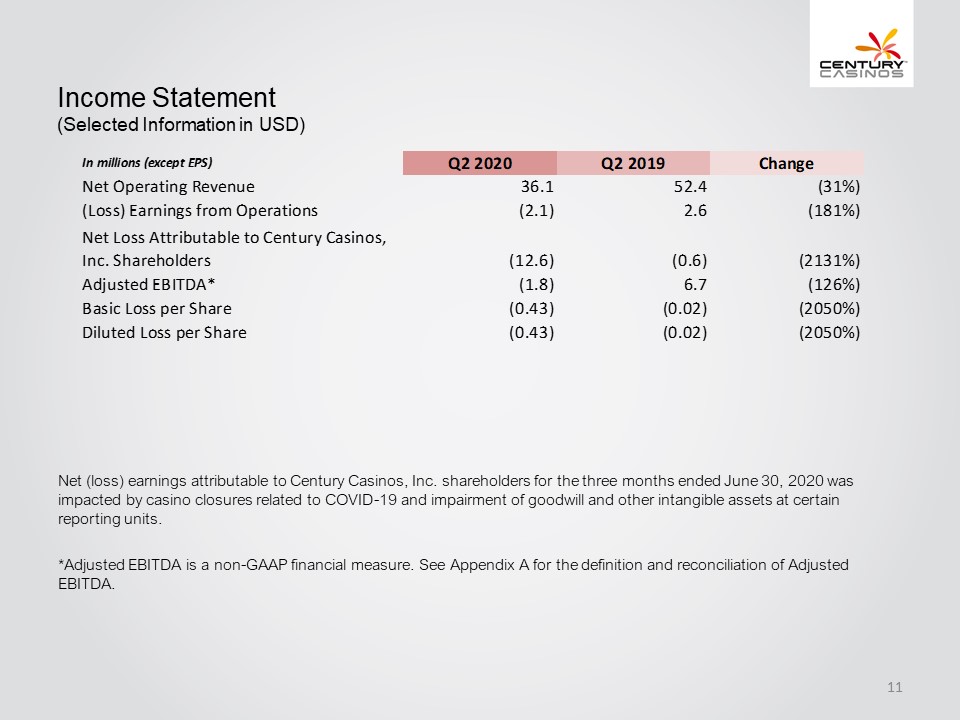
Income Statement (Selected Information in USD) In millions (except EPS) Q2 2020 Q2 2019 Change Net Operating Revenue 36.1 52.4 (31%) (Loss) Earnings from Operations (2.1) 2.6 (181%) Net Loss Attributable to Century Casinos, Inc. Shareholders (12.6) (0.6) (2131%) Adjusted EBITDA* (1.8) 6.7 (126%) Basic Loss per Share (0.43) (0.02) (2050%) Diluted Loss per Share (0.43) (0.02) (2050%) Net (loss) earnings attributable to Century Casinos, Inc. shareholders for the three months ended June 30, 2020 was impacted by casino closures related to COVID-19 and impairment of goodwill and other intangible assets at certain reporting units. *Adjusted EBITDA is a non-GAAP financial measure. See Appendix A for the definition and reconciliation of Adjusted EBITDA. Century Casinos 11
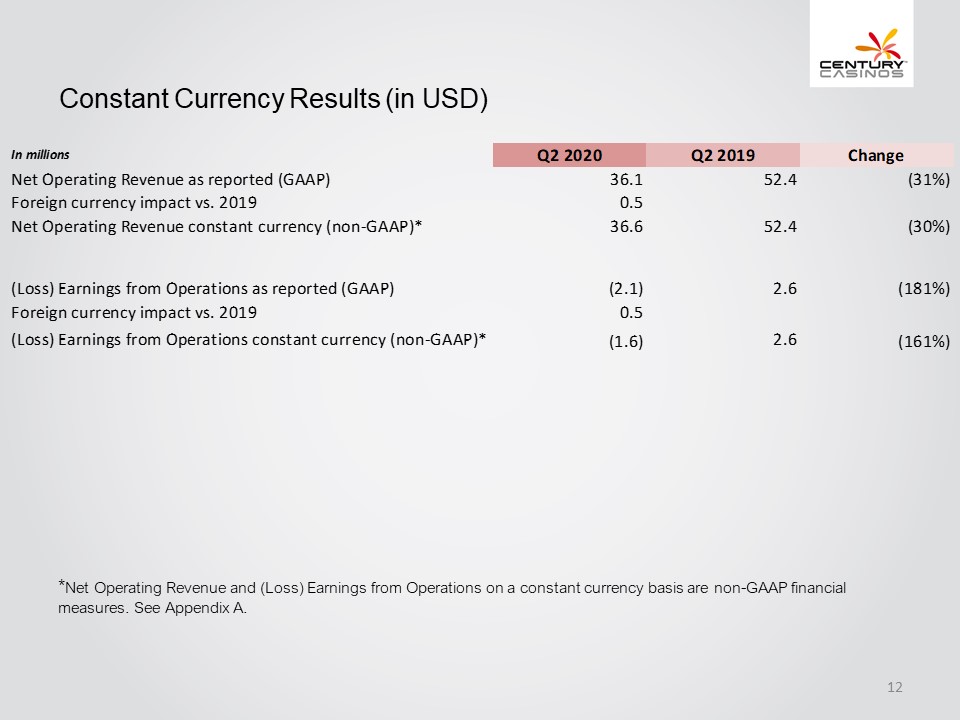
Constant Currency Results (in USD) In millions Q2 2020 Q2 2019 Change Net Operating Revenue as reported (GAAP) 36.1 52.4 (31%) Foreign currency impact vs. 2019 0.5 Net Operating Revenue constant currency (non-GAAP)* 36.6 52.4 (30%) (Loss) Earnings from Operations as reported (GAAP) (2.1) 2.6 (181%) Foreign currency impact vs. 2019 0.5 (Loss) Earnings from Operations constant currency (non-GAAP)* (1.6) 2.6 (161%) *Net Operating Revenue and (Loss) Earnings from Operations on a constant currency basis are non-GAAP financial measures. See Appendix A. Century Casinos 12
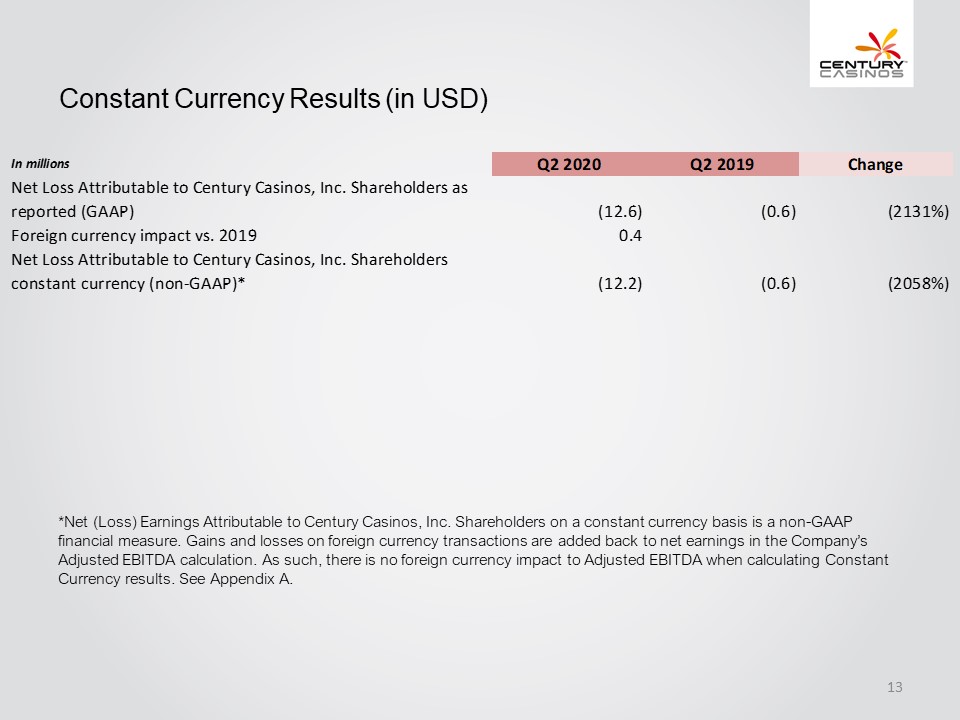
Constant Currency Results (in USD) In millions Q2 2020 Q2 2019 Change Net Loss Attributable to Century Casinos, Inc. Shareholders as reported (GAAP) (12.6) (0.6) (2131%) Foreign currency impact vs. 2019 0.4 Net Loss Attributable to Century Casinos, Inc. Shareholders constant currency (non-GAAP)* (12.2) (0.6) (2058%) *Net (Loss) Earnings Attributable to Century Casinos, Inc. Shareholders on a constant currency basis is a non-GAAP financial measure. Gains and losses on foreign currency transactions are added back to net earnings in the Company’s Adjusted EBITDA calculation. As such, there is no foreign currency impact to Adjusted EBITDA when calculating Constant Currency results. See Appendix A. Century Casinos 13
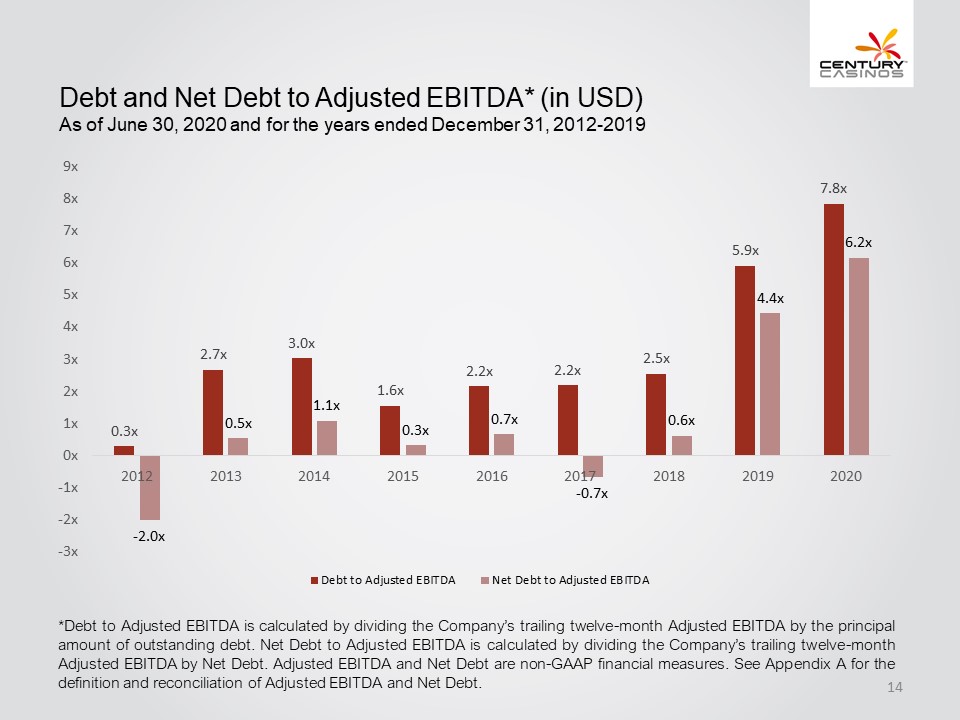
Debt and Net Debt to Adjusted EBITDA* (in USD) As of June 30, 2020 and for the years ended December 31, 2012-2019 9x 8x 7x 6x 5x 4x 3x 2x 1x 0x -1x -2x -3x 0.3x 2012 -2.0x 2.7x 2013 0.5x 3.0x 2014 1.1x 1.6x 2015 0.3x 2.2x 2016 0.7x 2.2x 2017 -0.7x 2.5x 2018 0.6x 5.9x 2019 4.4x 7.8x 2020 6.2x Debt to Adjusted EBITDA Net Debt to Adjusted EBITDA *Debt to Adjusted EBITDA is calculated by dividing the Company’s trailing twelve-month Adjusted EBITDA by the principal amount of outstanding debt. Net Debt to Adjusted EBITDA is calculated by dividing the Company’s trailing twelve-month Adjusted EBITDA by Net Debt. Adjusted EBITDA and Net Debt are non-GAAP financial measures. See Appendix A for the definition and reconciliation of Adjusted EBITDA and Net Debt. Century Casinos 14
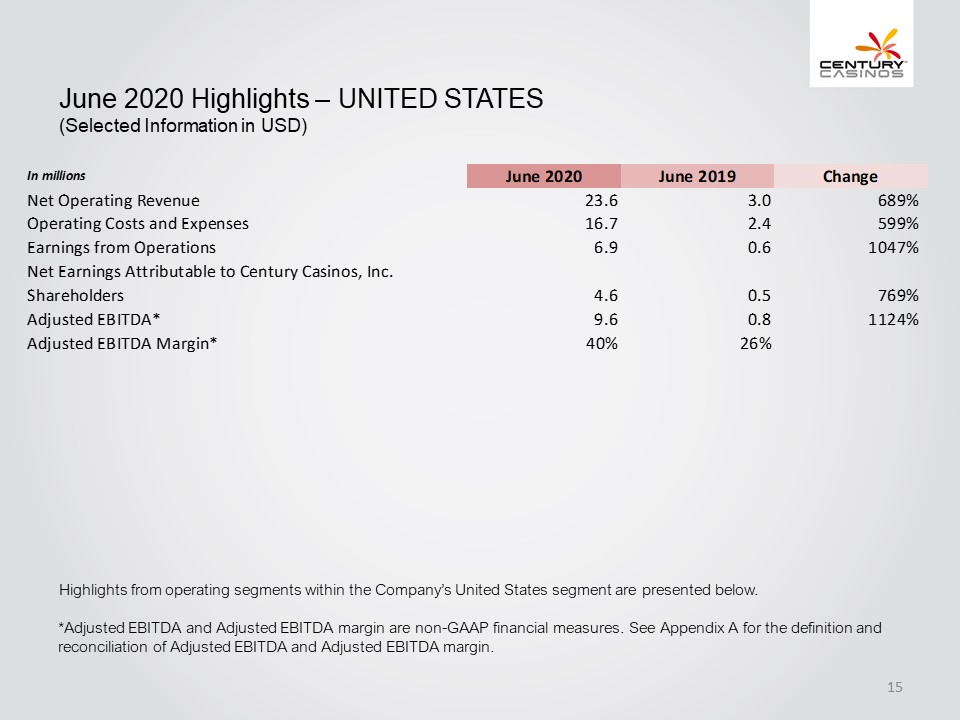
June 2020 Highlights – UNITED STATES (Selected Information in USD) In millions June 2020 June 2019 Change Net Operating Revenue 23.6 3.0 689% Operating Costs and Expenses 16.7 2.4 599% Earnings from Operations 6.9 0.6 1047% Net Earnings Attributable to Century Casinos, Inc. Shareholders 4.6 0.5 769% Adjusted EBITDA* 9.6 0.8 1124% Adjusted EBITDA Margin* 40% 26% Highlights from operating segments within the Company’s United States segment are presented below. *Adjusted EBITDA and Adjusted EBITDA margin are non-GAAP financial measures. See Appendix A for the definition and reconciliation of Adjusted EBITDA and Adjusted EBITDA margin. Century Casinos 15
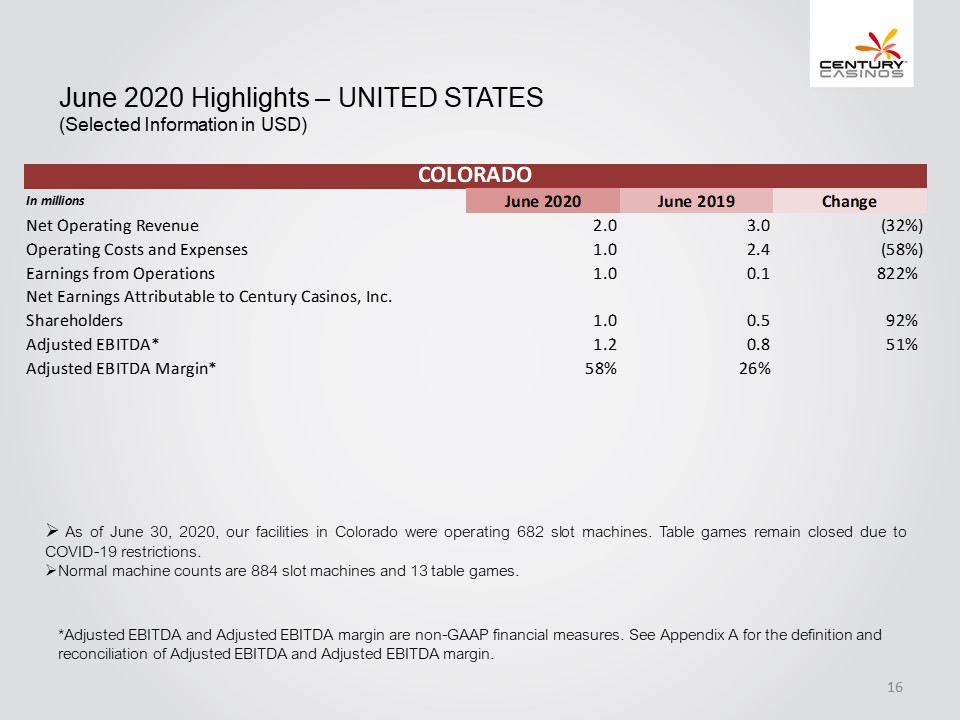
June 2020 Highlights – UNITED STATES (Selected Information in USD) COLORADO In millions June 2020 June 2019 Change Net Operating Revenue 2.0 3.0 (32%) Operating Costs and Expenses 1.0 2.4 (58%) Earnings from Operations 1.0 0.1 822% Net Earnings Attributable to Century Casinos, Inc. Shareholders 1.0 0.5 92% Adjusted EBITDA* 1.2 0.8 51% Adjusted EBITDA Margin* 58% 26% As of June 30, 2020, our facilities in Colorado were operating 682 slot machines. Table games remain closed due to COVID-19 restrictions. Normal machine counts are 884 slot machines and 13 table games. *Adjusted EBITDA and Adjusted EBITDA margin are non-GAAP financial measures. See Appendix A for the definition and reconciliation of Adjusted EBITDA and Adjusted EBITDA margin. Century Casinos 16
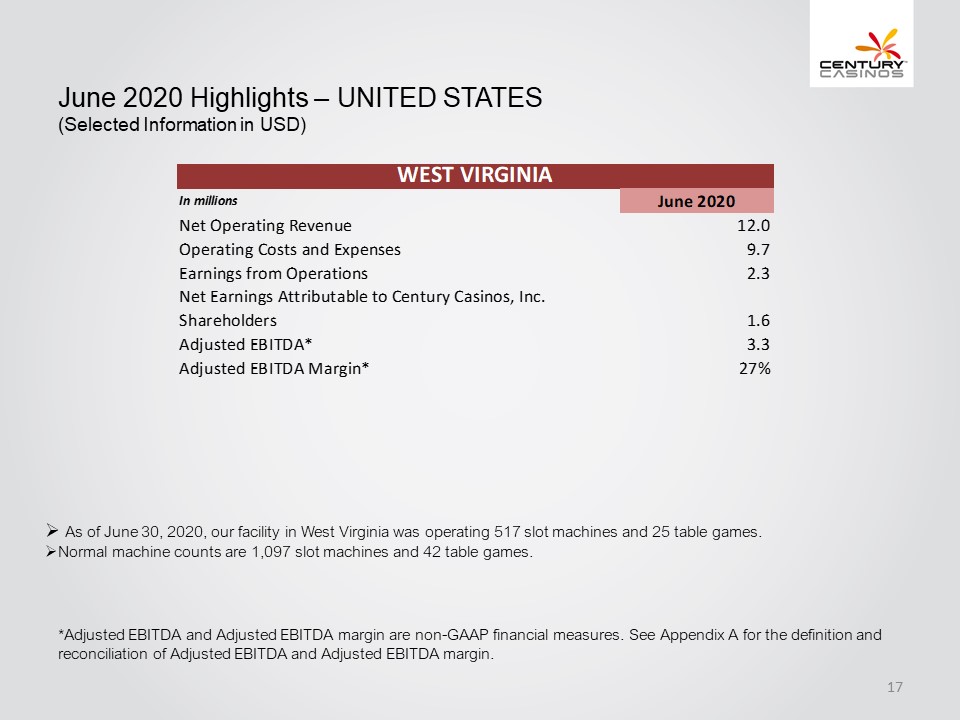
June 2020 Highlights – UNITED STATES (Selected Information in USD) WEST VIRGINIA In millions June 2020 Net Operating Revenue 12.0 Operating Costs and Expenses 9.7 Earnings from Operations 2.3 Net Earnings Attributable to Century Casinos, Inc. Shareholders 1.6 Adjusted EBITDA* 3.3 Adjusted EBITDA Margin* 27% As of June 30, 2020, our facility in West Virginia was operating 517 slot machines and 25 table games. Normal machine counts are 1,097 slot machines and 42 table games. *Adjusted EBITDA and Adjusted EBITDA margin are non-GAAP financial measures. See Appendix A for the definition and reconciliation of Adjusted EBITDA and Adjusted EBITDA margin. Century Casinos 17
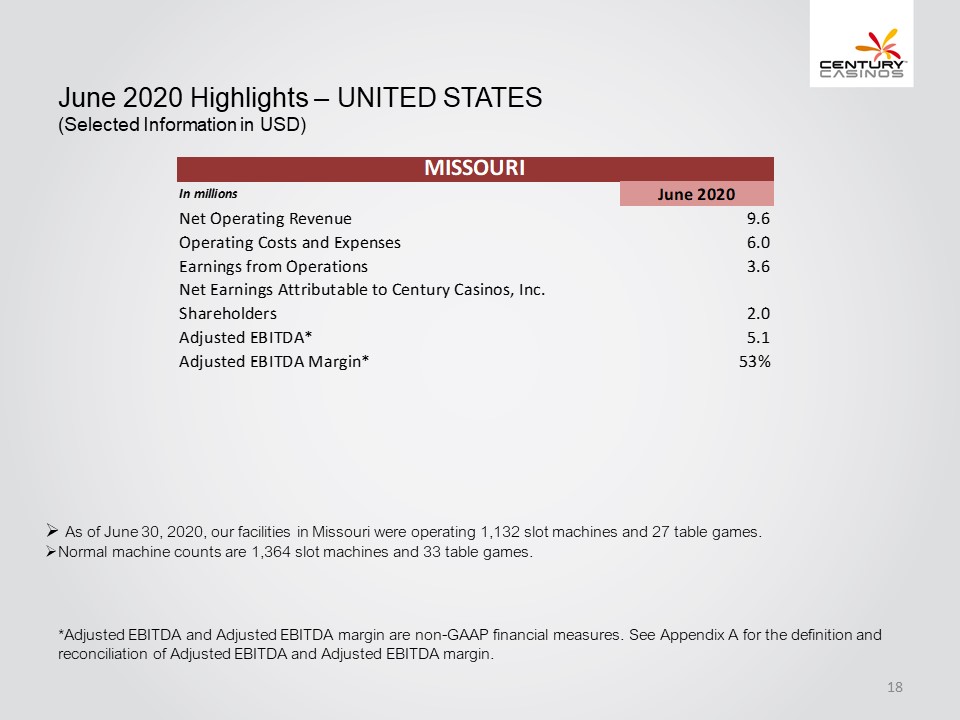
June 2020 Highlights – UNITED STATES (Selected Information in USD) MISSOURI In millions June 2020 Net Operating Revenue 9.6 Operating Costs and Expenses 6.0 Earnings from Operations 3.6 Net earnings Attributable to Century Casinos, Inc. Shareholders 2.0 Adjusted EBITDA* 5.1 Adjusted EBITDA Margin* 53% As of June 30, 2020, our facilities in Missouri were operating 1,132 slot machines and 27 table games. Normal machine counts are 1,364 slot machines and 33 table games. *Adjusted EBITDA and Adjusted EBITDA margin are non-GAAP financial measures. See Appendix A for the definition and reconciliation of Adjusted EBITDA and Adjusted EBITDA margin. Century Casinos 18
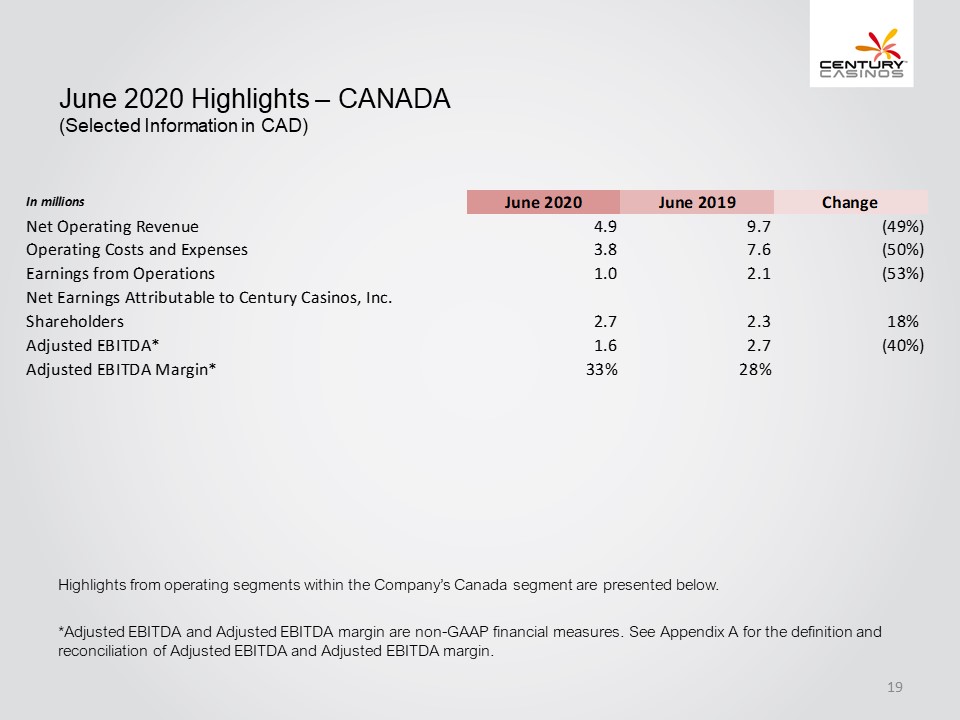
June 2020 Highlights – CANADA (Selected Information in CAD) In millions June 2020 June 2019 Change Net Operating Revenue 4.9 9.7 (49%) Operating Costs and Expenses 3.8 7.6 (50%) Earnings from Operations 1.0 2.1 (53%) Net Earnings Attributable to Century Casinos, Inc. Shareholders 2.7 2.3 18% Adjusted EBITDA* 1.6 2.7 (40%) Adjusted EBITDA Margin* 33% 28% Highlights from operating segments within the Company’s Canada segment are presented below. *Adjusted EBITDA and Adjusted EBITDA margin are non-GAAP financial measures. See Appendix A for the definition and reconciliation of Adjusted EBITDA and Adjusted EBITDA margin. Century Casinos 19
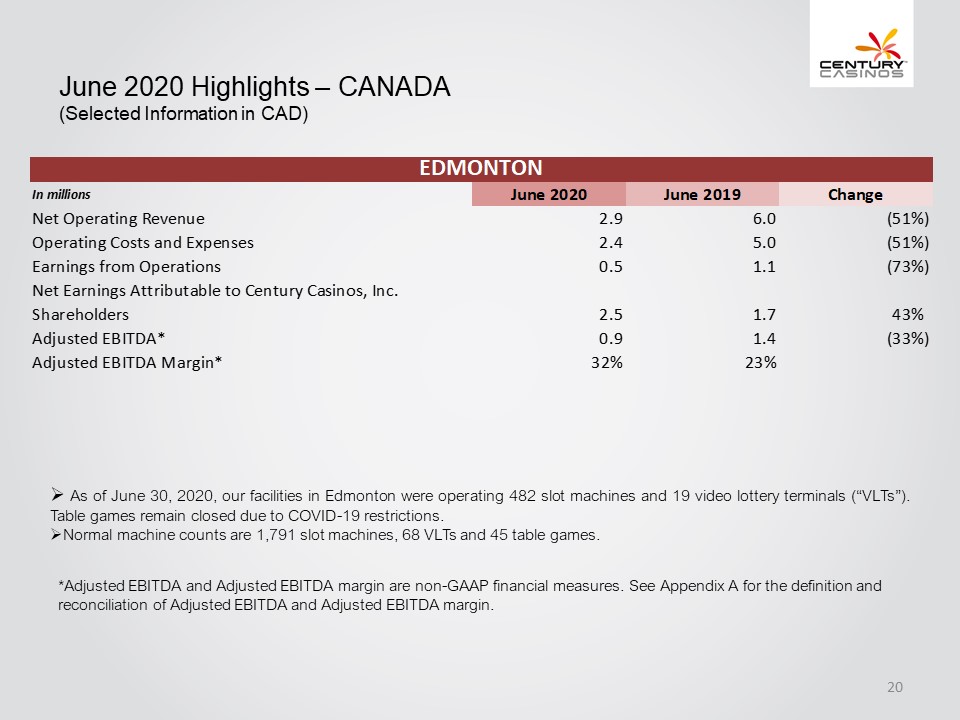
June 2020 Highlights – CANADA (Selected Information in CAD) EDMONTON In millions June 2020 June 2019 Change Net Operating Revenue 2.9 6.0 (51%) Operating Costs and Expenses 2.4 5.0 (51%) Earnings from Operations 0.5 1.1 (73%) Net Earnings Attributable to Century Casinos, Inc. Shareholders 2.5 1.7 43% Adjusted EBITDA* 0.9 1.4 (33%) Adjusted EBITDA Margin* 32% 23% As of June 30, 2020, our facilities in Edmonton were operating 482 slot machines and 19 video lottery terminals (“VLTs”). Table games remain closed due to COVID-19 restrictions. Normal machine counts are 1,791 slot machines, 68 VLTs and 45 table games. *Adjusted EBITDA and Adjusted EBITDA margin are non-GAAP financial measures. See Appendix A for the definition and reconciliation of Adjusted EBITDA and Adjusted EBITDA margin. Century Casinos 20
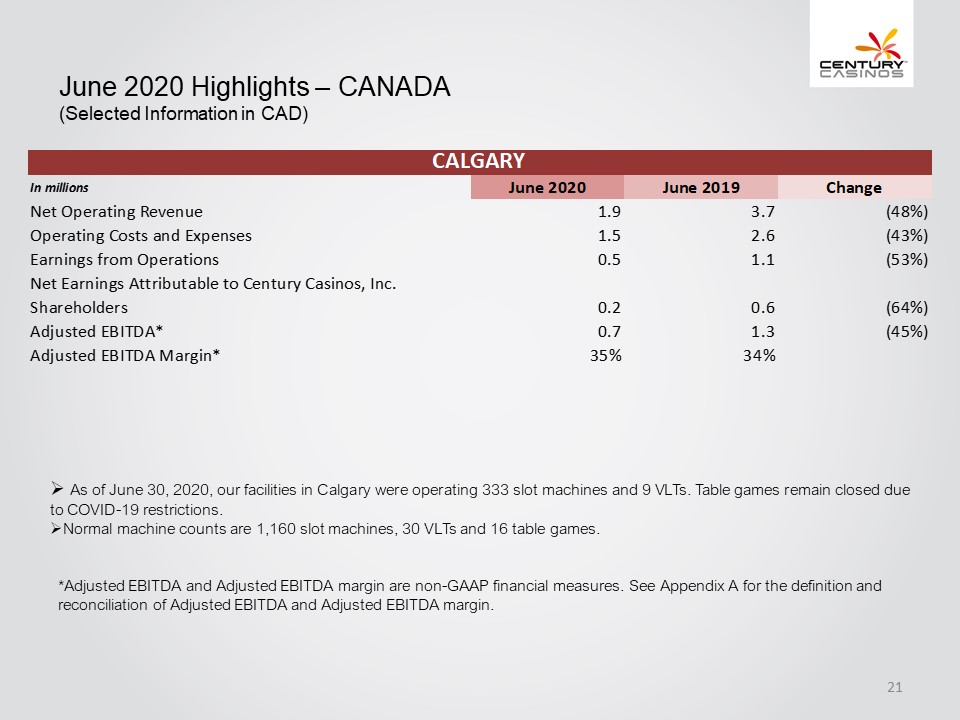
June 2020 Highlights – CANADA (Selected Information in CAD) CALGARY In millions June 2020 June 2019 Change Net Operating Revenue 1.9 3.7 (48%) Operating Costs and Expenses 1.5 2.6 (43%) Earnings from Operations 0.5 1.1 (53%) Net Earnings Attributable to Century Casinos, Inc. Shareholders 0.2 0.6 (64%) Adjusted EBITDA* 0.7 1.3 (45%) Adjusted EBITDA Margin* 35% 34% As of June 30, 2020, our facilities in Calgary were operating 333 slot machines and 9 VLTs. Table games remain closed due to COVID-19 restrictions. Normal machine counts are 1,160 slot machines, 30 VLTs and 16 table games. *Adjusted EBITDA and Adjusted EBITDA margin are non-GAAP financial measures. See Appendix A for the definition and reconciliation of Adjusted EBITDA and Adjusted EBITDA margin. Century Casinos 21
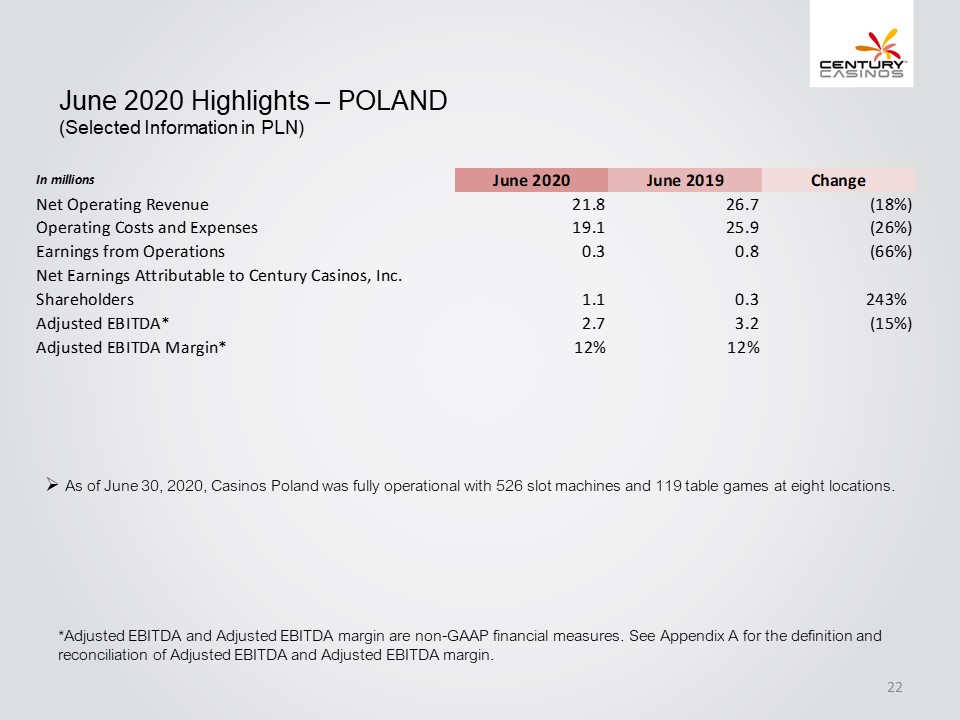
June 2020 Highlights – POLAND (Selected Information in PLN) In millions June 2020 June 2019 Change Net Operating Revenue 21.8 26.7 (18%) Operating Costs and Expenses 19.1 25.9 (26%) Earnings from Operations 0.3 0.8 (66%) Net Earnings Attributable to Century Casinos, Inc. Shareholders 1.1 0.3 243% Adjusted EBITDA* 2.7 3.2 (15%) Adjusted EBITDA Margin* 12% 12% As of June 30, 2020, Casinos Poland was fully operational with 526 slot machines and 119 table games at eight locations. *Adjusted EBITDA and Adjusted EBITDA margin are non-GAAP financial measures. See Appendix A for the definition and reconciliation of Adjusted EBITDA and Adjusted EBITDA margin. Century Casinos 22
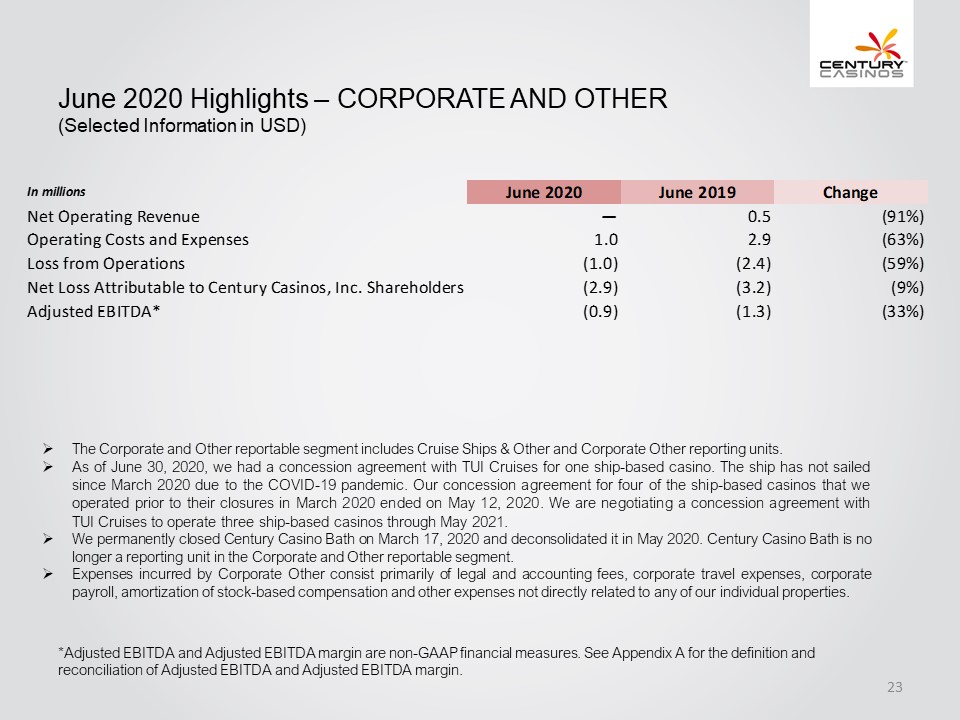
June 2020 Highlights – CORPORATE AND OTHER (Selected Information in USD) In millions June 2020 June 2019 Change Net Operating Revenue – 0.5 (91%) Operating Costs and Expenses 1.0 2.9 (63%) Loss from Operations (1.0) (2.4) (59%) Net Loss Attributable to Century Casinos, Inc. Shareholders (2.9) (3.2) (9%) Adjusted EBITDA* (0.9) (1.3) (33%) The Corporate and Other reportable segment includes Cruise Ships & Other and Corporate Other reporting units. As of June 30, 2020, we had a concession agreement with TUI Cruises for one ship-based casino. The ship has not sailed since March 2020 due to the COVID-19 pandemic. Our concession agreement for four of the ship-based casinos that we operated prior to their closures in March 2020 ended on May 12, 2020. We are negotiating a concession agreement with TUI Cruises to operate three ship-based casinos through May 2021. We permanently closed Century Casino Bath on March 17, 2020 and deconsolidated it in May 2020. Century Casino Bath is no longer a reporting unit in the Corporate and Other reportable segment. Expenses incurred by Corporate Other consist primarily of legal and accounting fees, corporate travel expenses, corporate payroll, amortization of stock-based compensation and other expenses not directly related to any of our individual properties. *Adjusted EBITDA and Adjusted EBITDA margin are non-GAAP financial measures. See Appendix A for the definition and reconciliation of Adjusted EBITDA and Adjusted EBITDA margin. Century Casinos 23
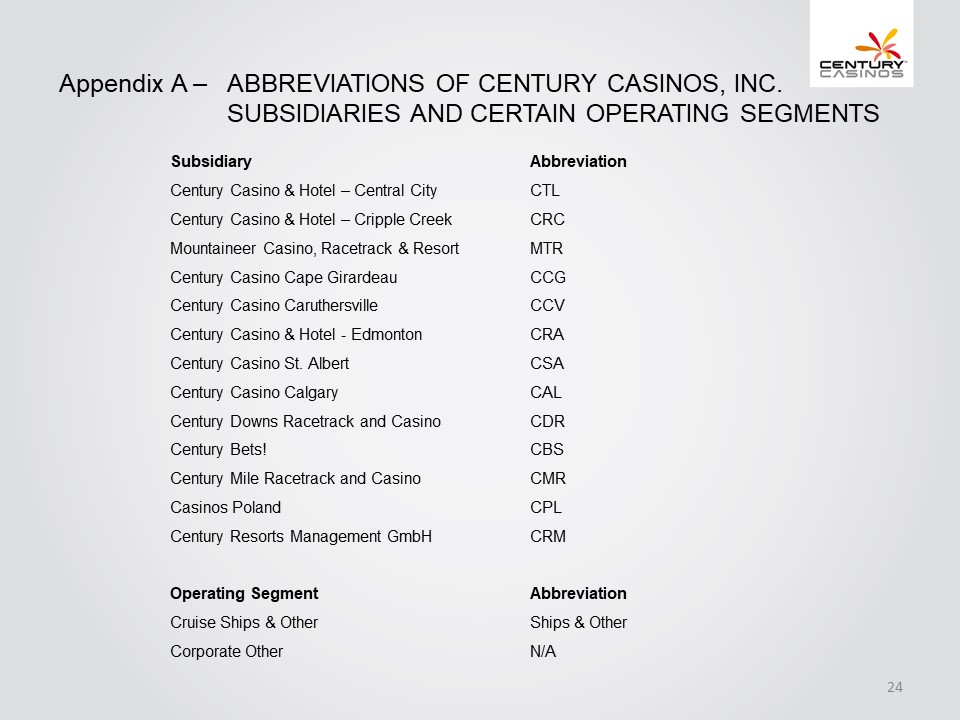
Appendix A – ABBREVIATIONS OF CENTURY CASINOS, INC. SUBSIDIARIES AND CERTAIN OPERATING SEGMENTS Subsidiary Abbreviation Century Casino & Hotel – Central City CTL Century Casino & Hotel – Cripple Creek CRC Mountaineer Casino, Racetrack & Resort MTR Century Casino Cape Girardeau CCG Century Casino Caruthersville CCV Century Casino & Hotel - Edmonton CRA Century Casino St. Albert CSA Century Casino Calgary CAL Century Downs Racetrack and Casino CDR Century Bets! CBS Century Mile Racetrack and Casino CMR Casinos Poland CPL Century Resorts Management GmbH CRM Operating Segment Abbreviation Cruise Ships & Other Ships & Other Corporate Other N/A Century Casinos 24
Appendix A – NON-GAAP FINANCIAL MEASURES The Company supplements its consolidated financial statements prepared in accordance with U.S. generally accepted accounting principles (“GAAP”) by using the following non-GAAP financial measures, which management believes are useful in properly understanding the Company’s short-term and long-term financial trends. Management uses these non-GAAP financial measures to forecast and evaluate the operational performance of the Company as well as to compare results of current periods to prior periods on a consolidated basis. Adjusted EBITDA Adjusted EBITDA margin Constant currency results Net Debt Management believes presenting the non-GAAP financial measures used in this presentation provides investors greater transparency to the information used by management for financial and operational decision-making and allows investors to see the Company’s results “through the eyes” of management. Management also believes providing this information better enables our investors to understand the Company’s operating performance and evaluate the methodology used by management to evaluate and measure such performance. The adjustments made to GAAP financial measures result from facts and circumstances that vary in frequency and impact on the Company’s results of operations. The following is an explanation of each of the adjustments that management excludes in calculating its non-GAAP financial measures. Century Casinos 25
Appendix A – NON-GAAP FINANCIAL MEASURES The Company defines Adjusted EBITDA as net earnings (loss) attributable to Century Casinos, Inc. shareholders before interest expense (income), net, income taxes (benefit), depreciation and amortization, non-controlling interests net earnings (loss) and transactions, pre-opening expenses, acquisition costs, non-cash stock-based compensation charges, asset impairment costs, (gain) loss on disposition of fixed assets, discontinued operations, (gain) loss on foreign currency transactions, cost recovery income and other, gain on business combination and certain other one-time transactions. Expense related to the Master Lease for the three Acquired Casino properties and CDR land lease is included in the interest expense (income), net line item. Intercompany transactions consisting primarily of management and royalty fees and interest, along with their related tax effects, are excluded from the presentation of net earnings (loss) attributable to Century Casinos, Inc. shareholders and Adjusted EBITDA reported for each segment. Not all of the aforementioned items occur in each reporting period but have been included in the definition based on historical activity. These adjustments have no effect on the consolidated results as reported under GAAP. Adjusted EBITDA is not considered a measure of performance recognized under GAAP. Management believes that Adjusted EBITDA is a valuable measure of the relative performance of the Company and its properties. The gaming industry commonly uses Adjusted EBITDA as a method of arriving at the economic value of a casino operation. Management uses Adjusted EBITDA to compare the relative operating performance of separate operating units by eliminating the above-mentioned items associated with the varying levels of capital expenditures for infrastructure required to generate revenue and the often high cost of acquiring existing operations. Adjusted EBITDA is used by the Company’s lending institution to gauge operating performance. The Company’s computation of Adjusted EBITDA may be different from, and therefore may not be comparable to, similar measures used by other companies within the gaming industry. Please see the reconciliation of Adjusted EBITDA to net earnings (loss) attributable to Century Casinos, Inc. shareholders below. The Company defines Adjusted EBITDA margin as Adjusted EBITDA divided by net operating revenue. Management uses this margin as one of several measures to evaluate the efficiency of the Company’s casino operations. Century Casinos 26
Appendix A – NON-GAAP FINANCIAL MEASURES The impact of foreign exchange rates is highly variable and difficult to predict. The Company uses a Constant Currency basis to show the impact from foreign exchange rates on current period financial information compared to prior period financial information using the prior period’s foreign exchange rates. In order to properly understand the underlying business trends and performance of the Company’s ongoing operations, management believes that investors may find it useful to consider the impact of excluding changes in foreign exchange rates from the Company’s net operating revenue, earnings from operations and net earnings (loss) attributable to Century Casinos, Inc. shareholders. Constant currency results are calculated by dividing the current year to date local currency segment results excluding the local currency impact of foreign currency gains and losses, by the prior year’s average exchange rate for the year to date and comparing them to actual U.S. dollar results for the prior year to date. The average exchange rates for the current quarter and prior year second quarter are reported in Item 1 of the Company’s Quarterly Report on Form 10-Q for the quarter ended June 30, 2020. Constant currency information is not a measure of financial performance under GAAP and should not be considered a substitute for net operating revenue, earnings from operations or net earnings (loss) attributable to Century Casinos, Inc. shareholders as determined in accordance with GAAP. The Company defines Net Debt as total long-term debt (including current portion) plus deferred financing costs minus cash and cash equivalents. Net Debt is not considered a liquidity measure recognized under GAAP. Management believes that Net Debt is a valuable measure of our overall financial situation. Net Debt provides investors with an indication of our ability to pay off all of our long-term debt if it became due simultaneously. Century Casinos 27
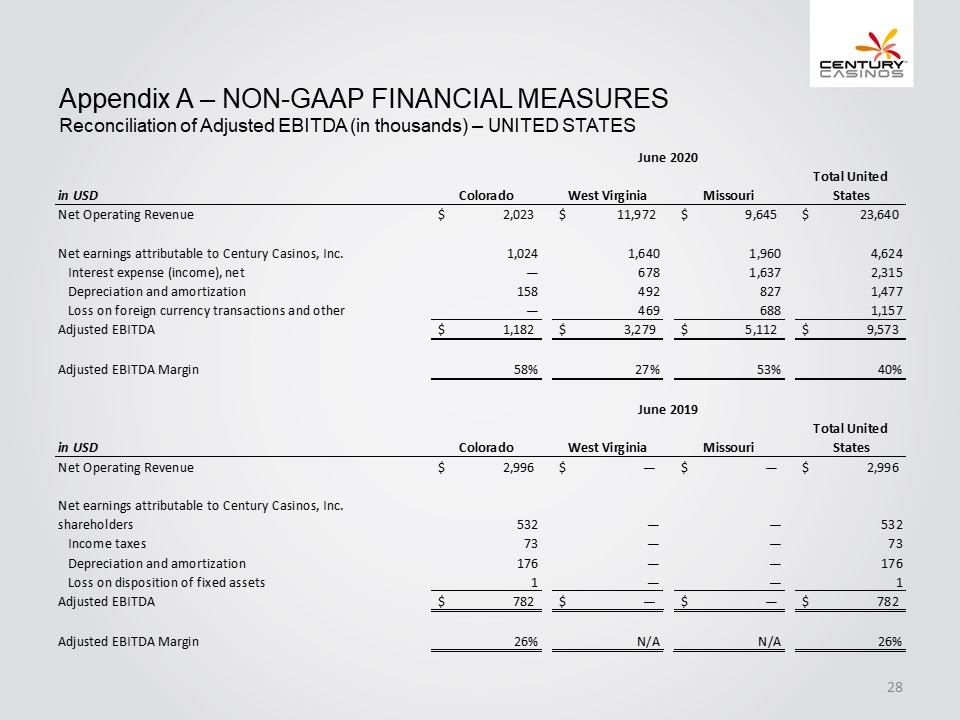
Appendix A – NON-GAAP FINANCIAL MEASURES Reconciliation of Adjusted EBITDA (in thousands) – UNITED STATES June 2020 in USD Colorado West Virginia Missouri Total United States Net Operating Revenue $ 2,023 $ 11,972 $ 9,645 $ 23,640 Net earnings attributable to Century Casinos, Inc. 1,024 1,640 1,960 4,624 Interest expense (income), net — 678 1,637 2,315 Depreciation and amortization 158 492 827 1,477 Loss on foreign currency transactions and other — 469 688 1,157 Adjusted EBITDA $ 1,182 $ 3,279 $ 5,112 $ 9,573 Adjusted EBITDA Margin 58% 27% 53% 40% June 2019 in USD $ Colorado West Virginia Missouri Total United States Net Operating Revenue 2,996 $ - $ - $ 2,996 Net earnings attributable to Century Casinos, Inc. shareholders 532 — — 532 Income taxes 73 — — 73 Depreciation and amortization 176 — — 176 Loss on disposition of fixed assets 1 — — 1 Adjusted EBITDA $ 782 $ - $ - $ 782 Adjusted EBITDA Margin 26% N/A N/A 26% Century Casinos 28
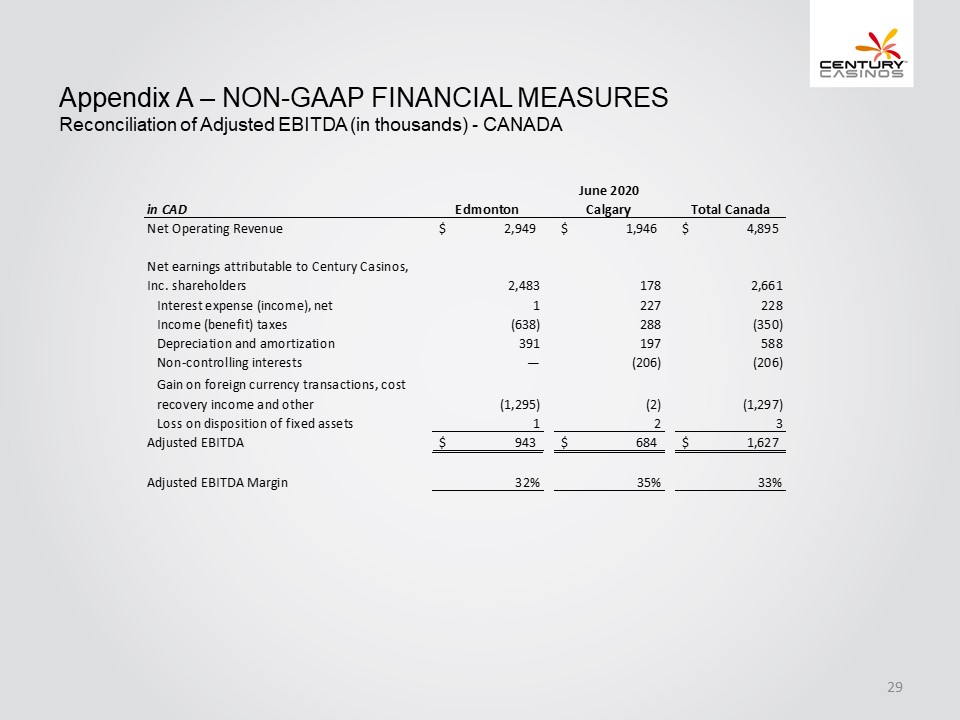
Appendix A – NON-GAAP FINANCIAL MEASURES Reconciliation of Adjusted EBITDA (in thousands) - CANADA in CAD June 2020 Edmonton Calgary Total Canada Net Operating Revenue $ 2,949 $ 1,946 $ 4,895 Net earnings attributable to Century Casinos, Inc. shareholders 2,483 178 2,661 Interest expense (income), net 1 227 228 Income (benefit) taxes (638) 288 (350) Depreciation and amortization 391 197 588 Non-controlling interests — (206) (206) Gain on foreign currency transactions, cost recovery income and other (1,295) (2) (1,297) Loss on disposition of fixed assets 1 2 3 Adjusted EBITDA $ 943 $ 684 $ 1,627 Adjusted EBITDA Margin 32% 35% 33% Century Casinos 29
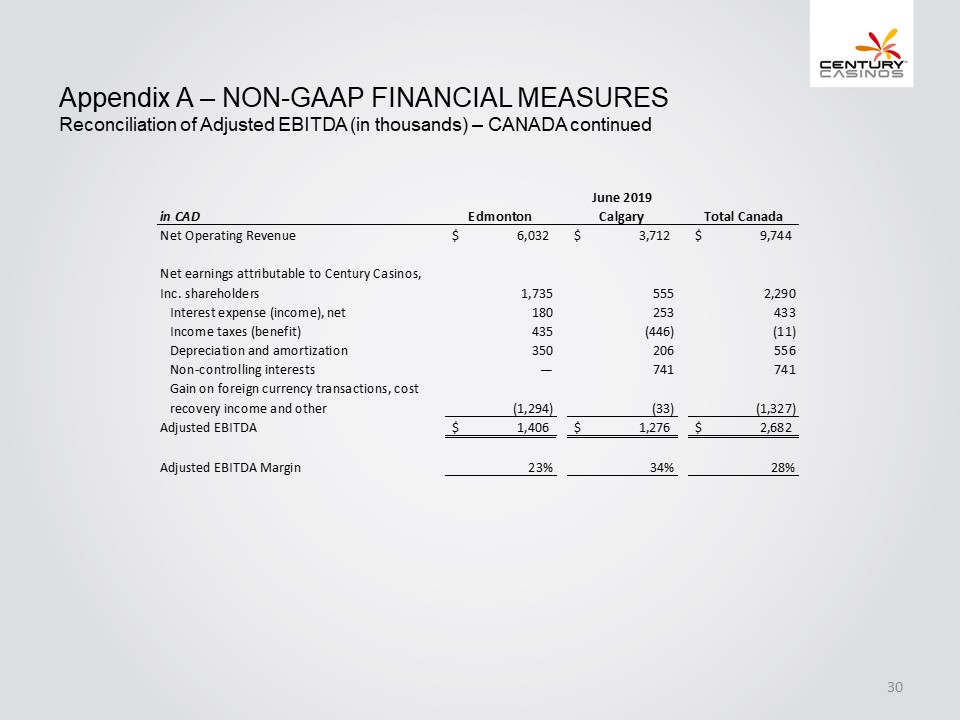
Appendix A – NON-GAAP FINANCIAL MEASURES Reconciliation of Adjusted EBITDA (in thousands) – CANADA continued in CAD June 2019 Edmonton Calgary Total Canada Net Operating Revenue $ 6,032 $ 3,712 $ 9,744 Net earnings attributable to Century Casinos, Inc. shareholders 1,735 555 2,290 Interest expense (income), net 180 253 433 Income taxes (benefit) 435 (446) (11) Depreciation and amortization 350 206 556 Non-controlling interests — 741 741 Gain on foreign currency transactions, cost recovery income and other (1,294) (33) (1,327) Adjusted EBITDA $ 1,406 $ 1,276 $ 2,682 Adjusted EBITDA Margin 23% 34% 28% Century Casinos 30
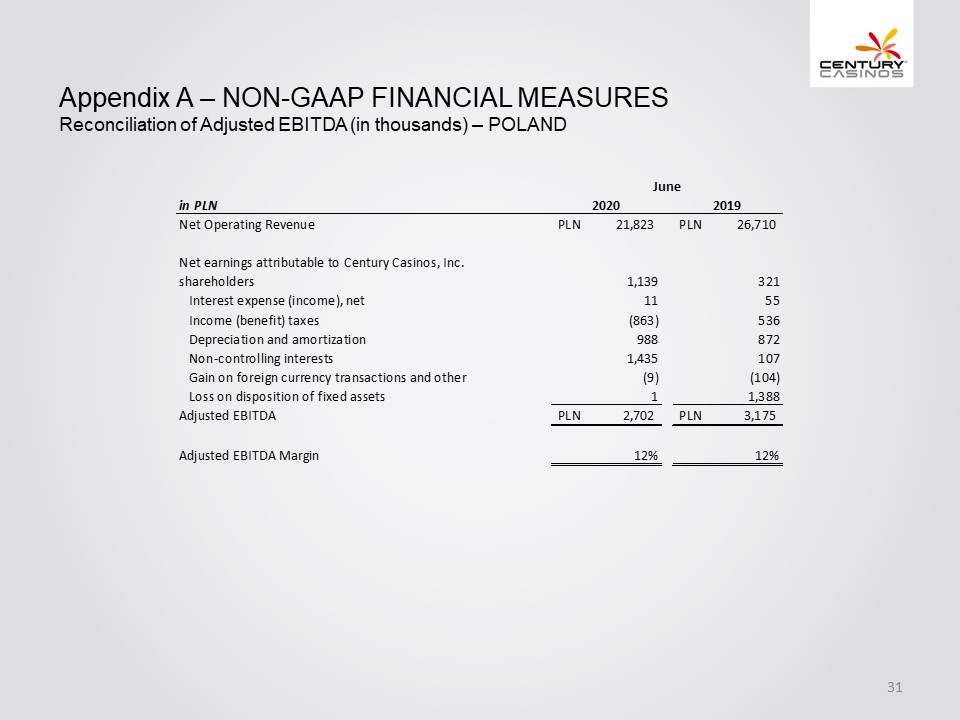
Appendix A – NON-GAAP FINANCIAL MEASURES Reconciliation of Adjusted EBITDA (in thousands) – POLAND in PLN June 2020 2019 Net Operating Revenue PLN 21,823 PLN 26,710 Net earnings attributable to Century Casinos, Inc. shareholders 1,139 321 Interest expense (income), net 11 55 Income (benefit)taxes (863) 536 Depreciation and amortization 988 872 Non-controlling interests 1,435 107 Gain on foreign currency transactions and other (9) (104) Loss on disposition of fixed assets 1 1,388 Adjusted EBITDA PLN 2,702 PLN 3,175 Adjusted EBITDA Margin 12% 12% Century Casinos 31
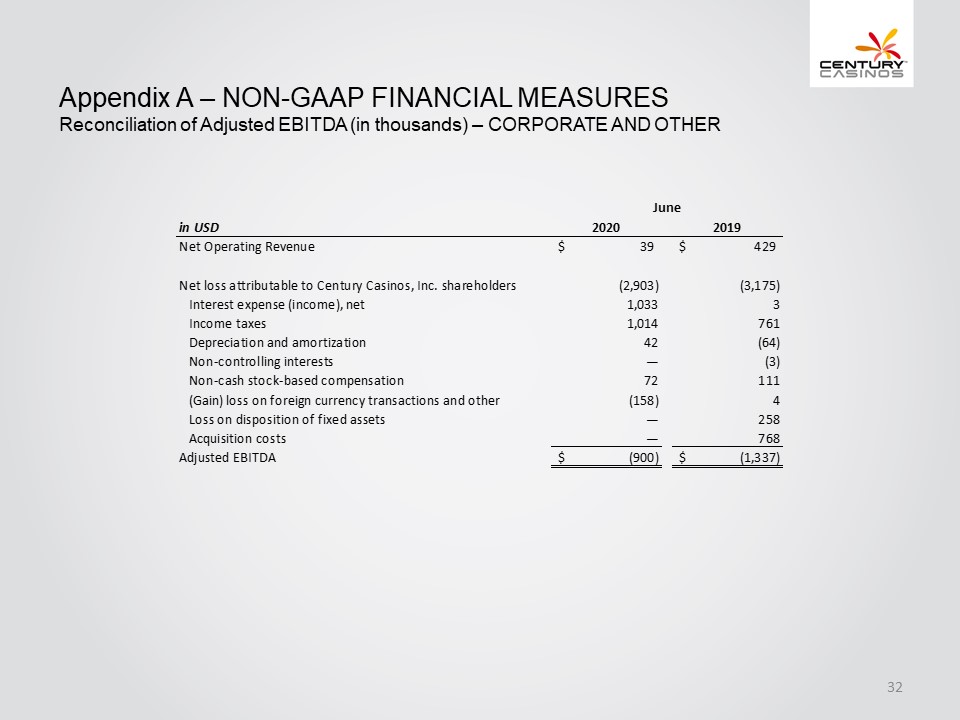
Appendix A – NON-GAAP FINANCIAL MEASURES Reconciliation of Adjusted EBITDA (in thousands) – CORPORATE AND OTHER in USD June 2020 2019 Net Operating Revenue $ 39 $ 429 Net loss attributable to Century Casinos, Inc. shareholders (2,903) (3,175) Interest expense (income), net 1,033 3 Income taxes 1,014 761 Depreciation and amortization 42 (64) Non-controlling interests — (3) Non-cash stock-based compensation 72 111 (Gain) loss on foreign currency transactions and other (158) 4 Loss on disposition of fixed assets — 258 Acquisition costs — 768 Adjusted EBITDA $ (900) $ (1,337) Century Casinos 32
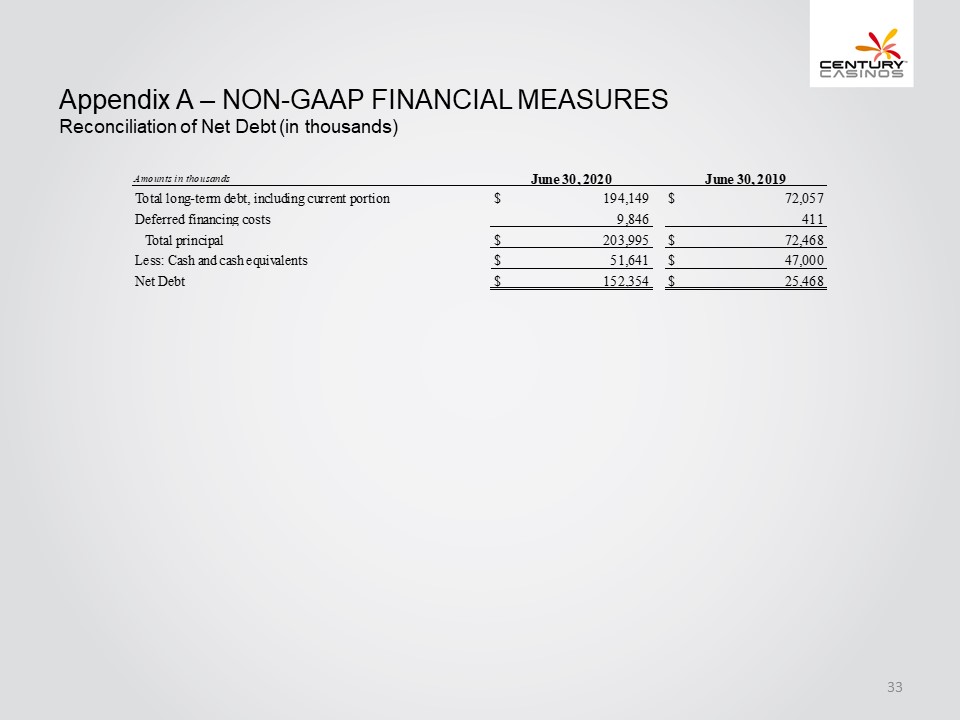
Appendix A – NON-GAAP FINANCIAL MEASURES Reconciliation of Net Debt (in thousands) Amount in thousands June 30, 2020 June 30, 2019 Total long-term debt, including current portion $ 194,149 $ 72,057 Deferred financing costs 9,846 411 Total principal $ 203,995 $ 72,468 Less: Cash and cash equivalents $ 51,641 $ 47,000 Net Debt $ 152,354 $ 25,468 Century Casinos 33