Attached files
| file | filename |
|---|---|
| EX-99.1 - EX-99.1 - VIASAT INC | d71465dex991.htm |
| 8-K - 8-K - VIASAT INC | d71465d8k.htm |
Exhibit 99.2

Q1 FY 21
Shareholder Letter
Viasat
Fellow Shareholders, We hope that you are remaining healthy and positive in this uncertain environment. Even though parts of the economy appear to have progressed from the March/April lows, we are well aware there is still a difficult recovery ahead. Our top priorities during the pandemic have been to protect our employees and serve our customers, while preserving cash and optimizing profitability. We also aim to position Viasat to be stronger than ever on the other side of the crisis – and believe we’re on track to achieve that. Our first quarter of fiscal year 2021 (Q1 FY2021) exceeded our expectations despite the global impact of the COVID-19 pandemic. Even with the steep decline in commercial air traffic, we still increased Adjusted EBITDA by 8% on a year-over year (YoY) basis. Company-wide, revenue declined only about 1% YoY, and new contract awards in Q1 FY2021 were $737 million—46% higher than the same period last year. Firm contract backlog is a record at over $2 billion. We were also awarded two major Indefinite Delivery/ Indefinite Quantity (IDIQ) contracts in our Government Systems segment that are not included in backlog, but provide contracting paths for tactical data links and a range of additional products and services. Entering the fiscal year, we had braced for a tough Q1 for reasons identified in our Q4 FY2020 shareholder letter – preparing for revenue and Adjusted EBITDA that could have been below prior year results. At the beginning of the quarter, however, we took actions to reduce costs while focusing our resources on our most strategic long-term opportunities. We emphasized close partnering with our customers as virtual operating environments became the norm. While commercial aircraft In-Flight Connectivity (IFC) was as heavily impacted as we expected, outperformance in other businesses, including other satellite services markets and verticals, acted as a substantial counterweight. Financial results for Q1 FY2021 affirmed the value and resilience of our strategy of vertical integration and product and service portfolio diversification. With Q1 FY2021 YoY Adjusted EBITDA growth, we’re on a trajectory to potentially see sustained YoY gains for FY2021 as a whole. Record backlog helps build our confidence. We also continue to make solid progress on our ViaSat-3 global constellation amid the productivity challenges posed by COVID-19. Our strategy and associated financial performance are allowing us to maintain an aggressive posture at a time when the pandemic has imposed dire challenges on higher-risk, less diverse and financially less stable competitors in some of our end-markets. With uncertainty and volatility comes opportunity, and we expect to extend our market-leading positions. And finally, as we observed last quarter, the current environment has firmly established the enormous and growing demand for trusted broadband connectivity – for home, work, education, health, entertainment, communication, information and security. We’re proud to be a leader in delivering that to one of the most diverse customer bases across the globe. Shareholder Letter | Q1 Fiscal Year 2021 1
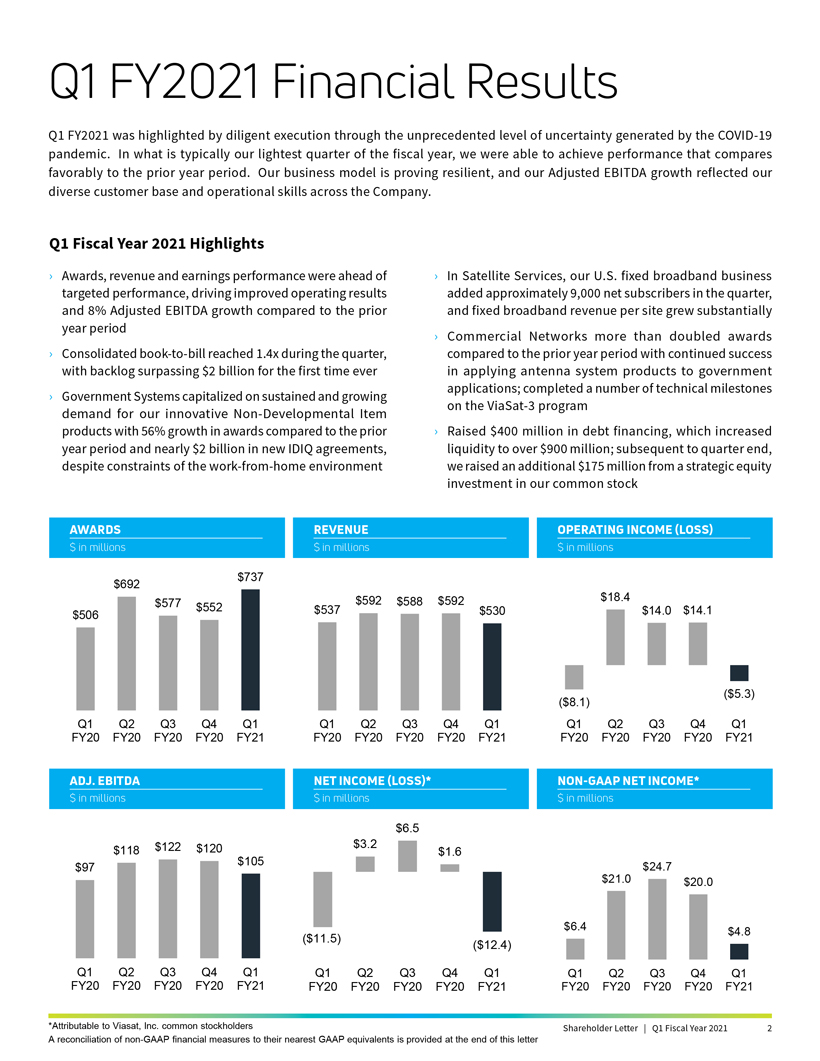
Q1 FY2021 Financial Results Q1 FY2021 was highlighted by diligent execution through the unprecedented level of uncertainty generated by the COVID-19 pandemic. In what is typically our lightest quarter of the fiscal year, we were able to achieve performance that compares favorably to the prior year period. Our business model is proving resilient, and our Adjusted EBITDA growth reflected our diverse customer base and operational skills across the Company. Q1 Fiscal Year 2021 Highlights › Awards, revenue and earnings performance were ahead of targeted performance, driving improved operating results and 8% Adjusted EBITDA growth compared to the prior year period › Consolidated book-to-bill reached 1.4x during the quarter, with backlog surpassing $2 billion for the first time ever › Government Systems capitalized on sustained and growing demand for our innovative Non-Developmental Item products with 56% growth in awards compared to the prior year period and nearly $2 billion in new IDIQ agreements, despite constraints of the work-from-home environment In Satellite Services, our U.S. fixed broadband business added approximately 9,000 net subscribers in the quarter, and fixed broadband revenue per site grew substantially Commercial Networks more than doubled awards compared to the prior year period with continued success in applying antenna system products to government applications; completed a number of technical milestones on the ViaSat-3 program Raised $400 million in debt financing, which increased liquidity to over $900 million; subsequent to quarter end, we raised an additional $175 million from a strategic equity investment in our common stock AWARDS REVENUEOPERATING INCOME (LOSS) $ in millions $ in millions$ in millions $ 692 $737 $577$552$537 $592$588 $592$18.4 $506 $530$14.0$14.1 ($8.1)($5.3) Q1 Q2 Q3Q4Q1Q1Q2Q3 Q4Q1Q1Q2Q3Q4Q1 FY20 FY20 FY20 FY20 FY21FY20 FY20FY20 FY20FY21FY20 FY20 FY20 FY20FY21 ADJ. EBITDA NET INCOME (LOSS)*NON-GAAP NET INCOME* $ in millions $ in millions$ in millions $6.5 $118 $122 $120 $3.2$1.6 $97 $105$24.7 $21.0$20.0 $6.4$4.8 ($11.5)($12.4) Q1 Q2 Q3Q4Q1Q1Q2Q3Q4Q1Q1Q2Q3Q4Q1 FY20 FY20 FY20 FY20 FY21FY20 FY20 FY20 FY20FY21FY20 FY20 FY20FY20FY21 *Attributable to Viasat, Inc. common stockholders Shareholder Letter | Q1 Fiscal Year 2021 2 A reconciliation of non-GAAP financial measures to their nearest GAAP equivalents is provided at the end of this letter
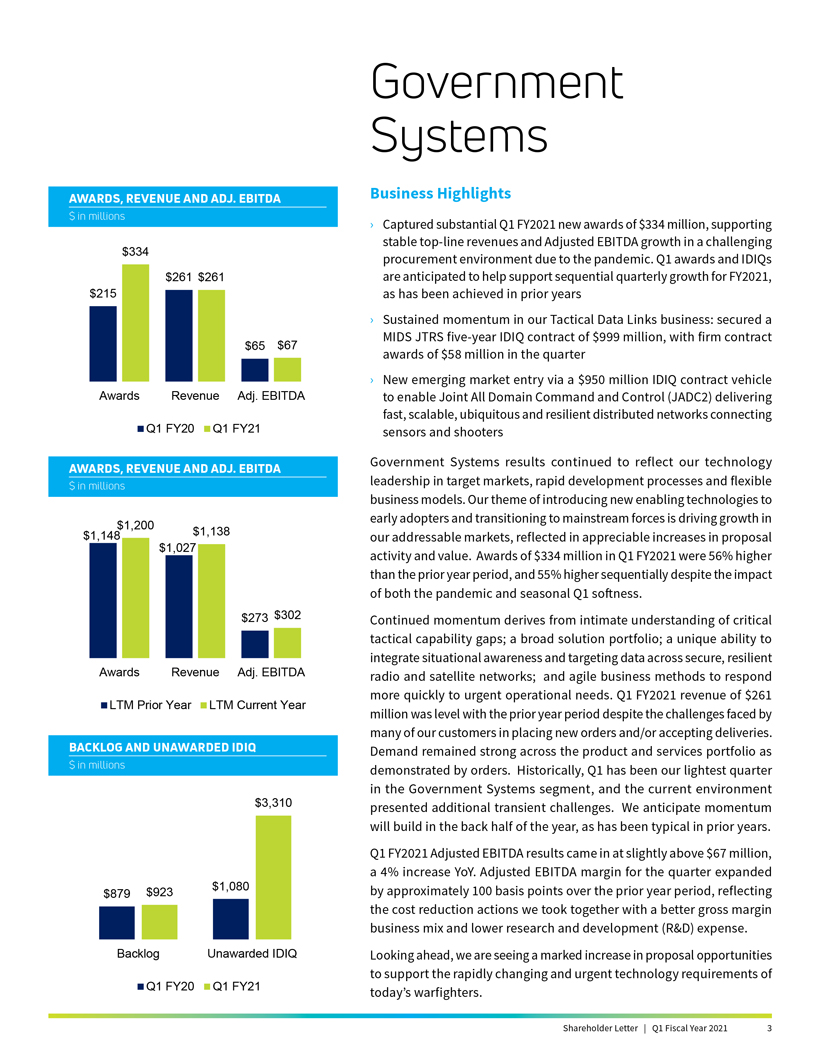
AWARDS, REVENUE AND ADJ. EBITDA $ in millions $334 $261 $261 $215 $65 $67 Awards Revenue Adj. EBITDA Q1 FY20 Q1 FY21 AWARDS, REVENUE AND ADJ. EBITDA $ in millions $1,200 $1,138 $1,148 $1,027 $273 $302 Awards Revenue Adj. EBITDA LTM Prior Year LTM Current Year BACKLOG AND UNAWARDED IDIQ $ in millions $3,310 $923 $1,080 $879 Backlog Unawarded IDIQ Q1 FY20 Q1 FY21 Government Systems Business Highlights › Captured substantial Q1 FY2021 new awards of $334 million, supporting stable top-line revenues and Adjusted EBITDA growth in a challenging procurement environment due to the pandemic. Q1 awards and IDIQs are anticipated to help support sequential quarterly growth for FY2021, as has been achieved in prior years › Sustained momentum in our Tactical Data Links business: secured a MIDS JTRS five-year IDIQ contract of $999 million, with firm contract awards of $58 million in the quarter › New emerging market entry via a $950 million IDIQ contract vehicle to enable Joint All Domain Command and Control (JADC2) delivering fast, scalable, ubiquitous and resilient distributed networks connecting sensors and shooters Government Systems results continued to reflect our technology leadership in target markets, rapid development processes and flexible business models. Our theme of introducing new enabling technologies to early adopters and transitioning to mainstream forces is driving growth in our addressable markets, reflected in appreciable increases in proposal activity and value. Awards of $334 million in Q1 FY2021 were 56% higher than the prior year period, and 55% higher sequentially despite the impact of both the pandemic and seasonal Q1 softness. Continued momentum derives from intimate understanding of critical tactical capability gaps; a broad solution portfolio; a unique ability to integrate situational awareness and targeting data across secure, resilient radio and satellite networks; and agile business methods to respond more quickly to urgent operational needs. Q1 FY2021 revenue of $261 million was level with the prior year period despite the challenges faced by many of our customers in placing new orders and/or accepting deliveries. Demand remained strong across the product and services portfolio as demonstrated by orders. Historically, Q1 has been our lightest quarter in the Government Systems segment, and the current environment presented additional transient challenges. We anticipate momentum will build in the back half of the year, as has been typical in prior years. Q1 FY2021 Adjusted EBITDA results came in at slightly above $67 million, a 4% increase YoY. Adjusted EBITDA margin for the quarter expanded by approximately 100 basis points over the prior year period, reflecting the cost reduction actions we took together with a better gross margin business mix and lower research and development (R&D) expense. Looking ahead, we are seeing a marked increase in proposal opportunities to support the rapidly changing and urgent technology requirements of today’s warfighters. Shareholder Letter | Q1 Fiscal Year 2021 3
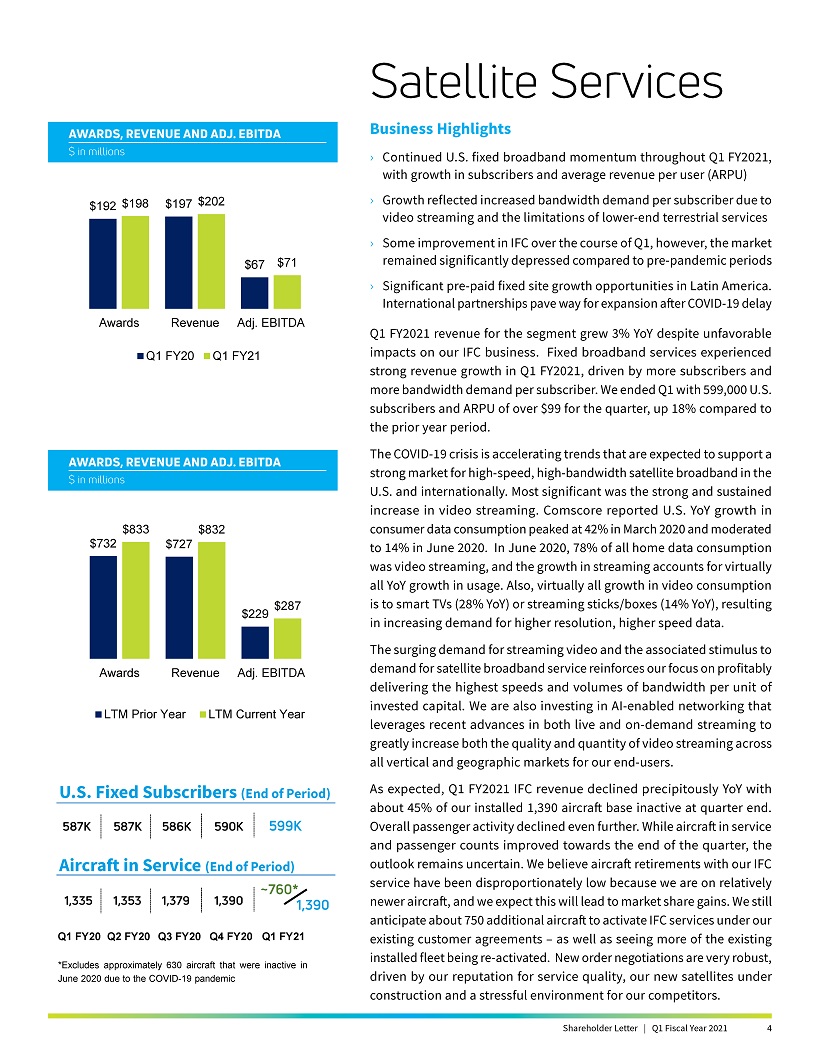
AWARDS, REVENUE AND ADJ. EBITDA $ in millions $192 $198 $197 $202 $67 $71 Awards Revenue Adj. EBITDA Q1 FY20 Q1 FY21 AWARDS, REVENUE AND ADJ. EBITDA $ in millions $833 $832 $732 $727 $287 $229 Awards Revenue Adj. EBITDA LTM Prior Year LTM Current Year U.S. Fixed Subscribers (End of Period) 587K 587K 586K 590K 599K Aircraft in Service (End of Period) ~760* 1,335 1,353 1,379 1,390 1,390 Q1 FY20 Q2 FY20 Q3 FY20 Q4 FY20 Q1 FY21 *Excludes approximately 630 aircraft that were inactive in June 2020 due to the COVID-19 pandemic Satellite Services Business Highlights › Continued U.S. fixed broadband momentum throughout Q1 FY2021, with growth in subscribers and average revenue per user (ARPU) › Growth reflected increased bandwidth demand per subscriber due to video streaming and the limitations of lower-end terrestrial services › Some improvement in IFC over the course of Q1, however, the market remained significantly depressed compared to pre-pandemic periods › Significant pre-paid fixed site growth opportunities in Latin America. International partnerships pave way for expansion after COVID-19 delay Q1 FY2021 revenue for the segment grew 3% YoY despite unfavorable impacts on our IFC business. Fixed broadband services experienced strong revenue growth in Q1 FY2021, driven by more subscribers and more bandwidth demand per subscriber. We ended Q1 with 599,000 U.S. subscribers and ARPU of over $99 for the quarter, up 18% compared to the prior year period. The COVID-19 crisis is accelerating trends that are expected to support a strong market for high-speed, high-bandwidth satellite broadband in the U.S. and internationally. Most significant was the strong and sustained increase in video streaming. Comscore reported U.S. YoY growth in consumer data consumption peaked at 42% in March 2020 and moderated to 14% in June 2020. In June 2020, 78% of all home data consumption was video streaming, and the growth in streaming accounts for virtually all YoY growth in usage. Also, virtually all growth in video consumption is to smart TVs (28% YoY) or streaming sticks/boxes (14% YoY), resulting in increasing demand for higher resolution, higher speed data. The surging demand for streaming video and the associated stimulus to demand for satellite broadband service reinforces our focus on profitably delivering the highest speeds and volumes of bandwidth per unit of invested capital. We are also investing in AI-enabled networking that leverages recent advances in both live and on-demand streaming to greatly increase both the quality and quantity of video streaming across all vertical and geographic markets for our end-users. As expected, Q1 FY2021 IFC revenue declined precipitously YoY with about 45% of our installed 1,390 aircraft base inactive at quarter end. Overall passenger activity declined even further. While aircraft in service and passenger counts improved towards the end of the quarter, the outlook remains uncertain. We believe aircraft retirements with our IFC service have been disproportionately low because we are on relatively newer aircraft, and we expect this will lead to market share gains. We still anticipate about 750 additional aircraft to activate IFC services under our existing customer agreements – as well as seeing more of the existing installed fleet being re-activated. New order negotiations are very robust, driven by our reputation for service quality, our new satellites under construction and a stressful environment for our competitors. Shareholder Letter | Q1 Fiscal Year 2021 4
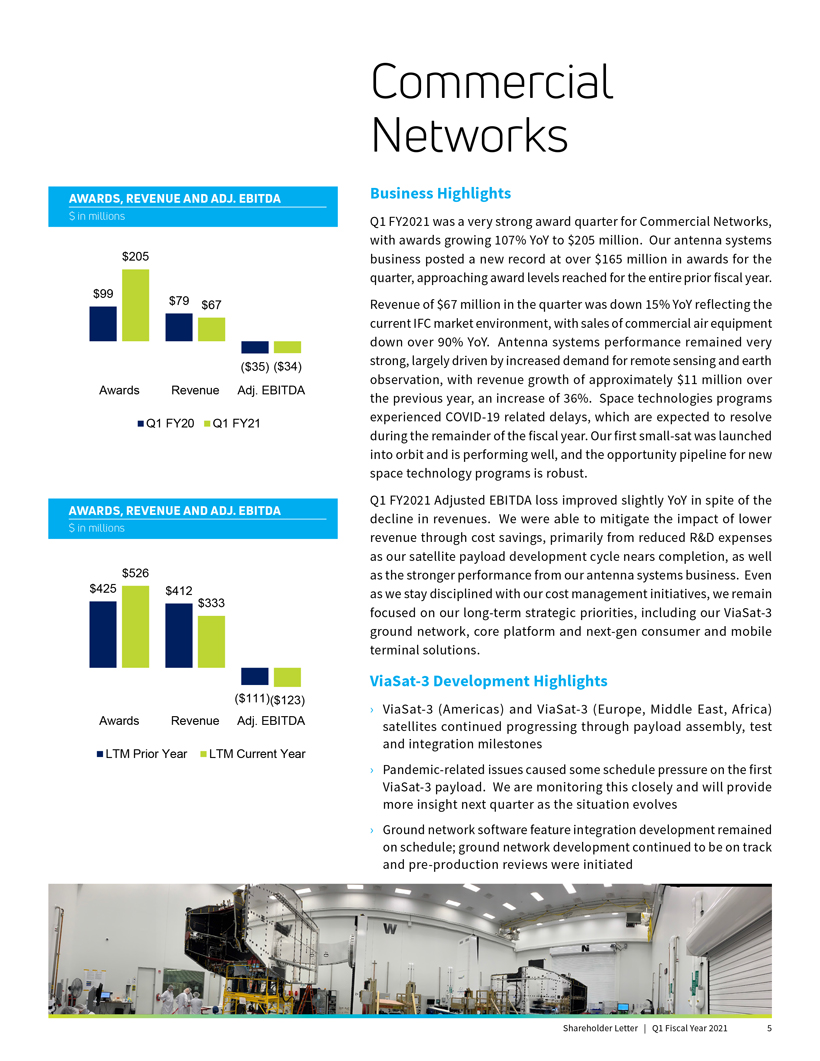
AWARDS, REVENUE AND ADJ. EBITDA $ in millions $205 $99 $79 $67 ($35) ($34) Awards Revenue Adj. EBITDA Q1 FY20 Q1 FY21 AWARDS, REVENUE AND ADJ. EBITDA $ in millions $526 $425 $412 $333 ($111)($123) Awards Revenue Adj. EBITDA LTM Prior Year LTM Current Year Commercial Networks Business Highlights Q1 FY2021 was a very strong award quarter for Commercial Networks, with awards growing 107% YoY to $205 million. Our antenna systems business posted a new record at over $165 million in awards for the quarter, approaching award levels reached for the entire prior fiscal year. Revenue of $67 million in the quarter was down 15% YoY reflecting the current IFC market environment, with sales of commercial air equipment down over 90% YoY. Antenna systems performance remained very strong, largely driven by increased demand for remote sensing and earth observation, with revenue growth of approximately $11 million over the previous year, an increase of 36%. Space technologies programs experienced COVID-19 related delays, which are expected to resolve during the remainder of the fiscal year. Our first small-sat was launched into orbit and is performing well, and the opportunity pipeline for new space technology programs is robust. Q1 FY2021 Adjusted EBITDA loss improved slightly YoY in spite of the decline in revenues. We were able to mitigate the impact of lower revenue through cost savings, primarily from reduced R&D expenses as our satellite payload development cycle nears completion, as well as the stronger performance from our antenna systems business. Even as we stay disciplined with our cost management initiatives, we remain focused on our long-term strategic priorities, including our ViaSat-3 ground network, core platform and next-gen consumer and mobile terminal solutions. ViaSat-3 Development Highlights › ViaSat-3 (Americas) and ViaSat-3 (Europe, Middle East, Africa) satellites continued progressing through payload assembly, test and integration milestones › Pandemic-related issues caused some schedule pressure on the first ViaSat-3 payload. We are monitoring this closely and will provide more insight next quarter as the situation evolves › Ground network software feature integration development remained on schedule; ground network development continued to be on track and pre-production reviews were initiated Shareholder Letter | Q1 Fiscal Year 2021 5
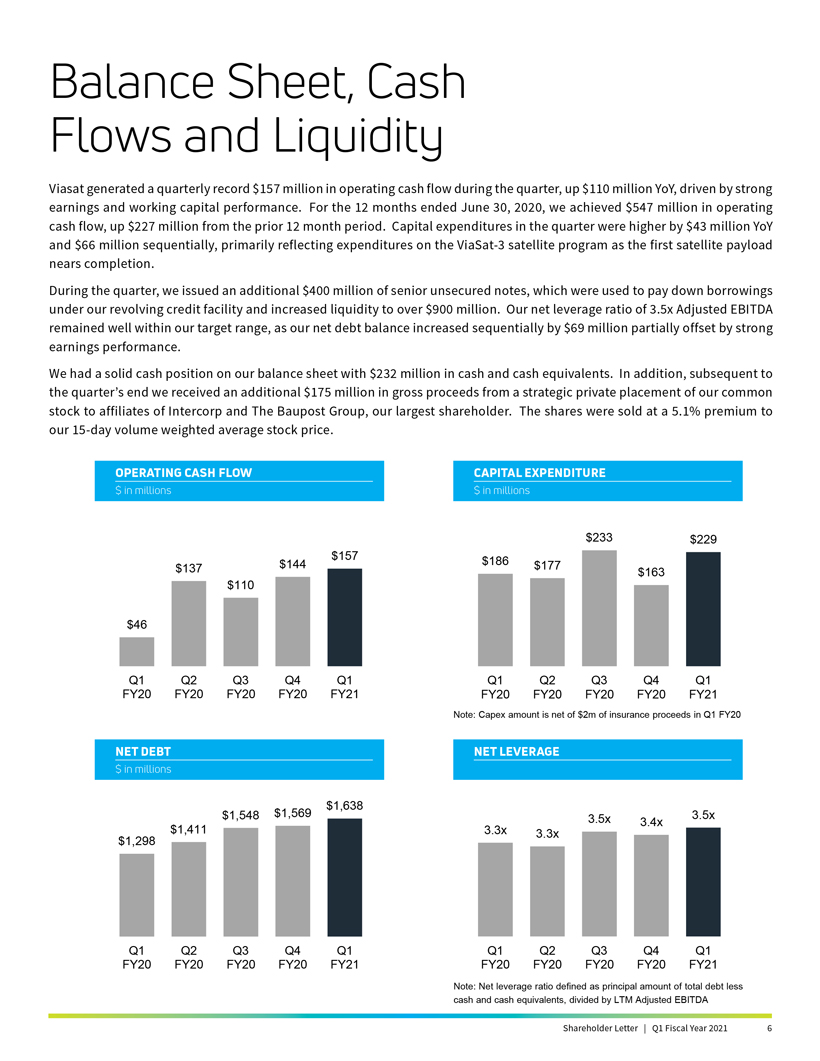
Balance Sheet, Cash Flows and Liquidity Viasat generated a quarterly record $157 million in operating cash flow during the quarter, up $110 million YoY, driven by strong earnings and working capital performance. For the 12 months ended June 30, 2020, we achieved $547 million in operating cash flow, up $227 million from the prior 12 month period. Capital expenditures in the quarter were higher by $43 million YoY and $66 million sequentially, primarily reflecting expenditures on the ViaSat-3 satellite program as the first satellite payload nears completion. During the quarter, we issued an additional $400 million of senior unsecured notes, which were used to pay down borrowings under our revolving credit facility and increased liquidity to over $900 million. Our net leverage ratio of 3.5x Adjusted EBITDA remained well within our target range, as our net debt balance increased sequentially by $69 million partially offset by strong earnings performance. We had a solid cash position on our balance sheet with $232 million in cash and cash equivalents. In addition, subsequent to the quarter’s end we received an additional $175 million in gross proceeds from a strategic private placement of our common stock to affiliates of Intercorp and The Baupost Group, our largest shareholder. The shares were sold at a 5.1% premium to our 15-day volume weighted average stock price. OPERATING CASH FLOW $ in millions $157 $137 $144 $110 $46 Q1 Q2 Q3 Q4 Q1 FY20 FY20 FY20 FY20 FY21 NET DEBT $ in millions $1,638 $1,548 $1,569 $1,411 $1,298 Q1 Q2 Q3 Q4 Q1 FY20 FY20 FY20 FY20 FY21 CAPITAL EXPENDITURE $ in millions $233 $229 $186 $177 $163 Q1 Q2 Q3 Q4 Q1 FY20 FY20 FY20 FY20 FY21 Note: Capex amount is net of $2m of insurance proceeds in Q1 FY20 NET LEVERAGE 3.5x 3.5x 3.4x 3.3x 3.3x Q1 Q2 Q3 Q4 Q1 FY20 FY20 FY20 FY20 FY21 Note: Net leverage ratio defined as principal amount of total debt less cash and cash equivalents, divided by LTM Adjusted EBITDA Shareholder Letter | Q1 Fiscal Year 2021 6

FY2021 Priorities and Outlook › While the COVID-19 crisis creates extraordinary macro uncertainty, Q1 FY2021 performance suggests a stronger financial outlook for us in the fiscal year than we perceived a quarter ago, with potential for meaningful Adjusted EBITDA growth. › Cost reduction actions taken early in the crisis supported margins in the quarter and are expected to create opportunities for sustained margin improvement. › Our broad business portfolio is helping overcome the decline in commercial aircraft IFC. Government Systems and fixed broadband contributed to 8% YoY growth in Adjusted EBITDA, and are anticipated to build momentum over the course of FY2021. Very strong awards, driving a record $2 billion contract backlog, plus another $3 billion in unawarded government IDIQ contract value, support this outlook. › Q1 FY2021 IFC results were in line with lowered expectations, but showed gains toward the end of the quarter. We see attractive domestic and global IFC opportunities, with robust new business activity, and are optimistic about gaining meaningful market share coming out of the crisis. › Greater than expected Adjusted EBITDA for the quarter and prudent spending supported our solid balance sheet and liquidity. A $400 million bond offering in the quarter added further to liquidity and a $175 million equity raise subsequent to Q1 reduced net leverage. We remain vigilant and intend to maintain financial prudence in both ongoing expenses and capital investments as necessary. › We see potential strategic growth opportunities and intend to pursue economically appealing ones, including evaluating success-based investments aligned with attractive global expansion. This is a time of unprecedented global disruption across nearly all businesses and sectors, and while we have not been immune ourselves, we have been able to achieve solid performance to date. This is a testament not only to our vertical integration and diverse portfolio of services and products, but also to the dedication and adaptability of our employees. On behalf of everyone on the Viasat team, I want to thank our shareholders, customers, partners and employees for their continued support, and we look forward to keeping you posted on our progress. Sincerely, Mark Dankberg Shareholder Letter | Q1 Fiscal Year 2021 7
Forward Looking Statements This presentation contains forward-looking statements that are subject to the safe harbors created under the Securities Act of 1933 and the Securities Exchange Act of 1934. Forward-looking statements include, among others, statements that refer to the impact of the COVID-19 pandemic on our business and our expected positioning and market share post-pandemic; projections of earnings, revenue, costs or other financial items; anticipated growth and trends in our business or key markets; ability to capitalize on awards and IDIQ contract vehicles received in the quarter; future economic conditions and performance, including expectations for performance and results of operations in the remainder of FY2021; the development, customer acceptance and anticipated performance of technologies, products or services; international growth opportunities, including in Latin America; satellite construction and launch activities, including expectations regarding completion and launch of our ViaSat-3 class satellites; anticipated subscriber growth; plans, objectives and strategies for future operations; the number of IFC systems anticipated to be activated under existing contracts with commercial airlines; and other characterizations of future events or circumstances, are forward-looking statements. Readers are cautioned that these forward-looking statements are only predictions and are subject to risks, uncertainties and assumptions that are difficult to predict. Factors that could cause actual results to differ materially and adversely include: our ability to realize the anticipated benefits of the ViaSat-2 and ViaSat-3 class satellites and any future satellite we may construct or acquire; unexpected expenses related to our satellite projects; our ability to successfully implement our business plan for our broadband services on our anticipated timeline or at all; risks associated with the construction, launch and operation of satellites, including the effect of any anomaly, operational failure or degradation in satellite performance; the impact of the COVID-19 pandemic on our business, suppliers, consumers, customers, and employees or the overall economy; our ability to realize the anticipated benefits of our acquisitions or strategic partnering arrangements; our ability to successfully develop, introduce and sell new technologies, products and services; audits by the U.S. government; changes in the global business environment and economic conditions; delays in approving U.S. government budgets and cuts in government defense expenditures; our reliance on U.S. government contracts, and on a small number of contracts which account for a significant percentage of our revenues; reduced demand for products and services as a result of continued constraints on capital spending by customers; changes in relationships with, or the financial condition of, key customers or suppliers; our reliance on a limited number of third parties to manufacture and supply our products; increased competition; introduction of new technologies and other factors affecting the communications and defense industries generally; the effect of adverse regulatory changes (including changes affecting spectrum availability or permitted uses) on our ability to sell or deploy our products and services; changes in the way others use spectrum; our inability to access additional spectrum, use spectrum for additional purposes, and/or operate satellites at additional orbital locations; competing uses of the same spectrum or orbital locations that we utilize or seek to utilize; the effect of recent changes to U.S. tax laws; our level of indebtedness and ability to comply with applicable debt covenants; our involvement in litigation, including intellectual property claims and litigation to protect our proprietary technology; and our dependence on a limited number of key employees. In addition, please refer to the risk factors contained in our SEC filings available at www.sec.gov, including our most recent Annual Report on Form 10-K and Quarterly Reports on Form 10-Q. Readers are cautioned not to place undue reliance on any forward-looking statements, which speak only as of the date on which they are made. We undertake no obligation to update or revise any forward-looking statements for any reason. Use of Non-GAAP Financial Information To supplement our consolidated financial statements presented in accordance with generally accepted accounting principles (GAAP), we use non-GAAP net income (loss) attributable to Viasat Inc. and Adjusted EBITDA, measures we believe are appropriate to enhance an overall understanding of our past financial performance and prospects for the future. We believe the non-GAAP results provide useful information to both management and investors by excluding specific expenses that we believe are not indicative of our core operating results. In addition, since we have historically reported non-GAAP results to the investment community, we believe the inclusion of non-GAAP numbers provides consistency in our financial reporting and facilitates comparisons to our historical operating results. Further, these non-GAAP results are among the primary indicators that management uses as a basis for evaluating the operating performance of our segments, allocating resources to such segments, planning and forecasting in future periods. The presentation of this additional information is not meant to be considered in isolation or as a substitute for measures of financial performance prepared in accordance with GAAP. A reconciliation of specific adjustments to GAAP results is provided in the tables below. Copyright © 2020 Viasat, Inc. All rights reserved. Viasat, the Viasat logo and the Viasat signal are registered trademarks of Viasat, Inc. All other product or company names mentioned are used for identification purposes only and may be trademarks of their respective owners. Shareholder Letter | Q1 Fiscal Year 2021 8
Viasat First Quarter Fiscal Year 2021 Results
| Financial Results |
||||||
| (In millions, except per share data) | Q1 FY21 | Q1 FY20 | Year-Over- Year Change | |||
|
Revenues |
$530.5 | $537.0 | (1)% | |||
|
Net loss1 |
($12.4) | ($11.5) | 8% | |||
|
Non-GAAP net income1 |
$4.8 | $6.4 | (25)% | |||
|
Adjusted EBITDA |
$104.7 | $96.8 | 8% | |||
|
Diluted per share net loss1 |
($0.20) | ($0.19) | 5% | |||
|
Non-GAAP diluted per share net income1,2 |
$0.08 | $0.10 | (20)% | |||
|
Fully diluted weighted average shares2 |
62.5 | 60.9 | 3% | |||
|
New contract awards3 |
$736.9 | $505.8 | 46% | |||
|
Sales backlog4 |
$2,114.6 | $1,839.8 | 15% | |||
| Segment Results |
||||||
| (In millions) | Q1 FY21 | Q1 FY20 | Year-Over- Year Change | |||
| Satellite Services |
||||||
|
New contract awards3 |
$197.8 | $192.0 | 3% | |||
|
Revenues |
$202.0 | $196.8 | 3% | |||
|
Operating loss5 |
($1.9) | ($2.1) | (10)% | |||
|
Adjusted EBITDA |
$71.4 | $67.1 | 6% | |||
|
Commercial Networks |
||||||
|
New contract awards |
$205.0 | $99.0 | 107% | |||
|
Revenues |
$67.2 | $79.0 | (15)% | |||
|
Operating loss5 |
($51.4) | ($49.9) | 3% | |||
|
Adjusted EBITDA |
($34.1) | ($35.2) | (3)% | |||
|
Government Systems |
||||||
|
New contract awards |
$334.1 | $214.8 | 56% | |||
|
Revenues |
$261.3 | $261.2 | 0% | |||
|
Operating profit5 |
$49.5 | $45.9 | 8% | |||
|
Adjusted EBITDA |
$67.5 | $64.9 | 4% | |||
| 1 | Attributable to Viasat, Inc. common stockholders. |
| 2 | As the three months ended June 30, 2020 and 2019 financial information resulted in a net loss, the weighted average number of shares used to calculate basic and diluted net loss per share is the same, as diluted shares would be anti-dilutive. However, as the non-GAAP financial information for the three months ended June 30, 2020 resulted in non-GAAP net income, 63.1 million diluted weighted average number of shares were used instead to calculate non-GAAP diluted net income per share. |
| 3 | Awards exclude future revenue under recurring consumer commitment arrangements. |
| 4 | Amounts include certain backlog adjustments due to contract changes and amendments. Our backlog includes contracts with subscribers for fixed broadband services in our satellite services segment. Backlog does not include anticipated purchase orders and requests for the installation of in-flight connectivity systems or future recurring in-flight internet service revenues under our commercial in-flight internet agreements in our Commercial Networks and Satellite Services segments, respectively. |
| 5 | Before corporate and amortization of acquired intangible assets. |

Shareholder Letter | Q1 Fiscal Year 2021 9
Viasat First Quarter Fiscal Year 2021 Results (cont.)
Condensed Consolidated Statements of Operations
(Unaudited)
(In thousands, except per share data)
| Three months ended | ||||||||
| June 30, 2020 | June 30, 2019 | |||||||
| Revenues: | ||||||||
| Product revenues | $ | 250,634 | $ | 263,615 | ||||
| Service revenues | 279,854 | 273,422 | ||||||
|
|
|
|
|
|||||
| Total revenues | 530,488 | 537,037 | ||||||
| Operating expenses: | ||||||||
| Cost of product revenues | 187,892 | 196,940 | ||||||
| Cost of service revenues | 197,677 | 187,519 | ||||||
| Selling, general and administrative | 121,039 | 125,132 | ||||||
| Independent research and development | 27,636 | 33,474 | ||||||
| Amortization of acquired intangible assets | 1,558 | 2,037 | ||||||
|
|
|
|
|
|||||
| Loss from operations | (5,314) | (8,065) | ||||||
| Interest expense, net | (9,292) | (10,249) | ||||||
|
|
|
|
|
|||||
| Loss before income taxes | (14,606) | (18,314) | ||||||
| Benefit from income taxes | 5,748 | 7,210 | ||||||
| Equity in income of unconsolidated affiliate, net | 331 | 1,367 | ||||||
|
|
|
|
|
|||||
| Net loss | (8,527) | (9,737) | ||||||
| Less: net income attributable to noncontrolling interests, net of tax |
3,862 | 1,731 | ||||||
|
|
|
|
|
|||||
| Net loss attributable to Viasat Inc. | $ | (12,389) | $ | (11,468) | ||||
|
|
|
|
|
|||||
| Diluted net loss per share attributable to Viasat Inc. common stockholders |
$ | (0.20) | $ | (0.19) | ||||
|
|
|
|
|
|||||
| Diluted common equivalent shares (2) | 62,511 | 60,917 | ||||||
| AN ITEMIZED RECONCILIATION BETWEEN NET INCOME (LOSS) ATTRIBUTABLE TO VIASAT INC. |
| |||||||
| ON A GAAP BASIS AND NON-GAAP BASIS IS AS FOLLOWS: |
| |||||||
| (In thousands, except per share data) | Three months ended | |||||||
| June 30, 2020 | June 30, 2019 | |||||||
| GAAP net loss attributable to Viasat Inc. | $ | (12,389) | $ | (11,468) | ||||
| Amortization of acquired intangible assets | 1,558 | 2,037 | ||||||
| Stock-based compensation expense | 20,942 | 21,227 | ||||||
| Income tax effect (1) | (5,321) | (5,418) | ||||||
|
|
|
|
|
|||||
| Non-GAAP net income attributable to Viasat Inc. | $ | 4,790 | $ | 6,378 | ||||
|
|
|
|
|
|||||
| Non-GAAP diluted net income per share attributable to Viasat Inc. common stockholders |
$ | 0.08 | $ | 0.10 | ||||
|
|
|
|
|
|||||
| Diluted common equivalent shares (2) | 63,083 | 60,917 | ||||||
|
(1) The income tax effect is calculated using the tax rate applicable for the non-GAAP adjustments. (2) As the three months ended June 30, 2020 and 2019 financial information resulted in a net loss, the weighted average number of shares used to calculate basic and diluted net loss per share is the same, as diluted shares would be anti-dilutive. However, as the non-GAAP financial information for the three months ended June 30, 2020 resulted in non-GAAP net income, diluted weighted average number of shares were used instead to calculate non-GAAP diluted net income per share.
AN ITEMIZED RECONCILIATION BETWEEN NET INCOME (LOSS) ATTRIBUTABLE TO VIASAT INC. AND ADJUSTED EBITDA IS AS FOLLOWS: |
| |||||||
| (In thousands) | Three months ended | |||||||
| June 30, 2020 | June 30, 2019 | |||||||
| GAAP net loss attributable to Viasat Inc. | $ | (12,389) | $ | (11,468) | ||||
| Benefit from income taxes | (5,748) | (7,210) | ||||||
| Interest expense, net | 9,292 | 10,249 | ||||||
| Depreciation and amortization | 92,602 | 84,012 | ||||||
| Stock-based compensation expense | 20,942 | 21,227 | ||||||
|
|
|
|
|
|||||
| Adjusted EBITDA | $ | 104,699 | $ | 96,810 | ||||
|
|
|
|
|
|||||
Shareholder Letter | Q1 Fiscal Year 2021 10
Viasat First Quarter Fiscal Year 2021 Results (cont.)
AN ITEMIZED RECONCILIATION BETWEEN SEGMENT OPERATING PROFIT (LOSS) BEFORE
CORPORATE AND AMORTIZATION OF ACQUIRED INTANGIBLE ASSETS AND ADJUSTED EBITDA IS AS FOLLOWS:
(In thousands)
| Three months ended June 30, 2020 | Three months ended June 30, 2019 | |||||||||||||||||||||||||||||||
| Satellite Services |
Commercial Networks |
Government Systems |
Total | Satellite Services |
Commercial Networks |
Government Systems |
Total | |||||||||||||||||||||||||
| Segment operating (loss) profit before corporate and amortization of acquired intangible assets |
$ | (1,857 | ) | $ | (51,394 | ) | $ | 49,495 | $ | (3,756 | ) | $ | (2,070 | ) | $ | (49,861 | ) | $ | 45,903 | $ | (6,028 | ) | ||||||||||
| Depreciation (3) | 58,516 | 7,402 | 11,842 | 77,760 | 53,594 | 5,519 | 9,689 | 68,802 | ||||||||||||||||||||||||
| Stock-based compensation expense | 6,211 | 7,574 | 7,157 | 20,942 | 6,487 | 7,388 | 7,352 | 21,227 | ||||||||||||||||||||||||
| Other amortization | 8,160 | 2,269 | 2,855 | 13,284 | 7,709 | 1,798 | 3,666 | 13,173 | ||||||||||||||||||||||||
| Equity in income of unconsolidated affiliate, net |
331 | - | - | 331 | 1,367 | - | - | 1,367 | ||||||||||||||||||||||||
| Noncontrolling interests |
- | - | (3,862 | ) | (3,862 | ) | - | - | (1,731 | ) | (1,731 | ) | ||||||||||||||||||||
|
|
|
|
|
|
|
|
|
|
|
|
|
|
|
|
|
|
|
|
|
|
|
|
| |||||||||
| Adjusted EBITDA |
$ | 71,361 | $ | (34,149 | ) | $ | 67,487 | $ | 104,699 | $ | 67,087 | $ | (35,156 | ) | $ | 64,879 | $ | 96,810 | ||||||||||||||
|
|
|
|
|
|
|
|
|
|
|
|
|
|
|
|
|
|
|
|
|
|
|
|
| |||||||||
| Twelve months ended June 30, 2020 | Twelve months ended June 30, 2019 | |||||||||||||||||||||||||||||||
| Satellite Services |
Commercial Networks |
Government Systems |
Total | Satellite Services |
Commercial Networks |
Government Systems |
Total | |||||||||||||||||||||||||
| Segment operating profit (loss) before corporate and amortization of acquired intangible assets |
$ | 7,228 | $ | (188,410 | ) | $ | 229,486 | $ | 48,304 | $ | (36,455 | ) | $ | (169,466 | ) | $ | 200,954 | $ | (4,967 | ) | ||||||||||||
| Depreciation (3) | 218,538 | 26,372 | 43,781 | 288,691 | 205,916 | 22,824 | 38,558 | 267,298 | ||||||||||||||||||||||||
| Stock-based compensation expense | 25,984 | 30,495 | 29,789 | 86,268 | 24,930 | 28,059 | 28,711 | 81,700 | ||||||||||||||||||||||||
| Other amortization | 32,126 | 8,089 | 14,730 | 54,945 | 29,837 | 7,567 | 10,887 | 48,291 | ||||||||||||||||||||||||
| Equity in income of unconsolidated affiliate, net |
3,434 | - | - | 3,434 | 3,300 | - | - | 3,300 | ||||||||||||||||||||||||
| Noncontrolling interests | - | - | (16,156 | ) | (16,156 | ) | 1,345 | - | (5,717 | ) | (4,372 | ) | ||||||||||||||||||||
|
|
|
|
|
|
|
|
|
|
|
|
|
|
|
|
|
|
|
|
|
|
|
|
| |||||||||
| Adjusted EBITDA | $ | 287,310 | $ | (123,454 | ) | $ | 301,630 | $ | 465,486 | $ | 228,873 | $ | (111,016 | ) | $ | 273,393 | $ | 391,250 | ||||||||||||||
|
|
|
|
|
|
|
|
|
|
|
|
|
|
|
|
|
|
|
|
|
|
|
|
| |||||||||
| (3) | Depreciation expenses not specifically recorded in a particular segment have been allocated based on other indirect allocable costs, which management believes is a reasonable method. |
Condensed Consolidated Balance Sheets
(Unaudited)
(In thousands)
| As of | As of | As of | As of | |||||||||||||||
| Assets | June 30, 2020 | March 31, 2020 | Liabilities and Equity | June 30, 2020 | March 31, 2020 | |||||||||||||
| Current assets: | Current liabilities: | |||||||||||||||||
| Cash and cash equivalents | $ | 232,418 | $ | 304,309 | Accounts payable | $ | 175,955 | $ | 183,601 | |||||||||
| Accounts receivable, net | 270,436 | 330,698 | Accrued and other liabilities | 359,762 | 391,190 | |||||||||||||
| Inventories | 312,686 | 294,416 | Current portion of long-term debt | 29,470 | 29,788 | |||||||||||||
|
|
|
|
|
|
| |||||||||||||
| Prepaid expenses and other current assets |
105,985 | 116,281 | Total current liabilities | 565,187 | 604,579 | |||||||||||||
|
|
|
|
|
|
|
|||||||||||||
| Total current assets | 921,525 | 1,045,704 | ||||||||||||||||
| Senior notes | 1,680,902 | 1,285,497 | ||||||||||||||||
| Other long-term debt | 134,636 | 536,166 | ||||||||||||||||
| Non-current operating lease liabilities |
281,937 | 286,550 | ||||||||||||||||
| Property, equipment and satellites, net | 2,715,822 | 2,586,735 | Other liabilities | 142,529 | 120,934 | |||||||||||||
|
|
|
|
|
|
| |||||||||||||
| Operating lease right-of-use assets | 304,975 | 308,441 | Total liabilities | 2,805,191 | 2,833,726 | |||||||||||||
|
|
|
|
|
|
| |||||||||||||
| Other acquired intangible assets, net | 13,041 | 14,439 | Total Viasat Inc. stockholders’ equity |
2,072,966 | 2,027,787 | |||||||||||||
| Goodwill | 121,285 | 121,197 | Noncontrolling interest in subsidiary |
26,217 | 22,355 | |||||||||||||
|
|
|
|
|
|
| |||||||||||||
| Other assets | 827,726 | 807,352 | Total equity | 2,099,183 | 2,050,142 | |||||||||||||
|
|
|
|
|
|
|
|
|
|
|
|
| |||||||
| Total assets | $ | 4,904,374 | $ | 4,883,868 | Total liabilities and equity | $ | 4,904,374 | $ | 4,883,868 | |||||||||
|
|
|
|
|
|
|
|
|
|
|
|
| |||||||
Shareholder Letter | Q1 Fiscal Year 2021 11
Viasat Financial Reconciliation Prior Periods
AN ITEMIZED RECONCILIATION BETWEEN NET INCOME (LOSS) ATTRIBUTABLE TO VIASAT INC.
ON A GAAP BASIS AND NON-GAAP BASIS IS AS FOLLOWS:
| (In thousands, except per share data) | Three months ended | |||||||||||
| March 31, 2020 | December 30, 2019 | September 30, 2019 | ||||||||||
| GAAP net income attributable to Viasat Inc. | $ | 1,586 | $ | 6,476 | $ | 3,194 | ||||||
| Amortization of acquired intangible assets | 1,691 | 1,856 | 2,027 | |||||||||
| Stock-based compensation expense | 22,317 | 21,908 | 21,101 | |||||||||
| Income tax effect (1) | (5,610 | ) | (5,573 | ) | (5,329 | ) | ||||||
|
|
|
|
|
|
|
|
|
| ||||
| Non-GAAP net income attributable to Viasat Inc. | $ | 19,984 | $ | 24,667 | $ | 20,993 | ||||||
|
|
|
|
|
|
|
|
|
| ||||
| Non-GAAP diluted net income per share attributable to Viasat Inc. common stockholders | $ | 0.32 | $ | 0.39 | $ | 0.33 | ||||||
|
|
|
|
|
|
|
|
|
| ||||
| Diluted common equivalent shares | 63,090 | 62,916 | 62,761 | |||||||||
|
|
|
|
|
|
|
|
|
| ||||
|
(1) The income tax effect is calculated using the tax rate applicable for the non-GAAP adjustments. |
| |||||||||||
|
AN ITEMIZED RECONCILIATION BETWEEN NET INCOME (LOSS) ATTRIBUTABLE TO VIASAT INC. |
| |||||||||||
| AND ADJUSTED EBITDA IS AS FOLLOWS: |
| |||||||||||
| (In thousands) | Three months ended | |||||||||||
| March 31, 2020 | December 30, 2019 | September 30, 2019 | ||||||||||
| GAAP net income attributable to Viasat Inc. | $ | 1,586 | $ | 6,476 | $ | 3,194 | ||||||
| Provision for (benefit from) income taxes | 816 | (3,911 | ) | 2,390 | ||||||||
| Interest expense, net | 8,520 | 9,097 | 9,127 | |||||||||
| Depreciation and amortization | 87,069 | 88,759 | 82,338 | |||||||||
| Stock-based compensation expense |
22,317 | 21,908 | 21,101 | |||||||||
|
|
|
|
|
|
|
|
|
| ||||
| Adjusted EBITDA | $ | 120,308 | $ | 122,329 | $ | 118,150 | ||||||
|
|
|
|
|
|
|
|
|
| ||||
Shareholder Letter | Q1 Fiscal Year 2021 12