Attached files
| file | filename |
|---|---|
| EX-99.1 - EXHIBIT 99.1 - KELLY SERVICES INC | a20202qearningsrelease.htm |
| 8-K - 8-K - KELLY SERVICES INC | kelya-20200806.htm |

Exhibit 99.2 SECOND QUARTER 2020 AUGUST 6, 2020

SECOND QUARTER TAKEWAYS COVID-19 pandemic impacts global economy and demand for our services • Q2 revenue down 28.7%, down 27.7% in constant currency(1) • June exit rate of 22.5% in constant currency reflects improvement, but uneven improvement in demand trends • Education and light industrial staffing are the most impacted Near-term COVID-19 pandemic response • Employed technology to facilitate remote work for nearly all full-time employees and deliver on our commitment to talent, customers, employees, and the communities we serve • Initiated short-term cost reductions and took steps to preserve financial flexibility • Responding to customers with traditional and unique solutions and preparing to return our talent to work in an environment in which COVID-19 mitigation efforts continue Continued focus on our future • Deployed new front office platform to most U.S. Operations streamlining processes and workflows associated with recruiting, onboarding and reassigning talent, and enabling additional investments to enhance the experience of job seekers • Launched the Kelly Talent Promise confirming our responsibility to workers in search of a better way to work • As of July 1, 2020, operating as five specialty business units: Professional & Industrial; Science, Engineering and Technology; Education; Outsourcing & Consulting; and International (1)Constant Currency represents year-over-year changes resulting from translating 2020 financial data into USD using 2019 exchange rates. | 2

SECOND QUARTER 2020 FINANCIAL SUMMARY Constant Currency Actual Results Change Change(1) Revenue $1.0B (28.7%) (27.7%) Gross Profit % 19.4% 160 bps Earnings from Operations $11.1M (68.2%) (67.5%) Earnings Per Share $1.04 ($1.08) • Revenue declined in all segments from decrease in demand related to the COVID-19 pandemic. Education and light industrial staffing were the most impacted • GP rate improved on one-time or limited duration government stimulus and pandemic relief impacts, as well as lower employee-related costs and structural improvement in product mix, partially offset by lower perm fees • Earnings from operations declined as the effect of declining revenues and gross profit was only partially offset by reduced expenses from efforts to align costs with GP trends and lower performance-based incentive expenses. 2019 results also included a $12.3 milliongain on sale of assets • Q2 2020 EPS reflects lower earnings and includes a $0.52 non-cash gain from the investment in Persol Holdings common stock, net of tax. Q2 2019 EPS includes an after-tax gain of $1.07 from investment in Persol Holdings common stock and a $0.23 gain on sale of assets, net of tax (1)Constant Currency represents year-over-year changes resulting from translating 2020 financial data into USD using 2019 exchange rates. | 3

SECOND QUARTER 2020 FINANCIAL SUMMARY (Excluding Gain/Loss on Investment in Persol Holdings, Gain on Sale of Assets and Restructuring) Constant Currency Actual Results Change Change(3) Revenue $1.0B (28.7%) (27.7%) Gross Profit % 19.4% 160 bps Earnings from Operations(1) $10.9M (50.4%) (49.3%) Earnings Per Share(1),(2) $0.51 ($0.30) • Revenue declined in all segments from decrease in demand related to the COVID-19 pandemic. Education and light industrial staffing were the most impacted • GP rate improved on one-time or limited duration government stimulus and pandemic relief impacts, as well as lower employee-related costs and structural improvement in product mix, partially offset by lower perm fees • Earnings from operations declined as the effect of declining revenues and gross profit was only partially offset by reduced expenses from efforts to align costs with GP trends and lower performance-based incentive expenses • EPS declined on lower earnings (1)Change excludes: ‒ Gain on sale of assets of $12.3 million, $9.0 million net of tax or $0.23 per share in Q2 2019. ‒ Restructuring accrual adjustments of $0.2 million, $0.2 million net of tax or $0.00 per share in Q2 2020 and $0.6 million, $0.5 million net of tax or $0.01 per share in Q2 2019. (2) Excludes gain on investment in Persol Holdings of $29.6 million, $20.6 million net of tax or $0.52 per share in Q2 2020 and gain on investment in Persol Holdings of $61.2 million, $42.5 million net of tax or $1.07 per share in Q2 2019. (3)Constant Currency represents year-over-year changes resulting from translating 2020 financial data into USD using 2019 exchange rates. | 4

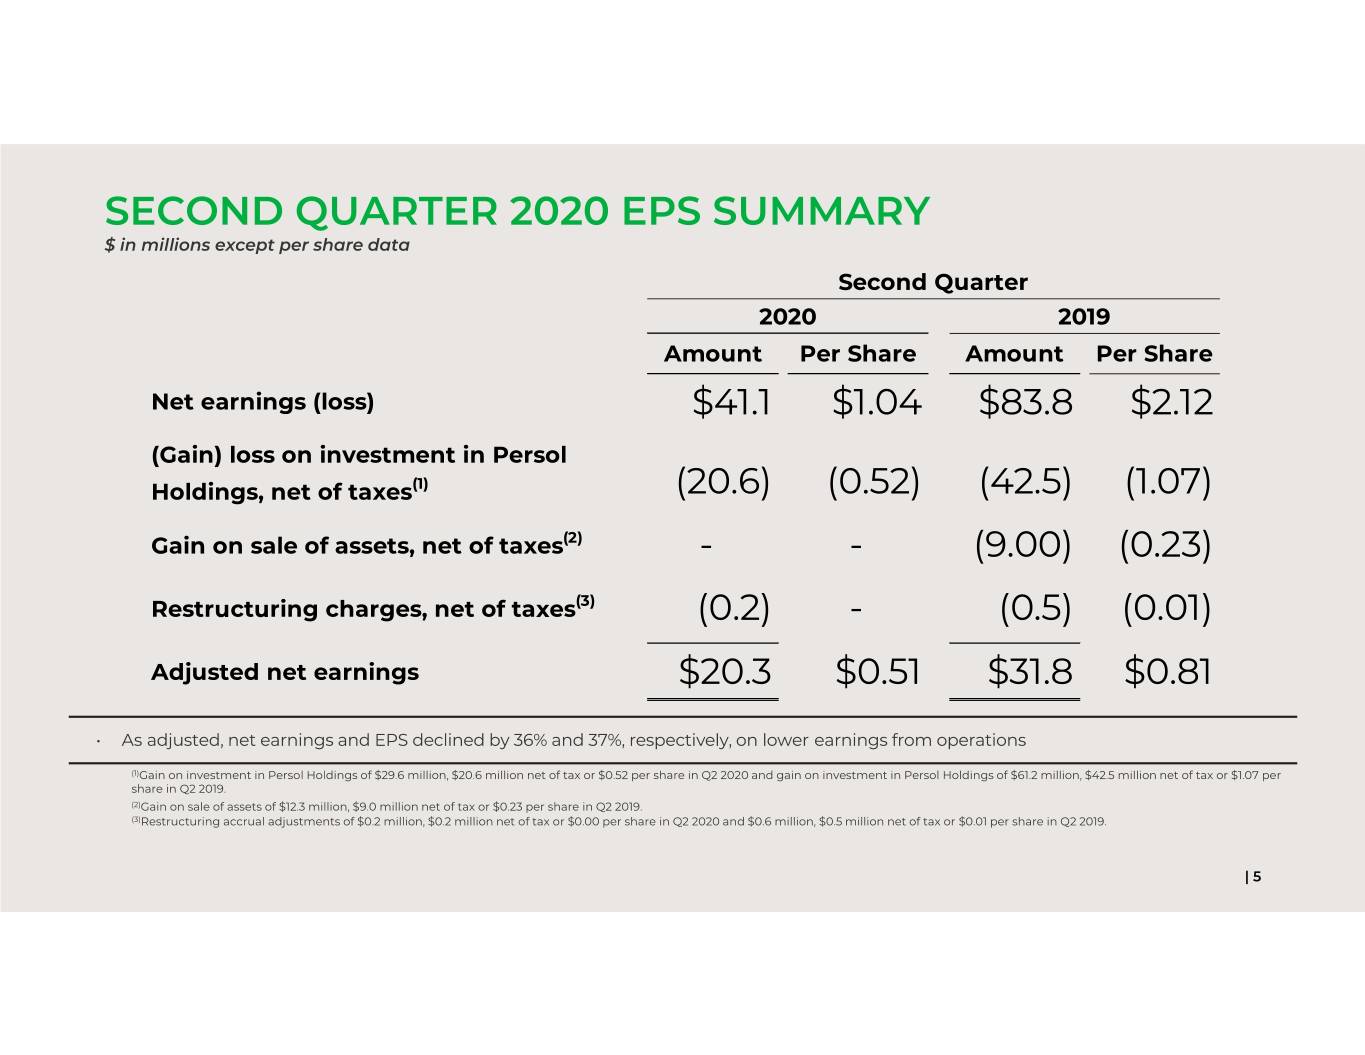
SECOND QUARTER 2020 EPS SUMMARY $ in millions except per share data Second Quarter 2020 2019 Amount Per Share Amount Per Share Net earnings (loss) $41.1 $1.04 $83.8 $2.12 (Gain) loss on investment in Persol Holdings, net of taxes(1) (20.6) (0.52) (42.5) (1.07) Gain on sale of assets, net of taxes(2) - - (9.00) (0.23) Restructuring charges, net of taxes(3) (0.2) - (0.5) (0.01) Adjusted net earnings $20.3 $0.51 $31.8 $0.81 • As adjusted, net earnings and EPS declined by 36% and 37%, respectively, on lower earnings from operations (1)Gain on investment in Persol Holdings of $29.6 million, $20.6 million net of tax or $0.52 per share in Q2 2020 and gain on investment in Persol Holdings of $61.2 million, $42.5 million net of tax or $1.07 per share in Q2 2019. (2)Gain on sale of assets of $12.3 million, $9.0 million net of tax or $0.23 per share in Q2 2019. (3)Restructuring accrual adjustments of $0.2 million, $0.2 million net of tax or $0.00 per share in Q2 2020 and $0.6 million, $0.5 million net of tax or $0.01 per share in Q2 2019. | 5

SECOND QUARTER 2020 REVENUE GROWTH REVENUE GROWTH BY SEGMENT REVENUE MIX BY SEGMENT(1) 0% Reported Americas Staffing (10%) (7.5%) (7.5%) Constant (7.7%) Currency International 33% Staffing Organic (20%) Growth(2) Global Talent Solutions 48% (30%) (27.7%) (29.3%) (28.7%) (28.1%) (31.1%) (29.3%) 19% (40%) (44.1%) (45.3%) (45.0%) (50%) Total Americas Global Talent International Staffing Solutions Staffing • Americas Staffing revenue declined on lower volume, particularly in education and light industrial, which were the most impacted by the COVID-19 pandemic • GTS revenue includes declines in centrally delivered staffing, which were impacted by the COVID-19 pandemic, partially offset by increases in outcome-based services • International Staffing reflects continued declines in market demand accelerated by the impact of COVID-19 (1)Revenue Mix by Segment includes the results from acquisition. (2)Organic growth represents revenue growth excluding the results of acquisition on a constant currency basis. | 6

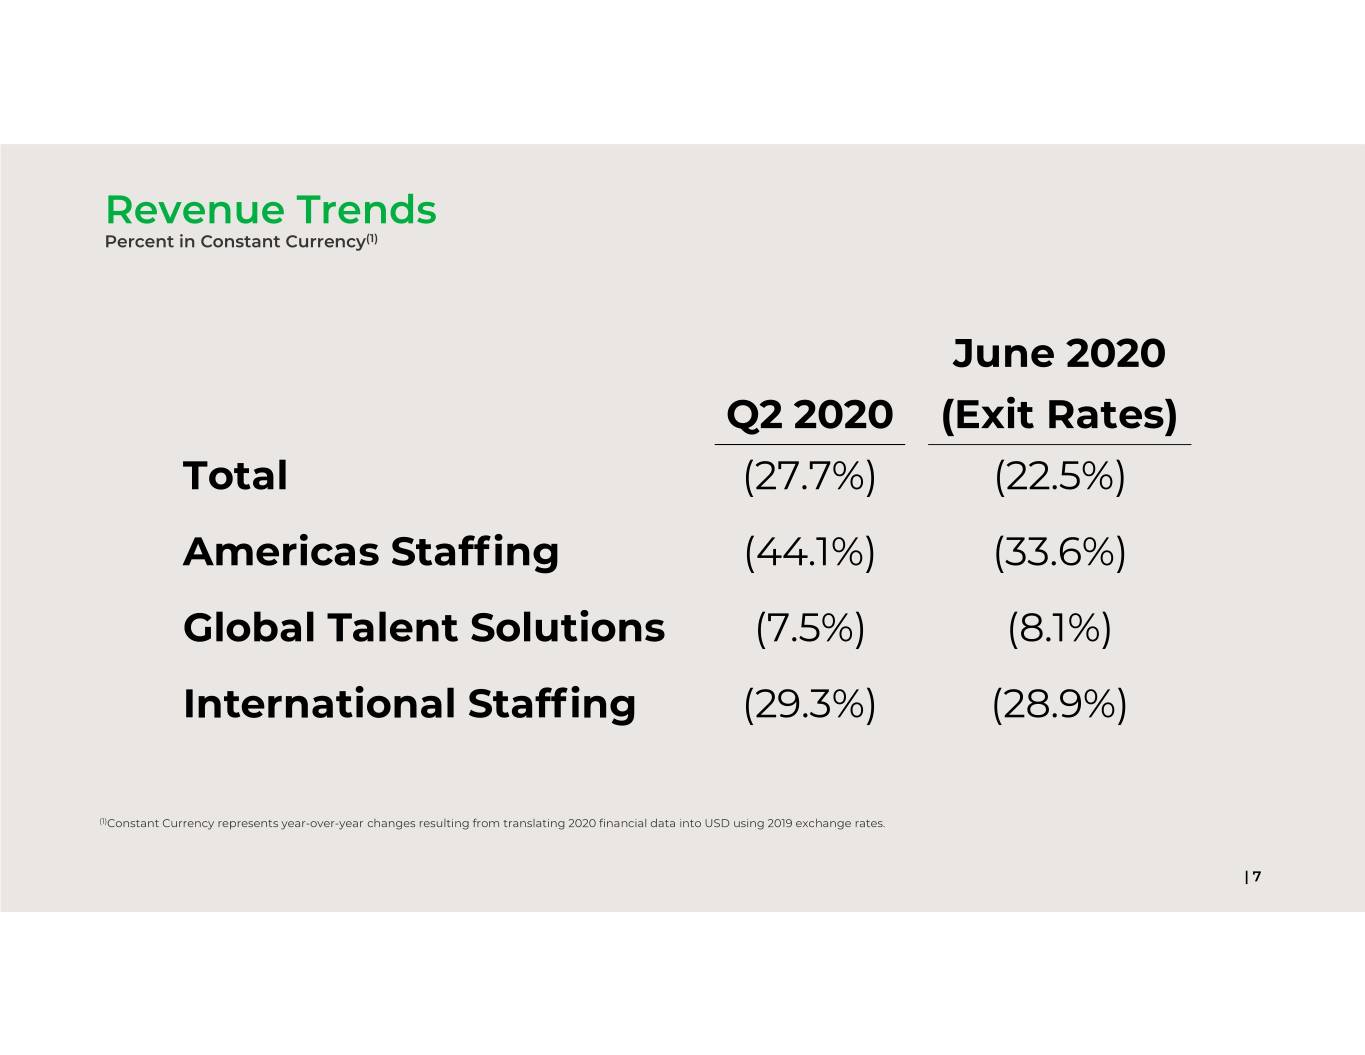
Revenue Trends Percent in Constant Currency(1) June 2020 Q2 2020 (Exit Rates) Total (27.7%) (22.5%) Americas Staffing (44.1%) (33.6%) Global Talent Solutions (7.5%) (8.1%) International Staffing (29.3%) (28.9%) (1)Constant Currency represents year-over-year changes resulting from translating 2020 financial data into USD using 2019 exchange rates. | 7

SECOND QUARTER 2020 GROSS PROFIT GROWTH GROSS POFIT BY SEGMENT(1) GROSS PROFIT GROWTH BY SEGMENT Americas Staffing Reported International 10% 3.3% 3.8% Constant Staffing 0% Currency Global Talent 34% Solutions (10%) 54% (20%) (22.5%) (21.7%) (30%) 12% (40%) (36.0%)(34.3%) (41.7%)(40.9%) (50%) Total Americas Global Talent International Staffing Solutions Staffing • Americas Staffing GP reflects the impact of lower revenues, benefits from government stimulus and pandemic relief, and lower employee-related costs, which was partially offset by customer mix • GTS GP reflects lower revenue offset by the benefits from government stimulus and pandemic relief, lower employee-related costs and the structural rate improvement from changes in product mix • International Staffing reflects the impact of lower revenue, including perm fees and the impact of unfavorable customer mix (1)Gross Profit Mix by Segment includes the results from acquisition. | 8

SECOND QUARTER 2020 GROSS PROFIT RATE GROWTH 20.0% 10 bps 19.5% 50 bps 19.4% (10) bps 19.0% 110 bps 18.5% 18.0% 17.8% 17.5% 17.0% 16.5% 16.0% 15.5% 15.0% Q2 2019 GP Rate Global Talent Americas FX International Q2 2020 GP Rate Solutions Staffing Staffing • Overall GP rate improved due to the benefit of government stimulus and pandemic relief and lower employee-related costs • GTS GP rate improvement also reflects improved product mix | 9

SECOND QUARTER 2020 SG&A $ in millions $230 $222 $220 $210 $200 ($23) $190 ($10) $178 $180 ($7) ($2) ($2) $170 $160 $150 Q2 2019 SG&A Americas Global Talent International Corporate FX Q2 2020 SG&A Staffing Solutions Staffing • Americas Staffing expenses were down due to temporary expense reduction efforts in response to the COVID-19 pandemic, lower performance-based compensation and lower salary expense as a result of the Q1 2019 restructuring actions in U.S. Operations • SG&A was down for GTS and International Staffing due to the impact of temporary expense reduction efforts in response to COVID-19, as well as ongoing expense management efforts | 10

SECOND QUARTER 2020 BALANCE SHEET DATA $ in millions ACCOUNTS RECEIVABLE SHORT-TERM BORROWINGS $1,500 $40 $1,274 $1,282 $1,300 $1,085 $1,100 $19 $20 $900 $700 $2 $0 $500 $0 Q2 2019 Q4 2019 Q2 2020 Q2 2019 Q4 2019 Q2 2020 Excluding Acquisitions Acquisitions • Accounts Receivable reflects the impact of the recent acquisition of Insight. Including the acquisition, DSO is 61 days, up 4 days from a year ago. The increase reflects the impact of customer cash management efforts, changes in customer mix and an acceleration of the seasonal decline in Education DSO to earlier in the year as a result of COVID related revenue impacts • Ended the quarter with no debt and cash balances of $216.2 million reflecting the reduction in working capital, primarily Accounts Receivable, as revenue declined in the quarter, the benefit of deferring certain payroll tax payments under the CARES Act, partially offset by the unfavorable impact on Accounts Receivable from higher DSO ‒ U.S. credit facilities include a $150 million securitization facility and a $200 million revolving credit facility | 11

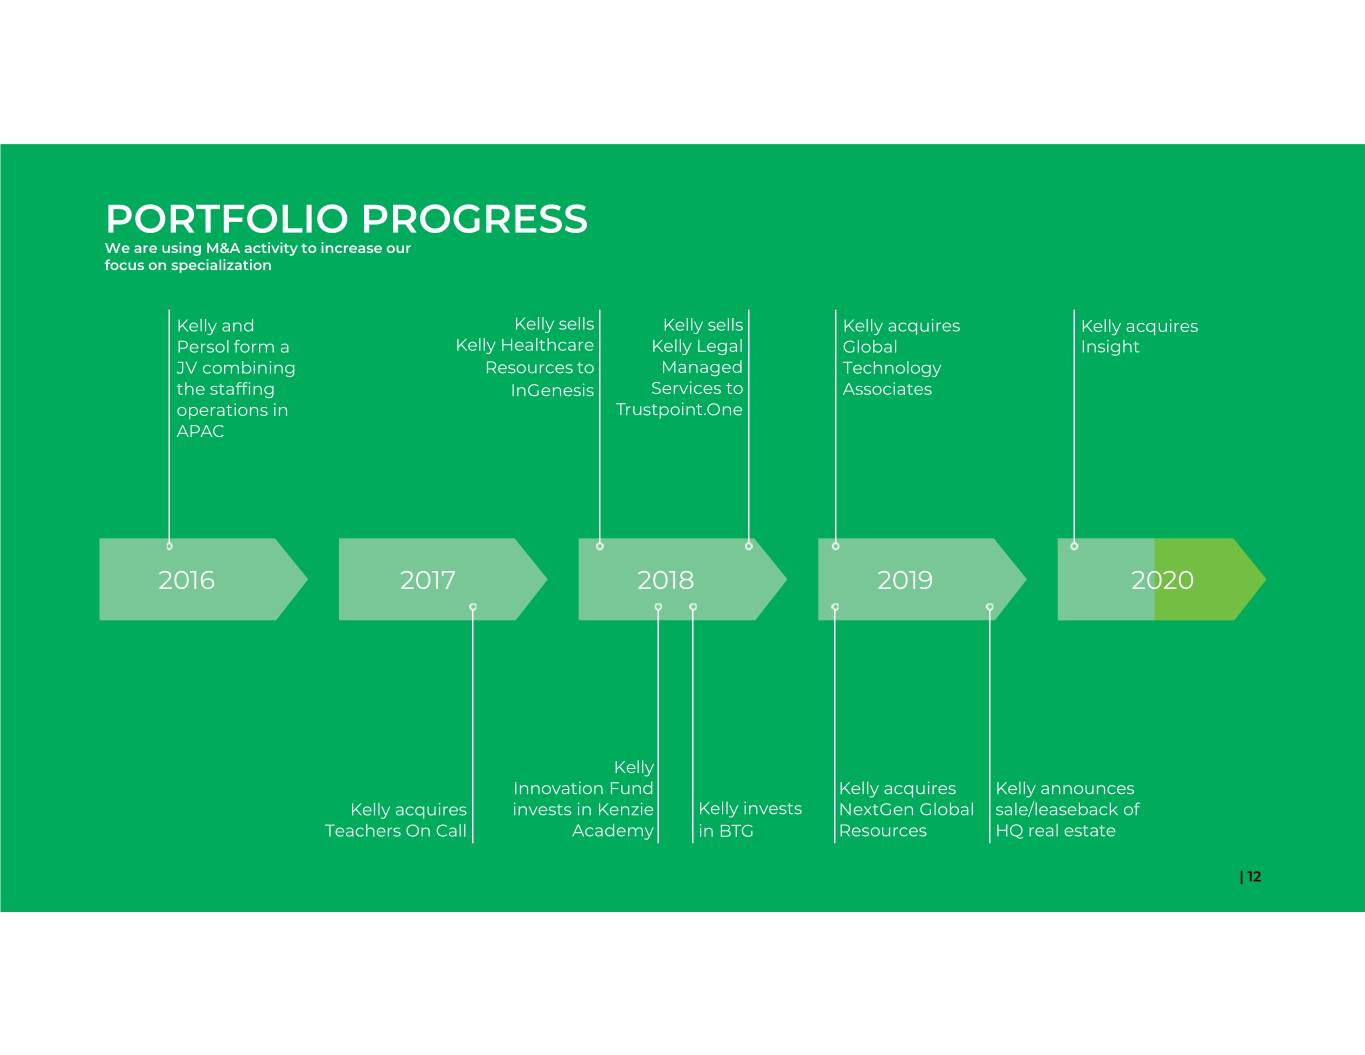
PORTFOLIO PROGRESS We are using M&A activity to increase our focus on specialization Kelly and Kelly sells Kelly sells Kelly acquires Kelly acquires Persol form a Kelly Healthcare Kelly Legal Global Insight JV combining Resources to Managed Technology the staffing InGenesis Services to Associates operations in Trustpoint.One APAC 2016 2017 2018 2019 2020 Kelly Innovation Fund Kelly acquires Kelly announces Kelly acquires invests in Kenzie Kelly invests NextGen Global sale/leaseback of Teachers On Call Academy in BTG Resources HQ real estate | 12

RECENT ACQUISITION: INSIGHT • Education service staffing company with experience in partnering with school districts in Illinois, Massachusetts, New Jersey and Pennsylvania | 13

NON-GAAP MEASURES Management believes that the non-GAAP (Generally Accepted Accounting Principles) information excluding the 2020 and 2019 gains on the investment in Persol Holdings, the 2020 and 2019 restructuring accrual adjustments, and the 2019 gain on sale of assets are useful to understand the Company's fiscal 2020 financial performance and increases comparability. Specifically, Management believes that removing the impact of these items allows for a meaningful comparison of current period operating performance with the operating results of prior periods. Additionally, the Company does not acquire businesses on a predictable cycle and the terms of each acquisition are unique and may vary significantly. Management also believes that such measures are used by those analyzing performance of companies in the staffing industry to compare current performance to prior periods and to assess future performance. These non-GAAP measures may have limitations as analytical tools because they exclude items which can have a material impact on cash flow and earnings per share. As a result, Management considers these measures, along with reported results, when it reviews and evaluates the Company's financial performance. Management believes that these measures provide greater transparency to investors and provide insight into how Management is evaluating the Company's financial performance. Non-GAAP measures should not be considered a substitute for, or superior to, measures of financial performance prepared in accordance with GAAP. | 14

SAFE HARBOR STATEMENT This release contains statements that are forward-looking in nature and, accordingly, are subject to risks and uncertainties. These factors include, but are not limited to, the recent novel coronavirus (COVID-19) outbreak, competitive market pressures including pricing and technology introductions and disruptions, changing market and economic conditions, our ability to achieve our business strategy, the risk of damage to our brand, the risk our intellectual property assets could be infringed upon or compromised, our ability to successfully develop new service offerings, our exposure to risks associated with services outside traditional staffing, including business process outsourcing and services connecting talent to independent work, our increasing dependency on third parties for the execution of critical functions, the risks associated with past and future acquisitions, exposure to risks associated with investments in equity affiliates including PersolKelly Pte. Ltd., material changes in demand from or loss of large corporate customers as well as changes in their buying practices, risks particular to doing business with government or government contractors, risks associated with conducting business in foreign countries, including foreign currency fluctuations, the exposure to potential market and currency exchange risks relating to our investment in Persol Holdings, risks associated with violations of anti-corruption, trade protection and other laws and regulations, availability of qualified full-time employees, availability of temporary workers with appropriate skills required by customers, liabilities for employment-related claims and losses, including class action lawsuits and collective actions, risks arising from failure to preserve the privacy of information entrusted to us or to meet our obligations under global privacy laws, the risk of cyberattacks or other breaches of network or information technology security, our ability to sustain critical business applications through our key data centers, our ability to effectively implement and manage our information technology projects, our ability to maintain adequate financial and management processes and controls, risk of potential impairment charges triggered by adverse industry developments or operational circumstances, unexpected changes in claim trends on workers’ compensation, unemployment, disability and medical benefit plans, the impact of changes in laws and regulations (including federal, state and international tax laws), competition law risks, the risk of additional tax or unclaimed property liabilities in excess of our estimates, our ability to realize value from our tax credit and net operating loss carryforwards, our ability to maintain specified financial covenants in our bank facilities to continue to access credit markets, and other risks, uncertainties and factors discussed in this release and in the Company’s filings with the Securities and Exchange Commission. Actual results may differ materially from any forward-looking statements contained herein, and we have no intention to update these statements. | 15
