Attached files
| file | filename |
|---|---|
| EX-99.1 - EX-99.1 - Dun & Bradstreet Holdings, Inc. | q22020prexhibit991.htm |
| 8-K - 8-K - Dun & Bradstreet Holdings, Inc. | dnb-20200806.htm |

Dun & Bradstreet SECOND QUARTER 2020 FINANCIAL RESULTS August 6, 2020

DISCLAIMER This presentation contains estimates and other “forward–looking statements” regarding Dun & Bradstreet Holdings, Inc. (“Dun & Bradstreet”), and its subsidiaries (collectively, the “Company”), its financial condition and its results of operations that reflect Dun & Bradstreet’s current views and information currently available that are subject to a number of trends, known and unknown risks, uncertainties and other factors many of which are outside the control of the Company and its officers, employees, agents or associates. Forward-looking statements include all statements that do not relate solely to historical or current facts and can generally be identified by the use of forward-looking words such as “may”, “will”, “would”, “could”, “expect”, “intend”, “plan”, “aim”, “estimate”, “target”, “anticipate”, “believe”, “continue”, “objectives”, “outlook”, “guidance” or other similar words, and include statements regarding the Company’s plans, strategies, objectives, targets and expected financial performance. You are cautioned not to place undue reliance on the utility of the information in this Presentation as a predictor of future performance. Any estimates and statements contained herein may be forward- looking in nature and involve significant elements of subjective judgment and analysis, which may or may not be correct. Risks, uncertainties and other factors may cause actual results to vary materially and potentially adversely from those anticipated, estimated or projected. For example, throughout this Presentation we discuss the Company’s business strategy and certain short and long term financial and operational expectations that we believe would be achieved based upon our planned business strategy for the next several years. These expectations can only be achieved if the assumptions underlying our business strategy are fully realized –some of which we cannot control (e.g., market growth rates, macroeconomic conditions and customer preferences) and we will review these assumptions as part of our annual planning process. The trends, known and unknown risks, uncertainties, assumptions and other factors that may cause actual results to vary materially or potentially adversely from those anticipated, estimated or projected include, among other things, the implementation of the Company’s strategic plans to transform the business; the development or sales solutions in a timely manner or maintaining and enhancing client relationships; competing effectively and maintaining its brand and reputation; global economic conditions, risks associated with operating internationally; incidents related to data security and integrity or a failure in the integrity of the Company’s data or its systems; loss of access to data sources; failure to maintain existing client relationships (including with government clients); the Company’s relationships with strategic alliances or joint ventures; the Company’s ability to complete and integrate acquisitions; the ability to retain members of the senior leadership team and attract and retain skilled employees; and compliance with government laws and regulations. All information herein speaks only as of (1) the date hereof, in the case of information about the Company (2) the date of such information, in the case of information from persons other than the Company. There can be no assurance any forecasts and estimates will prove accurate in whole or in part. The Company does not undertake any duty to update or revise the information contained herein, publicly or otherwise. The Presentation also includes certain financial information that is not presented in accordance with Generally Accepted Accounting Principles (“GAAP”), including, but not limited to, EBITDA, Adjusted EBITDA, and certain ratios and other metrics derived therefrom. These non-GAAP financial measures are not measures of financial performance in accordance with GAAP and may exclude items that are significant in understanding and assessing the Company’s financial results. Further, it is important to note that non-GAAP financial measures should not be considered in isolation and may be considered in addition to GAAP financial information, but should not be used as substitutes for the corresponding GAAP measures. It is also important to note that EBITDA, Adjusted EBITDA for specified fiscal periods have been calculated in accordance with the definitions thereof as set out in our public disclosures and are not projections of anticipated results but rather reflect permitted adjustments. You should be aware that Dun & Bradstreet’s presentation of these and other non-GAAP financial measures in this Presentation may not be comparable to similarly-titled measures used by other companies. All amounts in this Presentation are in USD unless otherwise stated. All trademarks and logos depicted in this Presentation are the property of their respective owners and are displayed solely for purposes of illustration.

FINANCIAL HIGHLIGHTS (GAAP) METRICS SECOND QUARTER 2020 Revenue $421 million, +5.4% (+5.6% constant currency) Net loss $(207) million vs. $(94) million Q2’19 Diluted loss per share $(0.66) 1

FINANCIAL HIGHLIGHTS (NON-GAAP) METRICS SECOND QUARTER 2020 Adjusted Revenue (1) $421 million, +5.4% (+5.6% constant currency) Adjusted EBITDA (2) $176 million, +18.5% Adjusted EBITDA Margin 41.9% Adjusted Net Income $82 million Adjusted diluted earnings per share $0.26 (1) Includes the net impact of lower deferred revenue purchase accounting adjustments of $35.9 million or a 8.6% point impact. (2) Includes the net impact of lower deferred revenue purchase accounting adjustments of $35.9 million or a 23.0% point impact. 2

NORTH AMERICA REVENUE ($ IN MILLIONS) AFX BFX 1 $360.9 (1.8%) (1.8%) $354.3 SECOND Sales & Marketing $160.1 +0.4% +0.4% $160.7 QUARTER Finance HIGHLIGHTS & Risk $200.8 (3.6%) (3.5%) $193.6 Q2 2019 Q2 2020 • Finance & Risk revenue decline of 3.5% primarily due to known headwinds: Structural changes EBITDA MARGIN % EBITDA ($ IN MILLIONS) within legacy Credibility solutions $175.1 and lower usage volume from $170.1 48.5% 48.0% COVID-19; partially offset by growth in subscription-based revenues (2.8%) (50bps) • Sales & Marketing revenue growth of 0.4% Q2 2019 Q2 2020 Q2 2019 Q2 2020 • EBITDA margin of 48.0% (1) BFX represents the growth rate before the impact of foreign exchange 3

INTERNATIONAL REVENUE ($ IN MILLIONS) AFX BFX 1 $76.0 (9.9%) (8.9%) $68.4 SECOND $12.1 +3.5% +3.6% Sales & $12.5 Marketing QUARTER Finance $63.9 (12.4%) (11.3%) $55.9 HIGHLIGHTS & Risk Q2 2019 Q2 2020 • Finance & Risk revenue decline of 11.3% primarily due to known headwinds in the Worldwide EBITDA ($ IN MILLIONS) EBITDA MARGIN % Network (WWN) and lower $27.5 36.2% usage volumes from COVID-19 $20.2 29.5% • Sales & Marketing revenue growth of 3.6% primarily due to increased product royalties from (26.7%) (670bps) WWN Q2 2019 Q2 2020 Q2 2019 Q2 2020 • EBITDA margin of 29.5% declined primarily due to lower revenues (1) BFX represents the growth rate before the impact of foreign exchange 4

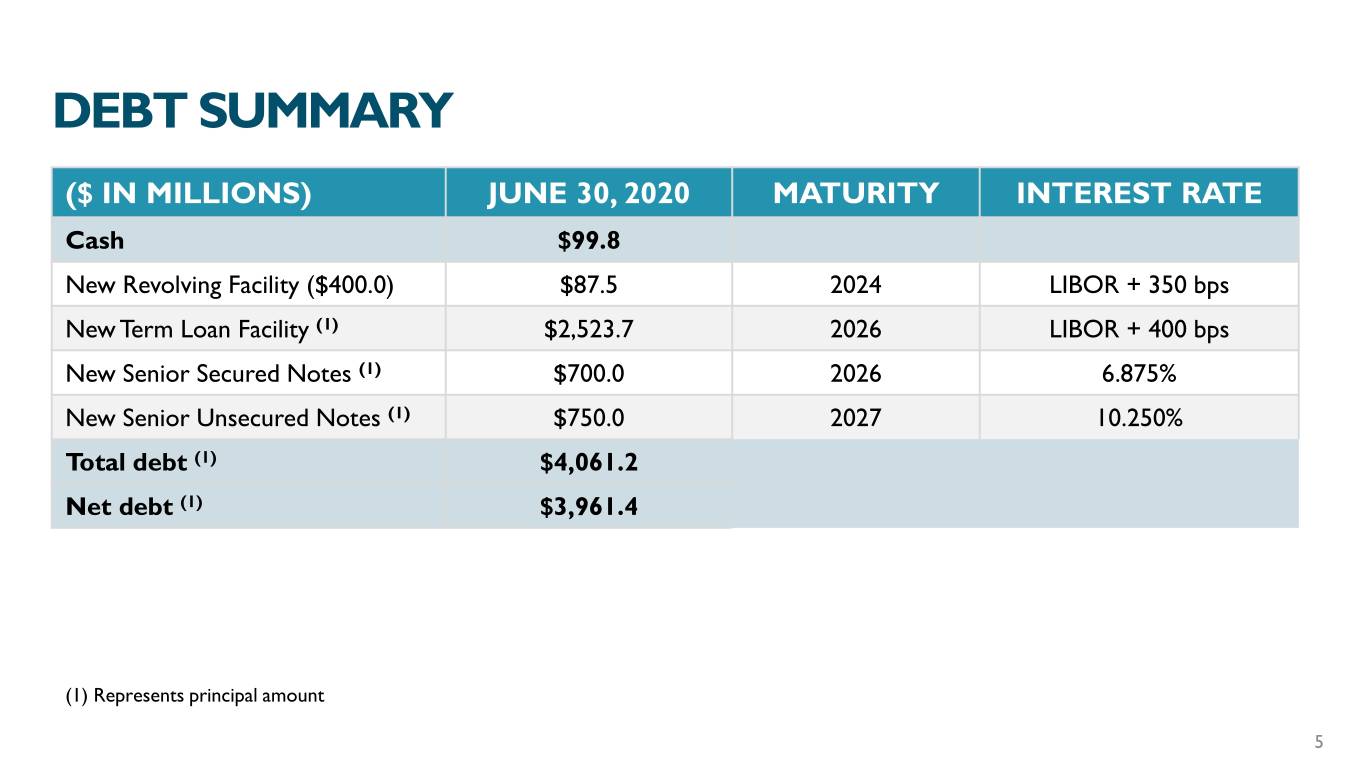
DEBT SUMMARY ($ IN MILLIONS) JUNE 30, 2020 MATURITY INTEREST RATE Cash $99.8 New Revolving Facility ($400.0) $87.5 2024 LIBOR + 350 bps New Term Loan Facility (1) $2,523.7 2026 LIBOR + 400 bps New Senior Secured Notes (1) $700.0 2026 6.875% New Senior Unsecured Notes (1) $750.0 2027 10.250% Total debt (1) $4,061.2 Net debt (1) $3,961.4 (1) Represents principal amount 5

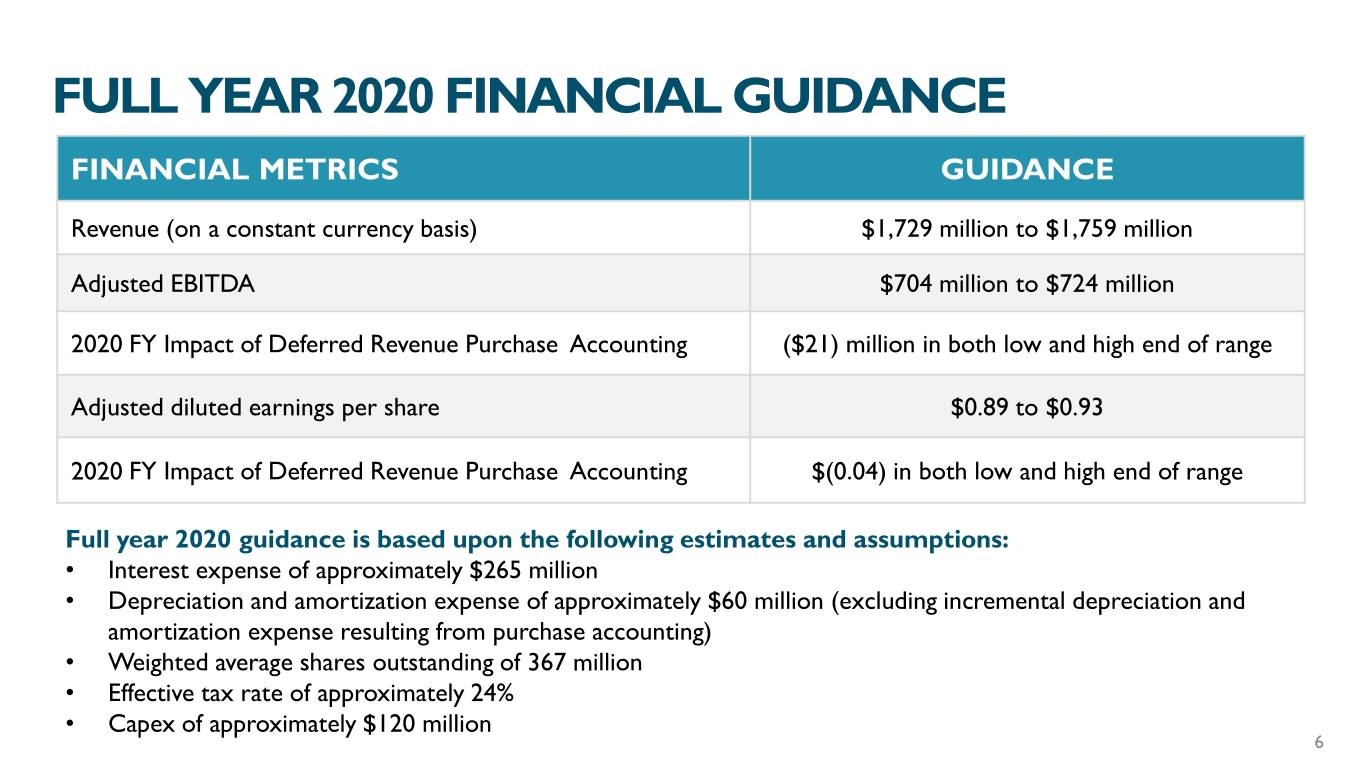
FULL YEAR 2020 FINANCIAL GUIDANCE FINANCIAL METRICS GUIDANCE Revenue (on a constant currency basis) $1,729 million to $1,759 million Adjusted EBITDA $704 million to $724 million 2020 FY Impact of Deferred Revenue Purchase Accounting ($21) million in both low and high end of range Adjusted diluted earnings per share $0.89 to $0.93 2020 FY Impact of Deferred Revenue Purchase Accounting $(0.04) in both low and high end of range Full year 2020 guidance is based upon the following estimates and assumptions: • Interest expense of approximately $265 million • Depreciation and amortization expense of approximately $60 million (excluding incremental depreciation and amortization expense resulting from purchase accounting) • Weighted average shares outstanding of 367 million • Effective tax rate of approximately 24% • Capex of approximately $120 million 6

APPENDIX

NON-GAAP FINANCIAL MEASURES In addition to reporting GAAP results, we evaluate performance and report our results on the non-GAAP financial measures discussed below. We believe that the presentation of these non-GAAP measures provides useful information to investors and rating agencies regarding our results, operating trends and performance between periods. These non-GAAP financial measures include adjusted revenue, adjusted earnings before interest, taxes, depreciation and amortization (‘‘adjusted EBITDA’’), adjusted EBITDA margin and adjusted net income. Adjusted results are non-GAAP measures that adjust for the impact due to purchase accounting application and divestitures, restructuring charges, equity-based compensation, acquisition and divestiture-related costs (such as costs for bankers, legal fees, due diligence, retention payments and contingent consideration adjustments) and other non-core gains and charges that are not in the normal course of our business (such as gains and losses on sales of businesses, impairment charges, effect of significant changes in tax laws and material tax and legal settlements). We exclude amortization of recognized intangible assets resulting from the application of purchase accounting because it is non-cash and not indicative of our ongoing and underlying operating performance. Recognized intangible assets arise from acquisitions, or primarily the Take-Private Transaction. We believe that recognized intangible assets by their nature are fundamentally different from other depreciating assets that are replaced on a predictable operating cycle. Unlike other depreciating assets, such as developed and purchased software licenses or property and equipment, there is no replacement cost once these recognized intangible assets expire and the assets are not replaced. Additionally, our costs to operate, maintain and extend the life of acquired intangible assets and purchased intellectual property are reflected in our operating costs as personnel, data fee, facilities, overhead and similar items. Management believes it is important for investors to understand that such intangible assets were recorded as part of purchase accounting and contribute to revenue generation. Amortization of recognized intangible assets will recur in future periods until such assets have been fully amortized. In addition, we isolate the effects of changes in foreign exchange rates on our revenue growth because we believe it is useful for investors to be able to compare revenue from one period to another, both after and before the effects of foreign exchange rate changes. The change in revenue performance attributable to foreign currency rates is determined by converting both our prior and current periods’ foreign currency revenue by a constant rate. As a result, we monitor our adjusted revenue growth both after and before the effects of foreign exchange rate changes. We believe that these supplemental non-GAAP financial measures provide management and other users with additional meaningful financial information that should be considered when assessing our ongoing performance and comparability of our operating results from period to period. Our management regularly uses our supplemental non-GAAP financial measures internally to understand, manage and evaluate our business and make operating decisions. These non- GAAP measures are among the factors management uses in planning for and forecasting future periods. Non-GAAP financial measures should be viewed in addition to, and not as an alternative to our reported results prepared in accordance with GAAP. Our non-GAAP or adjusted financial measures reflect adjustments based on the following items, as well as the related income tax. Adjusted Revenue We define adjusted revenue as revenue adjusted to include revenue for the period from January 8 to February 7, 2019 (‘‘International lag adjustment’’) for the Predecessor related to the lag reporting for our International operations. On a GAAP basis, we report International results on a one-month lag, and for 2019 the Predecessor period for International is December 1, 2018 through January 7, 2019. The Successor period for International is February 8, 2019 (commencing on the closing date of the Take-Private Transaction) through November 30, 2019 for the Successor period from January 1, 2019 to December 31, 2019. The International lag adjustment is to facilitate comparability of 2019 periods to 2020 periods. Adjusted EBITDA and Adjusted EBITDA Margin We define adjusted EBITDA as net income (loss) attributable to Dun & Bradstreet Holdings, Inc. (Successor) / The Dun & Bradstreet Corporation (Predecessor) excluding the following items: • depreciation and amortization; • interest expense and income; • income tax benefit or provision; • other expenses or income; • equity in net income of affiliates; • net income attributable to non-controlling interests; • dividends allocated to preferred stockholders; • revenue and expense adjustments to include results for the period from January 8 to February 7, 2019, for the Predecessor related to the International lag adjustment (see above discussion); • other incremental or reduced expenses from the application of purchase accounting (e.g. commission asset amortization); • equity-based compensation; • restructuring charges; • merger and acquisition-related operating costs; • transition costs primarily consisting of non-recurring incentive expenses associated with our synergy program; • legal reserve and costs associated with significant legal and regulatory matters; and asset impairment. We calculate adjusted EBITDA margin by dividing adjusted EBITDA by adjusted revenue. 7

NON-GAAP FINANCIAL MEASURES (CONTINUED) Adjusted Net Income We define adjusted net income as net income (loss) attributable to Dun & Bradstreet Holdings, Inc. (Successor) / The Dun & Bradstreet Corporation (Predecessor) adjusted for the following items: • revenue and expense adjustments to include results for the period from January 8 to February 7, 2019, for the Predecessor related to the International lag adjustment (see above discussion); • incremental amortization resulting from the application of purchase accounting. We exclude amortization of recognized intangible assets resulting from the application of purchase accounting because it is non- cash and is not indicative of our ongoing and underlying operating performance. The Company believes that recognized intangible assets by their nature are fundamentally different from other depreciating assets that are replaced on a predictable operating cycle. Unlike other depreciating assets, such as developed and purchased software licenses or property and equipment, there is no replacement cost once these recognized intangible assets expire and the assets are not replaced. Additionally, the Company’s costs to operate, maintain and extend the life of acquired intangible assets and purchased intellectual property are reflected in the Company’s operating costs as personnel, data fee, facilities, overhead and similar items; • other incremental or reduced expenses from the application of purchase accounting (e.g. commission asset amortization); • equity-based compensation; • restructuring charges; • merger and acquisition-related operating costs; • transition costs primarily consisting of non-recurring incentive expenses associated with our synergy program; • legal reserve and costs associated with significant legal and regulatory matters; • change in fair value of the make-whole derivative liability associated with the Series A Preferred Stock; • asset impairment; • non-recurring pension charges, related to pension settlement charge and actuarial loss amortization eliminated as a result of the Take-Private Transaction; • dividends allocated to preferred stockholders; • merger, acquisition and divestiture-related non-operating costs; • debt refinancing and extinguishment costs; and • tax effect of the non-GAAP adjustments and the impact resulting from the enactment of the CARES Act. Adjusted Net Earnings per Diluted Share We calculate adjusted net earnings per diluted share by dividing adjusted net income (loss) by the weighted average number of common shares outstanding for the period plus the dilutive effect of common shares potentially issuable in connection with awards outstanding under our stock incentive plan. For consistency purposes, we assume the stock split effected on June 23, 2020 at the beginning of each of the Predecessor periods. 8

NON-GAAP RECONCILIATION: ADJUSTED REVENUE THREE MONTHS ENDED JUNE 30, ($ IN MILLIONS) 2020 2019 Revenue $420.6 $398.9 International lag adjustment - - Adjusted Revenue $420.6 $398.9 Foreign currency impact 2.7 1.8 Adjusted revenue before the effect of foreign currency $423.3 $400.7 9

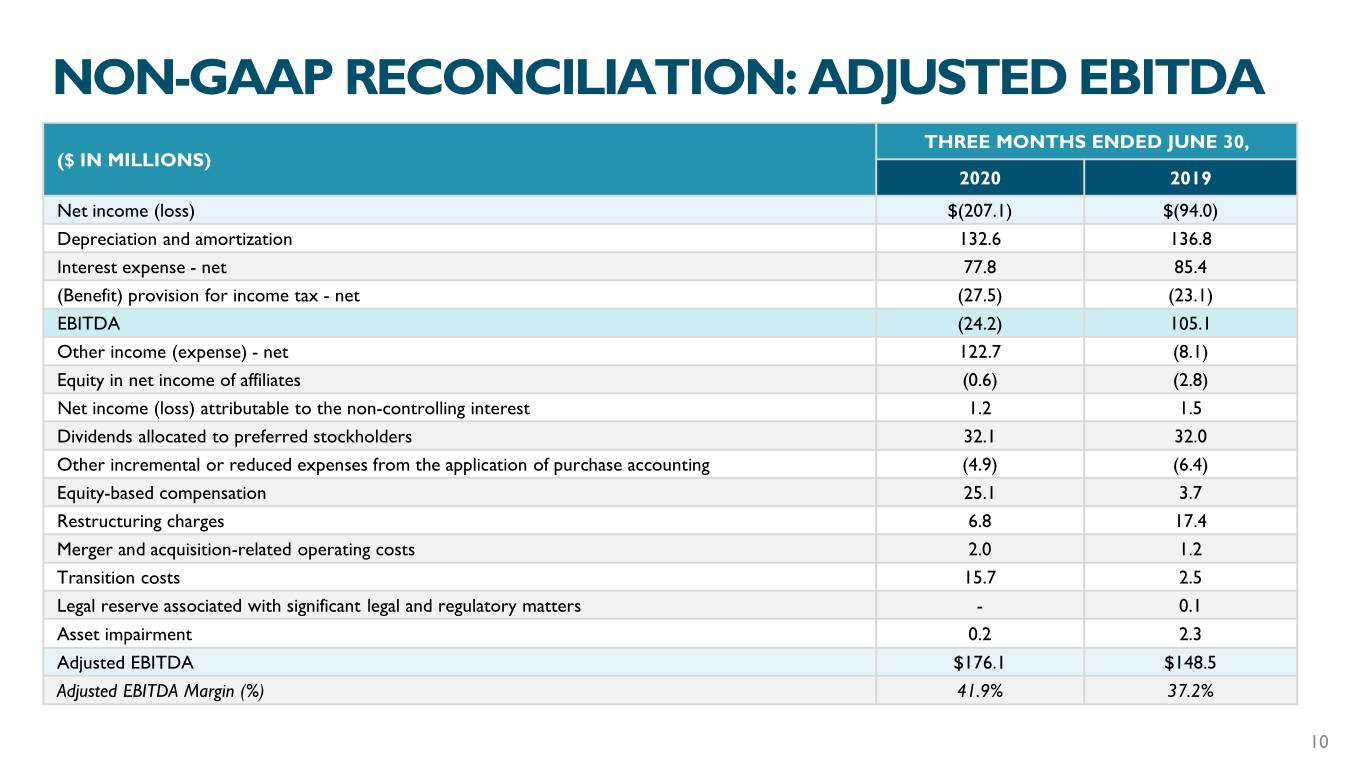
NON-GAAP RECONCILIATION: ADJUSTED EBITDA THREE MONTHS ENDED JUNE 30, ($ IN MILLIONS) 2020 2019 Net income (loss) $(207.1) $(94.0) Depreciation and amortization 132.6 136.8 Interest expense - net 77.8 85.4 (Benefit) provision for income tax - net (27.5) (23.1) EBITDA (24.2) 105.1 Other income (expense) - net 122.7 (8.1) Equity in net income of affiliates (0.6) (2.8) Net income (loss) attributable to the non-controlling interest 1.2 1.5 Dividends allocated to preferred stockholders 32.1 32.0 Other incremental or reduced expenses from the application of purchase accounting (4.9) (6.4) Equity-based compensation 25.1 3.7 Restructuring charges 6.8 17.4 Merger and acquisition-related operating costs 2.0 1.2 Transition costs 15.7 2.5 Legal reserve associated with significant legal and regulatory matters - 0.1 Asset impairment 0.2 2.3 Adjusted EBITDA $176.1 $148.5 Adjusted EBITDA Margin (%) 41.9% 37.2% 10

NON-GAAP RECONCILIATION: ADJUSTED NET INCOME THREE MONTHS ENDED JUNE 30, ($ IN MILLIONS, EXCEPT PER SHARE DATA) 2020 2019 Net income (loss) $(207.1) $(94.0) Incremental amortization of intangible assets resulting from the application of purchase accounting 117.6 123.4 Other incremental or reduced expenses from the application of purchase accounting (4.9) (6.4) Equity-based compensation 25.1 3.7 Restructuring charges 6.8 17.4 Merger and acquisition-related operating costs 2.0 1.2 Transition costs 15.7 2.5 Legal reserve and costs associated with significant legal and regulatory matters - 0.1 Change in fair value of make-whole derivative liability associated with the Series A Preferred Stock 102.6 - Asset impairment 0.2 2.3 Dividends allocated to preferred stockholders 32.1 32.0 Debt extinguishment / refinancing costs 41.3 - Tax impact of the CARES Act 1.9 - Tax effect of the non-GAAP adjustments (51.7) (37.5) Adjusted net income (loss) attributable to Dun & Bradstreet Holdings, Inc. (a) $81.6 $44.7 Adjusted diluted earnings (loss) per share of common stock $0.26 $0.14 Weighted average number of shares outstanding – diluted 314.5 314.5 (a) Including impact of deferred revenue purchase accounting adjustments: Pre-tax impact $(2.1) $(38.0) Tax impact 0.5 8.2 Net impact to adj. net income (loss) attrib. to Dun & Bradstreet Holdings, Inc. $(1.6) $(29.8) 11
