Attached files
| file | filename |
|---|---|
| 8-K - 8-K - KANSAS CITY SOUTHERN | ksu-20200804.htm |
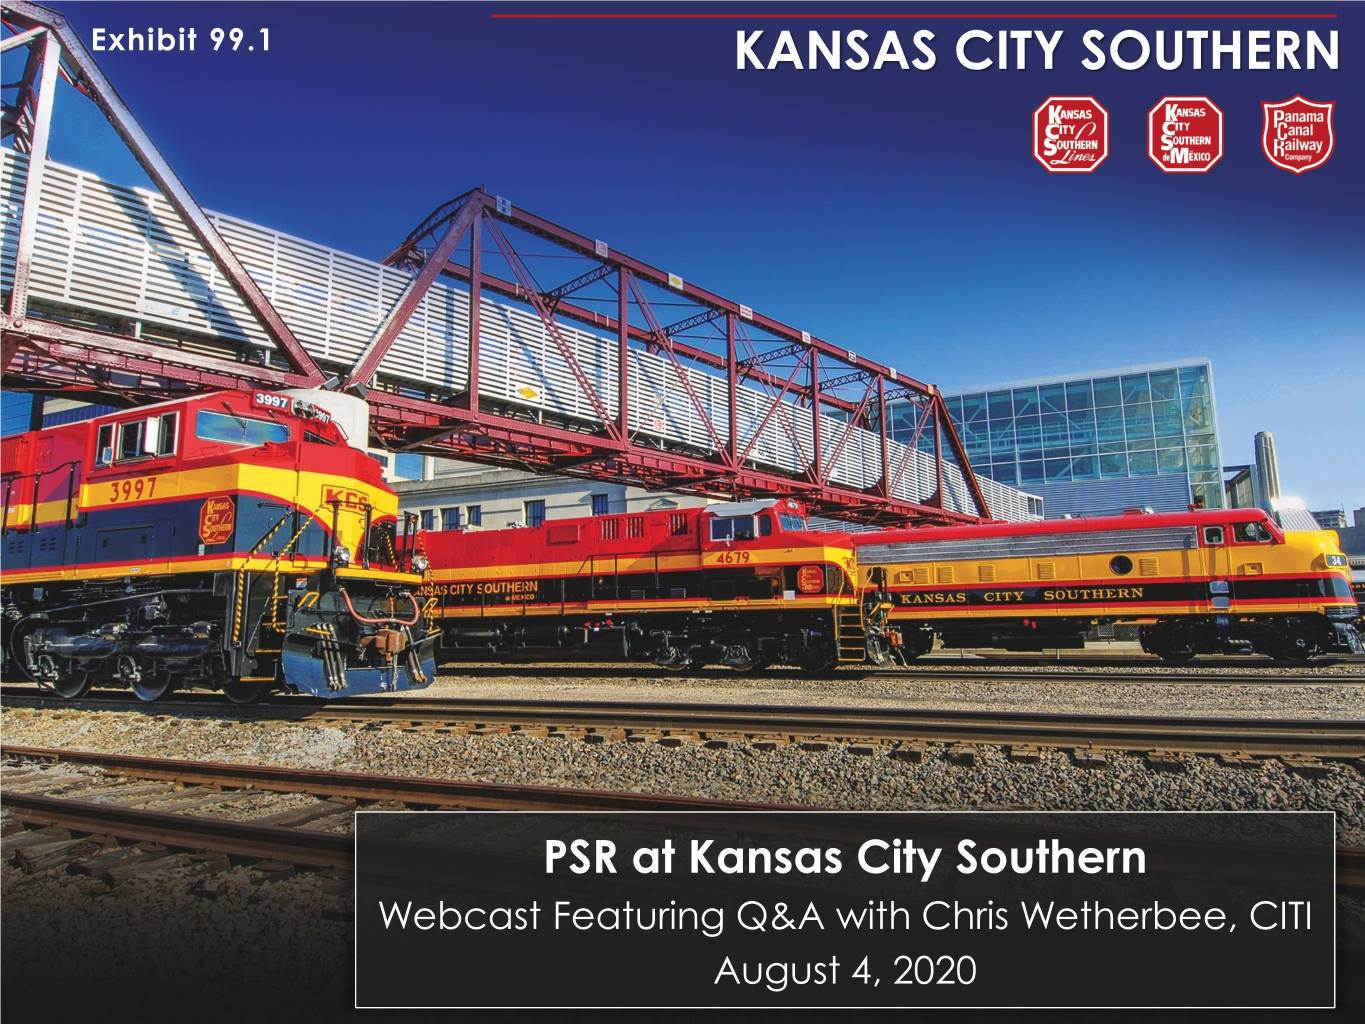
Exhibit 99.1 KANSAS CITY SOUTHERN PSR at Kansas City Southern Webcast Featuring Q&A with Chris Wetherbee, CITI © KANSAS © KANSAS CITY SOUTHERN KCS August 4, 2020
Safe Harbor Statement This presentation contains forward-looking statements within the meaning of Section 27A of the Securities Act of 1933, as amended, Section 21E of the Securities Exchange Act of 1934, as amended and the Private Securities Litigation Reform Act of 1995. In addition, management may make forward-looking statements orally or in other writing, including, but not limited to, in press releases, quarterly earnings calls, executive presentations, in the annual report to stockholders and in other filings with the Securities and Exchange Commission. Readers can usually identify these forward-looking statements by the use of such words as "may," "will," "should," "likely," "plans," "projects," "expects," "anticipates," "believes" or similar words. These statements involve a number of risks and uncertainties. Actual results could materially differ from those anticipated by such forward-looking statements as a result of a number of factors or combination of factors including, but not limited: public health threats or outbreaks of communicable diseases, such as the ongoing COVID-19 pandemic and its impact on KCS’s business, suppliers, consumers, customers, employees and supply chains; rail accidents or other incidents or accidents on KCS’s rail network or at KCS’s facilities or customer facilities involving the release of hazardous materials, including toxic inhalation hazards; legislative and regulatory developments and disputes, including environmental regulations; loss of the rail concession of Kansas City Southern’s subsidiary, Kansas City Southern de México, S.A. de C.V.; domestic and international economic, political and social conditions; disruptions to the Company’s technology infrastructure, including its computer systems; increased demand and traffic congestion; the level of trade between the United States and Asia or Mexico; fluctuations in the peso-dollar exchange rate; natural events such as severe weather, hurricanes and floods; the outcome of claims and litigation involving the Company or its subsidiaries; competition and consolidation within the transportation industry; the business environment in industries that produce and use items shipped by rail; the termination of, or failure to renew, agreements with customers, other railroads and third parties; fluctuation in prices or availability of key materials, in particular diesel fuel; access to capital; climate change and the market and regulatory responses to climate change; dependency on certain key suppliers of core rail equipment; changes in securities and capital markets; unavailability of qualified personnel; labor difficulties, including strikes and work stoppages; acts of terrorism or risk of terrorist activities, war or other acts of violence; and other factors affecting the operation of the business; and other risks identified in this presentation, in KCS's Annual Report on Form 10-K for the year ended December 31, 2019, and in other reports filed by KCS with the Securities and Exchange Commission. Forward-looking statements reflect the information only as of the date on which they are made. KCS does not undertake any obligation to update any forward-looking statements to reflect future events, developments, or other information. Reconciliation to U.S. GAAP Financial Information In addition to disclosing financial results in accordance with U.S. GAAP, the accompanying presentation contains non-GAAP financial measures. These non-GAAP measures should be viewed as a supplement to and not a substitute for our U.S. GAAP measures of performance and liquidity, and the financial results calculated in accordance with U.S. GAAP and reconciliations from these results should be carefully evaluated. All reconciliations to the most directly comparable financial measures calculated and presented in accordance with U.S. GAAP can be found on the KCS's website in the Investors section. © KANSAS © KANSAS CITY SOUTHERN KCS 2
Presenters & Agenda . Welcome & Introductions . PSR Initiatives – Network Operations & Performance Metrics – Service Design & Border Operations – Operations Decision Support – Fuel Conservation – Equipment Utilization – Mechanical – Engineering – PSR Dashboard & Scorecard . PSR at KCS: Future-State with Sameh Fahmy . Fireside Chat with Chris Wetherbee, CITI Transportation Analyst © KANSAS © KANSAS CITY SOUTHERN KCS 3

Key Messages . Cross-functional team has developed and implemented PSR initiatives that cover all aspects of KCS operations . Structural changes made to operations during Q220 will provide lasting benefit to cost structure . Uncovering new opportunities to improve network efficiencies, customer service and cost structure . KCS’ implementation of PSR is unique and driving strong results – We are focused on a true balance between growth, customer service, reliability and asset/cost optimization © KANSAS © KANSAS CITY SOUTHERN KCS 4
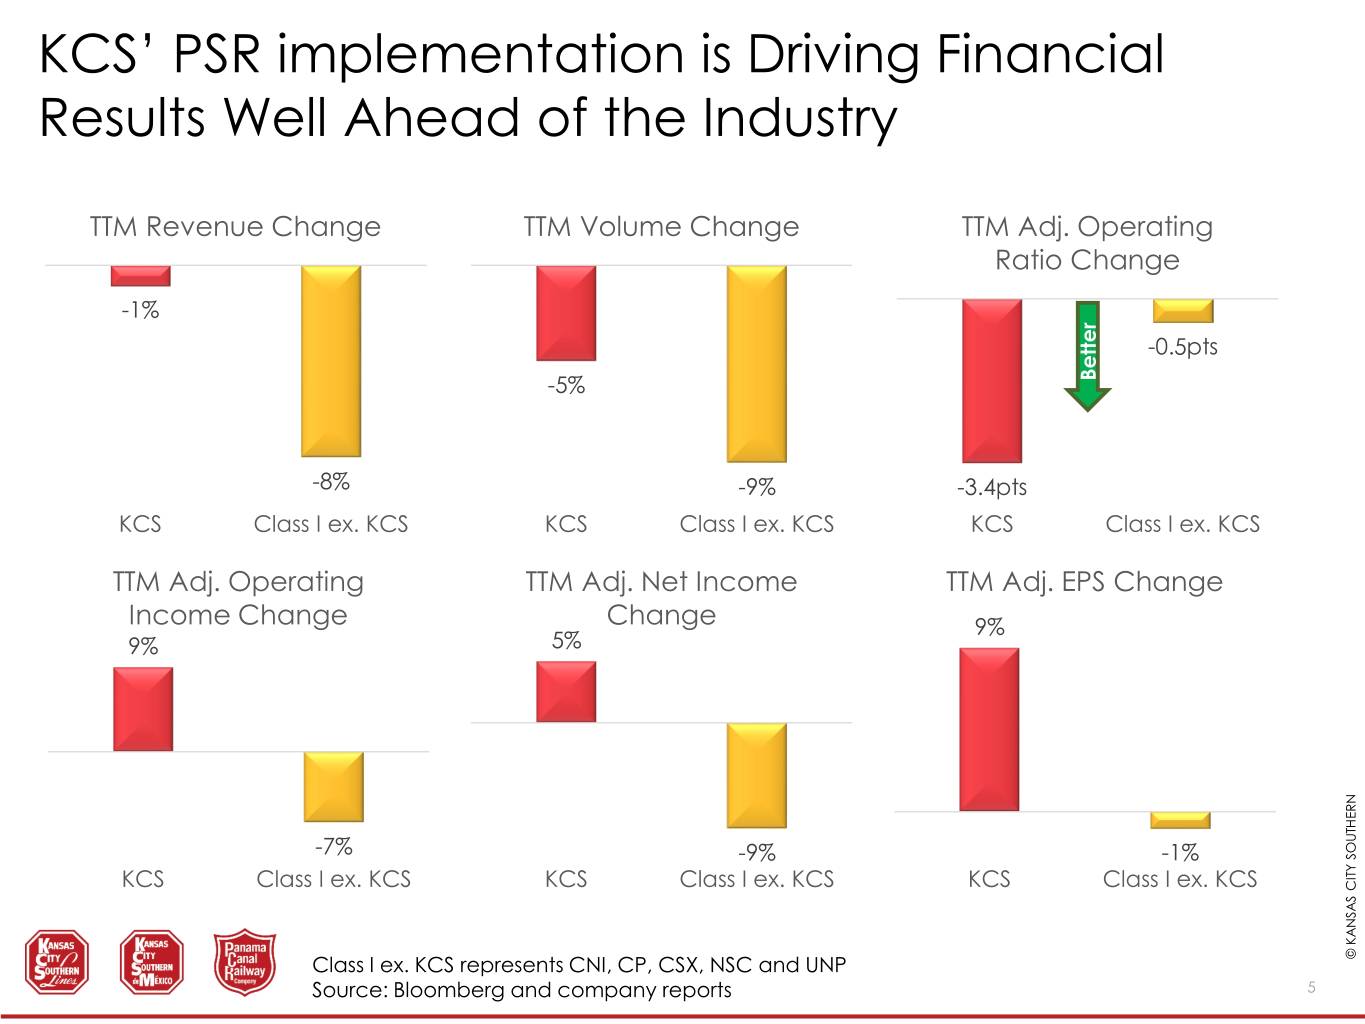
KCS’ PSR implementation is Driving Financial Results Well Ahead of the Industry TTM Revenue Change TTM Volume Change TTM Adj. Operating Ratio Change -1% -0.5pts -5% Better -8% -9% -3.4pts KCS Class I ex. KCS KCS Class I ex. KCS KCS Class I ex. KCS TTM Adj. Operating TTM Adj. Net Income TTM Adj. EPS Change Income Change Change 9% 9% 5% -7% -9% -1% KCS Class I ex. KCS KCS Class I ex. KCS KCS Class I ex. KCS Class I ex. KCS represents CNI, CP, CSX, NSC and UNP © KANSAS CITY SOUTHERN KCS Source: Bloomberg and company reports 5
NETWORK OPERATIONS & PERFORMANCE METRICS STEVE TRUITT, VP AND CHIEF TRANSPORTATION OFFICER DAVID EATON, DIRECCIÓN EJECUTIVA DE OPERACIONES ERWIN BERNAL, SUBDIR. CENTRO DE CONTROL Y OPERACIONES TIM LIVINGSTON, GENERAL MANAGER NOC & RESOURCE PLANNING NICOLAS KLEIN, SUPERINTENDENT NETWORK OPERATIONS © KANSAS CITY SOUTHERN KCS 6
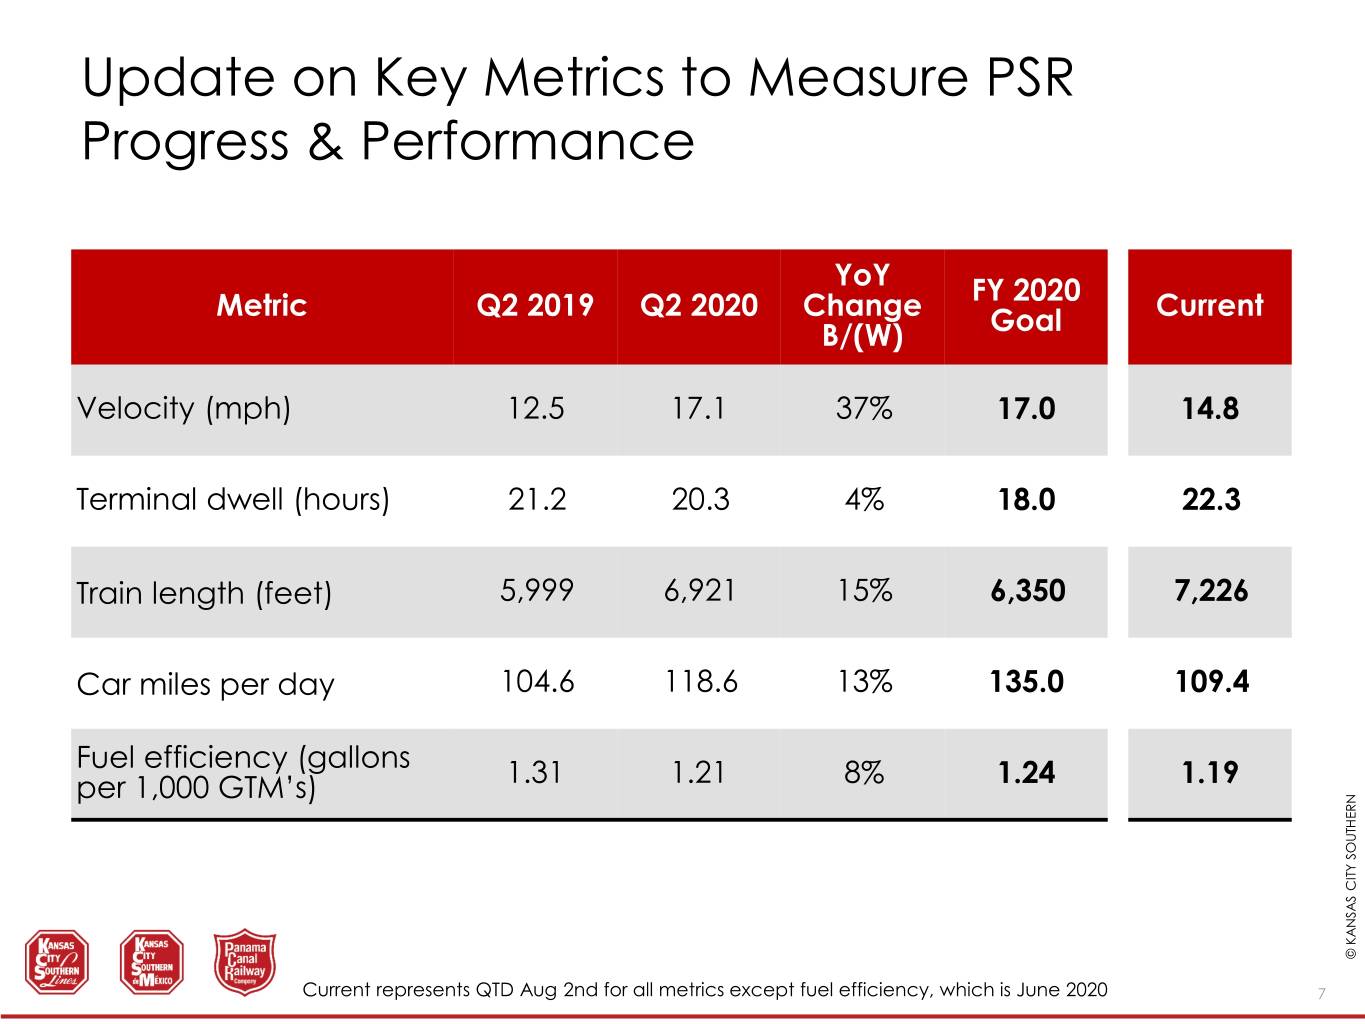
Update on Key Metrics to Measure PSR Progress & Performance YoY FY 2020 Metric Q2 2019 Q2 2020 Change Current B/(W) Goal Velocity (mph) 12.5 17.1 37% 17.0 14.8 Terminal dwell (hours) 21.2 20.3 4% 18.0 22.3 Train length (feet) 5,999 6,921 15% 6,350 7,226 Car miles per day 104.6 118.6 13% 135.0 109.4 Fuel efficiency (gallons 1.31 1.21 8% per 1,000 GTM’s) 1.24 1.19 © KANSAS © KANSAS CITY SOUTHERN KCS Current represents QTD Aug 2nd for all metrics except fuel efficiency, which is June 2020 7

PSR Initiatives are Delivering Superior Dwell and Velocity Performance Indexed Velocity Performance Since Q418 First Week of October 2018 = 1.00 1.9 1.8 1.7 1.6 1.5 1.4 1.3 1.2 1.1 1 0.9 KCS Industry Excluding KCS Indexed Dwell Performance Since Q418 First Week of October 2018 = 1.00 1.15 1.10 1.05 Better 1.00 0.95 0.90 0.85 0.80 0.75 0.70 0.65 © KANSAS © KANSAS CITY SOUTHERN Class I ex. KCS represents CNI, CP, CSX, NSC and UNP KCS Industry Excluding KCS 8 Source: AssociationKCS of American Railroads

Monitoring the Health of the Network Investments in data analytics and dashboards facilitate real-time monitoring of the health and performance of our network . Early a.m. dashboard review lays groundwork for productive morning ops calls, trouble-shooting & rapid response . Data facilitates route-cause analysis and helps us ‘peel the onion’ Late Trains Dashboard Gross Velocity Dashboard Used for daily identification late trains and Used for daily identification of worst problem areas across the network performing trains on the network © KANSAS © KANSAS CITY SOUTHERN KCS 9
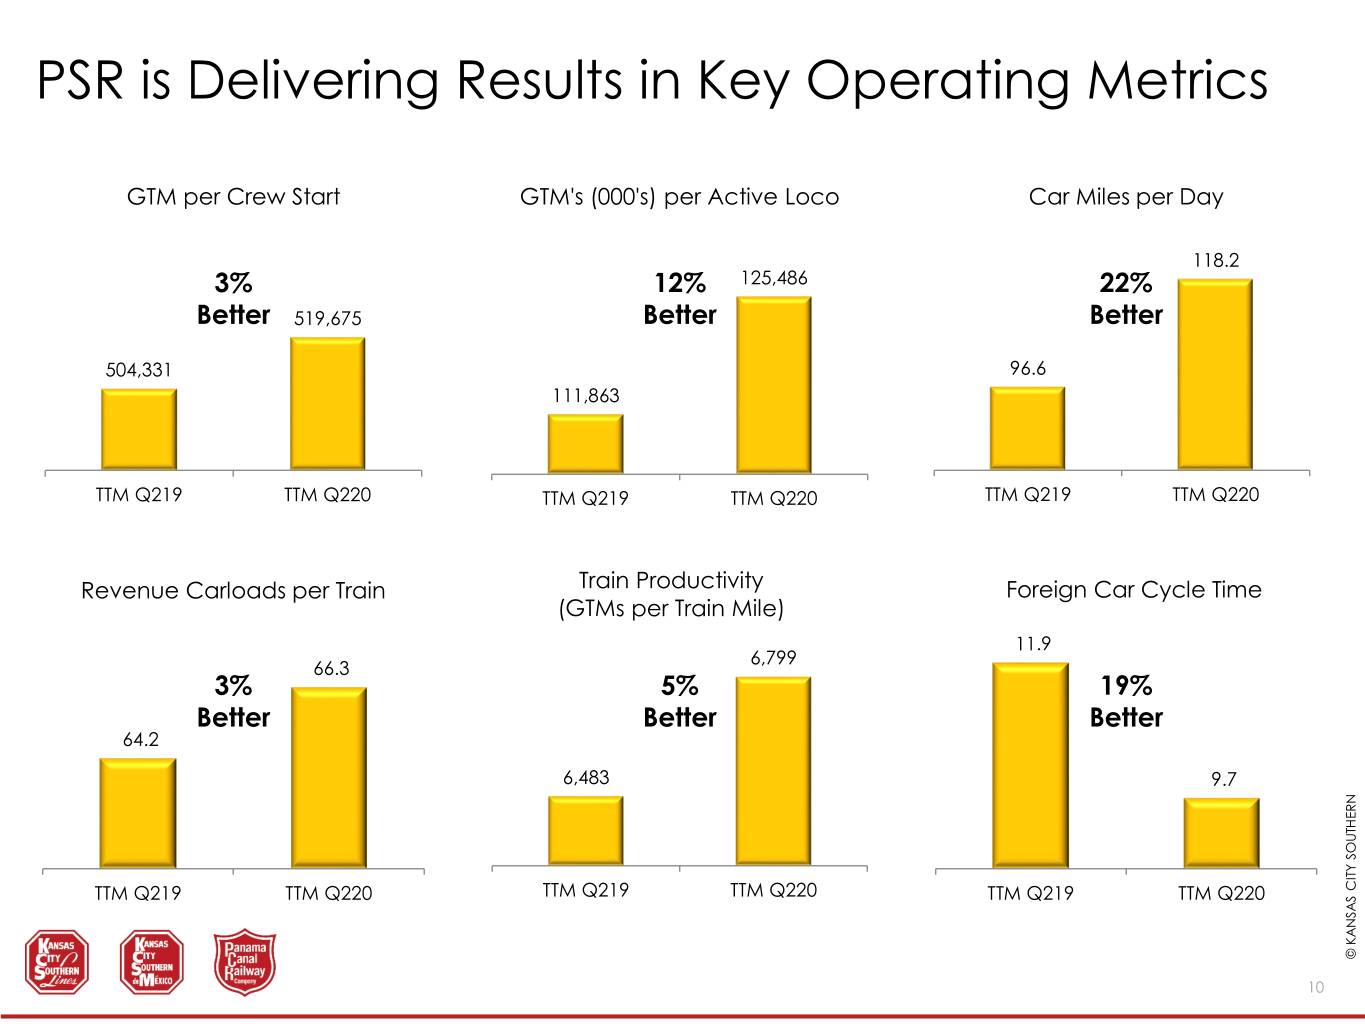
PSR is Delivering Results in Key Operating Metrics GTM per Crew Start GTM's (000's) per Active Loco Car Miles per Day 118.2 3% 12% 125,486 22% Better 519,675 Better Better 504,331 96.6 111,863 TTM Q219 TTM Q220 TTM Q219 TTM Q220 TTM Q219 TTM Q220 Revenue Carloads per Train Train Productivity Foreign Car Cycle Time (GTMs per Train Mile) 11.9 6,799 66.3 3% 5% 19% Better Better Better 64.2 6,483 9.7 TTM Q219 TTM Q220 TTM Q219 TTM Q220 TTM Q219 TTM Q220 © KANSAS © KANSAS CITY SOUTHERN KCS 10
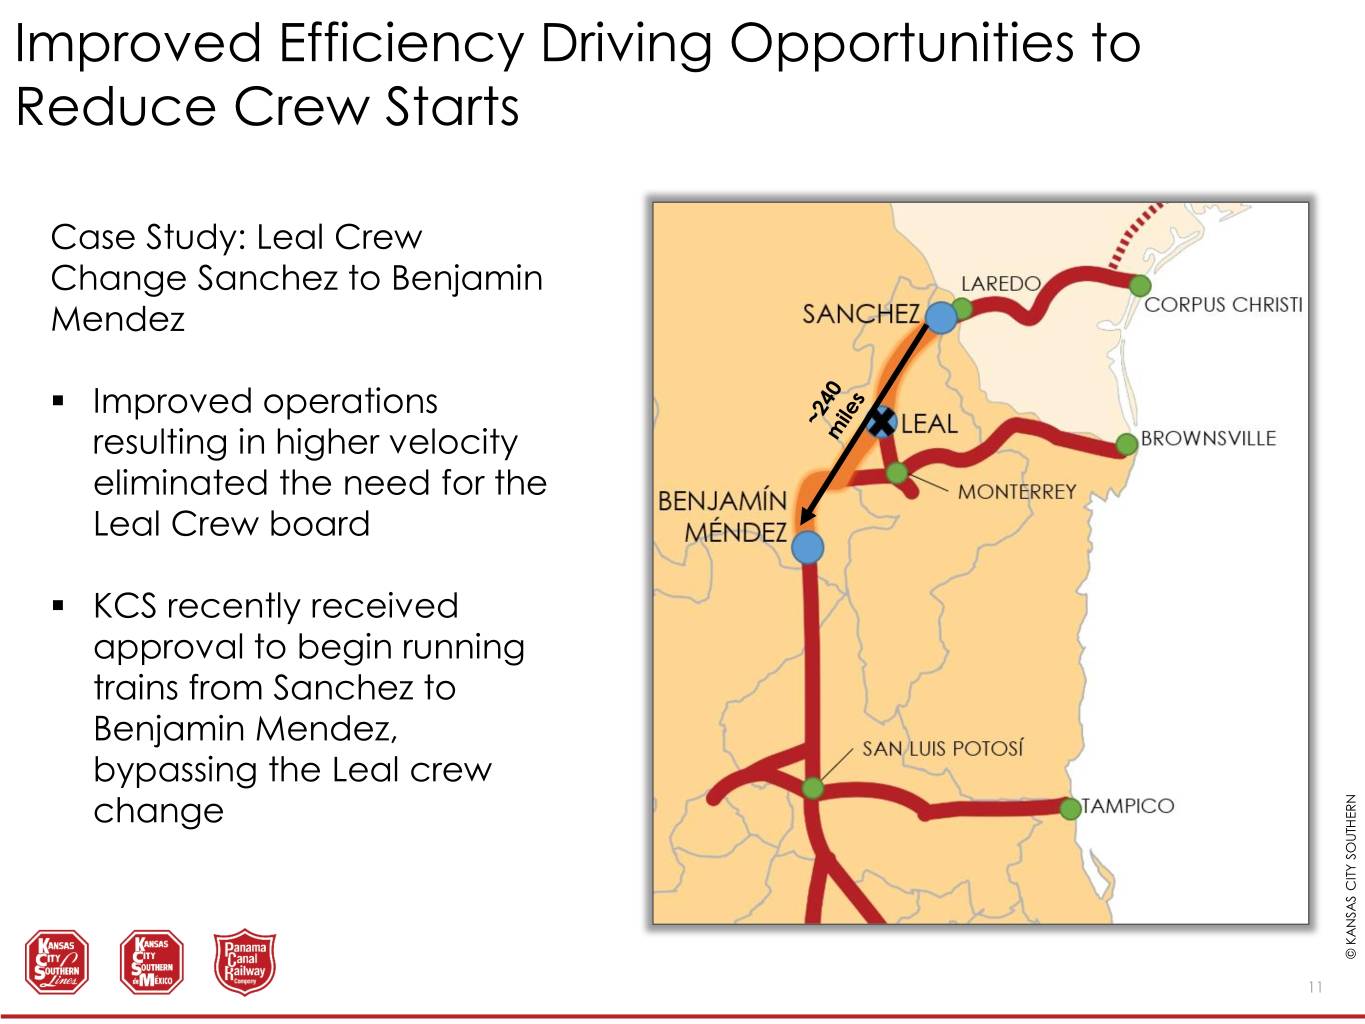
Improved Efficiency Driving Opportunities to Reduce Crew Starts Case Study: Leal Crew Change Sanchez to Benjamin Mendez . Improved operations resulting in higher velocity eliminated the need for the Leal Crew board . KCS recently received approval to begin running trains from Sanchez to Benjamin Mendez, bypassing the Leal crew change © KANSAS © KANSAS CITY SOUTHERN KCS 11

Locomotive Fleet Management U.S. Daily Available Horsepower 1.2 180 PSR initiatives and a 170 culture of excellence 1.1 160 are driving improved 1.0 150 performance of key 0.9 140 assets 0.8 130 0.7 120 . Available horsepower Available Available Horsepower (millions) 0.6 110 GTM perAvailable Horsepower has moved with Jan-20 Feb-20 Mar-20 Apr-20 May-20 Jun-20 Jul-20 volumes Available Horsepower GTM per Available Horsepower Mexico Daily Available Horsepower . Efficient use of 1.4 98 96 horsepower has 1.3 94 improved +20% and is 1.2 92 at record highs 1.1 90 1.0 88 86 0.9 84 0.8 82 Available Available Horsepower (millions) 0.7 80 GTM perAvailable Horsepower Jan-20 Feb-20 Mar-20 Apr-20 May-20 Jun-20 Jul-20 © KANSAS © KANSAS CITY SOUTHERN KCS Available Horsepower GTM per Available Horsepower 12
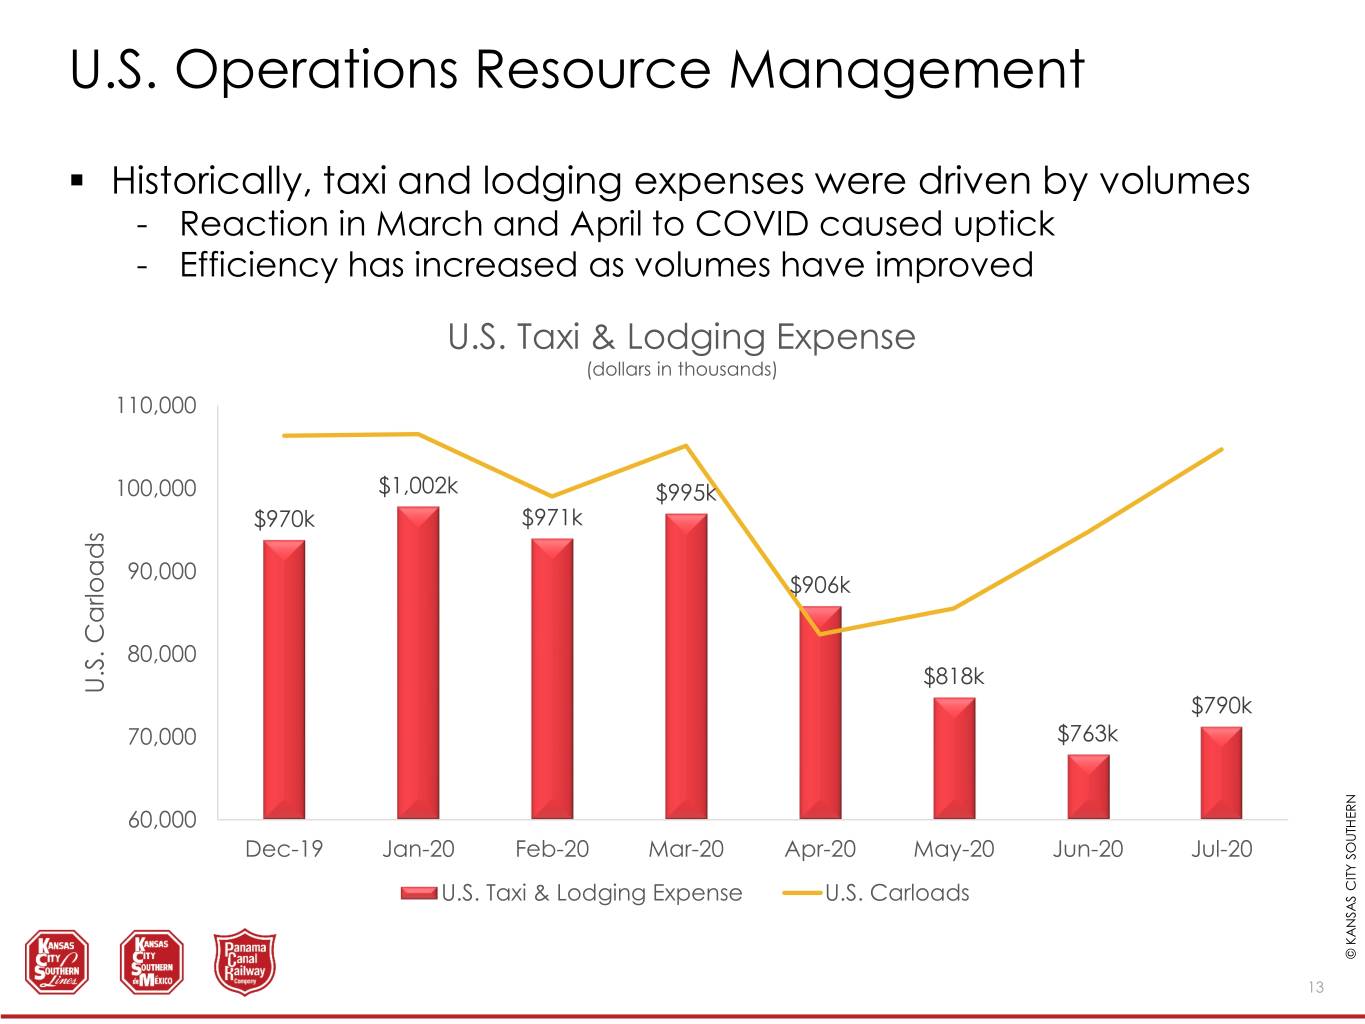
U.S. Operations Resource Management . Historically, taxi and lodging expenses were driven by volumes - Reaction in March and April to COVID caused uptick - Efficiency has increased as volumes have improved U.S. Taxi & Lodging Expense (dollars in thousands) 110,000 100,000 $1,002k $995k $970k $971k 90,000 $906k 80,000 $818k U.S. CarloadsU.S. $790k 70,000 $763k 60,000 Dec-19 Jan-20 Feb-20 Mar-20 Apr-20 May-20 Jun-20 Jul-20 U.S. Taxi & Lodging Expense U.S. Carloads © KANSAS © KANSAS CITY SOUTHERN KCS 13

SERVICE DESIGN OLIVIA DAILY, VP PURCHASING © KANSAS CITY SOUTHERN KCS 14

Service Design Improvements Driving Longer Trains While Maintaining Customer Service Levels . Train start plans were rapidly adjusted during COVID downturn in Q220 . The service design team is working to maintain longer trains through T.S.P. modifications as volumes improve, while keeping trip plan compliance top of mind M-KCSH / M-SHKC Example Pre-Covid . 28 train starts per week . 2x per day each direction . 6 mo. avg. train Length: 6,694’ TSP Change . 17 train starts per week . 10x week South up to 10K’ . 1x day North up to 15K’ . Train length up > 40% © KANSAS © KANSAS CITY SOUTHERN KCS 15

BORDER CAPACITY MIKE WALCZAK, VP NETWORK PLANNING & FINANCE © KANSAS CITY SOUTHERN KCS 16

Border Windows Strategy Current State: Four, 6-hour windows per day alternating between north and southbound fleeting Future State: Trains are dispatched as they arrive at the border. Faster and more consistent transit expected to result in: . Improved customer service . Improved border security . Expansion of trade . Increased border capacity . Improved asset & resource utilization © KANSAS © KANSAS CITY SOUTHERN KCS 17
OPERATIONS DECISION SUPPORT ANASTASIA AUSTIN, VP REVENUE & YIELD MANAGEMENT © KANSAS CITY SOUTHERN KCS 18
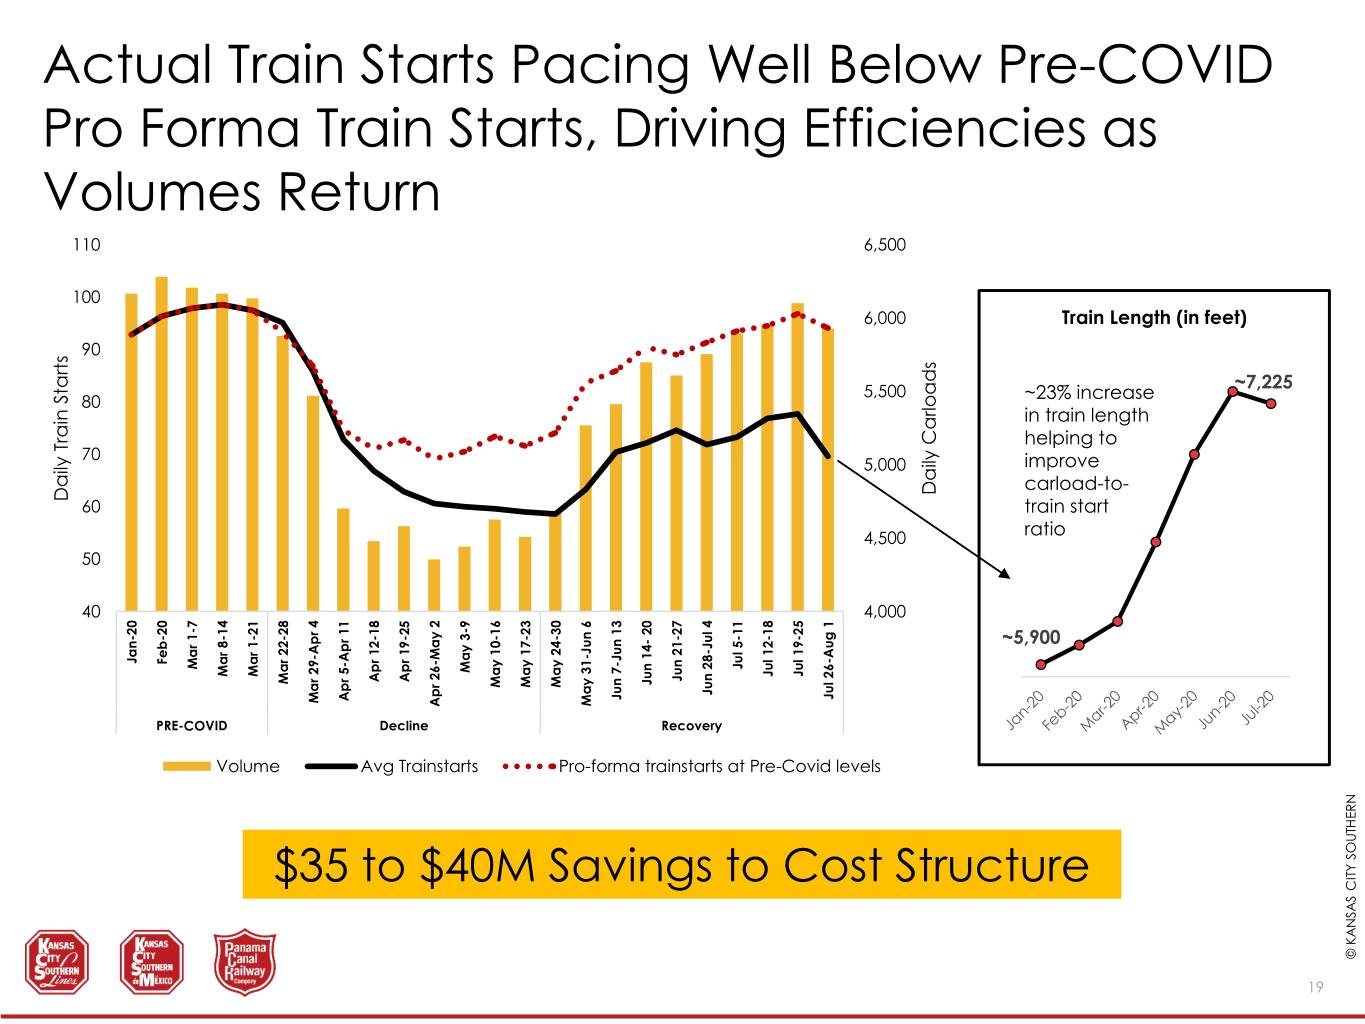
Actual Train Starts Pacing Well Below Pre-COVID Pro Forma Train Starts, Driving Efficiencies as Volumes Return 110 6,500 100 6,000 Train Length (in feet) 90 5,500 ~7,225 80 ~23% increase in train length helping to 70 5,000 improve carload-to- DailyCarloads DailyTrain Starts 60 train start 4,500 ratio 50 40 4,000 ~5,900 Jan-20 Feb-20 Mar1-7 Jul5-11 May3-9 Mar8-14 Mar1-21 Jul12-18 Jul19-25 Jun21-27 Apr 12-18 Apr 19-25 Mar22-28 Jun14- 20 May10-16 May17-23 May24-30 Jun28-Jul 4 Jul26-Aug 1 Jun7-Jun 13 Apr 5-Apr 11 Mar29-Apr 4 May31-Jun 6 Apr 26-May 2 PRE-COVID Decline Recovery Volume Avg Trainstarts Pro-forma trainstarts at Pre-Covid levels $35 to $40M Savings to Cost Structure © KANSAS © KANSAS CITY SOUTHERN KCS 19

Train Start Strategy Varies With Traffic Type Daily Carloads vs. Train Starts Daily Train Starts Daily Carloads 6,500 6,000 5,500 99 97 97 5,000 93 DailyCarloads 74 4,500 69 70 59 4,000 2019 Jan-20 Feb-20 Mar-20 Apr-20 May-20 Jun-20 Jul-20 Review opportunities to Balancing efficiencies with transit -Origin/Destination capacity consolidate or grow to capacity sensitive traffic/customers -Empty return optimization 43.4 33.0 Manifest 30.2 Intermodal & Automotive 27.0 Unit 40.5 27.3 28.0 24.2 36.1 23.0 21.6 21.5 21.1 32.9 32.4 17.6 20.4 31.7 18.0 30.7 19.1 19.5 29.7 18.3 18.5 29.0 13.6 12.6 12.1 17.3 13.0 17.1 8.0 2019 1Q Apr 1H 2H 1H 2H 1H 2H 2019 1Q Apr 1H 2H 1H 2H 1H 2H 2019 1Q Apr 1H 2H 1H 2H 1H 2H FY 2020 2020 May May June June July July FY 2020 2020 May May June June July July FY 2020 2020 May May June June July July © KANSAS © KANSAS CITY SOUTHERN KCS 20
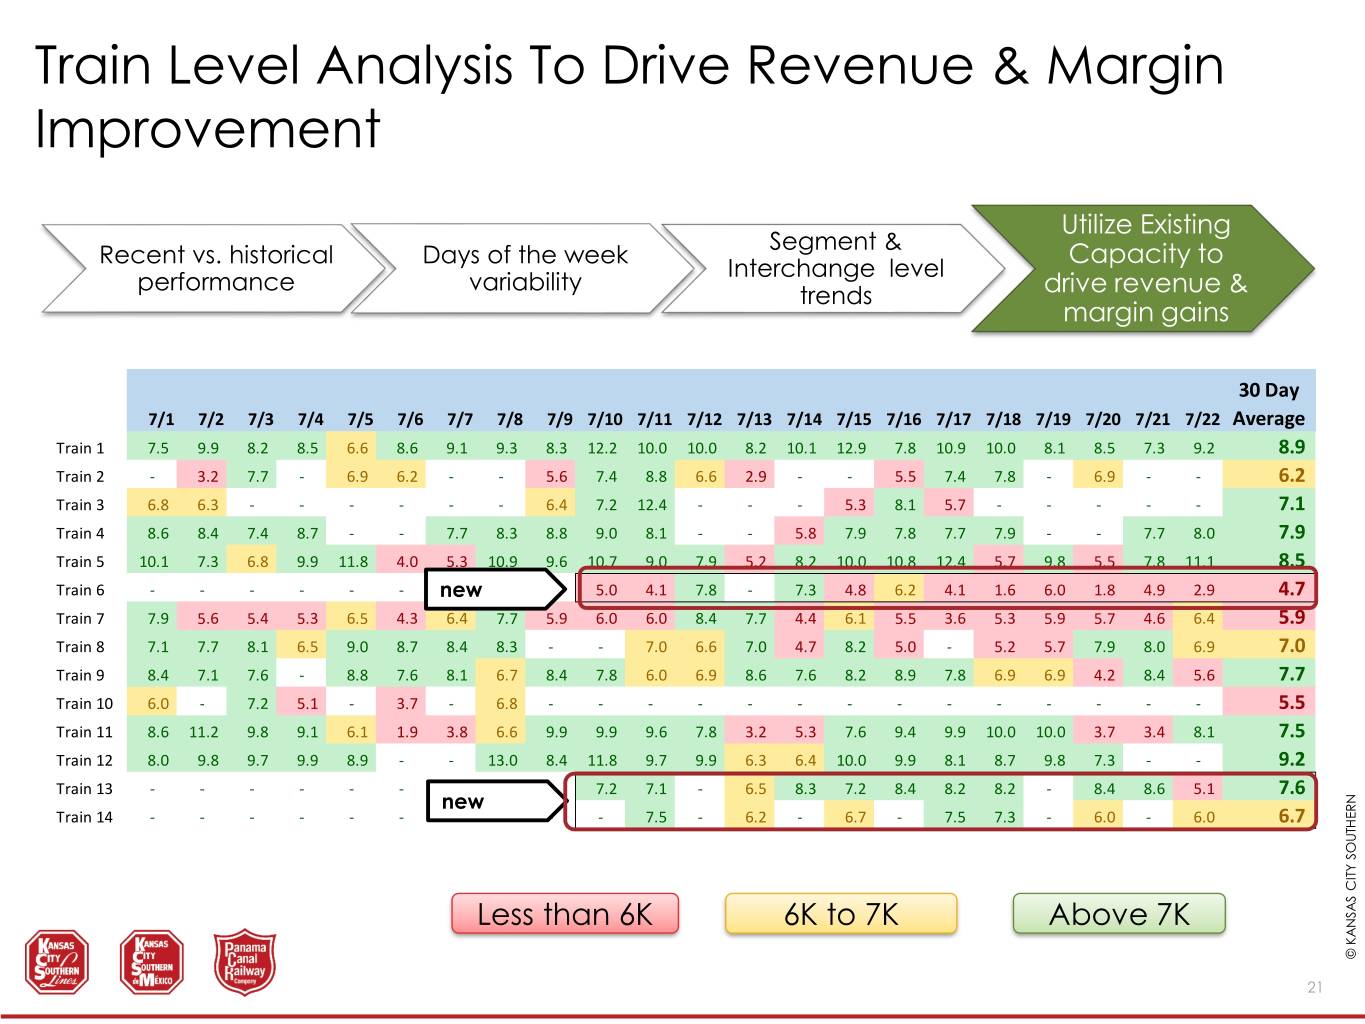
Train Level Analysis To Drive Revenue & Margin Improvement Utilize Existing Segment & Recent vs. historical Days of the week Capacity to Interchange level performance variability trends drive revenue & margin gains 30 Day 7/1 7/2 7/3 7/4 7/5 7/6 7/7 7/8 7/9 7/10 7/11 7/12 7/13 7/14 7/15 7/16 7/17 7/18 7/19 7/20 7/21 7/22 Average Train 1 7.5 9.9 8.2 8.5 6.6 8.6 9.1 9.3 8.3 12.2 10.0 10.0 8.2 10.1 12.9 7.8 10.9 10.0 8.1 8.5 7.3 9.2 8.9 Train 2 - 3.2 7.7 - 6.9 6.2 - - 5.6 7.4 8.8 6.6 2.9 - - 5.5 7.4 7.8 - 6.9 - - 6.2 Train 3 6.8 6.3 - - - - - - 6.4 7.2 12.4 - - - 5.3 8.1 5.7 - - - - - 7.1 Train 4 8.6 8.4 7.4 8.7 - - 7.7 8.3 8.8 9.0 8.1 - - 5.8 7.9 7.8 7.7 7.9 - - 7.7 8.0 7.9 Train 5 10.1 7.3 6.8 9.9 11.8 4.0 5.3 10.9 9.6 10.7 9.0 7.9 5.2 8.2 10.0 10.8 12.4 5.7 9.8 5.5 7.8 11.1 8.5 Train 6 - - - - - - new- - - 5.0 4.1 7.8 - 7.3 4.8 6.2 4.1 1.6 6.0 1.8 4.9 2.9 4.7 Train 7 7.9 5.6 5.4 5.3 6.5 4.3 6.4 7.7 5.9 6.0 6.0 8.4 7.7 4.4 6.1 5.5 3.6 5.3 5.9 5.7 4.6 6.4 5.9 Train 8 7.1 7.7 8.1 6.5 9.0 8.7 8.4 8.3 - - 7.0 6.6 7.0 4.7 8.2 5.0 - 5.2 5.7 7.9 8.0 6.9 7.0 Train 9 8.4 7.1 7.6 - 8.8 7.6 8.1 6.7 8.4 7.8 6.0 6.9 8.6 7.6 8.2 8.9 7.8 6.9 6.9 4.2 8.4 5.6 7.7 Train 10 6.0 - 7.2 5.1 - 3.7 - 6.8 - - - - - - - - - - - - - - 5.5 Train 11 8.6 11.2 9.8 9.1 6.1 1.9 3.8 6.6 9.9 9.9 9.6 7.8 3.2 5.3 7.6 9.4 9.9 10.0 10.0 3.7 3.4 8.1 7.5 Train 12 8.0 9.8 9.7 9.9 8.9 - - 13.0 8.4 11.8 9.7 9.9 6.3 6.4 10.0 9.9 8.1 8.7 9.8 7.3 - - 9.2 Train 13 - - - - - - - - - 7.2 7.1 - 6.5 8.3 7.2 8.4 8.2 8.2 - 8.4 8.6 5.1 7.6 new Train 14 - - - - - - - - - - 7.5 - 6.2 - 6.7 - 7.5 7.3 - 6.0 - 6.0 6.7 Less than 6K 6K to 7K Above 7K © KANSAS © KANSAS CITY SOUTHERN KCS 21
FUEL CONSERVATION CHAD DEVENNEY, AVP OPERATING PRACTICES © KANSAS CITY SOUTHERN KCS 22
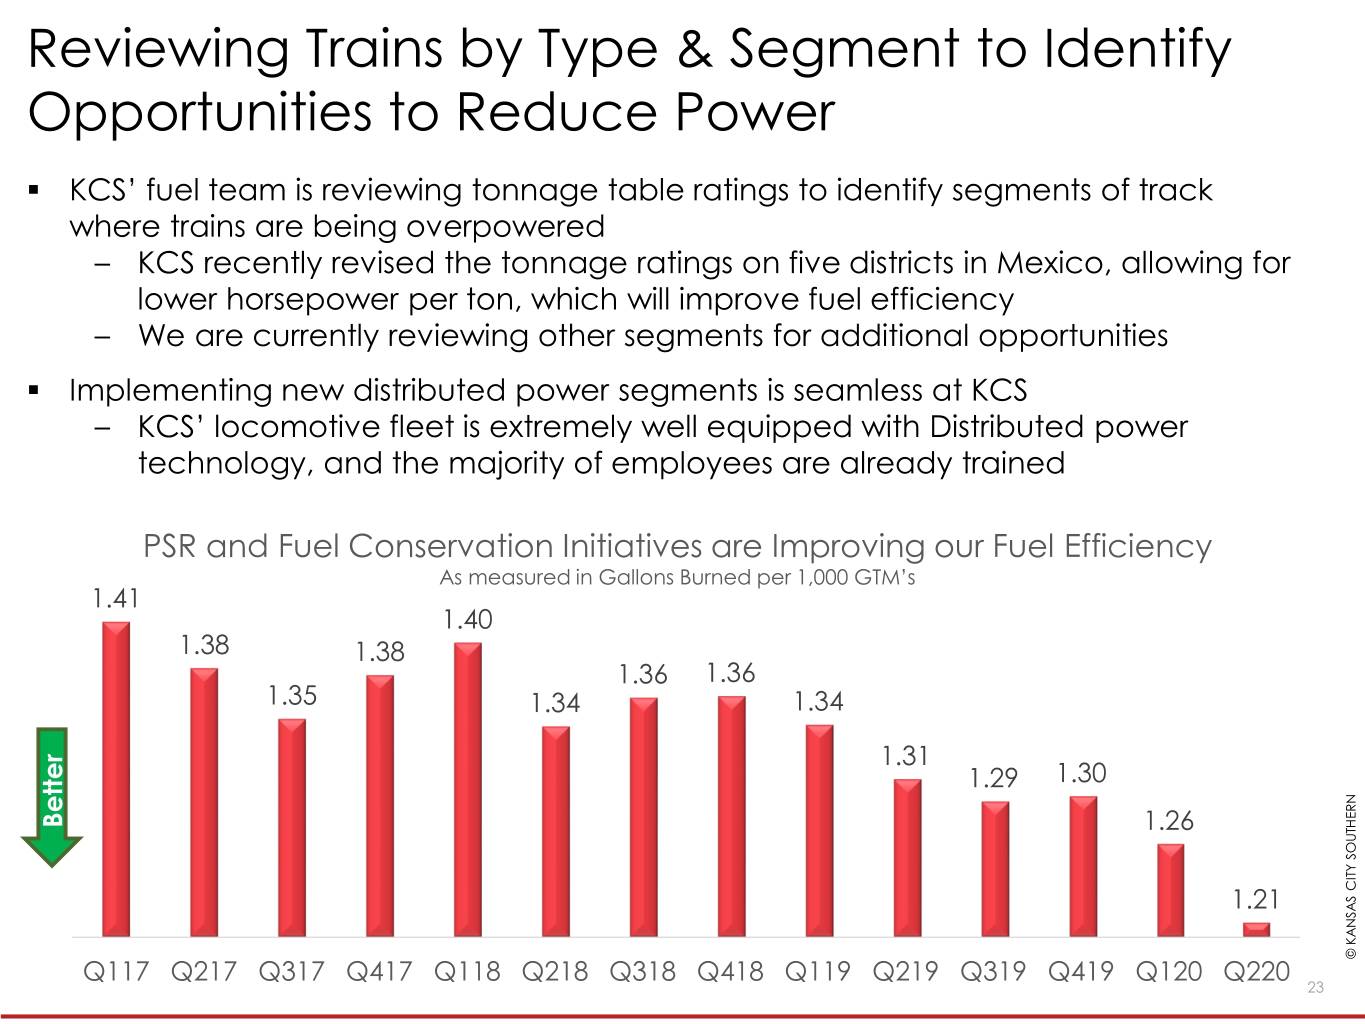
Reviewing Trains by Type & Segment to Identify Opportunities to Reduce Power . KCS’ fuel team is reviewing tonnage table ratings to identify segments of track where trains are being overpowered – KCS recently revised the tonnage ratings on five districts in Mexico, allowing for lower horsepower per ton, which will improve fuel efficiency – We are currently reviewing other segments for additional opportunities . Implementing new distributed power segments is seamless at KCS – KCS’ locomotive fleet is extremely well equipped with Distributed power technology, and the majority of employees are already trained PSR and Fuel Conservation Initiatives are Improving our Fuel Efficiency As measured in Gallons Burned per 1,000 GTM’s 1.41 1.40 1.38 1.38 1.36 1.36 1.35 1.34 1.34 1.31 1.29 1.30 Better 1.26 1.21 © KANSAS © KANSAS CITY SOUTHERN Q117 Q217 Q317 Q417 Q118 Q218 Q318 Q418 Q119 Q219 Q319 Q419 Q120 Q220 KCS 23

Case Study: Increased Train Tonnage Driving Improved Fuel Efficiency on Lazaro Trains Morelia to Lazaro Cardenas – 2018 Pre-PSR 16,000 2.80 14,000 Average Fuel 12,000 Efficiency Of 1.43 2.30 10,000 8,000 1.80 6,000 4,000 1.30 TrainTonnage (Bars) Fuel Fuel Efficiency(Dots) 2,000 0 0.80 Intermodal Manifest Chemical Morelia to Lazaro Cardenas – 2020 Post PSR 16,000 2.80 14,000 Average Fuel 12,000 Efficiency Of 1.20, 2.30 10,000 19% better than 2018 8,000 1.80 6,000 4,000 1.30 TrainTonnage (Bars) Fuel Fuel Efficiency(Dots) 2,000 0 0.80 Mixed Intermodal & Manifest Steel Chemical © KANSAS © KANSAS CITY SOUTHERN 24 Pre PSR data isK AugustCS and September 2018; Post PSR data is April and May 2020
EQUIPMENT UTILIZATION CARY TIPPINS, AVP INTERNATIONAL ASSET UTILIZATION © KANSAS CITY SOUTHERN KCS 25
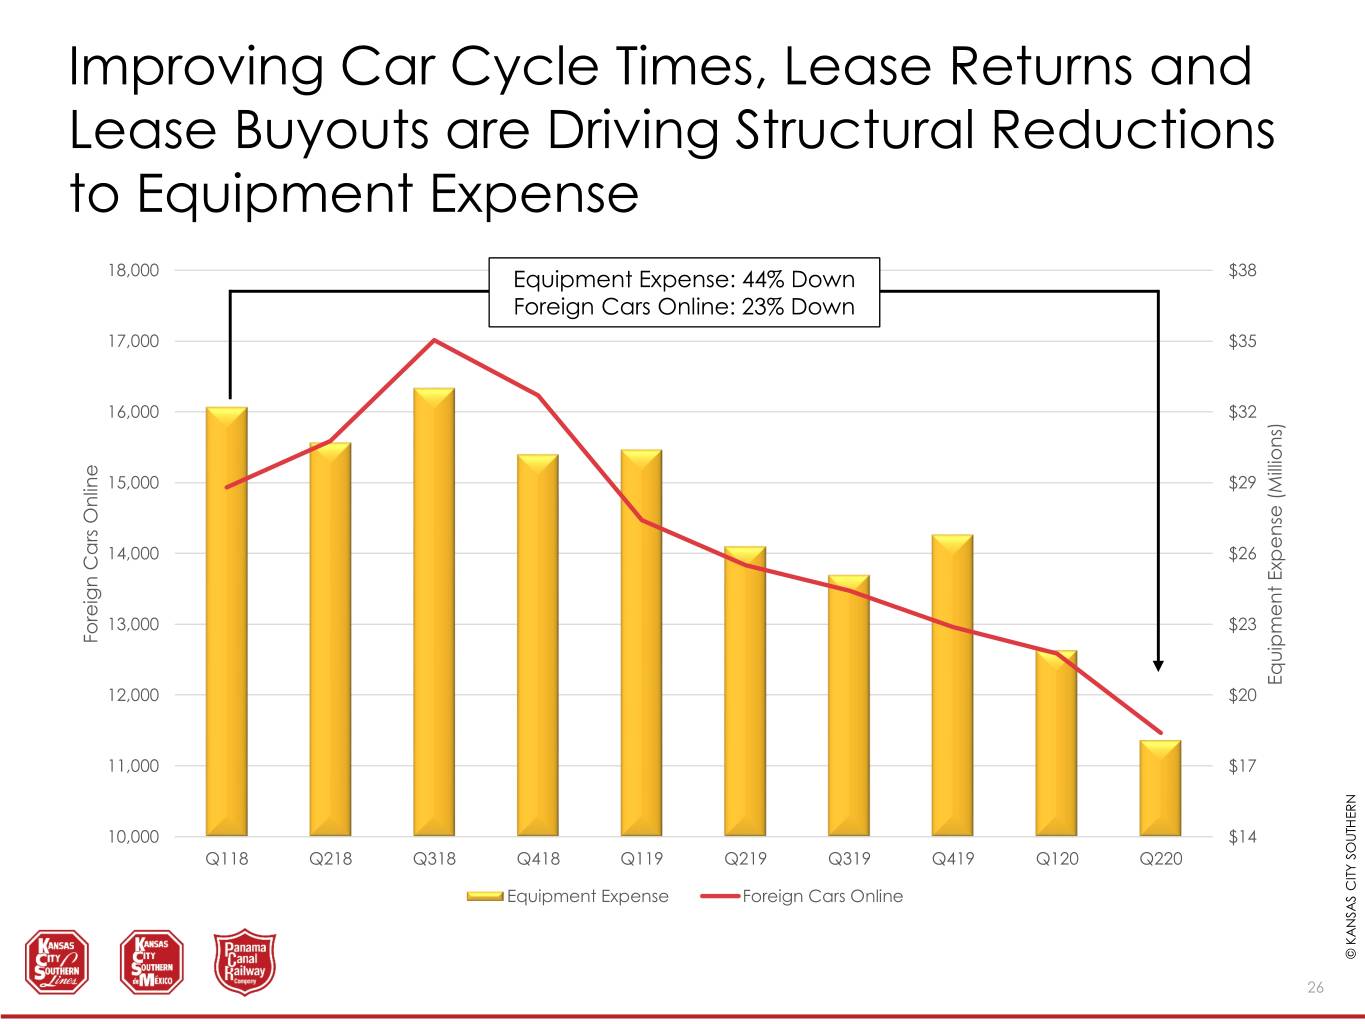
Improving Car Cycle Times, Lease Returns and Lease Buyouts are Driving Structural Reductions to Equipment Expense 18,000 Equipment Expense: 44% Down $38 Foreign Cars Online: 23% Down 17,000 $35 16,000 $32 15,000 $29 14,000 $26 13,000 $23 Foreign Cars Online EquipmentExpense (Millions) 12,000 $20 11,000 $17 10,000 $14 Q118 Q218 Q318 Q418 Q119 Q219 Q319 Q419 Q120 Q220 Equipment Expense Foreign Cars Online © KANSAS © KANSAS CITY SOUTHERN KCS 26
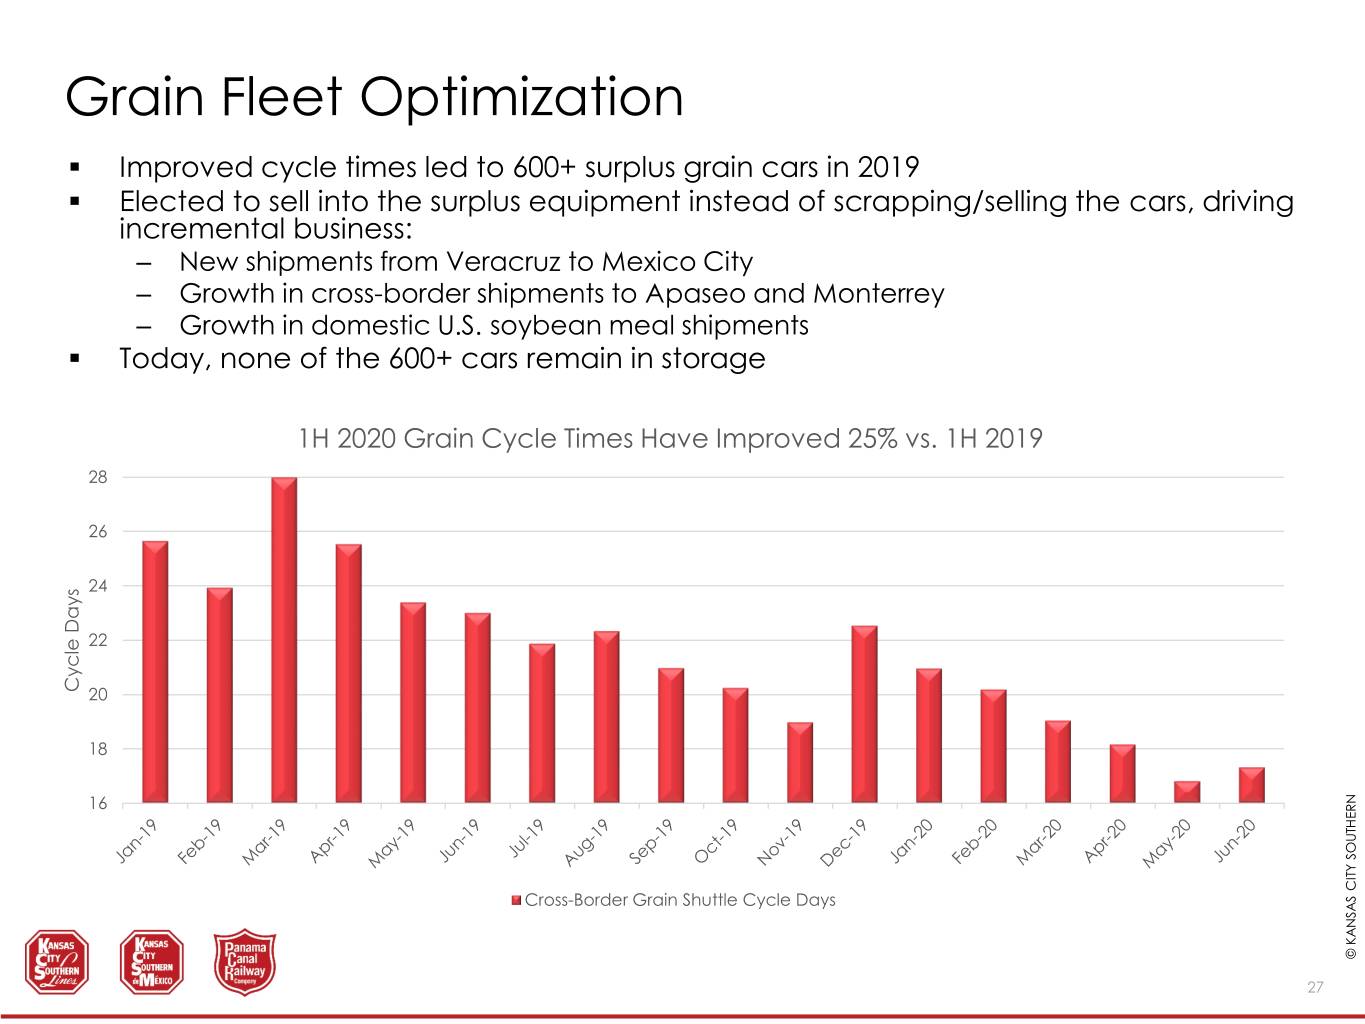
Grain Fleet Optimization . Improved cycle times led to 600+ surplus grain cars in 2019 . Elected to sell into the surplus equipment instead of scrapping/selling the cars, driving incremental business: – New shipments from Veracruz to Mexico City – Growth in cross-border shipments to Apaseo and Monterrey – Growth in domestic U.S. soybean meal shipments . Today, none of the 600+ cars remain in storage 1H 2020 Grain Cycle Times Have Improved 25% vs. 1H 2019 28 26 24 22 Cycle Cycle Days 20 18 16 Cross-Border Grain Shuttle Cycle Days © KANSAS © KANSAS CITY SOUTHERN KCS 27

KCS’ Cross-Border Grain Network Provides Long, Unit Train Hauls of up to 2,100 Miles © KANSAS © KANSAS CITY SOUTHERN KCS 28
MECHANICAL MIKE WALCZAK, VP NETWORK PLANNING & FINANCE © KANSAS CITY SOUTHERN KCS 29
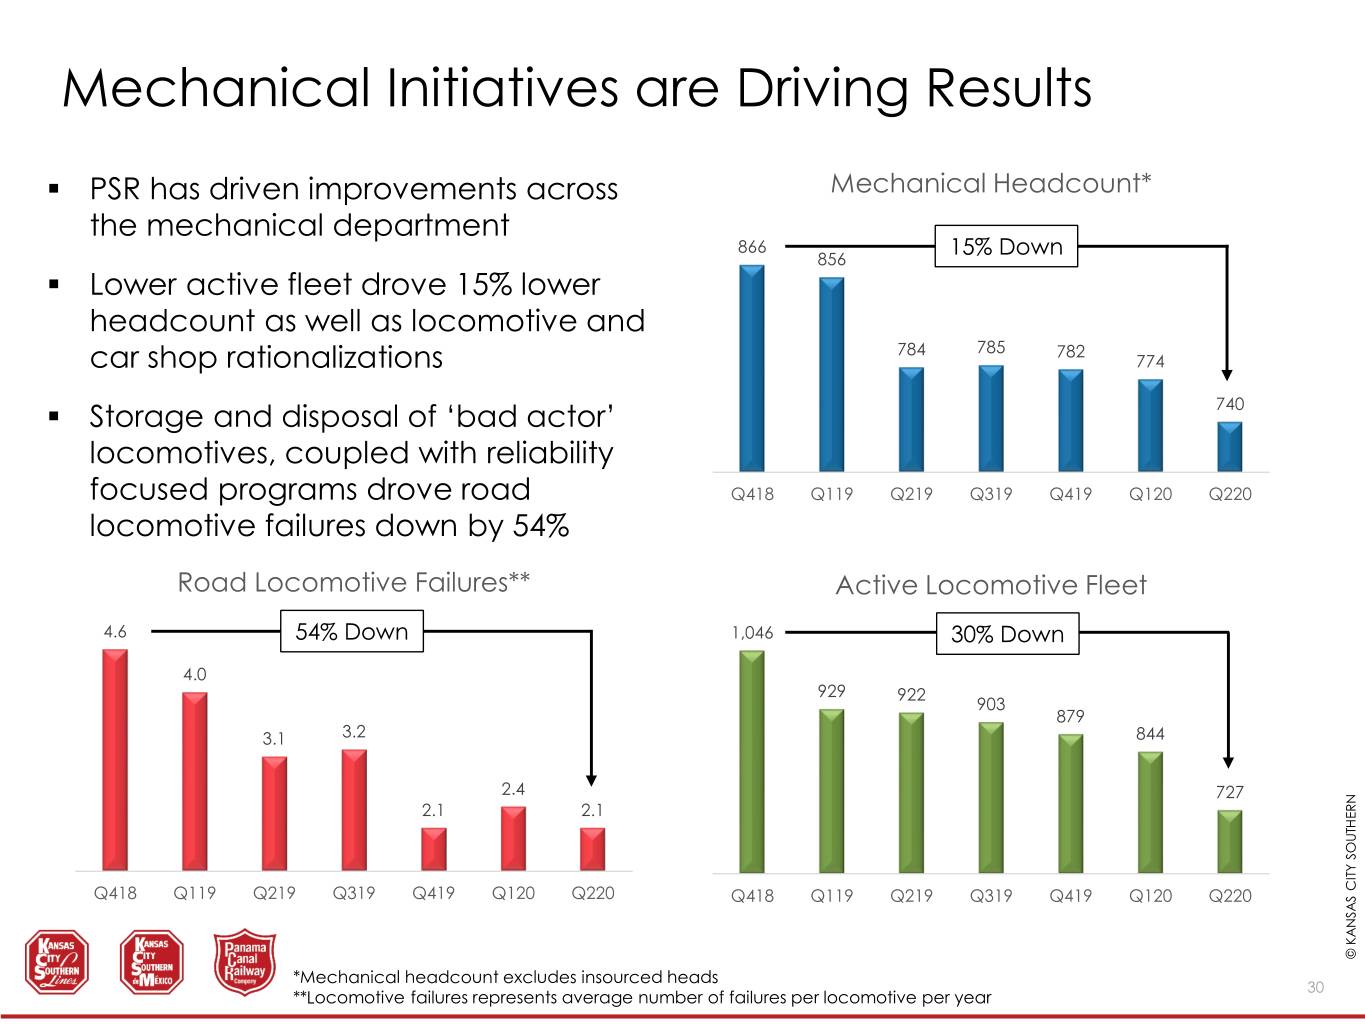
Mechanical Initiatives are Driving Results . PSR has driven improvements across Mechanical Headcount* the mechanical department 866 15% Down 856 . Lower active fleet drove 15% lower headcount as well as locomotive and 784 785 782 car shop rationalizations 774 . Storage and disposal of ‘bad actor’ 740 locomotives, coupled with reliability focused programs drove road Q418 Q119 Q219 Q319 Q419 Q120 Q220 locomotive failures down by 54% Road Locomotive Failures** Active Locomotive Fleet 4.6 54% Down 1,046 30% Down 4.0 929 922 903 879 3.1 3.2 844 2.4 727 2.1 2.1 Q418 Q119 Q219 Q319 Q419 Q120 Q220 Q418 Q119 Q219 Q319 Q419 Q120 Q220 © KANSAS © KANSAS CITY SOUTHERN *Mechanical headcount excludes insourced heads 30 KCS **Locomotive failures represents average number of failures per locomotive per year

ENGINEERING MANNY LOUREIRO, VP & CHIEF ENGINEER © KANSAS CITY SOUTHERN KCS 31
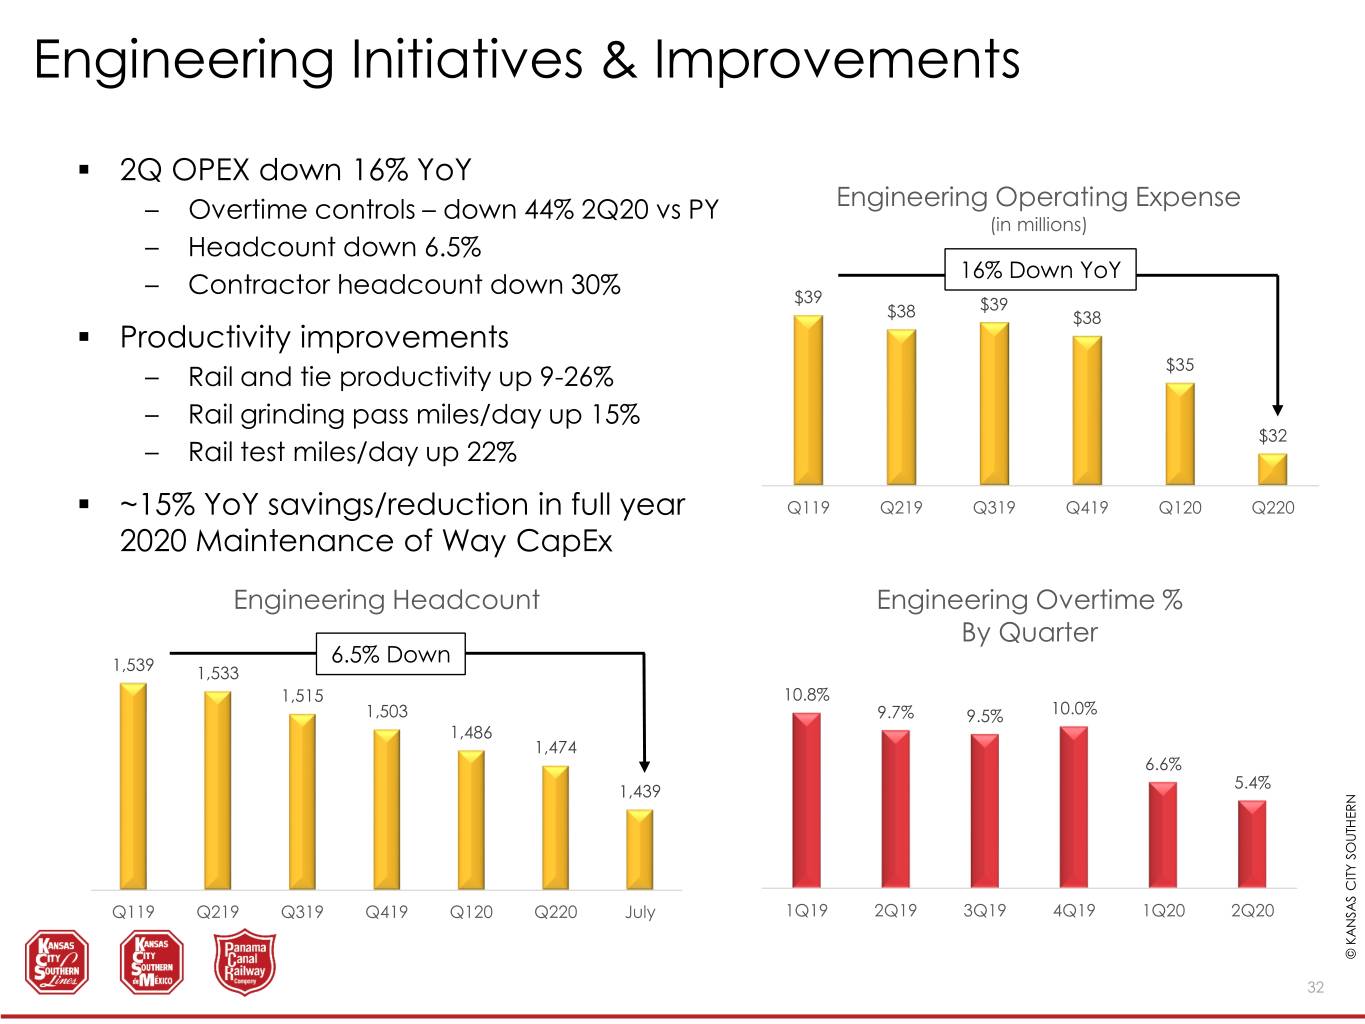
Engineering Initiatives & Improvements . 2Q OPEX down 16% YoY – Overtime controls – down 44% 2Q20 vs PY Engineering Operating Expense (in millions) – Headcount down 6.5% 16% Down YoY – Contractor headcount down 30% $39 $39 $38 $38 . Productivity improvements – Rail and tie productivity up 9-26% $35 – Rail grinding pass miles/day up 15% $32 – Rail test miles/day up 22% . ~15% YoY savings/reduction in full year Q119 Q219 Q319 Q419 Q120 Q220 2020 Maintenance of Way CapEx Engineering Headcount Engineering Overtime % By Quarter 6.5% Down 1,539 1,533 1,515 10.8% 1,503 9.7% 9.5% 10.0% 1,486 1,474 6.6% 5.4% 1,439 Q119 Q219 Q319 Q419 Q120 Q220 July 1Q19 2Q19 3Q19 4Q19 1Q20 2Q20 © KANSAS © KANSAS CITY SOUTHERN KCS 32
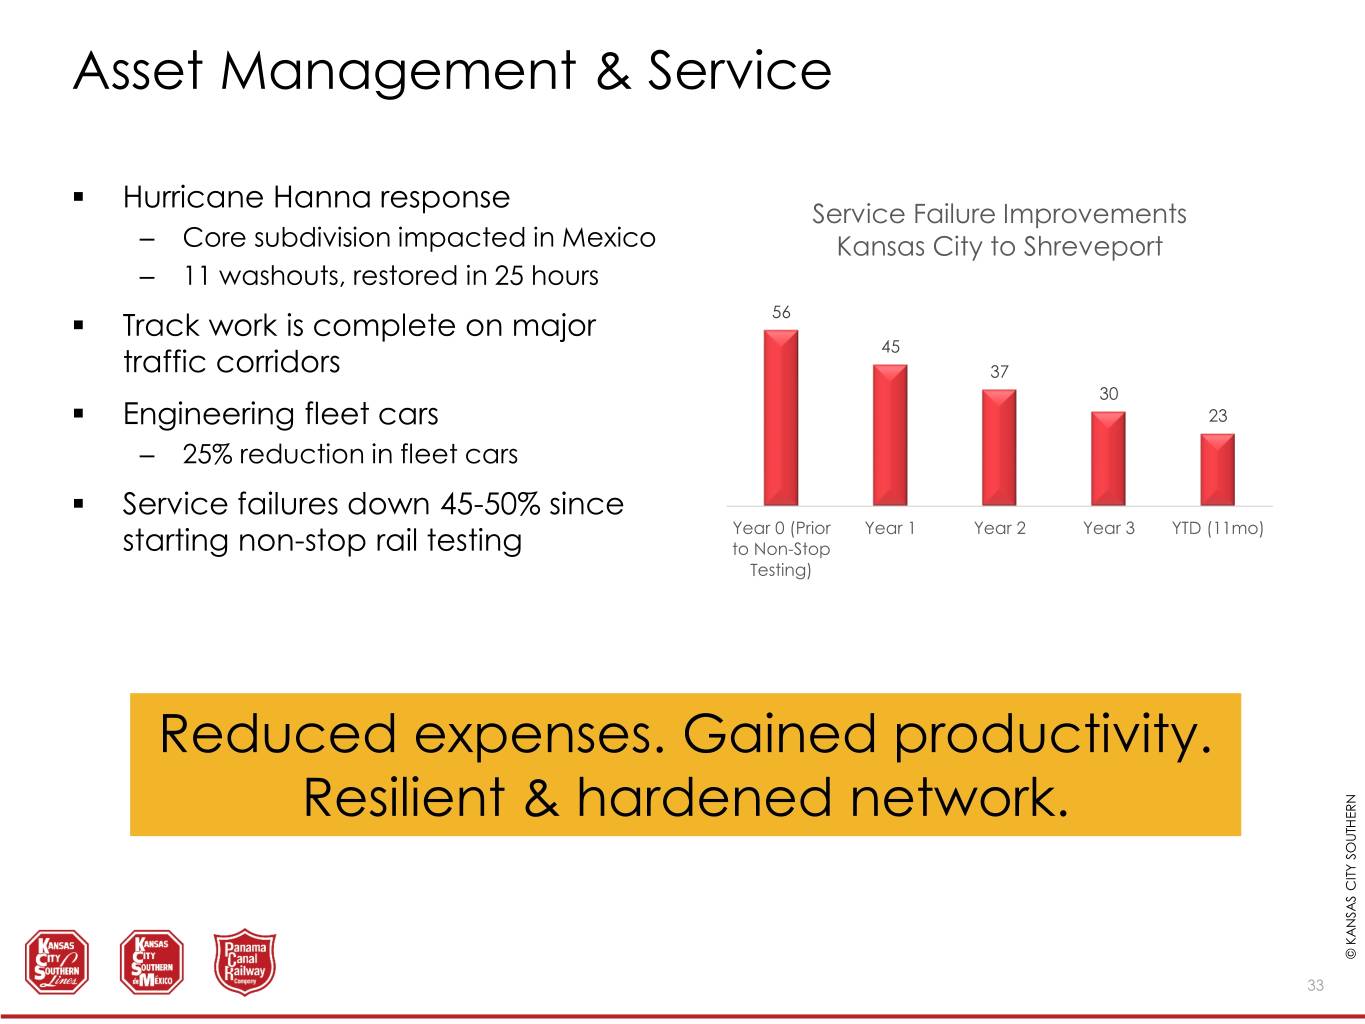
Asset Management & Service . Hurricane Hanna response Service Failure Improvements – Core subdivision impacted in Mexico Kansas City to Shreveport – 11 washouts, restored in 25 hours . Track work is complete on major 56 45 traffic corridors 37 30 . Engineering fleet cars 23 – 25% reduction in fleet cars . Service failures down 45-50% since Year 0 (Prior Year 1 Year 2 Year 3 YTD (11mo) starting non-stop rail testing to Non-Stop Testing) Reduced expenses. Gained productivity. Resilient & hardened network. © KANSAS © KANSAS CITY SOUTHERN KCS 33
PSR INITIATIVE MANAGEMENT & RESULTS MEASUREMENT BRENT VANDER ARK, VP FINANCIAL SERVICES © KANSAS CITY SOUTHERN KCS 34
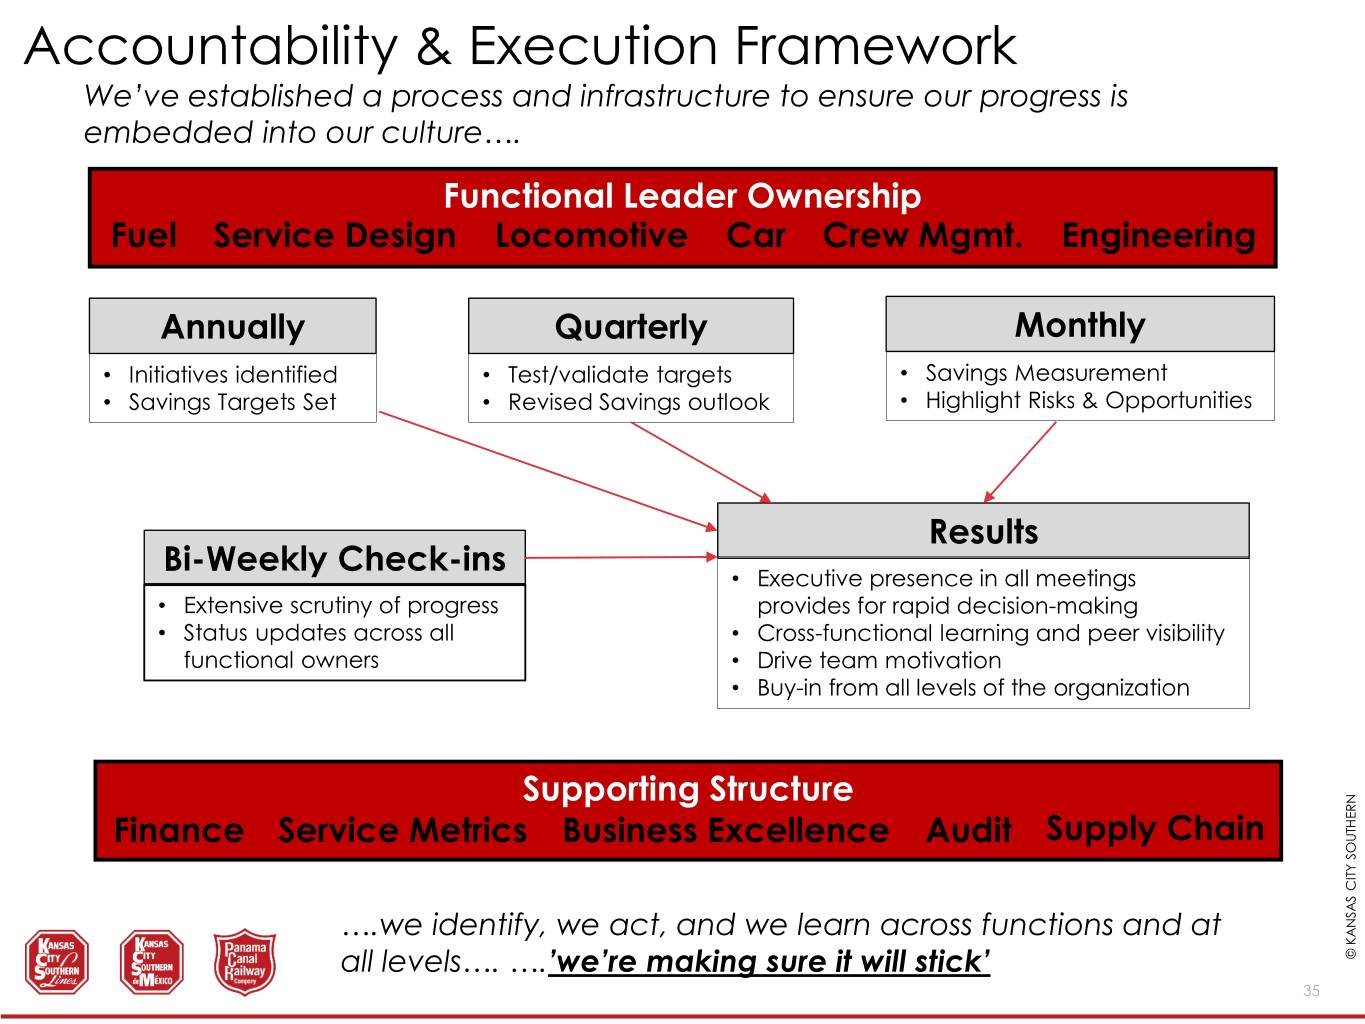
Accountability & Execution Framework We’ve established a process and infrastructure to ensure our progress is embedded into our culture…. Functional Leader Ownership Fuel Service Design Locomotive Car Crew Mgmt. Engineering Annually Quarterly Monthly • Initiatives identified • Test/validate targets • Savings Measurement • Savings Targets Set • Revised Savings outlook • Highlight Risks & Opportunities Results Bi-Weekly Check-ins • Executive presence in all meetings • Extensive scrutiny of progress provides for rapid decision-making • Status updates across all • Cross-functional learning and peer visibility functional owners • Drive team motivation • Buy-in from all levels of the organization Supporting Structure Finance Service Metrics Business Excellence Audit Supply Chain ….we identify, we act, and we learn across functions and at all levels…. ….’we’re making sure it will stick’ © KANSAS CITY SOUTHERN KCS 35
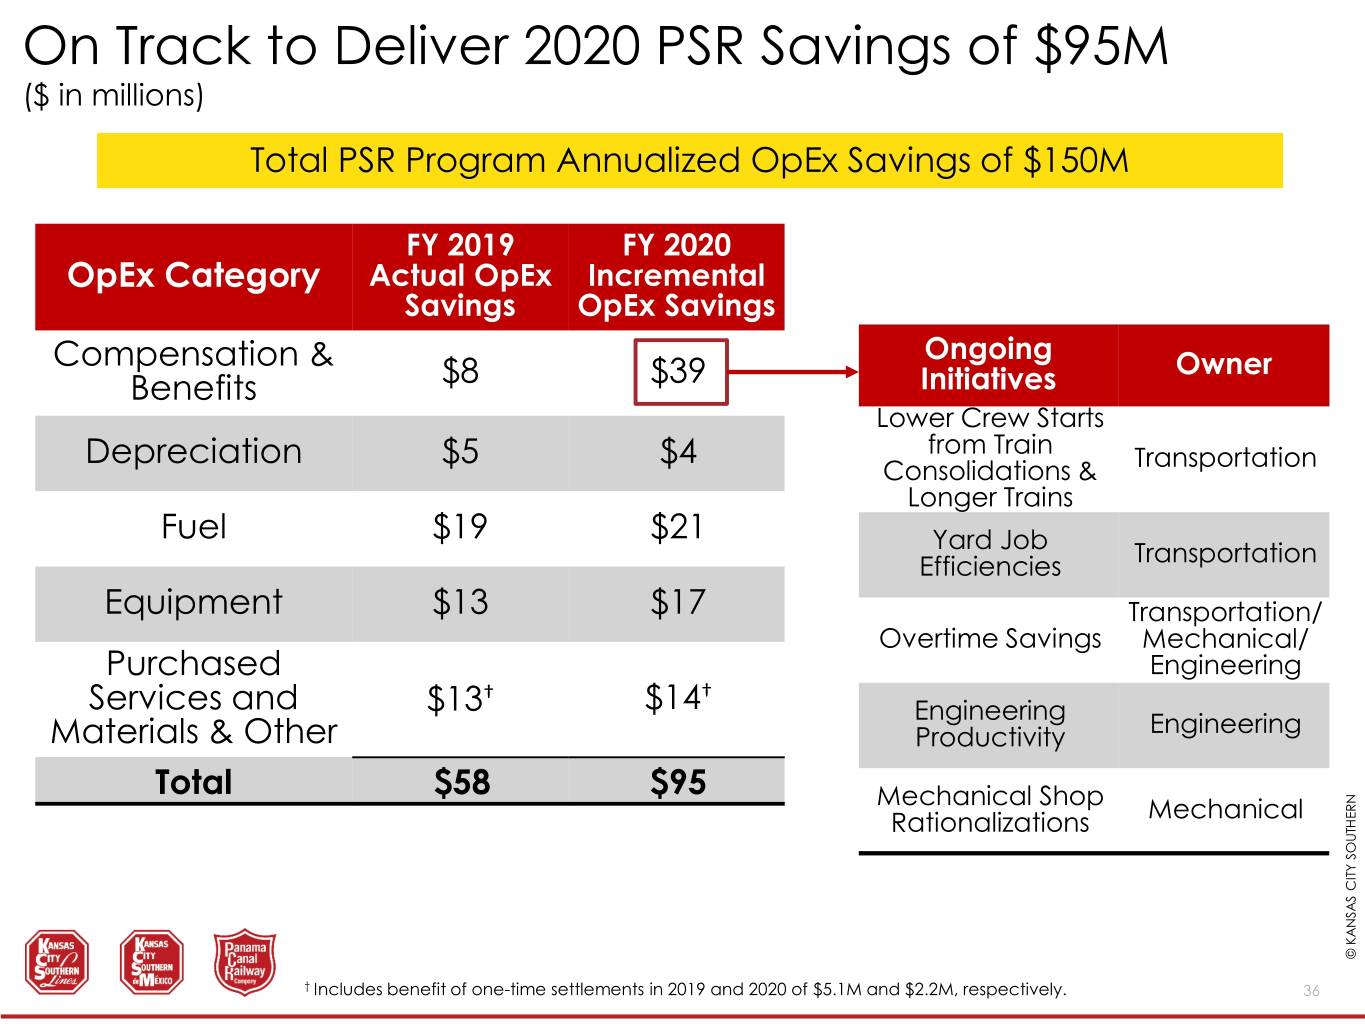
On Track to Deliver 2020 PSR Savings of $95M ($ in millions) Total PSR Program Annualized OpEx Savings of $150M FY 2019 FY 2020 OpEx Category Actual OpEx Incremental Savings OpEx Savings Ongoing Compensation & $8 $39 Owner Benefits Initiatives Lower Crew Starts Depreciation $5 $4 from Train Transportation Consolidations & Longer Trains Fuel $19 $21 Yard Job Transportation Efficiencies Equipment $13 $17 Transportation/ Overtime Savings Mechanical/ Purchased Engineering Services and $13† $14† Engineering Engineering Materials & Other Productivity Total $58 $95 Mechanical Shop Mechanical Rationalizations © KANSAS © KANSAS CITY SOUTHERN KCS † Includes benefit of one-time settlements in 2019 and 2020 of $5.1M and $2.2M, respectively. 36
PSR AT KCS – FUTURE STATE SAMEH FAHMY, EVP PRECISION SCHEDULED RAILROADING © KANSAS CITY SOUTHERN KCS 37
FIRESIDE CHAT MODERATED BY CHRIS WETHERBEE, CITI © KANSAS © KANSAS CITY SOUTHERN KCS 38
© KANSAS © KANSAS CITY SOUTHERN KCS 39
