Attached files
| file | filename |
|---|---|
| 8-K - CURTISS-WRIGHT CORPORATION 8-K - CURTISS WRIGHT CORP | a52260095.htm |
| EX-99.1 - EXHIBIT 99.1 - CURTISS WRIGHT CORP | a52260095ex99_1.htm |
Exhibit 99.2

Q2 2020 Earnings Conference CallAugust 4, 2020 NYSE: CW Listen-Only dial-in numbers: (844) 220-4970
(domestic)(262) 558-6349 (international)
Safe Harbor Statement Please note that the information provided in this presentation is accurate as of
the date of the original presentation. The presentation will remain posted on this website from one to twelve months following the initial presentation, but content will not be updated to reflect new information that may become available after
the original presentation posting. The presentation contains forward-looking statements within the meaning of Section 27A of the Securities Act of 1933, as amended ("Securities Act"), Section 21E of the Securities Exchange Act of 1934, as
amended ("Exchange Act"), and the Private Securities Litigation Reform Act of 1995. Such forward-looking statements only speak as of the date of this report and Curtiss-Wright Corporation assumes no obligation to update the information included
in this report. Such forward-looking statements include, among other things, management's estimates of future performance, revenue and earnings, our management's growth objectives, our management’s ability to integrate our acquisition, and our
management's ability to produce consistent operating improvements. These forward-looking statements are based on expectations as of the time the statements were made only, and are subject to a number of risks and uncertainties which could cause
us to fail to achieve our then-current financial projections and other expectations, including the impact of a global pandemic or national epidemic. Any references to organic growth exclude the effects of restructuring costs, foreign currency
fluctuations, acquisitions and divestitures, unless otherwise noted. This presentation also includes certain non-GAAP financial measures with reconciliations to GAAP financial measures being made available in the earnings release that is posted
to our website and furnished with the SEC. We undertake no duty to update this information. More information about potential factors that could affect our business and financial results is included in our filings with the Securities and
Exchange Commission, including our Annual Reports on Form 10-K and Quarterly Reports on Form 10-Q, including, among other sections, under the captions, "Risk Factors" and "Management's Discussion and Analysis of Financial Condition and Results
of Operations," which is on file with the SEC and available at the SEC's website at www.sec.gov.
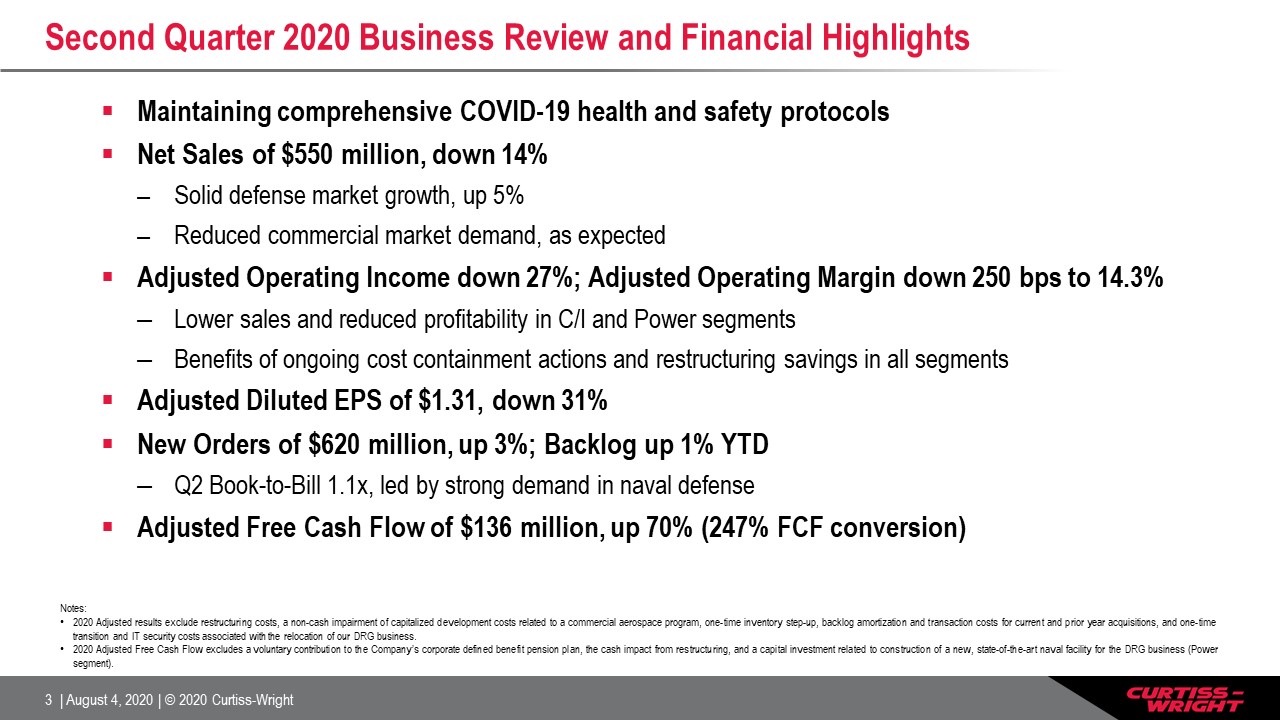
Notes: 2020 Adjusted results exclude restructuring costs, a non-cash impairment of capitalized
development costs related to a commercial aerospace program, one-time inventory step-up, backlog amortization and transaction costs for current and prior year acquisitions, and one-time transition and IT security costs associated with the
relocation of our DRG business. 2020 Adjusted Free Cash Flow excludes a voluntary contribution to the Company’s corporate defined benefit pension plan, the cash impact from restructuring, and a capital investment related to construction of a
new, state-of-the-art naval facility for the DRG business (Power segment). Second Quarter 2020 Business Review and Financial Highlights Maintaining comprehensive COVID-19 health and safety protocolsNet Sales of $550 million, down 14% Solid
defense market growth, up 5%Reduced commercial market demand, as expectedAdjusted Operating Income down 27%; Adjusted Operating Margin down 250 bps to 14.3%Lower sales and reduced profitability in C/I and Power segmentsBenefits of ongoing cost
containment actions and restructuring savings in all segmentsAdjusted Diluted EPS of $1.31, down 31%New Orders of $620 million, up 3%; Backlog up 1% YTDQ2 Book-to-Bill 1.1x, led by strong demand in naval defenseAdjusted Free Cash Flow of $136
million, up 70% (247% FCF conversion)
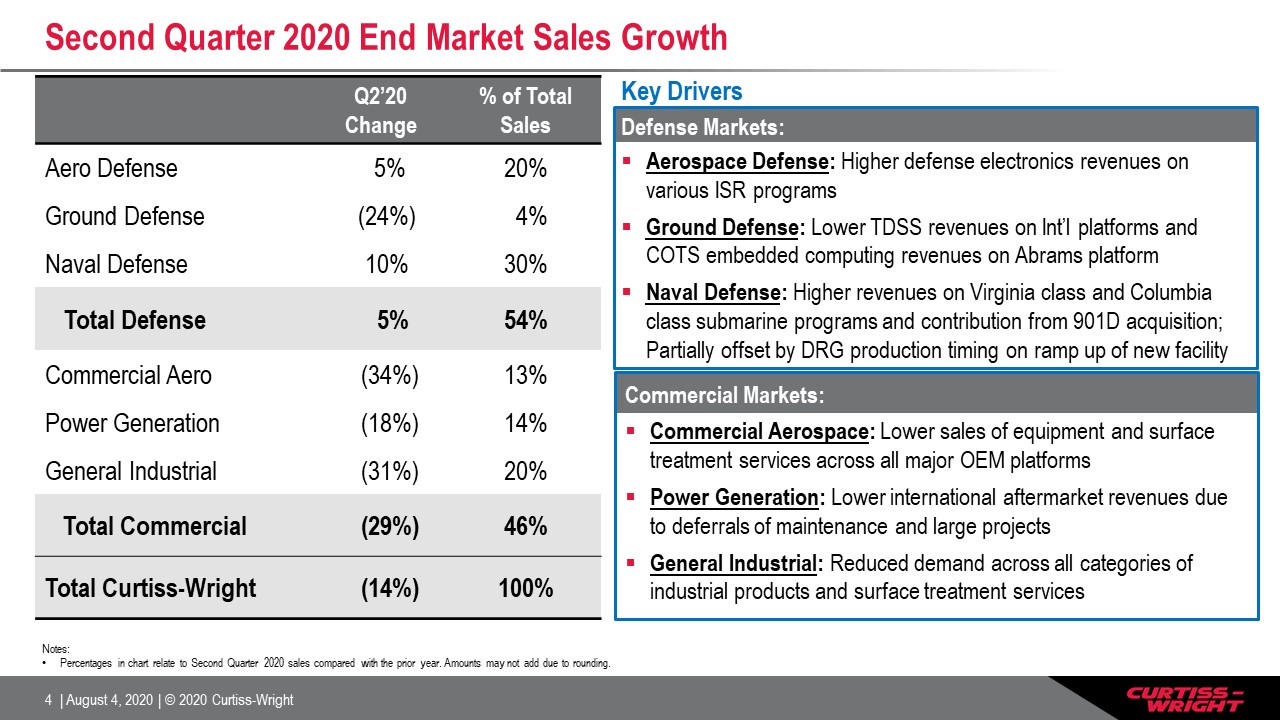
Second Quarter 2020 End Market Sales Growth Notes: Percentages in chart relate to Second Quarter
2020 sales compared with the prior year. Amounts may not add due to rounding. Q2’20Change % of Total Sales Aero Defense 5% 20% Ground Defense (24%) 4% Naval Defense 10% 30% Total Defense 5% 54% Commercial Aero
(34%) 13% Power Generation (18%) 14% General Industrial (31%) 20% Total Commercial (29%) 46% Total Curtiss-Wright (14%) 100% Commercial Markets:Commercial Aerospace: Lower sales of equipment and surface treatment services
across all major OEM platforms Power Generation: Lower international aftermarket revenues due to deferrals of maintenance and large projectsGeneral Industrial: Reduced demand across all categories of industrial products and surface treatment
services Key DriversDefense Markets:Aerospace Defense: Higher defense electronics revenues on various ISR programsGround Defense: Lower TDSS revenues on Int’l platforms and COTS embedded computing revenues on Abrams platformNaval Defense:
Higher revenues on Virginia class and Columbia class submarine programs and contribution from 901D acquisition; Partially offset by DRG production timing on ramp up of new facility
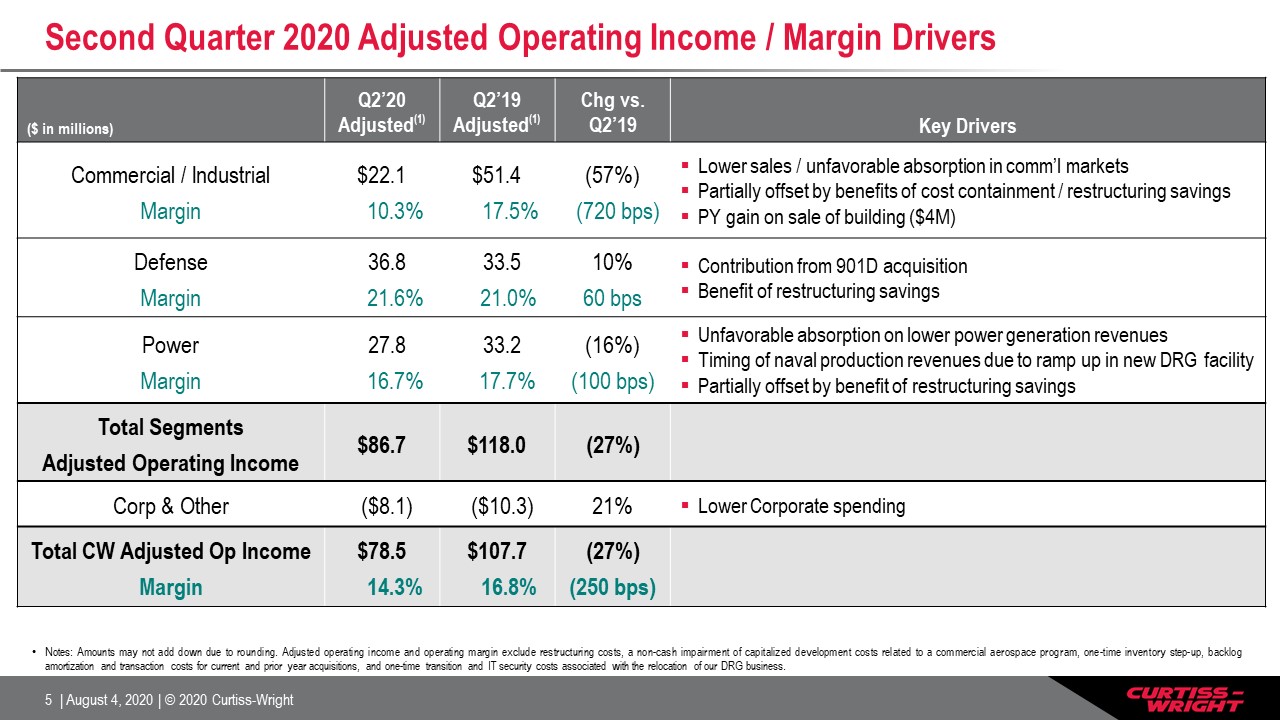
Second Quarter 2020 Adjusted Operating Income / Margin Drivers ($ in millions) Q2’20 Adjusted(1) Q2’19
Adjusted(1) Chg vs. Q2’19 Key Drivers Commercial / IndustrialMargin $22.1 10.3% $51.4 17.5% (57%) (720 bps) Lower sales / unfavorable absorption in comm’l marketsPartially offset by benefits of cost containment / restructuring savingsPY
gain on sale of building ($4M) DefenseMargin 36.8 21.6% 33.5 21.0% 10%60 bps Contribution from 901D acquisitionBenefit of restructuring savings PowerMargin 27.8 16.7% 33.2 17.7% (16%)(100 bps) Unfavorable absorption on lower power
generation revenuesTiming of naval production revenues due to ramp up in new DRG facilityPartially offset by benefit of restructuring savings Total SegmentsAdjusted Operating Income $86.7 $118.0 (27%) Corp & Other ($8.1)
($10.3) 21% Lower Corporate spending Total CW Adjusted Op IncomeMargin $78.5 14.3% $107.7 16.8% (27%)(250 bps) Notes: Amounts may not add down due to rounding. Adjusted operating income and operating margin exclude restructuring costs,
a non-cash impairment of capitalized development costs related to a commercial aerospace program, one-time inventory step-up, backlog amortization and transaction costs for current and prior year acquisitions, and one-time transition and IT
security costs associated with the relocation of our DRG business.
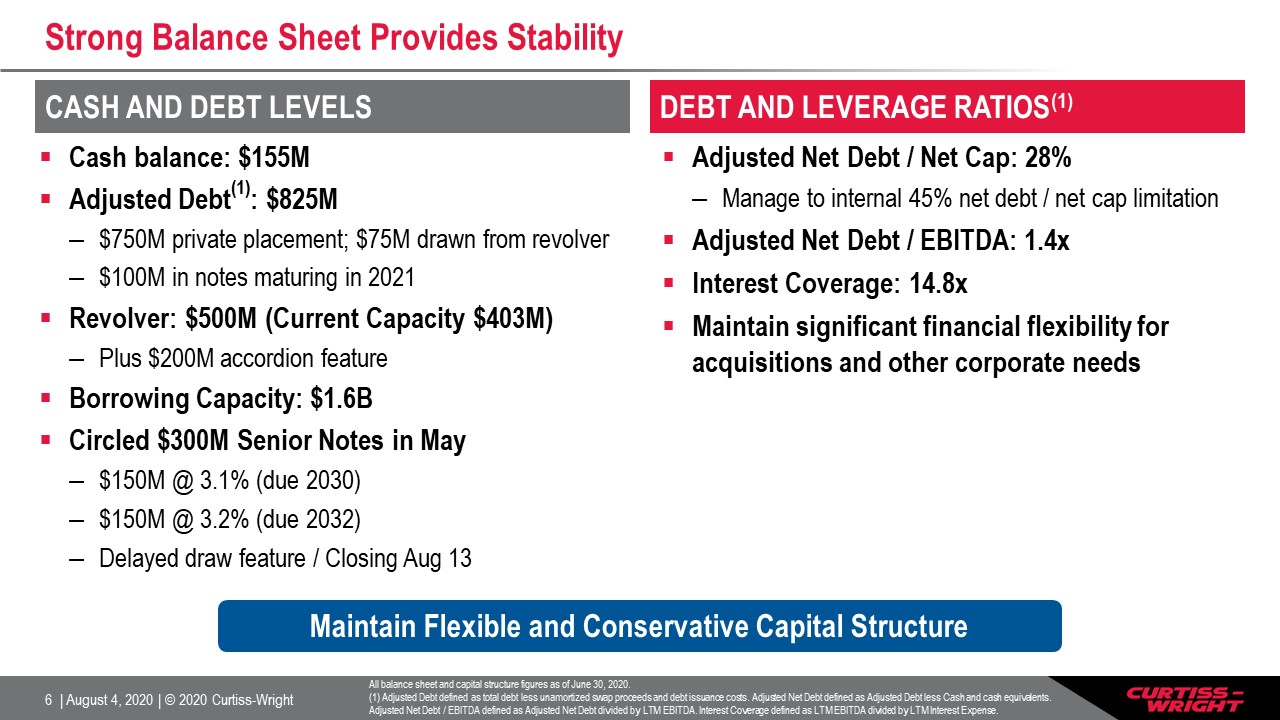
Strong Balance Sheet Provides Stability Cash balance: $155MAdjusted Debt(1): $825M$750M private
placement; $75M drawn from revolver$100M in notes maturing in 2021Revolver: $500M (Current Capacity $403M)Plus $200M accordion feature Borrowing Capacity: $1.6BCircled $300M Senior Notes in May$150M @ 3.1% (due 2030)$150M @ 3.2% (due
2032)Delayed draw feature / Closing Aug 13 Adjusted Net Debt / Net Cap: 28% Manage to internal 45% net debt / net cap limitationAdjusted Net Debt / EBITDA: 1.4xInterest Coverage: 14.8xMaintain significant financial flexibility for acquisitions
and other corporate needs CASH AND DEBT LEVELS DEBT AND LEVERAGE RATIOS(1) Maintain Flexible and Conservative Capital Structure All balance sheet and capital structure figures as of June 30, 2020.(1) Adjusted Debt defined as total debt
less unamortized swap proceeds and debt issuance costs. Adjusted Net Debt defined as Adjusted Debt less Cash and cash equivalents. Adjusted Net Debt / EBITDA defined as Adjusted Net Debt divided by LTM EBITDA. Interest Coverage defined as LTM
EBITDA divided by LTM Interest Expense.
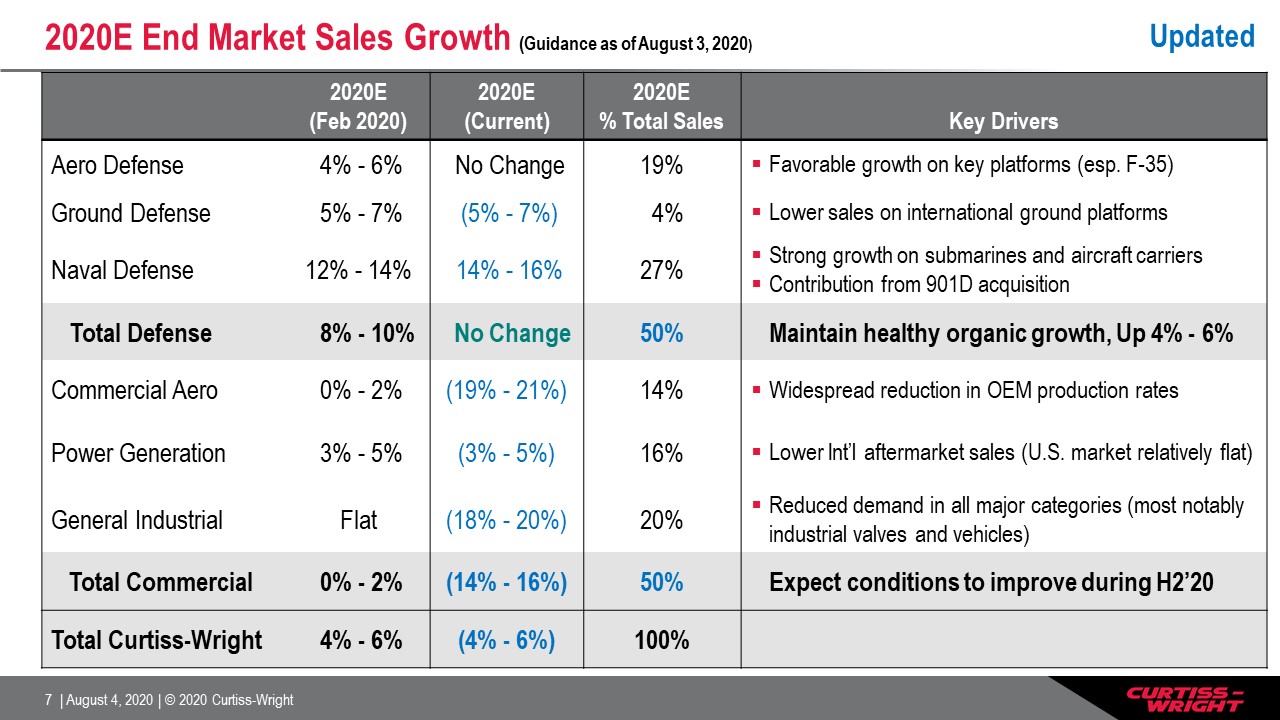
2020E End Market Sales Growth (Guidance as of August 3, 2020) 2020E(Feb 2020) 2020E(Current) 2020E %
Total Sales Key Drivers Aero Defense 4% - 6% No Change 19% Favorable growth on key platforms (esp. F-35) Ground Defense 5% - 7% (5% - 7%) 4% Lower sales on international ground platforms Naval Defense 12% - 14% 14% -
16% 27% Strong growth on submarines and aircraft carriersContribution from 901D acquisition Total Defense 8% - 10% No Change 50% Maintain healthy organic growth, Up 4% - 6% Commercial Aero 0% - 2% (19% - 21%) 14% Widespread
reduction in OEM production rates Power Generation 3% - 5% (3% - 5%) 16% Lower Int’l aftermarket sales (U.S. market relatively flat) General Industrial Flat (18% - 20%) 20% Reduced demand in all major categories (most notably
industrial valves and vehicles) Total Commercial 0% - 2% (14% - 16%) 50% Expect conditions to improve during H2’20 Total Curtiss-Wright 4% - 6% (4% - 6%) 100% Updated
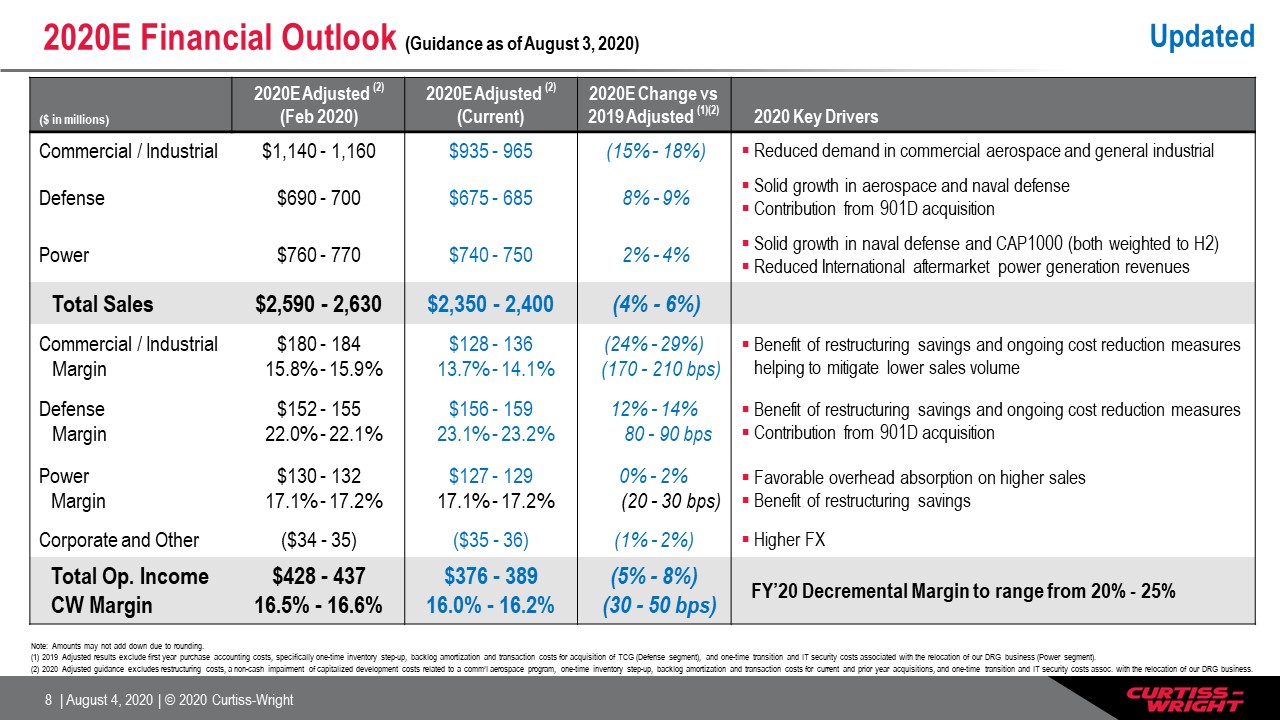
($ in millions) 2020E Adjusted (2)(Feb 2020) 2020E Adjusted (2)(Current) 2020E Change vs 2019 Adjusted
(1)(2) 2020 Key Drivers Commercial / Industrial $1,140 - 1,160 $935 - 965 (15% - 18%) Reduced demand in commercial aerospace and general industrial Defense $690 - 700 $675 - 685 8% - 9% Solid growth in aerospace and naval
defenseContribution from 901D acquisition Power $760 - 770 $740 - 750 2% - 4% Solid growth in naval defense and CAP1000 (both weighted to H2)Reduced International aftermarket power generation revenues Total Sales $2,590 - 2,630 $2,350
- 2,400 (4% - 6%) Commercial / IndustrialMargin $180 - 184 15.8% - 15.9% $128 - 136 13.7% - 14.1% (24% - 29%) (170 - 210 bps) Benefit of restructuring savings and ongoing cost reduction measures helping to mitigate lower sales
volume DefenseMargin $152 - 155 22.0% - 22.1% $156 - 159 23.1% - 23.2% 12% - 14% 80 - 90 bps Benefit of restructuring savings and ongoing cost reduction measuresContribution from 901D acquisition PowerMargin $130 - 132 17.1% -
17.2% $127 - 129 17.1% - 17.2% 0% - 2% (20 - 30 bps) Favorable overhead absorption on higher salesBenefit of restructuring savings Corporate and Other ($34 - 35) ($35 - 36) (1% - 2%) Higher FX Total Op. IncomeCW Margin $428 -
43716.5% - 16.6% $376 - 38916.0% - 16.2% (5% - 8%) (30 - 50 bps) FY’20 Decremental Margin to range from 20% - 25% 2020E Financial Outlook (Guidance as of August 3, 2020) Note: Amounts may not add down due to rounding. (1) 2019 Adjusted
results exclude first year purchase accounting costs, specifically one-time inventory step-up, backlog amortization and transaction costs for acquisition of TCG (Defense segment), and one-time transition and IT security costs associated with
the relocation of our DRG business (Power segment).(2) 2020 Adjusted guidance excludes restructuring costs, a non-cash impairment of capitalized development costs related to a comm’l aerospace program, one-time inventory step-up, backlog
amortization and transaction costs for current and prior year acquisitions, and one-time transition and IT security costs assoc. with the relocation of our DRG business. Updated
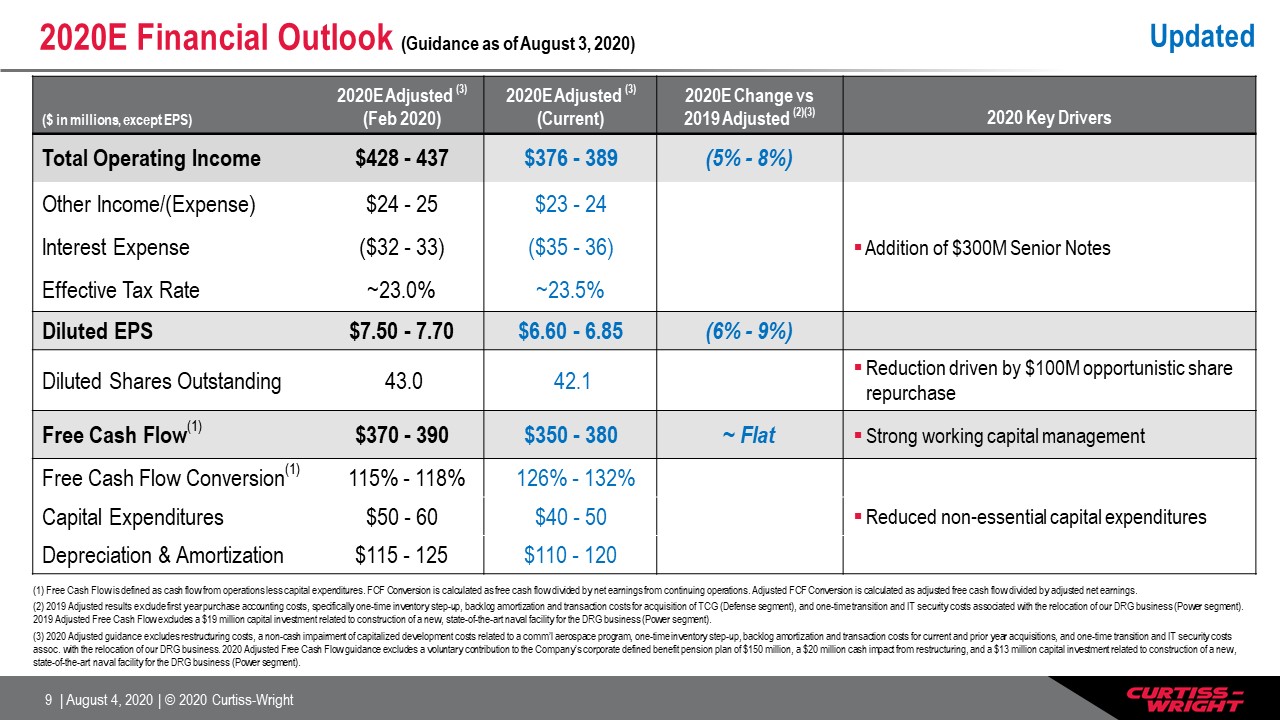
2020E Financial Outlook (Guidance as of August 3, 2020) ($ in millions, except EPS) 2020E Adjusted
(3)(Feb 2020) 2020E Adjusted (3)(Current) 2020E Change vs 2019 Adjusted (2)(3) 2020 Key Drivers Total Operating Income $428 - 437 $376 - 389 (5% - 8%) Other Income/(Expense) $24 - 25 $23 - 24 Interest Expense ($32 -
33) ($35 - 36) Addition of $300M Senior Notes Effective Tax Rate ~23.0% ~23.5% Diluted EPS $7.50 - 7.70 $6.60 - 6.85 (6% - 9%) Diluted Shares Outstanding 43.0 42.1 Reduction driven by $100M opportunistic share
repurchase Free Cash Flow(1) $370 - 390 $350 - 380 ~ Flat Strong working capital management Free Cash Flow Conversion(1) 115% - 118% 126% - 132% Capital Expenditures $50 - 60 $40 - 50 Reduced non-essential capital
expenditures Depreciation & Amortization $115 - 125 $110 - 120 (1) Free Cash Flow is defined as cash flow from operations less capital expenditures. FCF Conversion is calculated as free cash flow divided by net earnings from
continuing operations. Adjusted FCF Conversion is calculated as adjusted free cash flow divided by adjusted net earnings.(2) 2019 Adjusted results exclude first year purchase accounting costs, specifically one-time inventory step-up, backlog
amortization and transaction costs for acquisition of TCG (Defense segment), and one-time transition and IT security costs associated with the relocation of our DRG business (Power segment). 2019 Adjusted Free Cash Flow excludes a $19 million
capital investment related to construction of a new, state-of-the-art naval facility for the DRG business (Power segment).(3) 2020 Adjusted guidance excludes restructuring costs, a non-cash impairment of capitalized development costs related to
a comm’l aerospace program, one-time inventory step-up, backlog amortization and transaction costs for current and prior year acquisitions, and one-time transition and IT security costs assoc. with the relocation of our DRG business. 2020
Adjusted Free Cash Flow guidance excludes a voluntary contribution to the Company’s corporate defined benefit pension plan of $150 million, a $20 million cash impact from restructuring, and a $13 million capital investment related to
construction of a new, state-of-the-art naval facility for the DRG business (Power segment). Updated
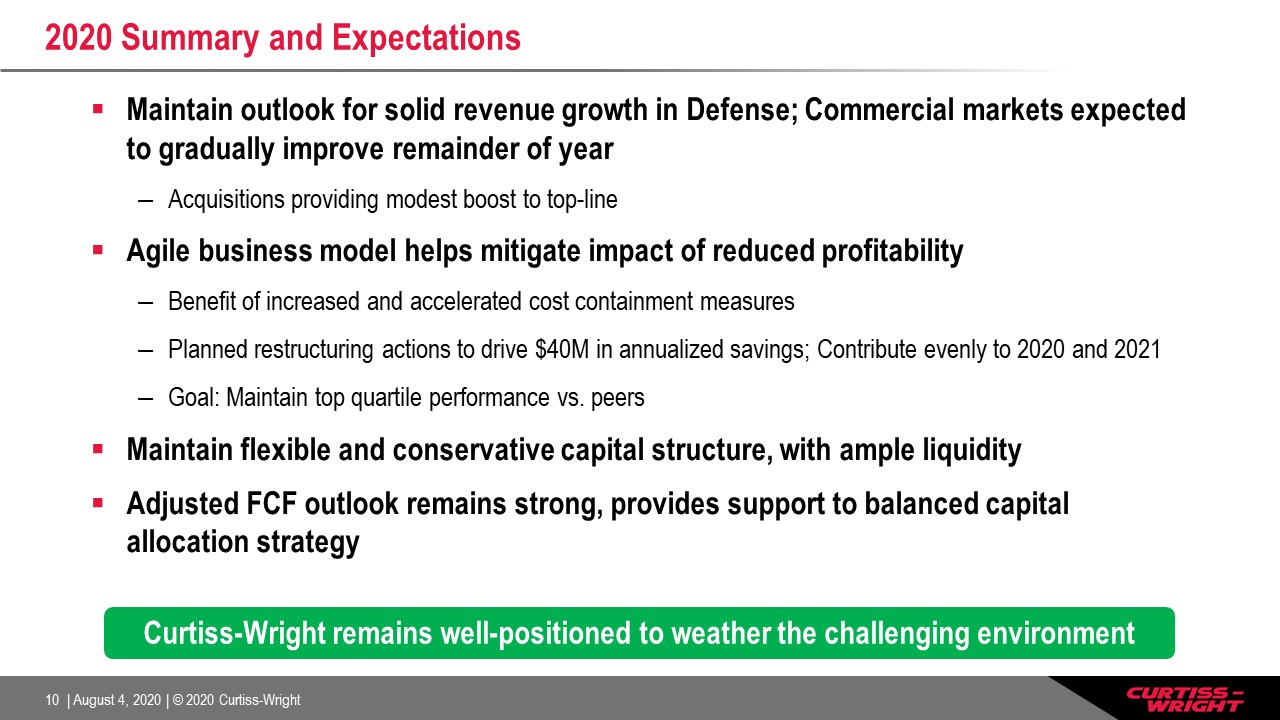
2020 Summary and Expectations Maintain outlook for solid revenue growth in Defense; Commercial markets
expected to gradually improve remainder of yearAcquisitions providing modest boost to top-lineAgile business model helps mitigate impact of reduced profitabilityBenefit of increased and accelerated cost containment measuresPlanned restructuring
actions to drive $40M in annualized savings; Contribute evenly to 2020 and 2021Goal: Maintain top quartile performance vs. peersMaintain flexible and conservative capital structure, with ample liquidity Adjusted FCF outlook remains strong,
provides support to balanced capital allocation strategy Curtiss-Wright remains well-positioned to weather the challenging environment
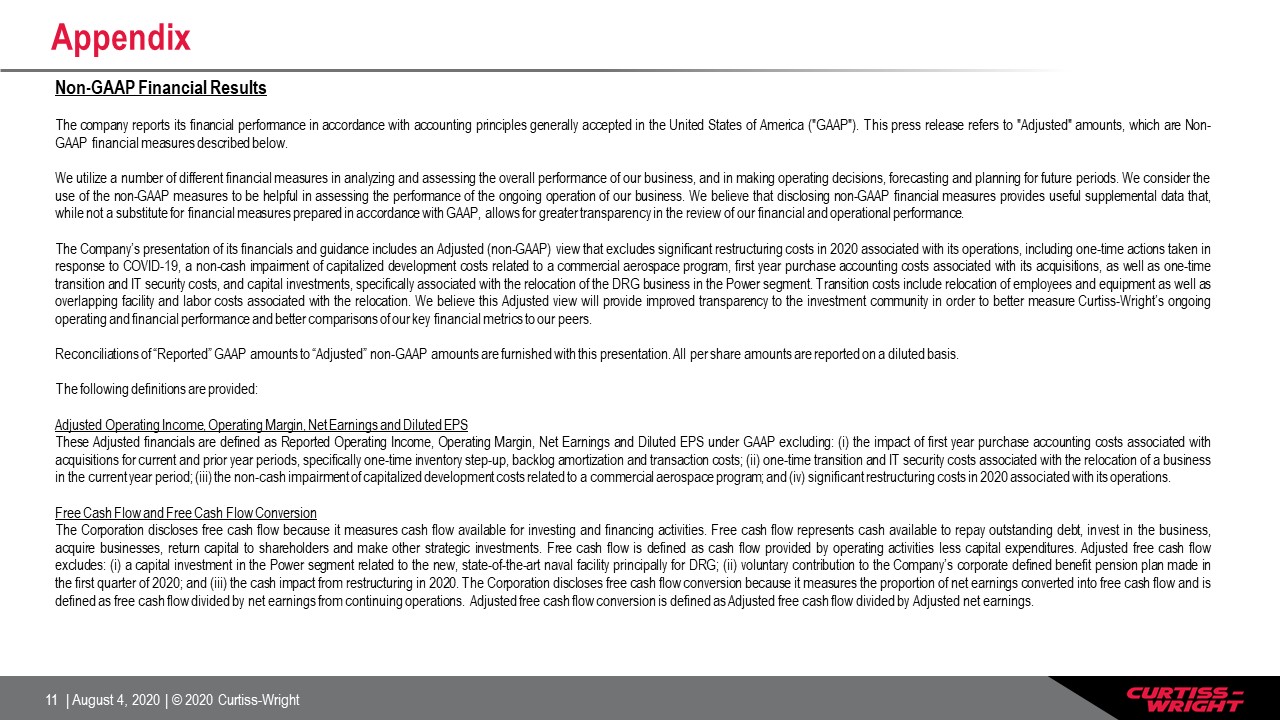
Appendix Non-GAAP Financial Results The company reports its financial performance in accordance with
accounting principles generally accepted in the United States of America ("GAAP"). This press release refers to "Adjusted" amounts, which are Non-GAAP financial measures described below. We utilize a number of different financial measures in
analyzing and assessing the overall performance of our business, and in making operating decisions, forecasting and planning for future periods. We consider the use of the non-GAAP measures to be helpful in assessing the performance of the
ongoing operation of our business. We believe that disclosing non-GAAP financial measures provides useful supplemental data that, while not a substitute for financial measures prepared in accordance with GAAP, allows for greater transparency in
the review of our financial and operational performance. The Company’s presentation of its financials and guidance includes an Adjusted (non-GAAP) view that excludes significant restructuring costs in 2020 associated with its operations,
including one-time actions taken in response to COVID-19, a non-cash impairment of capitalized development costs related to a commercial aerospace program, first year purchase accounting costs associated with its acquisitions, as well as
one-time transition and IT security costs, and capital investments, specifically associated with the relocation of the DRG business in the Power segment. Transition costs include relocation of employees and equipment as well as overlapping
facility and labor costs associated with the relocation. We believe this Adjusted view will provide improved transparency to the investment community in order to better measure Curtiss-Wright’s ongoing operating and financial performance and
better comparisons of our key financial metrics to our peers. Reconciliations of “Reported” GAAP amounts to “Adjusted” non-GAAP amounts are furnished with this presentation. All per share amounts are reported on a diluted basis. The following
definitions are provided: Adjusted Operating Income, Operating Margin, Net Earnings and Diluted EPSThese Adjusted financials are defined as Reported Operating Income, Operating Margin, Net Earnings and Diluted EPS under GAAP excluding: (i) the
impact of first year purchase accounting costs associated with acquisitions for current and prior year periods, specifically one-time inventory step-up, backlog amortization and transaction costs; (ii) one-time transition and IT security costs
associated with the relocation of a business in the current year period; (iii) the non-cash impairment of capitalized development costs related to a commercial aerospace program; and (iv) significant restructuring costs in 2020 associated with
its operations.Free Cash Flow and Free Cash Flow ConversionThe Corporation discloses free cash flow because it measures cash flow available for investing and financing activities. Free cash flow represents cash available to repay outstanding
debt, invest in the business, acquire businesses, return capital to shareholders and make other strategic investments. Free cash flow is defined as cash flow provided by operating activities less capital expenditures. Adjusted free cash flow
excludes: (i) a capital investment in the Power segment related to the new, state-of-the-art naval facility principally for DRG; (ii) voluntary contribution to the Company’s corporate defined benefit pension plan made in the first quarter of
2020; and (iii) the cash impact from restructuring in 2020. The Corporation discloses free cash flow conversion because it measures the proportion of net earnings converted into free cash flow and is defined as free cash flow divided by net
earnings from continuing operations. Adjusted free cash flow conversion is defined as Adjusted free cash flow divided by Adjusted net earnings.
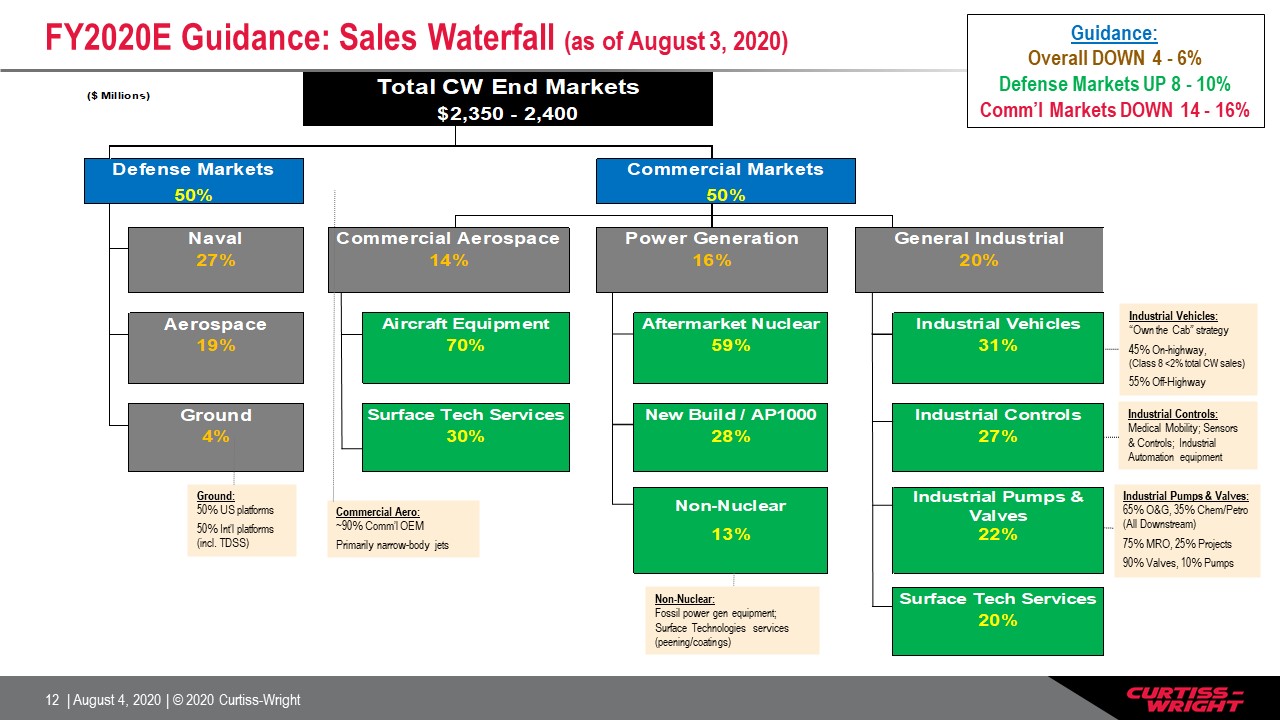
FY2020E Guidance: Sales Waterfall (as of August 3, 2020) Non-Nuclear:Fossil power gen equipment; Surface
Technologies services (peening/coatings) Industrial Pumps & Valves:65% O&G, 35% Chem/Petro(All Downstream)75% MRO, 25% Projects90% Valves, 10% Pumps Industrial Vehicles:“Own the Cab” strategy45% On-highway,(Class 8 <2% total CW
sales)55% Off-Highway Industrial Controls:Medical Mobility; Sensors & Controls; Industrial Automation equipment Ground:50% US platforms 50% Int’l platforms (incl. TDSS) Commercial Aero:~90% Comm’l OEMPrimarily narrow-body
jets Guidance:Overall DOWN 4 - 6%Defense Markets UP 8 - 10%Comm’l Markets DOWN 14 - 16%
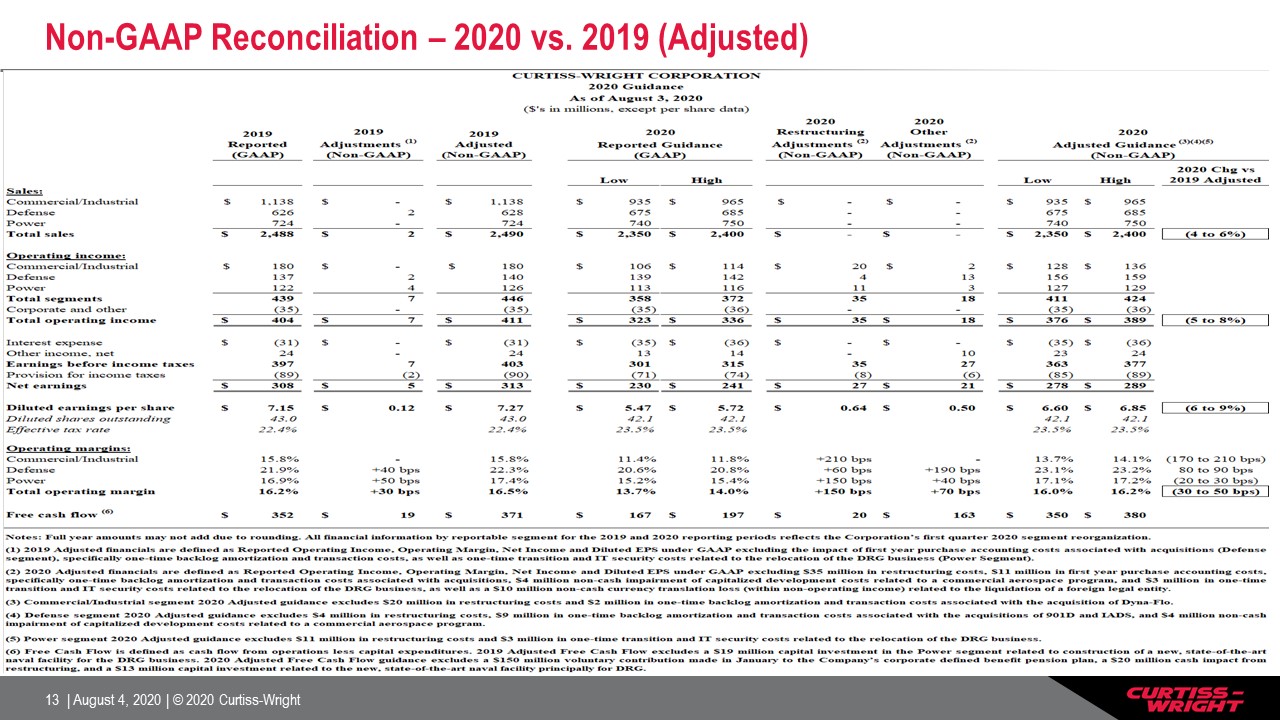
Non-GAAP Reconciliation – 2020 vs. 2019 (Adjusted)
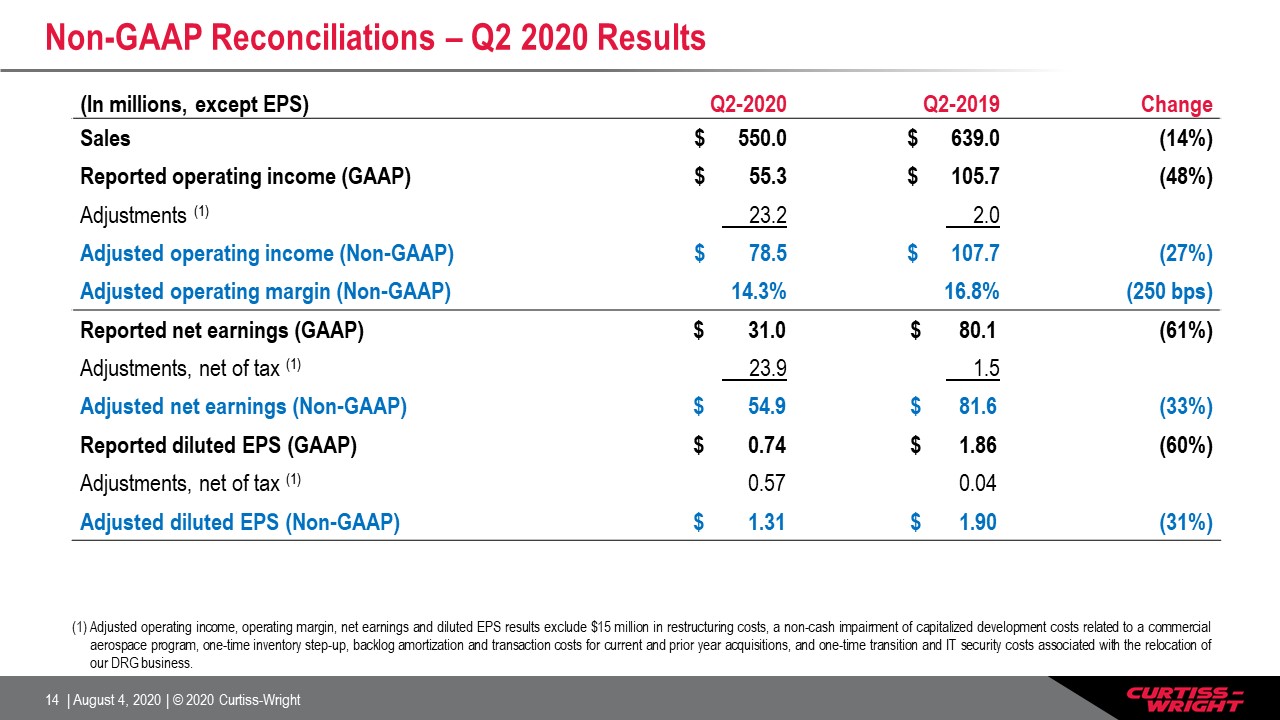
Non-GAAP Reconciliations – Q2 2020 Results (In millions, except EPS) Q2-2020 Q2-2019
Change Sales $ 550.0 $ 639.0 (14%) Reported operating income (GAAP) $ 55.3 $ 105.7 (48%) Adjustments (1) 23.2 2.0 Adjusted operating income (Non-GAAP) $ 78.5 $ 107.7 (27%) Adjusted operating margin (Non-GAAP)
14.3% 16.8% (250 bps) Reported net earnings (GAAP) $ 31.0 $ 80.1 (61%) Adjustments, net of tax (1) 23.9 1.5 Adjusted net earnings (Non-GAAP) $ 54.9 $ 81.6 (33%) Reported diluted EPS (GAAP) $ 0.74 $ 1.86
(60%) Adjustments, net of tax (1) 0.57 0.04 Adjusted diluted EPS (Non-GAAP) $ 1.31 $ 1.90 (31%) Adjusted operating income, operating margin, net earnings and diluted EPS results exclude $15 million in restructuring costs, a non-cash
impairment of capitalized development costs related to a commercial aerospace program, one-time inventory step-up, backlog amortization and transaction costs for current and prior year acquisitions, and one-time transition and IT security costs
associated with the relocation of our DRG business.
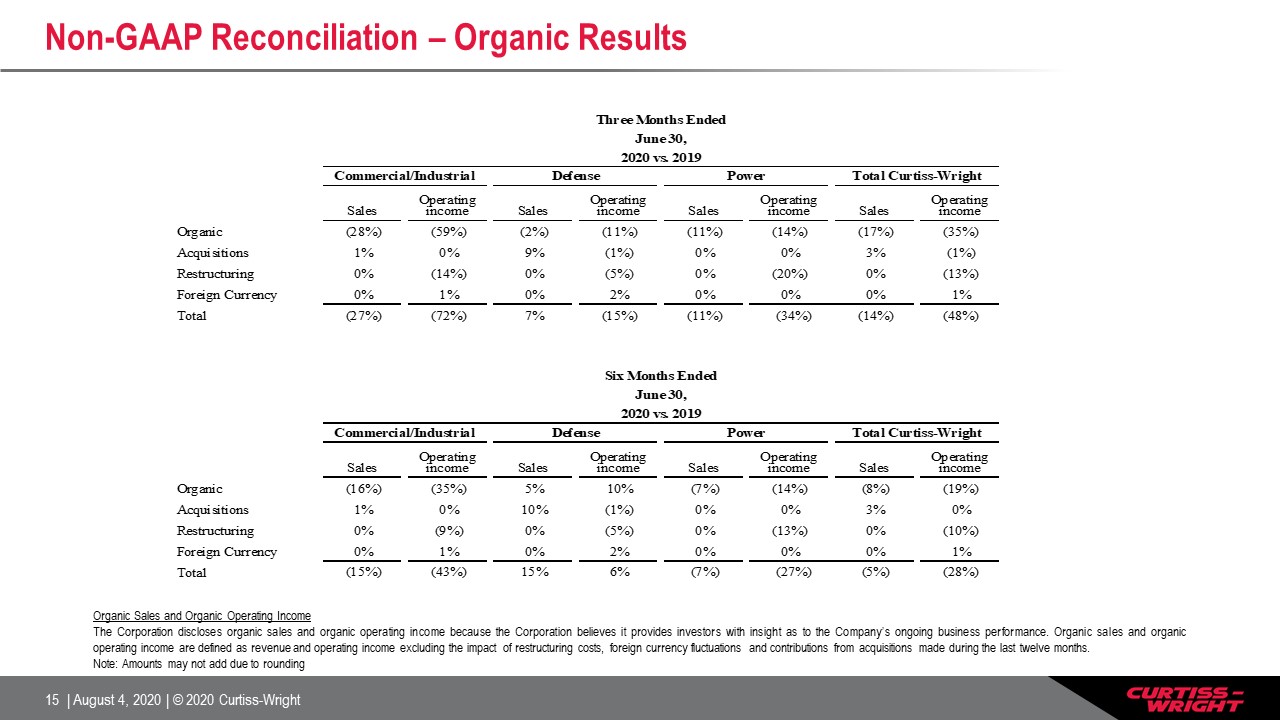
Non-GAAP Reconciliation – Organic Results Organic Sales and Organic Operating IncomeThe Corporation
discloses organic sales and organic operating income because the Corporation believes it provides investors with insight as to the Company’s ongoing business performance. Organic sales and organic operating income are defined as revenue and
operating income excluding the impact of restructuring costs, foreign currency fluctuations and contributions from acquisitions made during the last twelve months.Note: Amounts may not add due to rounding
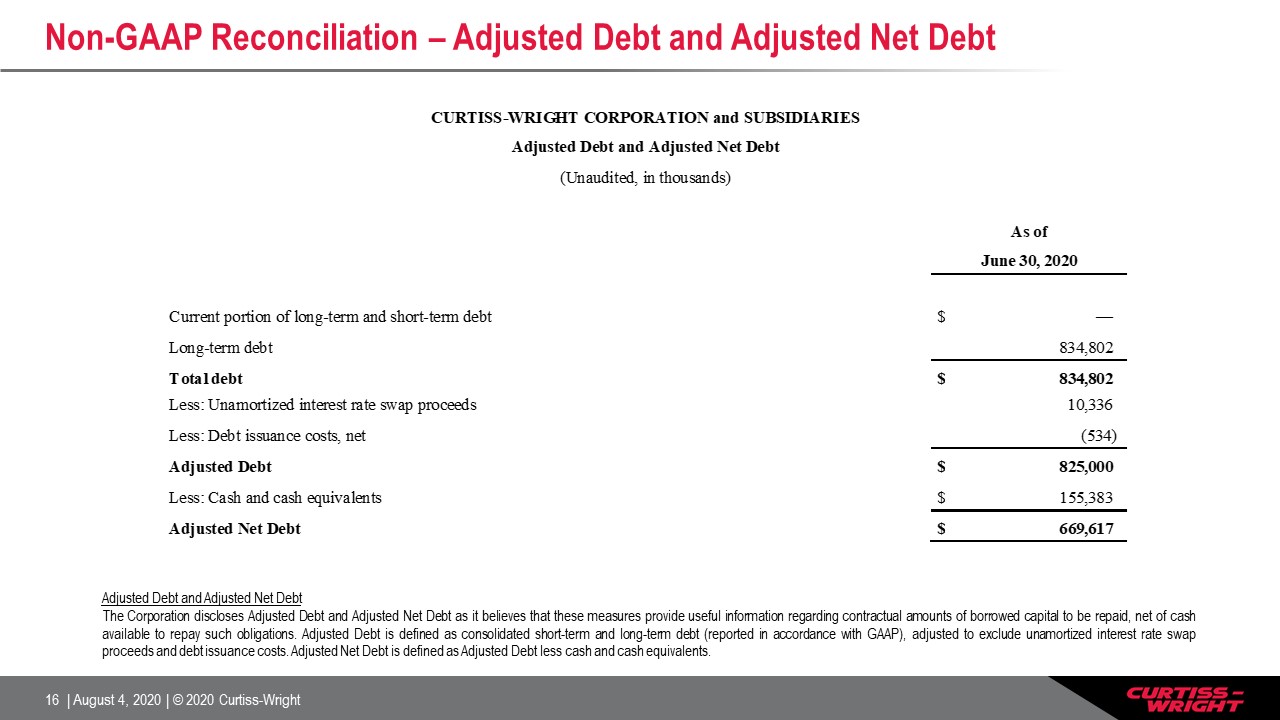
Non-GAAP Reconciliation – Adjusted Debt and Adjusted Net Debt Adjusted Debt and Adjusted Net DebtThe
Corporation discloses Adjusted Debt and Adjusted Net Debt as it believes that these measures provide useful information regarding contractual amounts of borrowed capital to be repaid, net of cash available to repay such obligations. Adjusted
Debt is defined as consolidated short-term and long-term debt (reported in accordance with GAAP), adjusted to exclude unamortized interest rate swap proceeds and debt issuance costs. Adjusted Net Debt is defined as Adjusted Debt less cash and
cash equivalents.
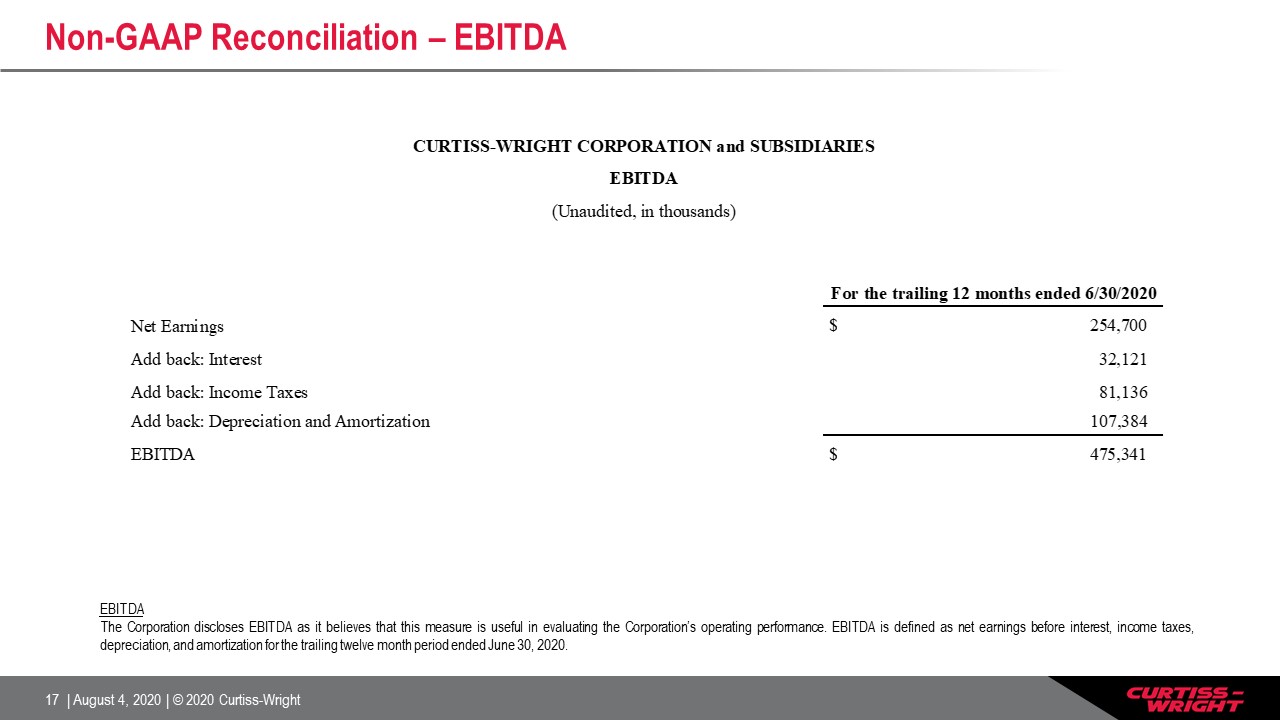
Non-GAAP Reconciliation – EBITDA EBITDAThe Corporation discloses EBITDA as it believes that this measure
is useful in evaluating the Corporation’s operating performance. EBITDA is defined as net earnings before interest, income taxes, depreciation, and amortization for the trailing twelve month period ended June 30, 2020.
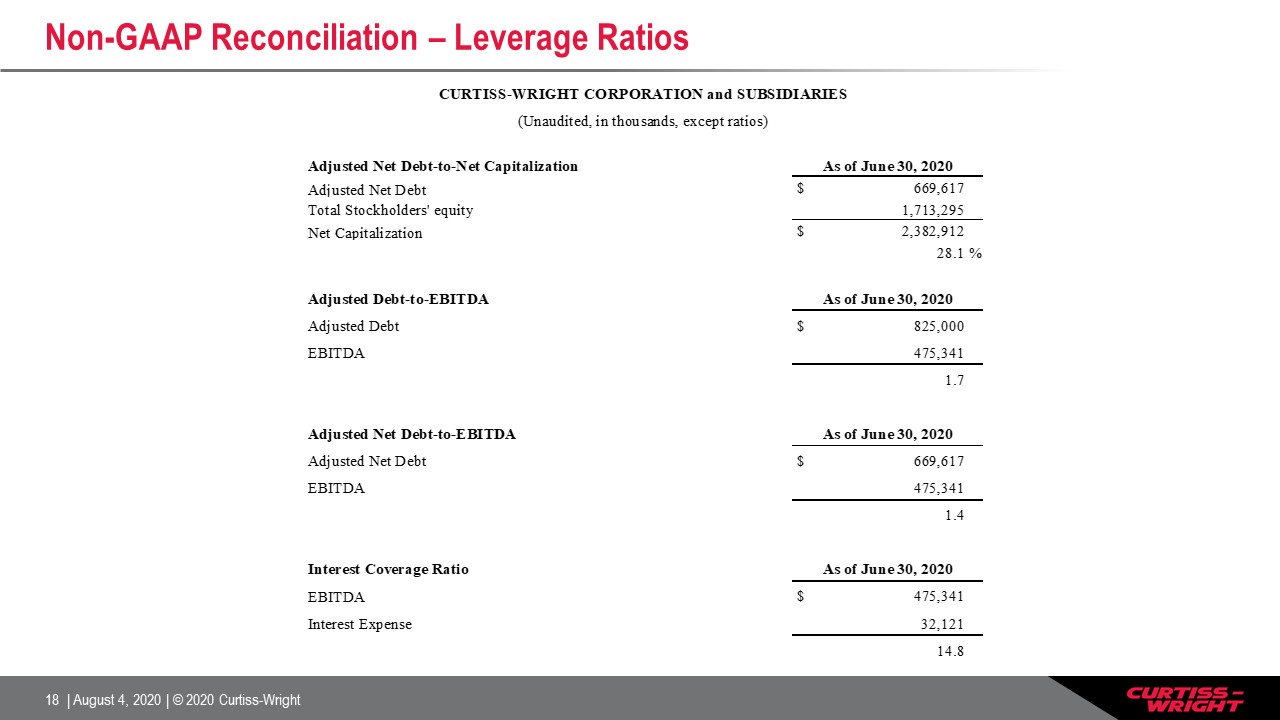
Non-GAAP Reconciliation – Leverage Ratios