Attached files
| file | filename |
|---|---|
| EX-99.1 - EXHIBIT 99.1 - Arconic Corp | a52259994ex99_1.htm |
| 8-K - ARCONIC CORPORATION 8-K - Arconic Corp | a52259994.htm |
| Exhibit 99.2 |

Second Quarter 2020 Earnings Call Tim Myers – Chief Executive OfficerErick Asmussen – Chief Financial
Officer August 4, 2020

Important Information 2 Forward-Looking Statements This presentation contains statements that relate to
future events and expectations and, as such, constitute forward-looking statements within the meaning of the Private Securities Litigation Reform Act of 1995. Forward-looking statements include those containing such words as "anticipates,"
"believes," "could," "estimates," "expects," "forecasts," "goal," "guidance," "intends," "may," "outlook," "plans," "projects," "seeks," "sees," "should," "targets," "will," "would," or other words of similar meaning. All statements that reflect
Arconic’s expectations, assumptions or projections about the future, other than statements of historical fact, are forward-looking statements, including, without limitation, forecasts and expectations relating to the growth of the aerospace,
ground transportation, industrials, building and construction and other end markets; statements and guidance regarding future financial results, operating performance, working capital, cash flows, liquidity and financial position; statements
about cost savings and restructuring programs; statements about Arconic's strategies, outlook, business and financial prospects; statements related to costs associated with pension and other post-retirement benefit plans; statements regarding
projected sources of cash flow; statements regarding potential legal liability; statements regarding the potential impact of the COVID-19 pandemic; and statements regarding actions to mitigate the impact of COVID-19. These statements reflect
beliefs and assumptions that are based on Arconic’s perception of historical trends, current conditions and expected future developments, as well as other factors Arconic believes are appropriate in the circumstances. Forward-looking statements
are not guarantees of future performance. Although Arconic believes that the expectations reflected in any forward-looking statements are based on reasonable assumptions, these expectations may not be attained and it is possible that actual
results may differ materially from those indicated by these forward-looking statements due to a variety of risks, uncertainties and changes in circumstances, many of which are beyond Arconic’s control. Such risks and uncertainties include, but
are not limited to: (a) existing and future adverse effects in connection with COVID-19; (b) the expected benefits of the separation, including the risk that dissynergy costs, costs of restructuring transactions and other costs incurred in
connection with the separation, once fully realized, will exceed our estimates; (c) the risk of operating our business as a standalone company, which could result in additional demands on Arconic’s resources, systems, procedures and controls,
disruption of its ongoing business, and diversion of management’s attention from other business concerns; (d) deterioration in global economic and financial market conditions generally; (e) unfavorable changes in the markets served by Arconic;
(f) the inability to achieve the level of revenue growth, cash generation, cost savings, improvement in profitability and margins, fiscal discipline, or strengthening of competitiveness and operations anticipated or targeted; (g) competition from
new product offerings, disruptive technologies, industry consolidation or other developments; (h) political, economic, and regulatory risks relating to Arconic’s global operations, including compliance with U.S. and foreign trade and tax laws,
sanctions, embargoes and other regulations; (i) manufacturing difficulties or other issues that impact product performance, quality or safety; (j) the inability to meet demand for our products successfully or to mitigate the impact of
cancellations of orders or reductions or delays caused by supply chain disruption; (k) a material disruption of Arconic’s operations, particularly at one or more of Arconic’s manufacturing facilities; (l) the inability to develop innovative new
products or implement technology initiatives successfully; (m) challenges to or infringements on Arconic’s intellectual property rights; (n) Arconic’s inability to realize expected benefits, in each case as planned and by targeted completion
dates, from acquisitions, divestitures, facility closures, curtailments, expansions, or joint ventures; (o) the impact of potential cyber attacks and information technology or data security breaches; (p) the loss of significant customers or
adverse changes in customers’ business or financial condition; (q) a significant downturn in the business or financial condition of a key supplier; (r) adverse changes in discount rates or investment returns on pension assets; (s) our inability
to adequately mitigate the impact of changes in aluminum prices and foreign currency exchange rates on costs and results; (t) the outcome of contingencies, including legal proceedings, government or regulatory investigations, and environmental
remediation, which can expose Arconic to substantial costs and liabilities; (u) a determination by the IRS that the distribution or certain related transactions should be treated as taxable transactions; (v) risks associated with indebtedness,
including potential restriction on our operations and the impact of events of default; and (w) the other risk factors summarized in Arconic’s Form 10-K for the year ended December 31, 2019 and other reports filed with the U.S. Securities and
Exchange Commission (SEC). The above list of factors is not exhaustive or necessarily in order of importance. Market projections are subject to the risks discussed above and other risks in the market. The statements in this presentation are made
as of the date of this presentation, even if subsequently made available by Arconic on its website or otherwise. Arconic disclaims any intention or obligation to update publicly any forward-looking statements, whether in response to new
information, future events, or otherwise, except as required by applicable law.

Important Information (cont’d) 3 Non-GAAP Financial MeasuresSome of the information included in this
presentation is derived from Arconic’s consolidated financial information but is not presented in Arconic’s financial statements prepared in accordance with accounting principles generally accepted in the United States of America (GAAP). Certain
of these financial measures are considered “non-GAAP financial measures” under SEC rules. These non-GAAP financial measures supplement our GAAP disclosures and should not be considered an alternative to any measure of performance or financial
condition as determined in accordance with GAAP, and investors should consider Arconic’s performance and financial condition as reported under GAAP and all other relevant information when assessing the performance or financial condition of
Arconic. Non-GAAP financial measures have limitations as analytical tools, and investors should not consider them in isolation or as a substitute for analysis of the results or financial condition as reported under GAAP. Non-GAAP financial
measures presented by Arconic may not be comparable to non-GAAP financial measures presented by other companies. Reconciliations to the most directly comparable GAAP financial measures and management’s rationale for the use of the non-GAAP
financial measures can be found in the schedules to this presentation.

Executive Summary 4 2Q 2020 accomplishmentsReview 2Q 2020 resultsValue creation opportunities beyond
recovery
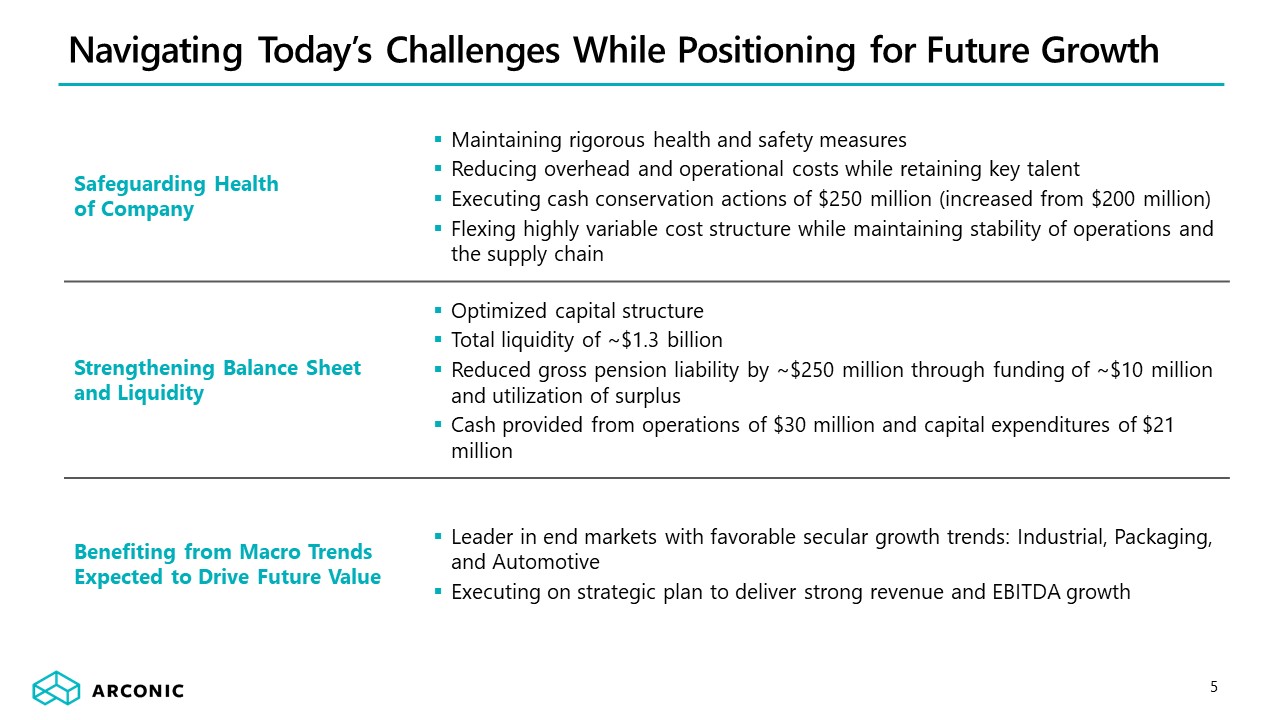
Navigating Today’s Challenges While Positioning for Future Growth 5 Safeguarding Health of
Company Maintaining rigorous health and safety measuresReducing overhead and operational costs while retaining key talentExecuting cash conservation actions of $250 million (increased from $200 million)Flexing highly variable cost structure
while maintaining stability of operations and the supply chain Strengthening Balance Sheetand Liquidity Optimized capital structureTotal liquidity of ~$1.3 billionReduced gross pension liability by ~$250 million through funding of ~$10 million
and utilization of surplusCash provided from operations of $30 million and capital expenditures of $21 million Benefiting from Macro Trends Expected to Drive Future Value Leader in end markets with favorable secular growth trends: Industrial,
Packaging, and AutomotiveExecuting on strategic plan to deliver strong revenue and EBITDA growth

Cash Conservation Actions to Mitigate COVID-19 Effects Increased to $250 million Reduced compensationCEO
salary and Directors’ annual cash retainer reduced 30%Senior management salaries reduced 20%All other salaried employees reduced 10%Reduced salaried workforce 10%Suspended 401K match for salaried employeesDecreased production and labor force at
all U.S.-based rolling and extrusion facilitiesCombination of modified schedules and work hours, lowered costs, delayed raises at all rolling mill facilities in Europe, China, and RussiaWill reduce 2020 capital expenditures by ~$50 million,
~30% 6 Actions to reduce 2020 operating costs by ~$200 million (increased from $150 million) on an annualized run-rate basis + $50 million of capital reductions will improve financial profile by ~$250 million Temporary Salary and Other Labor
Actions $100 Structural Cost Reduction Actions $100 Capital Expenditure Management $50 Total Savings $250 $M Anticipated Savings from COVID-19 Actions Executing footprint consolidation and right-sizing global operations

Overview of 2Q 2020 Results 7 2Q 2020: Cash provided from operations of $30M less capital expenditures of
$21M = consolidated free cash flow of $9M; 2Q 2019: Cash provided from operations of $38M less capital expenditures of $40M = consolidated free cash flow of ($2M).Availability of the ABL is ~$680 million as of June 30, 2020 due to working capital
changes in the quarter.See appendix for non-GAAP financial measure reconciliations. Revenue of $1.2 billion, down 38% year over year, (31%) organicallyNet loss of $92 million impacted by:$76 million of after-tax special items including the
annuitization of a U.K. pension obligation, debt issuance costs, restructuring and plant closure costsAdjusted EBITDA of $94 million, down 55% year over yearAdjusted EBITDA margin of 7.9%, down 310 bps year over yearDecremental adjusted EBITDA
margin of 16%Year-to-date decremental margin 6%Free cash flow of $9 million, up $11 million year over year1Quarter-end cash balance of $595 million, debt of $1.3 billion, and total liquidity of ~$1.3 billion2

2Q 2020 Revenue and EBITDA Decline Drivers Includes aluminum price, FX, certain employee retirement
benefit costs (non-service costs), and other items. 8 Revenue Adjusted EBITDA $M Year over Year % $M Year over Year % 2Q 2019 $1,923 $211 Price (3) - (3) (1%) Volume/Mix (549) (28%) (190) (90%) Cost
Actions - - 83 39% Divestitures (54) (3%) (5) (2%) Other1 (130) (7%) (2) (1%) 2Q 2020 $1,187 (38%) $94 (55%)

2Q 2020 End Market Overview 9 2Q 2020 Organic Revenueby End Market (57%)year over year Ground
TransportationAuto OEMs halted production resulting in a 57% organic revenue decline year over yearHeavy duty truck production continued to see pressure due to weakened end market demandAerospaceCommercial Aerospace OEMs experienced further
operational disruption beyond 737 Max leading to a 26% year over year organic revenue declineOEMs maintained significant backlogs, but experienced deferments and cancellations during the quarterIndustrial Products and OtherSales to industrial end
markets declined 16% year over year organically due to operational disruptions at customersTransition to industrial products at Tennessee plant nearing completionBuilding and ConstructionRevenue in building and construction end markets declined
20% year over year as the pandemic put a halt to construction projects around the worldPackagingPackaging end market revenue grew 2% organically year over year as demand in Russia and China remained strong and facilities continued to operate in
the second quarter (26%)year over year (16%)year over year (20%)year over year 2%year over year See appendix for non-GAAP financial measure reconciliations.
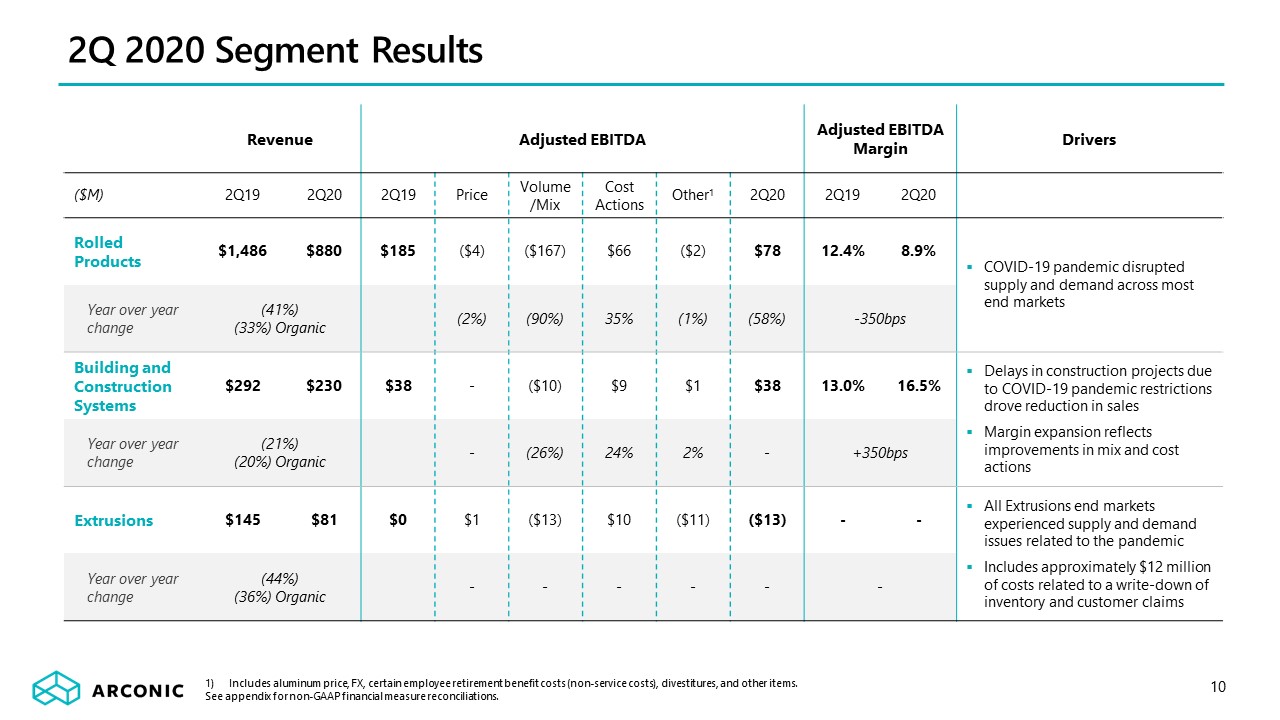
2Q 2020 Segment Results 10 Includes aluminum price, FX, certain employee retirement benefit costs
(non-service costs), divestitures, and other items. See appendix for non-GAAP financial measure reconciliations. Revenue Adjusted EBITDA Adjusted EBITDA Margin Drivers ($M) 2Q19 2Q20 2Q19 Price Volume/Mix Cost
Actions Other1 2Q20 2Q19 2Q20 Rolled Products $1,486 $880 $185 ($4) ($167) $66 ($2) $78 12.4% 8.9% COVID-19 pandemic disrupted supply and demand across most end markets Year over year change (41%)(33%)
Organic (2%) (90%) 35% (1%) (58%) -350bps Building and Construction Systems $292 $230 $38 - ($10) $9 $1 $38 13.0% 16.5% Delays in construction projects due to COVID-19 pandemic restrictions drove reduction in salesMargin
expansion reflects improvements in mix and cost actions Year over year change (21%)(20%) Organic - (26%) 24% 2% - +350bps Extrusions $145 $81 $0 $1 ($13) $10 ($11) ($13) - - All Extrusions end markets experienced
supply and demand issues related to the pandemicIncludes approximately $12 million of costs related to a write-down of inventory and customer claims Year over year change (44%)(36%) Organic - - - - - -

2H 2020 Outlook by End Market 11 Ground TransportationDown 42% (38% organic) in 1H2020 vs. 1H2019Second
half Automotive outlook approaching 2H2019 run rate; Commercial Transportation expected to be largely in-line with 1H20AerospaceDown 19% (16% organic) in 1H2020 vs. 1H2019Anticipate continued decline of similar magnitudeIndustrial Products and
OtherDown 12% (flat organic) in 1H2020 vs. 1H2019 primarily driven by divestituresVolumes expected to increase starting Q4 with the ramp up of the Tennessee investment and impact of international trade caseBuilding and ConstructionDown 18% (15%
organic) in 1H2020 vs. 1H2019Expect flat to modest decline in second halfPackagingDown 17% (2% organic) 1H2020 vs. 1H2019 primarily due to divestituresExpect to remain flat in second half 2H20 Trajectory from 1H20

Strong Balance Sheet and Liquidity Profile Provide Stability in Uncertain Environment 12 Arconic Capital
Structure ($M) Cash $595 $800 ABL facility (2025) $0 First Lien Secured Notes (2025) $700 Second Lien Secured Notes (2028) $600 Total Gross Debt $1,300 Unamortized Debt Issuance Costs ($24) Total Debt $1,276
Total Debt Net of Cash2 $681 Robust Financial Position Total Arconic Cash and ABL Availability of~$1.3 billion1 New capital structure completed in May with maturities due in 2025 and 2028Debt structure consists of high yield notes and
an undrawn $800 million asset-based lending facility1Ended the quarter with cash on hand of $595 million, total gross debt of $1.3 billion Availability of the ABL is ~$680 million as of June 30, 2020 due to working capital changes in the
quarter.Net debt is a non-GAAP financial measure. Management believes that this measure is meaningful to investors because management assesses Arconic Corporation’s leverage position after considering available cash that could be used to repay
outstanding debt.

U.K. Pension Annuitization Transaction Reduces Gross Liability by ~$250 Million 13 2Q 2020 Gross
Liability, Pension and OPEB: $4.6B 2Q 2020 Net Liability, Pension and OPEB: $1.9B Purchased group annuity contract for certain U.K. pensionersReduced gross pension liabilities ~$250 millionRequired one-time funding of ~$10 millionResulted in
~$55 million non-cash settlement charge related to the buyout premium and acceleration of legacy pension actuarial losses in equityCurrent funding will dramatically reduce liability over the next five yearsU.S. cash contribution funding level
should step down ~$80 million in 20211Actions underway to further annuitize U.S. and non-U.S. programs See appendix for U.S. pension liability estimate.

Well-Positioned to Drive Future Value for Stakeholders 14 Strategically positioned capacity including
incremental 600M lbs/year1 across the North American network requiring minimal additional capitalAttractive end markets with favorable macro trends in Industrial, Packaging, and AutomotiveLine of sight to increased casting throughput, scrap
utilization, and network debottleneckingBenefiting from $100 million of structural cost-outContinued de-levering of legacy pension, OPEB, and environmental liabilities Estimate based on 2019 actual run rate.

Packaging: Social Trends and U.S. Supply Constraints Support Can Sheet Growth 15 “Can shortage attracts
a new can maker [Canpack] to the US, meanwhile US can imports surge”Harbor AluminumJuly 16, 2020 “Another shortage! Beer, soda makers struggle with aluminum can supply, plan to limit niche drinks”USA TodayJuly 15, 2020 “Can Shortage Has
Industry Crying in Its Beer”Wall Street JournalJuly 27, 2020 Ball Corp to Launch Aluminum Cups in Retail & On-Premise StoresNasdaqMay 22, 2020 Ongoing transition from plastic packaging driving global demand for aluminum can sheet U.S.
can-sheet capacity has fallen by over 1.1 billion pounds since 2014 due to a shift to higher margin automotive sheet, creating a much tighter than historical can sheet marketArconic’s global non-compete expires October 2020, opening opportunities
for domestic production and international exports from existing Russia and China facilitiesIdle Tennessee packaging capacity can be put into service with minimal capital spend North American Can Sheet Market
Demand1 5.4 3.7 2025 2019 0.4 2021 3.6 4.0 2018 0.9 1.3 1.5 2020 3.6 2022 2023 2024 4.4 4.6 4.9 5.1 5.7 5.9 6.2 Current estimated North American capacity Harbor Aluminum, US Aluminum Rolled Products Intelligence
Report, June 2020. Regional production is currently in a deficit by ~1.2 billion pounds and more than 1 billion pounds of demand growth is expected over the next five years 5% CAGR North American can sheet market drastically under supplied by
domestic producers
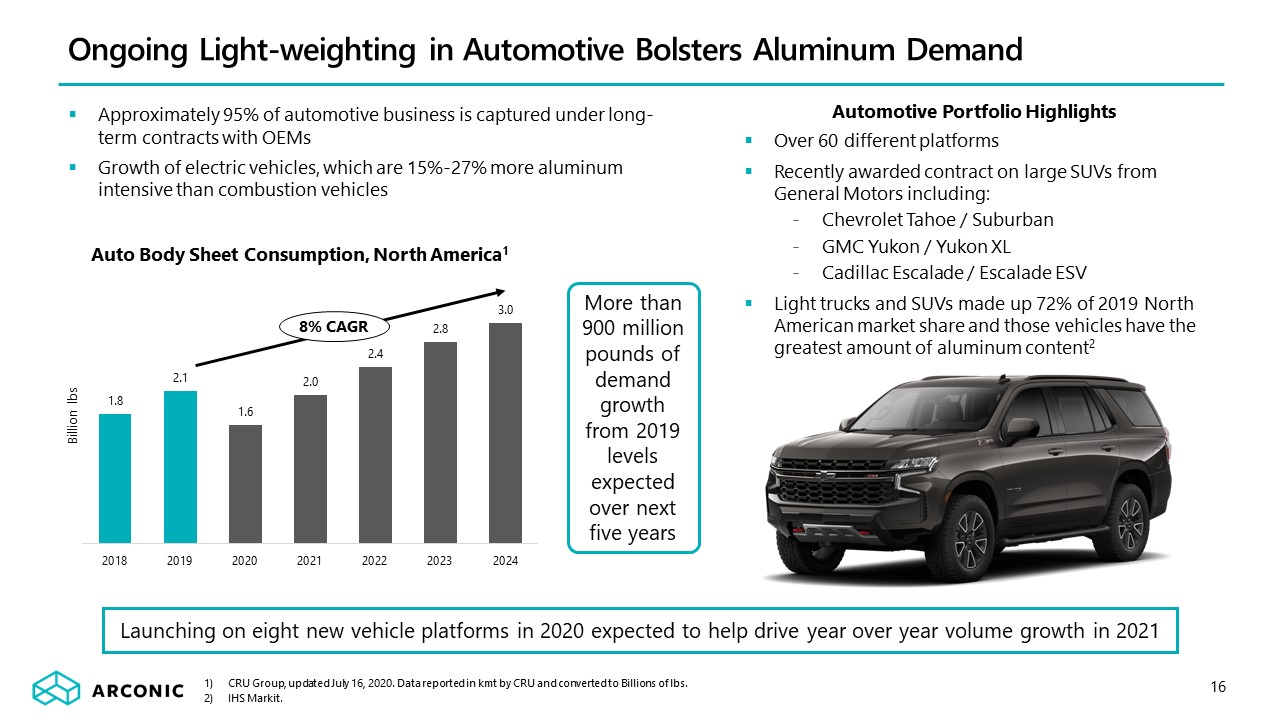
Ongoing Light-weighting in Automotive Bolsters Aluminum Demand 16 CRU Group, updated July 16, 2020. Data
reported in kmt by CRU and converted to Billions of lbs.IHS Markit. Auto Body Sheet Consumption, North America1 8% CAGR More than 900 million pounds of demand growth from 2019 levels expected over next five years Approximately 95% of
automotive business is captured under long-term contracts with OEMsGrowth of electric vehicles, which are 15%-27% more aluminum intensive than combustion vehicles Over 60 different platformsRecently awarded contract on large SUVs from General
Motors including:Chevrolet Tahoe / SuburbanGMC Yukon / Yukon XLCadillac Escalade / Escalade ESVLight trucks and SUVs made up 72% of 2019 North American market share and those vehicles have the greatest amount of aluminum content2 Automotive
Portfolio Highlights Launching on eight new vehicle platforms in 2020 expected to help drive year over year volume growth in 2021
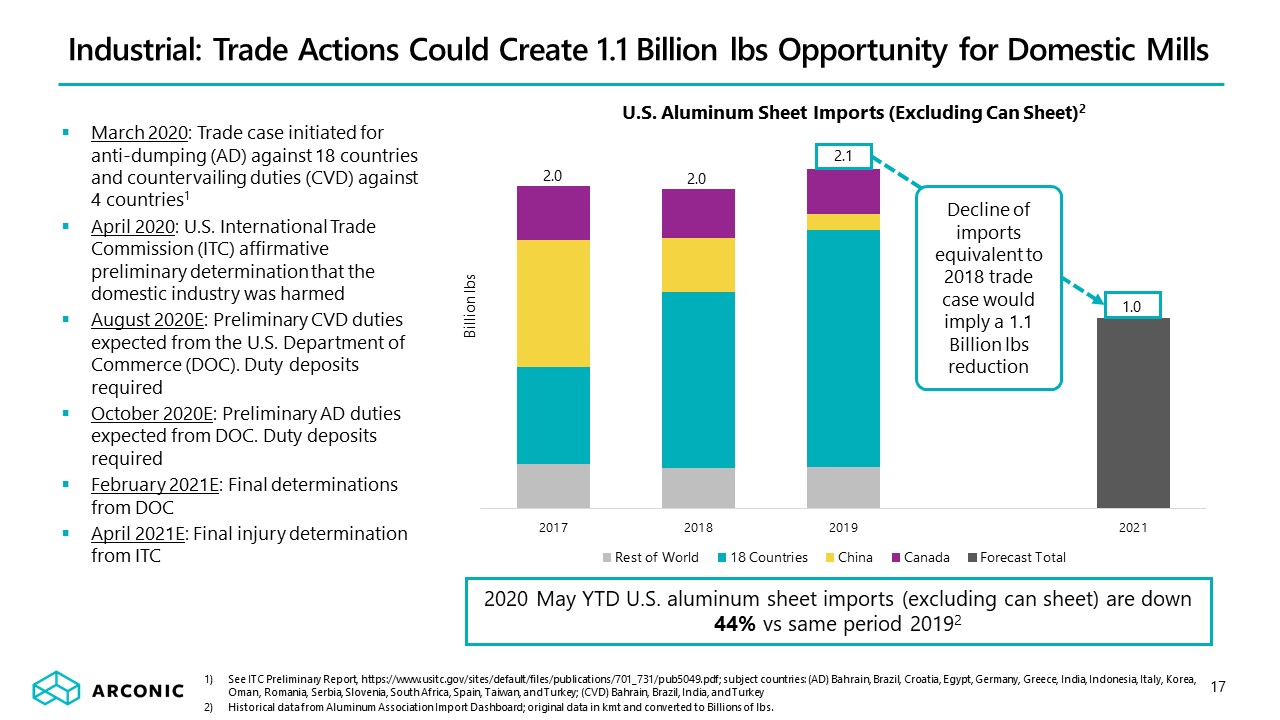
Industrial: Trade Actions Could Create 1.1 Billion lbs Opportunity for Domestic Mills 17 March 2020:
Trade case initiated for anti-dumping (AD) against 18 countries and countervailing duties (CVD) against 4 countries1April 2020: U.S. International Trade Commission (ITC) affirmative preliminary determination that the domestic industry was
harmedAugust 2020E: Preliminary CVD duties expected from the U.S. Department of Commerce (DOC). Duty deposits requiredOctober 2020E: Preliminary AD duties expected from DOC. Duty deposits requiredFebruary 2021E: Final determinations from DOCApril
2021E: Final injury determination from ITC U.S. Aluminum Sheet Imports (Excluding Can Sheet)2 See ITC Preliminary Report, https://www.usitc.gov/sites/default/files/publications/701_731/pub5049.pdf; subject countries: (AD) Bahrain, Brazil,
Croatia, Egypt, Germany, Greece, India, Indonesia, Italy, Korea, Oman, Romania, Serbia, Slovenia, South Africa, Spain, Taiwan, and Turkey; (CVD) Bahrain, Brazil, India, and TurkeyHistorical data from Aluminum Association Import Dashboard;
original data in kmt and converted to Billions of lbs. 2.1 1.0 2.0 Decline of imports equivalent to 2018 trade case would imply a 1.1 Billion lbs reduction 2.0 2020 May YTD U.S. aluminum sheet imports (excluding can sheet) are down 44% vs
same period 20192
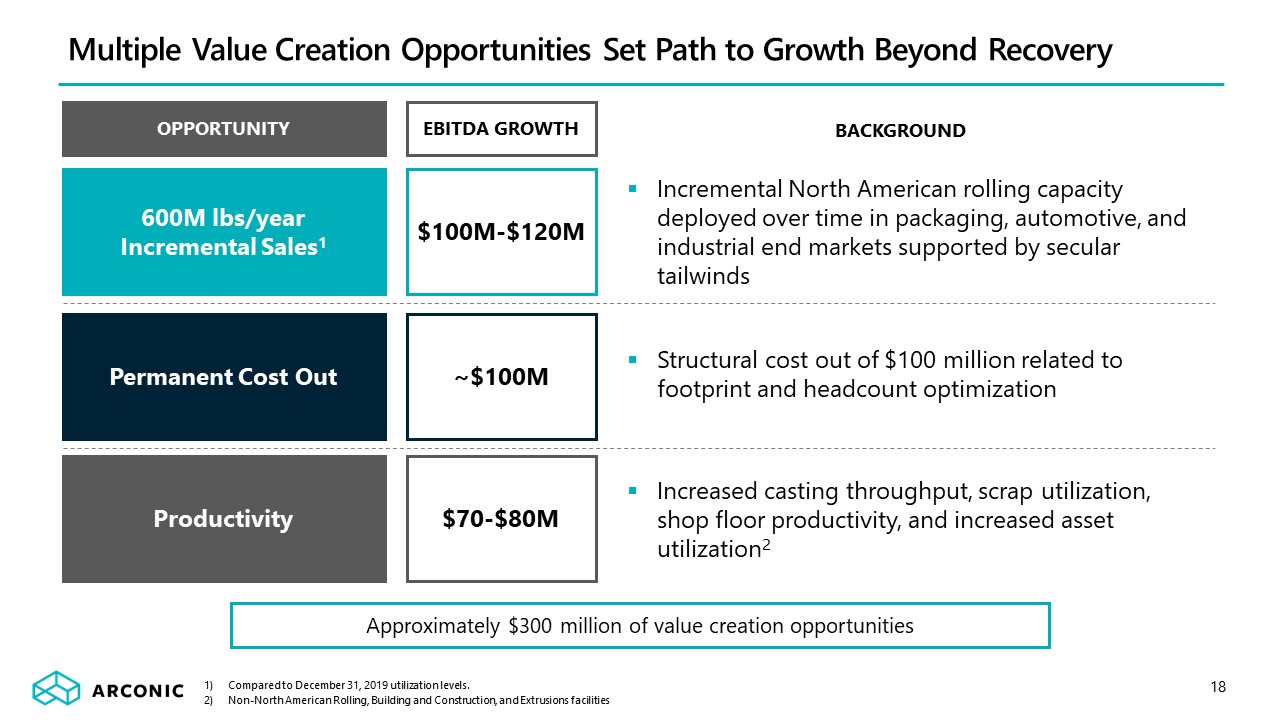
Multiple Value Creation Opportunities Set Path to Growth Beyond Recovery 18 600M lbs/yearIncremental
Sales1 $100M-$120M Incremental North American rolling capacity deployed over time in packaging, automotive, and industrial end markets supported by secular tailwinds Productivity $70-$80M Increased casting throughput, scrap utilization, shop
floor productivity, and increased asset utilization2 Approximately $300 million of value creation opportunities Permanent Cost Out ~$100M Structural cost out of $100 million related to footprint and headcount optimization EBITDA
GROWTH OPPORTUNITY Compared to December 31, 2019 utilization levels.Non-North American Rolling, Building and Construction, and Extrusions facilities BACKGROUND

Arconic is Taking Action to Drive Sustainable Improvements 19 2Q 2020 accomplishmentsExecuted separation
on April 1Implemented $250 million cash conservation programRefinanced capital structure to improve liquidity and flexibilityReduced gross pension liability by ~$250 million 2Q 2020 resultsGenerated free cash flow and preserved cash balanceFlexed
highly variable cost structure and took actions to permanently reduce fixed costsValue creation opportunities beyond recoveryArconic is well-positioned to grow EBITDA and free cash flow as the Company captures its share of end market tailwinds
and as Aerospace improves over time

Appendix

Current Funding Should Meaningfully Reduce ~$1.3B U.S. Pension Liability 22 Annualized Asset
Return1,2 Funded StatusYear 1(12/2020) Funded StatusYear 2(12/2021) Funded StatusYear 3(12/2022) Funded StatusYear 4(12/2023) Funded StatusYear
5(12/2024) 4% ($1,218M) ($1,080M) ($934M) ($781M) ($621M) 6% ($1,195M) ($1,009M) ($814M) ($615M) ($414M) 8% ($1,172M) ($937M) ($690M) ($441M) ($193M) Range of ExpectedAnnual U.S. Pension
Contributions3 $260M $178M-$181M $177M-$185M $168M-$188M $153M-$190M Estimated U.S. Pension Plan Funded Status Current funding will dramatically reduce liability over the next five years Source: Buck & Mercer Investments, LLC.Discount
rates based on the 6/30/2020 yield curve, resulting in a weighted average discount rate of 2.77%.The 2020 full-year return is a combination of the actual YTD return as of 6/30/2020 and the assumed return as noted above. This results in the
following 2020 returns: 7.5%, 8.5%, and 9.5% for the 4%, 6%, and 8% return scenarios, respectively.Minimum required contributions are paid in all years; all contributions payable during 2020 are made on the last day of the year; no potential risk
management activity, such as annuity buyouts, are taken into account; the range of contributions shown are for asset returns between 4% and 8%.All other assumptions, methods, plan provisions, and data are the same as those used for the 2020
expense valuation.
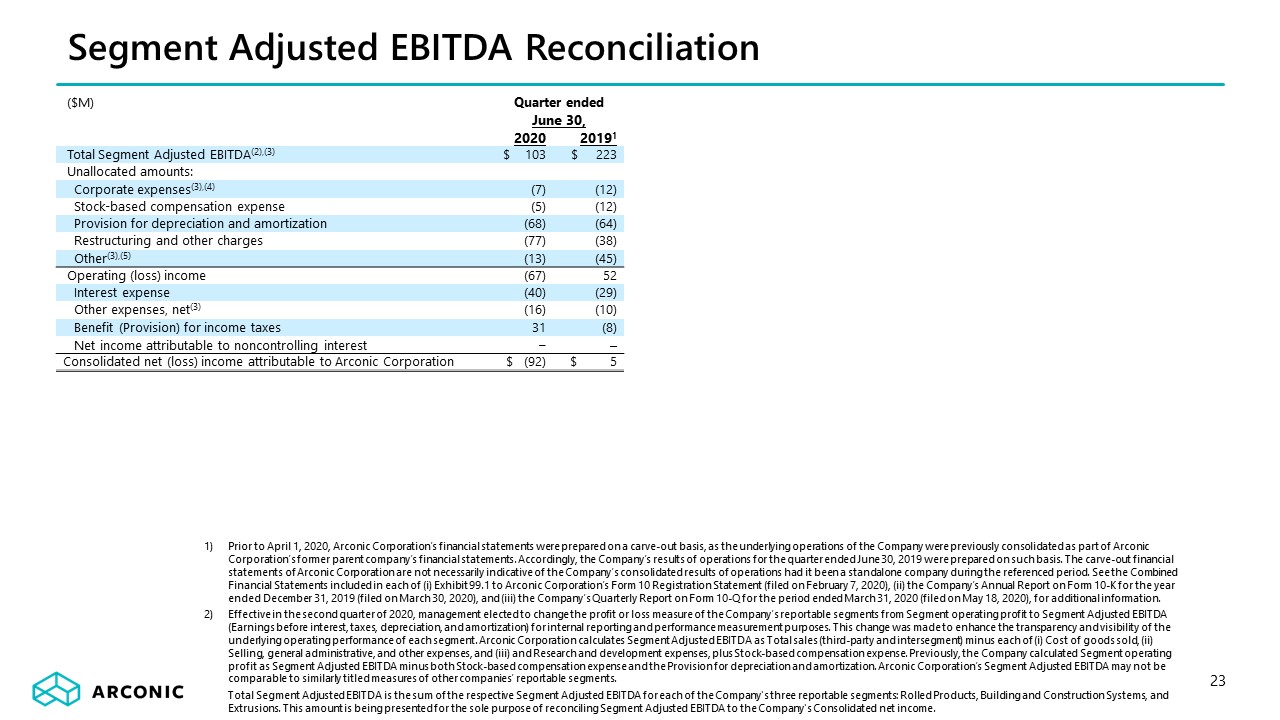
23 ($M) Quarter ended June 30, 2020 20191 Total Segment Adjusted EBITDA(2),(3) $
103 $ 223 Unallocated amounts: Corporate expenses(3),(4) (7) (12) Stock-based compensation expense (5) (12) Provision for depreciation and amortization (68) (64) Restructuring and other charges (77) (38)
Other(3),(5) (13) (45) Operating (loss) income (67) 52 Interest expense (40) (29) Other expenses, net(3) (16) (10) Benefit (Provision) for income taxes 31 (8) Net income attributable to noncontrolling
interest – – Consolidated net (loss) income attributable to Arconic Corporation $ (92) $ 5 Segment Adjusted EBITDA Reconciliation Prior to April 1, 2020, Arconic Corporation’s financial statements were prepared on a
carve-out basis, as the underlying operations of the Company were previously consolidated as part of Arconic Corporation’s former parent company’s financial statements. Accordingly, the Company’s results of operations for the quarter ended June
30, 2019 were prepared on such basis. The carve-out financial statements of Arconic Corporation are not necessarily indicative of the Company’s consolidated results of operations had it been a standalone company during the referenced period. See
the Combined Financial Statements included in each of (i) Exhibit 99.1 to Arconic Corporation’s Form 10 Registration Statement (filed on February 7, 2020), (ii) the Company’s Annual Report on Form 10-K for the year ended December 31, 2019 (filed
on March 30, 2020), and (iii) the Company’s Quarterly Report on Form 10-Q for the period ended March 31, 2020 (filed on May 18, 2020), for additional information.Effective in the second quarter of 2020, management elected to change the profit or
loss measure of the Company’s reportable segments from Segment operating profit to Segment Adjusted EBITDA (Earnings before interest, taxes, depreciation, and amortization) for internal reporting and performance measurement purposes. This change
was made to enhance the transparency and visibility of the underlying operating performance of each segment. Arconic Corporation calculates Segment Adjusted EBITDA as Total sales (third-party and intersegment) minus each of (i) Cost of goods
sold, (ii) Selling, general administrative, and other expenses, and (iii) and Research and development expenses, plus Stock-based compensation expense. Previously, the Company calculated Segment operating profit as Segment Adjusted EBITDA minus
both Stock-based compensation expense and the Provision for depreciation and amortization. Arconic Corporation’s Segment Adjusted EBITDA may not be comparable to similarly titled measures of other companies’ reportable segments.Total Segment
Adjusted EBITDA is the sum of the respective Segment Adjusted EBITDA for each of the Company's three reportable segments: Rolled Products, Building and Construction Systems, and Extrusions. This amount is being presented for the sole purpose of
reconciling Segment Adjusted EBITDA to the Company's Consolidated net income.
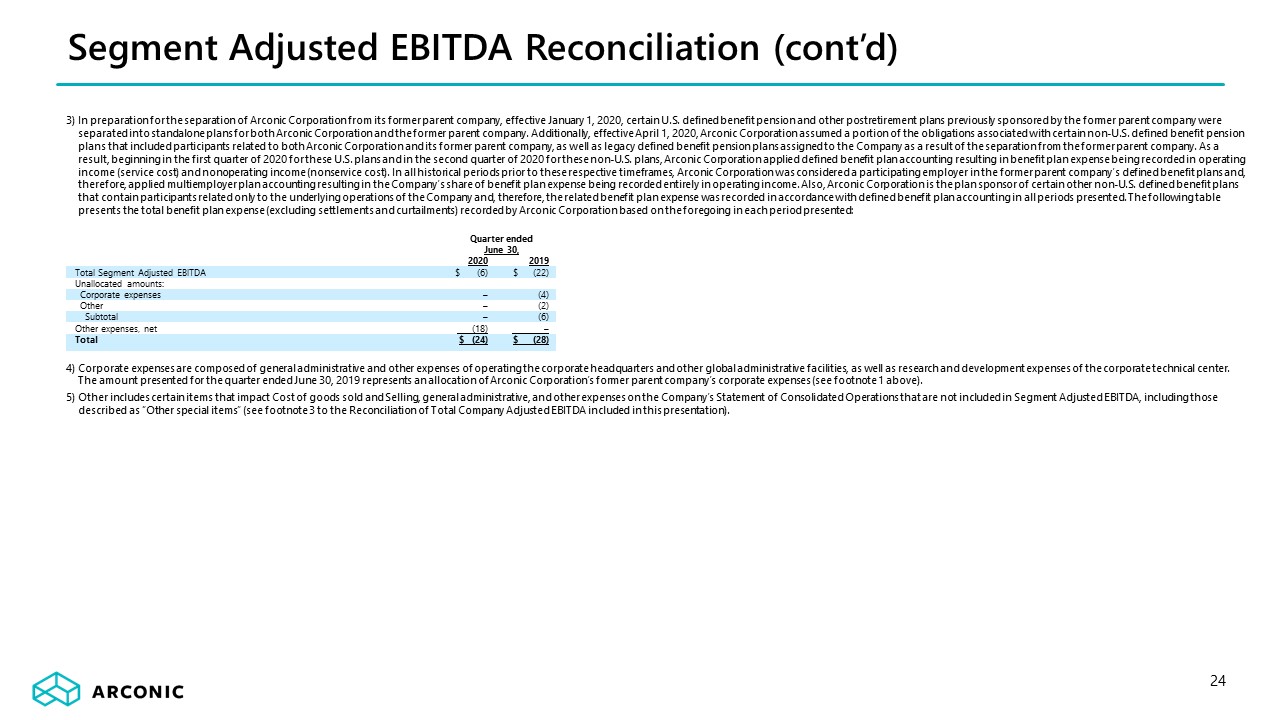
3) In preparation for the separation of Arconic Corporation from its former parent company, effective
January 1, 2020, certain U.S. defined benefit pension and other postretirement plans previously sponsored by the former parent company were separated into standalone plans for both Arconic Corporation and the former parent company. Additionally,
effective April 1, 2020, Arconic Corporation assumed a portion of the obligations associated with certain non-U.S. defined benefit pension plans that included participants related to both Arconic Corporation and its former parent company, as well
as legacy defined benefit pension plans assigned to the Company as a result of the separation from the former parent company. As a result, beginning in the first quarter of 2020 for these U.S. plans and in the second quarter of 2020 for these
non-U.S. plans, Arconic Corporation applied defined benefit plan accounting resulting in benefit plan expense being recorded in operating income (service cost) and nonoperating income (nonservice cost). In all historical periods prior to these
respective timeframes, Arconic Corporation was considered a participating employer in the former parent company’s defined benefit plans and, therefore, applied multiemployer plan accounting resulting in the Company’s share of benefit plan expense
being recorded entirely in operating income. Also, Arconic Corporation is the plan sponsor of certain other non-U.S. defined benefit plans that contain participants related only to the underlying operations of the Company and, therefore, the
related benefit plan expense was recorded in accordance with defined benefit plan accounting in all periods presented. The following table presents the total benefit plan expense (excluding settlements and curtailments) recorded by Arconic
Corporation based on the foregoing in each period presented:4) Corporate expenses are composed of general administrative and other expenses of operating the corporate headquarters and other global administrative facilities, as well as research
and development expenses of the corporate technical center. The amount presented for the quarter ended June 30, 2019 represents an allocation of Arconic Corporation’s former parent company’s corporate expenses (see footnote 1 above).5) Other
includes certain items that impact Cost of goods sold and Selling, general administrative, and other expenses on the Company’s Statement of Consolidated Operations that are not included in Segment Adjusted EBITDA, including those described as
“Other special items” (see footnote 3 to the Reconciliation of Total Company Adjusted EBITDA included in this presentation). 24 Segment Adjusted EBITDA Reconciliation (cont’d) Quarter endedJune 30, 2020 2019 Total Segment
Adjusted EBITDA $ (6) $ (22) Unallocated amounts: Corporate expenses – (4) Other – (2) Subtotal – (6) Other expenses, net (18) – Total $ (24) $ (28)

25 Quarter ended Six months ended June 30, 2020 June 30, 2019(1) June 30, 2020 June 30,
2019(1) ($M) Net (loss) income attributable to Arconic Corporation $ (92) $ 5 $ (32) $ 46 Add: Net income attributable to noncontrolling interest - - - - (Benefit) Provision for income
taxes (31) 8 - 33 Other expenses, net(2) 16 10 42 (4) Interest expense 40 29 75 57 Restructuring and other charges 77 38 58 40 Provision for depreciation and amortization 68 64 128 127 Stock-based compensation 5
12 12 18 Other special items(3) 11 45 29 50 Adjusted EBITDA(2) $ 94 $ 211 $ 312 $ 367 Revenue $ 1,187 $1,923 $ 2,798 $3,764 Adjusted EBITDA Margin 7.9% 11.0% 11.2% 9.8% Year over year change in revenue $
(736) $ (966) Year over year change in Adjusted EBITDA $ (117) $ (55) Decremental Adjusted EBITDA margin 16% 6% Arconic Corporation’s definition of Adjusted EBITDA (Earnings before interest, taxes, depreciation, and
amortization) is net margin plus an add-back for the following items: Provision for depreciation and amortization; Stock-based compensation; and Other special items. Net margin is equivalent to Sales minus the following items: Cost of goods sold;
Selling, general administrative, and other expenses; Research and development expenses; and Provision for depreciation and amortization. Special items are composed of restructuring and other charges, discrete income tax items, and other items as
deemed appropriate by management. There can be no assurances that additional special items will not occur in future periods. Adjusted EBITDA is a non-GAAP financial measure. Management believes that this measure is meaningful to investors because
Adjusted EBITDA provides additional information with respect to Arconic Corporation’s operating performance and the Company’s ability to meet its financial obligations. The Adjusted EBITDA presented may not be comparable to similarly titled
measures of other companies.Prior to April 1, 2020, Arconic Corporation’s financial statements were prepared on a carve-out basis, as the underlying operations of the Company were previously consolidated as part of Arconic Corporation’s former
parent company’s financial statements. Accordingly, the Company’s results of operations for the quarter ended June 30, 2019, were prepared on such basis. The carve-out financial statements of Arconic Corporation are not necessarily indicative of
the Company’s consolidated results of operations had it been a standalone company during the referenced periods. See the Combined Financial Statements included in each of (i) Exhibit 99.1 to Arconic Corporation’s Form 10 Registration Statement
(filed on February 7, 2020), (ii) the Company’s Annual Report on Form 10-K for the year ended December 31, 2019 (filed on March 30, 2020), and (iii) the Company’s Quarterly Report on Form 10-Q for the period ended March 31, 2020 (filed on May 18,
2020), for additional information. Reconciliation of Total Company Adjusted EBITDA

2) In preparation for the separation of Arconic Corporation from its former parent company, effective
January 1, 2020, certain U.S. defined benefit pension and other postretirement plans previously sponsored by the former parent company were separated into standalone plans for both Arconic Corporation and the former parent company. Additionally,
effective April 1, 2020, Arconic Corporation assumed a portion of the obligations associated with certain non-U.S. defined benefit pension plans that included participants related to both Arconic Corporation and its former parent company, as well
as legacy defined benefit pension plans assigned to the Company as a result of the separation from the former parent company. As a result, beginning in the first quarter of 2020 for these U.S. plans and in the second quarter of 2020 for these
non-U.S. plans, Arconic Corporation applied defined benefit plan accounting resulting in benefit plan expense being recorded in operating income (service cost) and nonoperating income (nonservice cost). In all historical periods prior to these
respective timeframes, Arconic Corporation was considered a participating employer in the former parent company’s defined benefit plans and, therefore, applied multiemployer plan accounting resulting in the Company’s share of benefit plan expense
being recorded entirely in operating income. Also, Arconic Corporation is the plan sponsor of certain other non-U.S. defined benefit plans that contain participants related only to the underlying operations of the Company and, therefore, the
related benefit plan expense was recorded in accordance with defined benefit plan accounting in all periods presented. The following table presents the total benefit plan expense (excluding settlements and curtailments) recorded by Arconic
Corporation based on the foregoing in each period presented:3) Other special items include the following: for the quarter ended June 30, 2020, costs related to several legal matters, including customer settlement ($5), Grenfell Tower ($3), and
other ($3); for the quarter ended June 30, 2019, a charge for an ongoing environmental remediation matter referred to as Grasse River ($25) and an allocation of costs incurred by Arconic Corporation’s former parent company associated with the
following matters: the April 1, 2020 separation of Arconic Inc. into two standalone publicly-traded companies ($9), negotiation of a collective bargaining agreement with the United Steelworkers ($9), and a legal matter referred to as Grenfell
Tower ($2);for the six months ended June 30, 2020: an allocation of costs incurred by Arconic Corporation’s former parent company associated with the April 1, 2020 separation of Arconic Inc. into two standalone publicly-traded companies ($18)
and costs related to several legal matters, including customer settlement ($5), Grenfell Tower ($3), and other ($3);for the six months ended June 30, 2019: a charge for an ongoing environmental remediation matter referred to as Grasse River
($25) and an allocation of costs incurred by Arconic Corporation’s former parent company associated with the following matters: the April 1, 2020 separation of Arconic Inc. into two standalone publicly-traded companies ($10), negotiation of a
collective bargaining agreement with the United Steelworkers ($9), a legal matter referred to as Grenfell Tower ($3), and a company-wide strategy and portfolio review by management ($3). 26 Quarter ended Six months ended June 30,
2020 June 30, 2019 June 30, 2020 June 30, 2019 Cost of goods sold $ 6 $ 24 $11 $47 Selling, general administrative, and other expenses – 3 – 7 Research and development expenses – 1 – 1 Other expenses, net 18 –
39 1 $ 24 $ 28 $ 50 $ 56 Reconciliation of Total Company Adjusted EBITDA (cont’d)

27 Quarter ended March 31, 2019(1) June 30, 2019(1) September 30, 2019(1) December 30,
2019(1) March 31,2020 June 30, 2020 ($M) Net income (loss) attributable to Arconic Corporation $ 41 $ 5 $ (7) $ 186 $ 60 $ (92) Add: Provision (Benefit) for income
taxes 25 8 22 (103) 31 (31) Other (income) expenses, net(2) (14) 10 - (11) 26 16 Interest expense 28 29 29 29 35 40 Restructuring and other charges 2 38 64 (17) (19) 77 Provision for depreciation and
amortization 63 64 63 62 60 68 Stock-based compensation 6 12 10 12 7 5 Other special items(3) 5 45 13 18 18 11 Adjusted EBITDA(2) $ 156 $ 211 $ 194 $ 176 $ 218 $ 94 Pension/OPEB non-service costs (4)
22 21 22 21 (1) - Adjusted EBITDA, excluding non-service costs(2) $ 178 $ 232 $ 216 $ 197 $ 217 $ 94 Long-term debt $ 1,276 Less: Cash and cash equivalents 595 Net Debt(5) $
681 Net Debt to Trailing Twelve Months Adjusted EBITDA, excluding non-service costs 0.94 Arconic Corporation’s definition of Adjusted EBITDA (Earnings before interest, taxes, depreciation, and amortization) is net
margin plus an add-back for the following items: Provision for depreciation and amortization; Stock-based compensation; and Other special items. Net margin is equivalent to Sales minus the following items: Cost of goods sold; Selling, general
administrative, and other expenses; Research and development expenses; and Provision for depreciation and amortization. Special items are composed of restructuring and other charges, discrete income tax items, and other items as deemed
appropriate by management. There can be no assurances that additional special items will not occur in future periods. Adjusted EBITDA is a non-GAAP financial measure. Management believes that this measure is meaningful to investors because
Adjusted EBITDA provides additional information with respect to Arconic Corporation’s operating performance and the Company’s ability to meet its financial obligations. The Adjusted EBITDA presented may not be comparable to similarly titled
measures of other companies.Prior to April 1, 2020, Arconic Corporation’s financial statements were prepared on a carve-out basis, as the underlying operations of the Company were previously consolidated as part of Arconic Corporation’s former
parent company’s financial statements. The carve-out financial statements of Arconic Corporation are not necessarily indicative of the Company’s consolidated results of operations had it been a standalone company during the referenced periods.
See the Combined Financial Statements included in each of (i) Exhibit 99.1 to Arconic Corporation’s Form 10 Registration Statement (filed on February 7, 2020), (ii) the Company’s Annual Report on Form 10-K for the year ended December 31, 2019
(filed on March 30, 2020), and (iii) the Company’s Quarterly Report on Form 10-Q for the period ended March 31, 2020 (filed on May 18, 2020), for additional information. Reconciliation of Net Debt to Adjusted EBITDA, excluding non-service costs

2) In preparation for the separation of Arconic Corporation from its former parent company, effective
January 1, 2020, certain U.S. defined benefit pension and other postretirement plans previously sponsored by the former parent company were separated into standalone plans for both Arconic Corporation and the former parent company. Additionally,
effective April 1, 2020, Arconic Corporation assumed a portion of the obligations associated with certain non-U.S. defined benefit pension plans that included participants related to both Arconic Corporation and its former parent company, as well
as legacy defined benefit pension plans assigned to the Company as a result of the separation from the former parent company. As a result, beginning in the first quarter of 2020 for these U.S. plans and in the second quarter of 2020 for these
non-U.S. plans, Arconic Corporation applied defined benefit plan accounting resulting in benefit plan expense being recorded in operating income (service cost) and nonoperating income (nonservice cost). In all historical periods prior to these
respective timeframes, Arconic Corporation was considered a participating employer in the former parent company’s defined benefit plans and, therefore, applied multiemployer plan accounting resulting in the Company’s share of benefit plan expense
being recorded entirely in operating income. Also, Arconic Corporation is the plan sponsor of certain other non-U.S. defined benefit plans that contain participants related only to the underlying operations of the Company and, therefore, the
related benefit plan expense was recorded in accordance with defined benefit plan accounting in all periods presented.3) Other special items include the following: for the quarter ended March 31, 2019, an allocation of costs incurred by Arconic
Corporation’s former parent company associated with the following matters: the April 1, 2020 separation of Arconic Inc. into two standalone publicly-traded companies ($1), a legal matter referred to as Grenfell Tower ($1), and a company-wide
strategy and portfolio review by management ($3); for the quarter ended June 30, 2019, a charge for an ongoing environmental remediation matter referred to as Grasse River ($25) and an allocation of costs incurred by Arconic Corporation’s former
parent company associated with the following matters: the April 1, 2020 separation of Arconic Inc. into two standalone publicly-traded companies ($9), negotiation of a collective bargaining agreement with the United Steelworkers ($9), and a legal
matter referred to as Grenfell Tower ($2); for the quarter ended September 30, 2019, an allocation of costs incurred by Arconic Corporation’s former parent company associated with the April 1, 2020 separation of Arconic Inc. into two standalone
publicly-traded companies ($13); for the quarter ended December 31, 2019, an allocation of costs incurred by Arconic Corporation’s former parent company associated with the April 1, 2020 separation of Arconic Inc. into two standalone
publicly-traded companies ($17) and a legal matter referred to as Grenfell Tower ($1); for the quarter ended March 31, 2020, an allocation of costs incurred by Arconic Corporation’s former parent company associated with the April 1, 2020
separation of Arconic Inc. into two standalone publicly-traded companies ($18), and for the quarter ended June 30, 2020, costs related to several legal matters, including customer settlement ($5), Grenfell Tower ($3), and other ($3).4) This
adjustment reflects a proxy of non-service cost associated with certain defined benefit pension and other postretirement plan obligations had standalone plans existed for all the Company’s participants instead of participating in defined benefit
plans sponsored by Arconic Corporation’s former parent company (see footnote 2 above).5) Net debt is a non-GAAP financial measure. Management believes that this measure is meaningful to investors because management assesses Arconic Corporation’s
leverage position after considering available cash that could be used to repay outstanding debt. 28 Reconciliation of Net Debt to Adjusted EBITDA, excluding non-service costs (Cont’d)
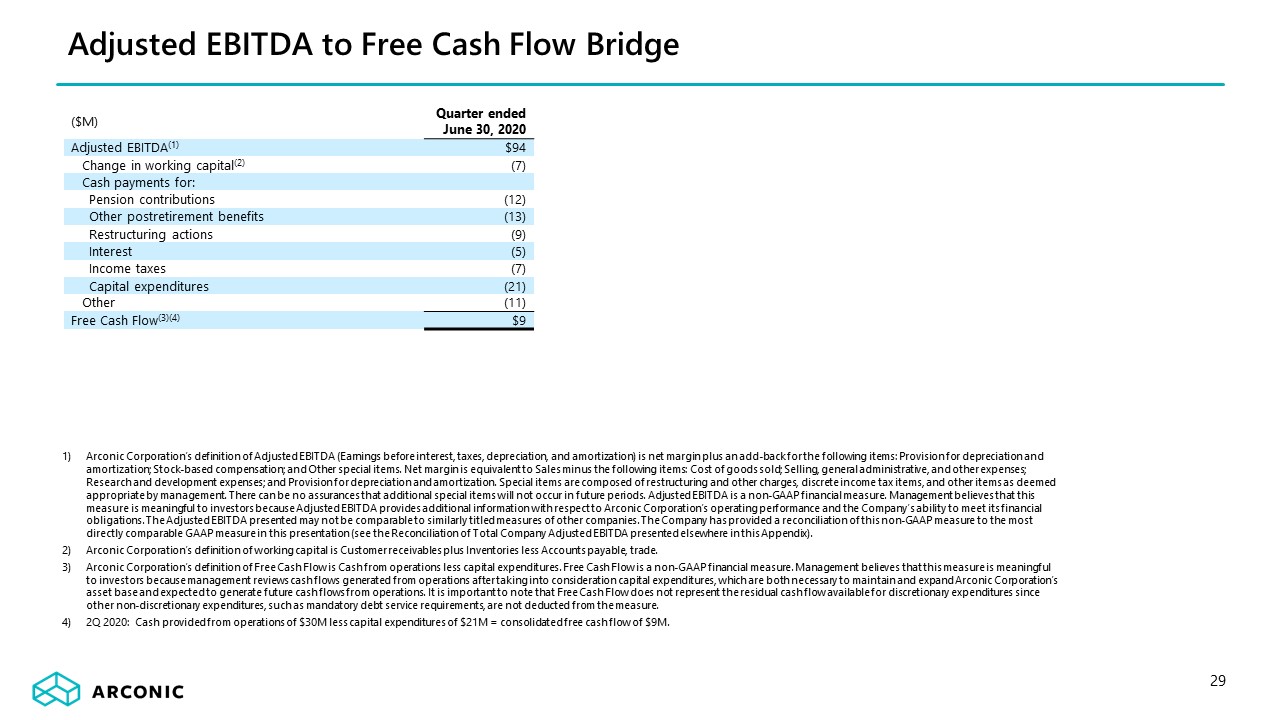
29 Adjusted EBITDA to Free Cash Flow Bridge ($M) Quarter endedJune 30, 2020 Adjusted EBITDA(1) $94
Change in working capital(2) (7) Cash payments for: Pension contributions (12) Other postretirement benefits (13) Restructuring actions (9) Interest (5) Income taxes (7) Capital expenditures (21) Other (11) Free Cash
Flow(3)(4) $9 Arconic Corporation’s definition of Adjusted EBITDA (Earnings before interest, taxes, depreciation, and amortization) is net margin plus an add-back for the following items: Provision for depreciation and amortization; Stock-based
compensation; and Other special items. Net margin is equivalent to Sales minus the following items: Cost of goods sold; Selling, general administrative, and other expenses; Research and development expenses; and Provision for depreciation and
amortization. Special items are composed of restructuring and other charges, discrete income tax items, and other items as deemed appropriate by management. There can be no assurances that additional special items will not occur in future
periods. Adjusted EBITDA is a non-GAAP financial measure. Management believes that this measure is meaningful to investors because Adjusted EBITDA provides additional information with respect to Arconic Corporation’s operating performance and the
Company’s ability to meet its financial obligations. The Adjusted EBITDA presented may not be comparable to similarly titled measures of other companies. The Company has provided a reconciliation of this non-GAAP measure to the most directly
comparable GAAP measure in this presentation (see the Reconciliation of Total Company Adjusted EBITDA presented elsewhere in this Appendix). Arconic Corporation’s definition of working capital is Customer receivables plus Inventories less
Accounts payable, trade.Arconic Corporation’s definition of Free Cash Flow is Cash from operations less capital expenditures. Free Cash Flow is a non-GAAP financial measure. Management believes that this measure is meaningful to investors because
management reviews cash flows generated from operations after taking into consideration capital expenditures, which are both necessary to maintain and expand Arconic Corporation’s asset base and expected to generate future cash flows from
operations. It is important to note that Free Cash Flow does not represent the residual cash flow available for discretionary expenditures since other non-discretionary expenditures, such as mandatory debt service requirements, are not deducted
from the measure. 2Q 2020: Cash provided from operations of $30M less capital expenditures of $21M = consolidated free cash flow of $9M.

Reconciliation of Total Company Organic Revenue by End Market 30 ($M) Ground Transportation Building
and Construction Aerospace Packaging Industrial Products and Other Total 2Q19 Revenue $666 $345 $344 $241 $327 $1,923 Less: Sales – Itapissuma 3 6 — 25 8 42 Sales –
Changwon — — 9 — 4 13 Organic Revenue $663 $339 $335 $216 $315 $1,868 2Q20 Revenue $257 $263 $237 $195 $239 $1,191 Less: Aluminum price impact (23) (6) (9) (22) (18) (78)
Foreign currency impact (2) (2) (1) (3) (8) (16) Organic Revenue $282 $271 $247 $220 $265 $1,285 Organic revenue is a non-GAAP financial measure. Management believes this measure is meaningful to investors as it presents revenue on
a comparable basis for all periods presented due to the impact of the sale of an aluminum rolling mill in Brazil (divested in February 2020), the sale of a hard alloy extrusions plant in South Korea (divested in March 2020), and the impact of
changes in aluminum prices and foreign currency fluctuations relative to the prior year period. Ground Transportation Building and Construction Aerospace Packaging Industrial Products and
Other Total 1H19 Revenue $1,348 $675 $664 $451 $626 $3,764 Less: Sales – Itapissuma 7 10 — 49 16 82 Sales – Changwon — — 13 — 13 26 Organic
Revenue $1,341 $665 $651 $401 $598 $3,656 1HQ20 Revenue $786 $554 $537 $373 $552 $2,802 Less: Sales – Itapissuma 1 1 — 7 2 11 Sales – Changwon — — — — 8 8 Aluminum price
impact (44) (9) (13) (27) (50) (143) Foreign currency impact (4) (4) — 1 (6) (13) Organic Revenue $833 $566 $550 $392 $598 $2,939
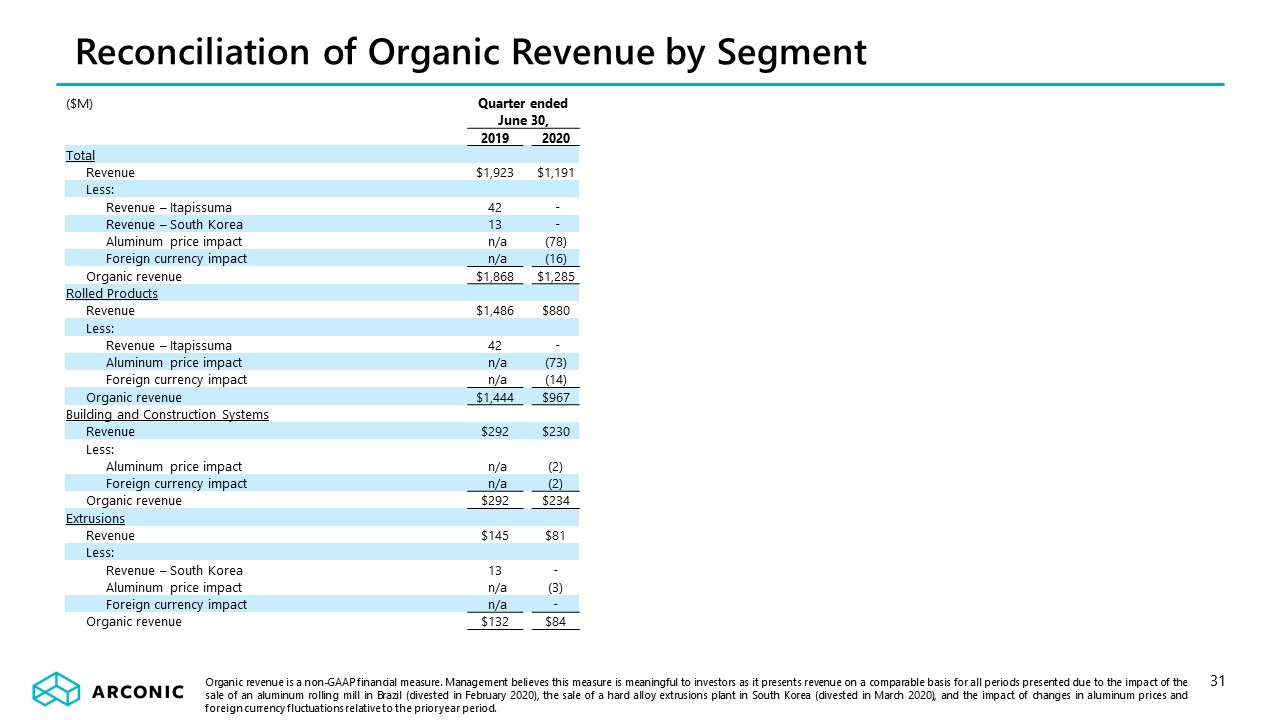
Reconciliation of Organic Revenue by Segment 31 Organic revenue is a non-GAAP financial measure.
Management believes this measure is meaningful to investors as it presents revenue on a comparable basis for all periods presented due to the impact of the sale of an aluminum rolling mill in Brazil (divested in February 2020), the sale of a hard
alloy extrusions plant in South Korea (divested in March 2020), and the impact of changes in aluminum prices and foreign currency fluctuations relative to the prior year period. ($M) Quarter ended June
30, 2019 2020 Total Revenue $1,923 $1,191 Less: Revenue – Itapissuma 42 - Revenue – South Korea 13 - Aluminum price impact n/a
(78) Foreign currency impact n/a (16) Organic revenue $1,868 $1,285 Rolled Products Revenue $1,486 $880 Less: Revenue – Itapissuma 42 -
Aluminum price impact n/a (73) Foreign currency impact n/a (14) Organic revenue $1,444 $967 Building and Construction Systems Revenue $292 $230
Less: Aluminum price impact n/a (2) Foreign currency impact n/a (2) Organic revenue $292 $234 Extrusions Revenue $145 $81
Less: Revenue – South Korea 13 - Aluminum price impact n/a (3) Foreign currency impact n/a - Organic revenue $132 $84