Attached files
| file | filename |
|---|---|
| EX-99.Q - EX-99.Q - VEECO INSTRUMENTS INC | veco-20200803xex99dq.htm |
| 8-K - 8-K - VEECO INSTRUMENTS INC | veco-20200803x8k.htm |
Exhibit 99.2
| Veeco (Nasdaq: VECO) August 3, 2020 Q2 2020 Financial Results Conference Call |

| Q2 2020 Financial Results Conference Call | All Rights Reserved. ©2020 Safe Harbor 2 To the extent that this presentation discusses expectations or otherwise makes statements about the future, such statements are forward-looking and are subject to a number of risks and uncertainties that could cause actual results to differ materially from the statements made, including as a result of the COVID-19 pandemic. These items are discussed in the Business Description, Management's Discussion and Analysis and Risk Factors sections of Veeco's Annual Report on Form 10-K for the year ended December 31, 2019 and subsequent Quarterly Reports on Form 10-Q and current reports on Form 8-K. Veeco does not undertake any obligation to update any forward-looking statements to reflect future events or circumstances after the date of such statements. |
| CEO Overview William J. Miller, Ph.D. |

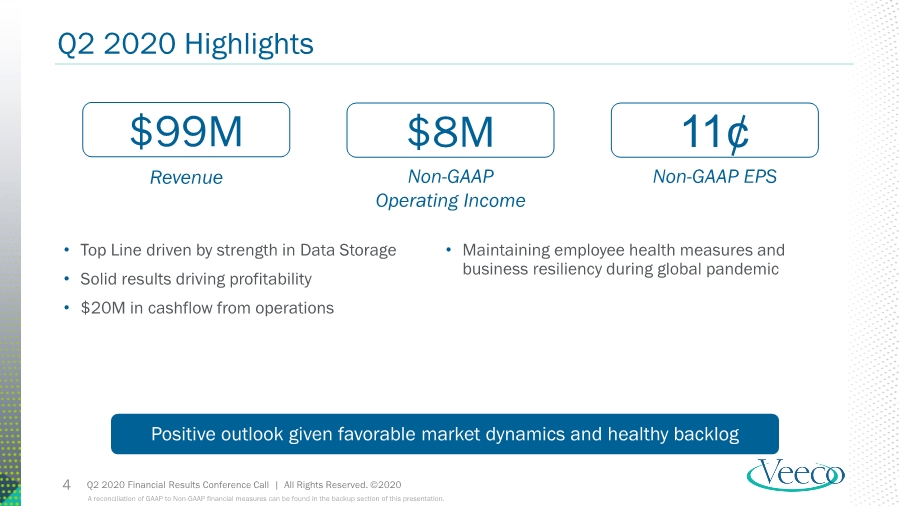
| Q2 2020 Financial Results Conference Call | All Rights Reserved. ©2020 • Top Line driven by strength in Data Storage • Solid results driving profitability • $20M in cashflow from operations • Maintaining employee health measures and business resiliency during global pandemic Positive outlook given favorable market dynamics and healthy backlog 4 Q2 2020 Highlights Revenue Non-GAAP Operating Income Non-GAAP EPS $99M $8M 11¢ A reconciliation of GAAP to Non-GAAP financial measures can be found in the backup section of this presentation. |
| CFO Financial Review John P. Kiernan |

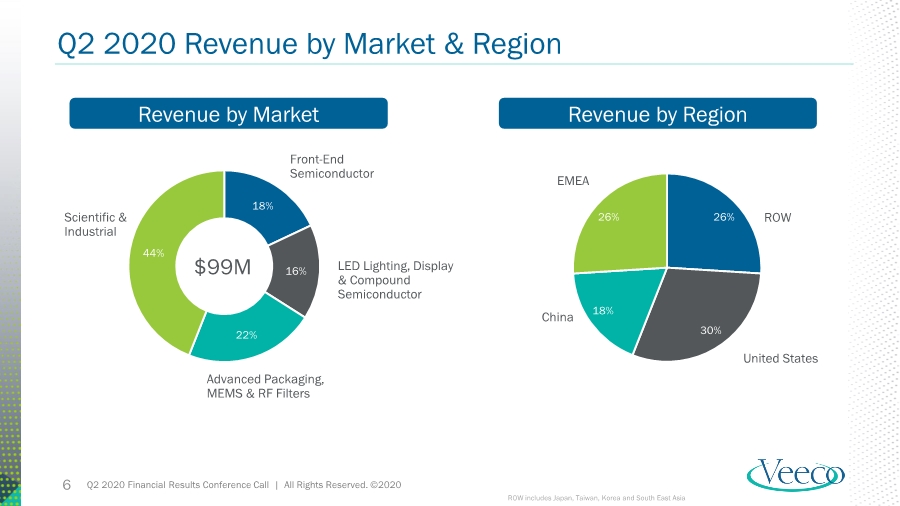
| Q2 2020 Financial Results Conference Call | All Rights Reserved. ©2020 6 Q2 2020 Revenue by Market & Region 18% 16% 22% 44% Revenue by Market Revenue by Region Scientific & Industrial Front-End Semiconductor LED Lighting, Display & Compound Semiconductor Advanced Packaging, MEMS & RF Filters 26% 30% 18% 26% EMEA China United States ROW $99M ROW includes Japan, Taiwan, Korea and South East Asia |
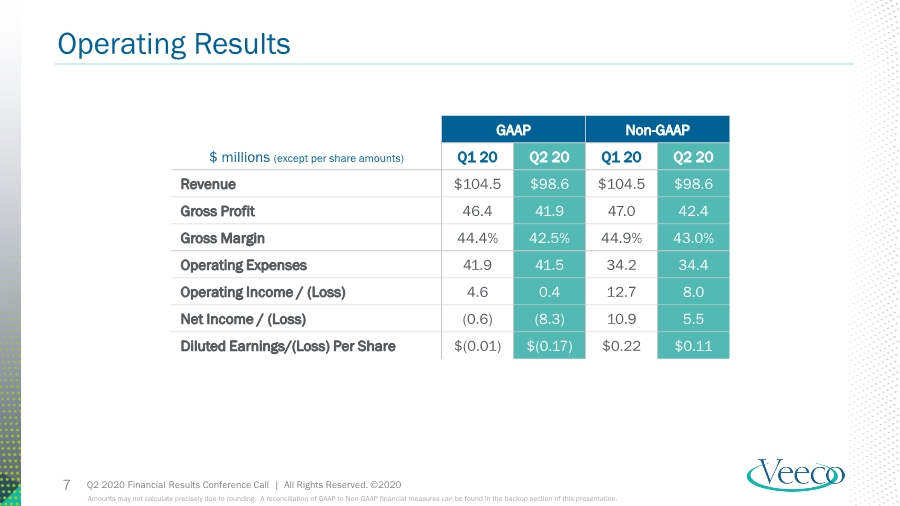
| Q2 2020 Financial Results Conference Call | All Rights Reserved. ©2020 Operating Results 7 $ millions (except per share amounts) GAAP Non-GAAP Q1 20 Q2 20 Q1 20 Q2 20 Revenue $104.5 $98.6 $104.5 $98.6 Gross Profit 46.4 41.9 47.0 42.4 Gross Margin 44.4% 42.5% 44.9% 43.0% Operating Expenses 41.9 41.5 34.2 34.4 Operating Income / (Loss) 4.6 0.4 12.7 8.0 Net Income / (Loss) (0.6) (8.3) 10.9 5.5 Diluted Earnings/(Loss) Per Share $(0.01) $(0.17) $0.22 $0.11 Amounts may not calculate precisely due to rounding. A reconciliation of GAAP to Non-GAAP financial measures can be found in the backup section of this presentation. |
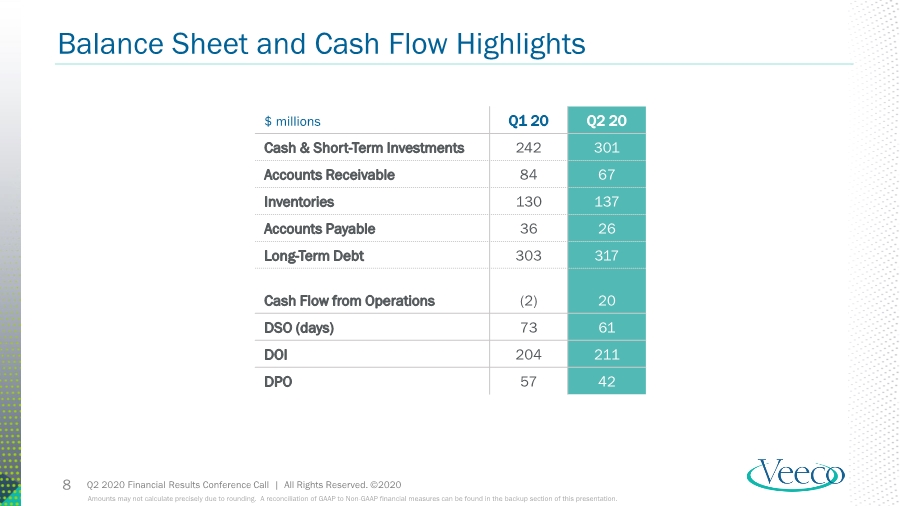
| Q2 2020 Financial Results Conference Call | All Rights Reserved. ©2020 Balance Sheet and Cash Flow Highlights 8 $ millions Q1 20 Q2 20 Cash & Short-Term Investments 242 301 Accounts Receivable 84 67 Inventories 130 137 Accounts Payable 36 26 Long-Term Debt 303 317 Cash Flow from Operations (2) 20 DSO (days) 73 61 DOI 204 211 DPO 57 42 Amounts may not calculate precisely due to rounding. A reconciliation of GAAP to Non-GAAP financial measures can be found in the backup section of this presentation. |
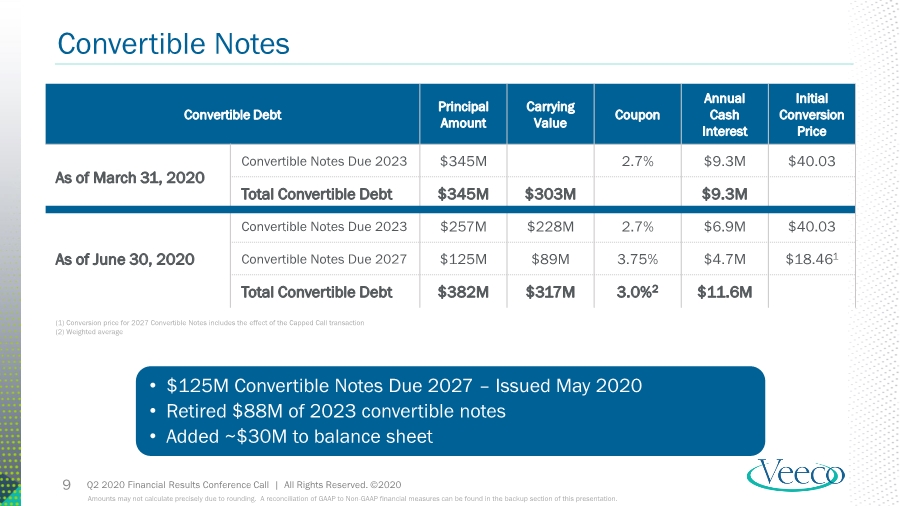
| Q2 2020 Financial Results Conference Call | All Rights Reserved. ©2020 Convertible Notes 9 Convertible Debt Principal Amount Carrying Value Coupon Annual Cash Interest Initial Conversion Price As of March 31, 2020 Convertible Notes Due 2023 $345M 2.7% $9.3M $40.03 Total Convertible Debt $345M $303M $9.3M As of June 30, 2020 Convertible Notes Due 2023 $257M $228M 2.7% $6.9M $40.03 Convertible Notes Due 2027 $125M $89M 3.75% $4.7M $18.461 Total Convertible Debt $382M $317M 3.0%2 $11.6M Amounts may not calculate precisely due to rounding. A reconciliation of GAAP to Non-GAAP financial measures can be found in the backup section of this presentation. (1) Conversion price for 2027 Convertible Notes includes the effect of the Capped Call transaction (2) Weighted average • $125M Convertible Notes Due 2027 – Issued May 2020 • Retired $88M of 2023 convertible notes • Added ~$30M to balance sheet |
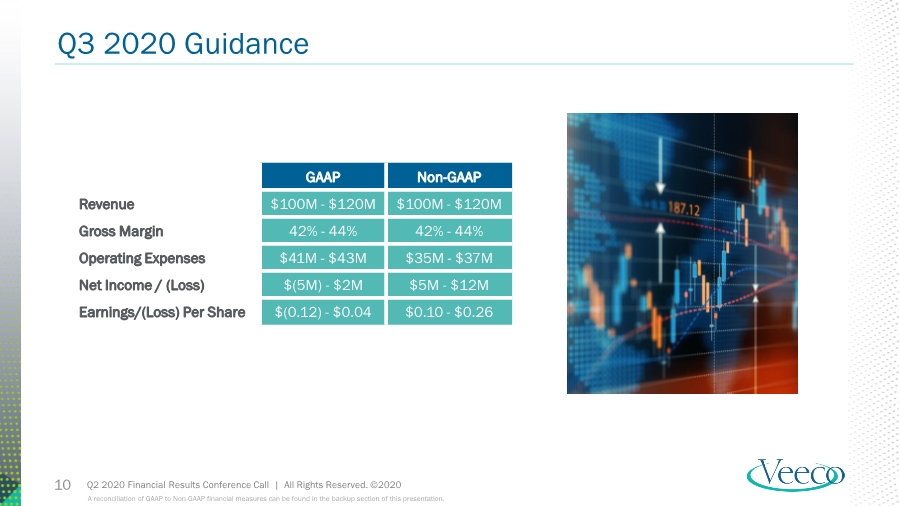
| Q2 2020 Financial Results Conference Call | All Rights Reserved. ©2020 Q3 2020 Guidance 10 GAAP Non-GAAP Revenue $100M - $120M $100M - $120M Gross Margin 42% - 44% 42% - 44% Operating Expenses $41M - $43M $35M - $37M Net Income / (Loss) $(5M) - $2M $5M - $12M Earnings/(Loss) Per Share $(0.12) - $0.04 $0.10 - $0.26 A reconciliation of GAAP to Non-GAAP financial measures can be found in the backup section of this presentation. |
| CEO Market Update William J. Miller, Ph.D. |

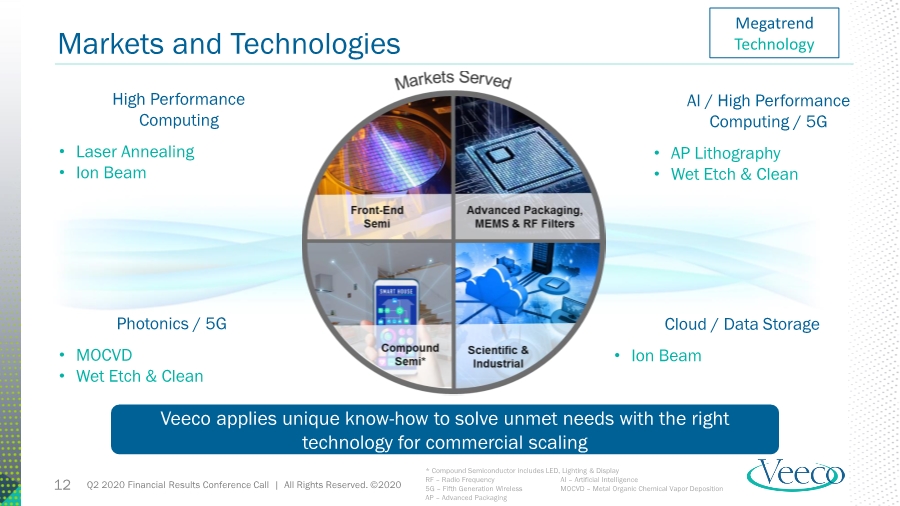
| Q2 2020 Financial Results Conference Call | All Rights Reserved. ©2020 Veeco applies unique know-how to solve unmet needs with the right technology for commercial scaling 12 Markets and Technologies High Performance Computing • Laser Annealing • Ion Beam AI / High Performance Computing / 5G • AP Lithography • Wet Etch & Clean Photonics / 5G • MOCVD • Wet Etch & Clean Cloud / Data Storage • Ion Beam Megatrend Technology * Compound Semiconductor includes LED, Lighting & Display RF – Radio Frequency AI – Artificial Intelligence 5G – Fifth Generation Wireless MOCVD – Metal Organic Chemical Vapor Deposition AP – Advanced Packaging |
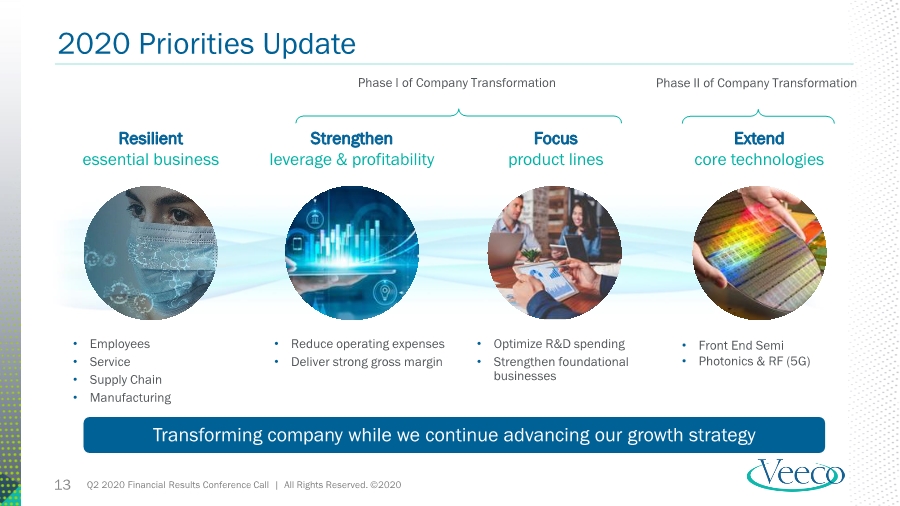
| Q2 2020 Financial Results Conference Call | All Rights Reserved. ©2020 Focus product lines Extend core technologies Strengthen leverage & profitability Resilient essential business • Optimize R&D spending • Strengthen foundational businesses • Employees • Service • Supply Chain • Manufacturing • Front End Semi • Photonics & RF (5G) • Reduce operating expenses • Deliver strong gross margin Transforming company while we continue advancing our growth strategy 13 2020 Priorities Update Phase I of Company Transformation Phase II of Company Transformation |
| Q&A |

| Reconciliation Tables |

| Q2 2020 Financial Results Conference Call | All Rights Reserved. ©2020 Note on Reconciliation Tables 16 These tables include financial measures adjusted for the impact of certain items; these financial measures are therefore not calculated in accordance with U.S. generally accepted accounting principles (“GAAP”). These Non-GAAP financial measures exclude items such as: share-based compensation expense; charges relating to restructuring initiatives; non-cash asset impairments; certain other non-operating gains and losses; and acquisition-related items such as transaction costs, non-cash amortization of acquired intangible assets, incremental transaction-related compensation, and certain integration costs. These Non-GAAP financial measures may be different from Non-GAAP financial measures used by other companies. Non-GAAP financial measures should not be considered a substitute for, or superior to, measures of financial performance prepared in accordance with GAAP. By excluding these items, Non-GAAP financial measures are intended to facilitate meaningful comparisons to historical operating results, competitors' operating results, and estimates made by securities analysts. Management is evaluated on key performance metrics including Non-GAAP Operating Income, which is used to determine management incentive compensation as well as to forecast future periods. These Non-GAAP financial measures may be useful to investors in allowing for greater transparency of supplemental information used by management in its financial and operational decision-making. In addition, similar Non-GAAP financial measures have historically been reported to investors; the inclusion of comparable numbers provides consistency in financial reporting. Investors are encouraged to review the reconciliation of the Non-GAAP financial measures used in this news release to their most directly comparable GAAP financial measures. |
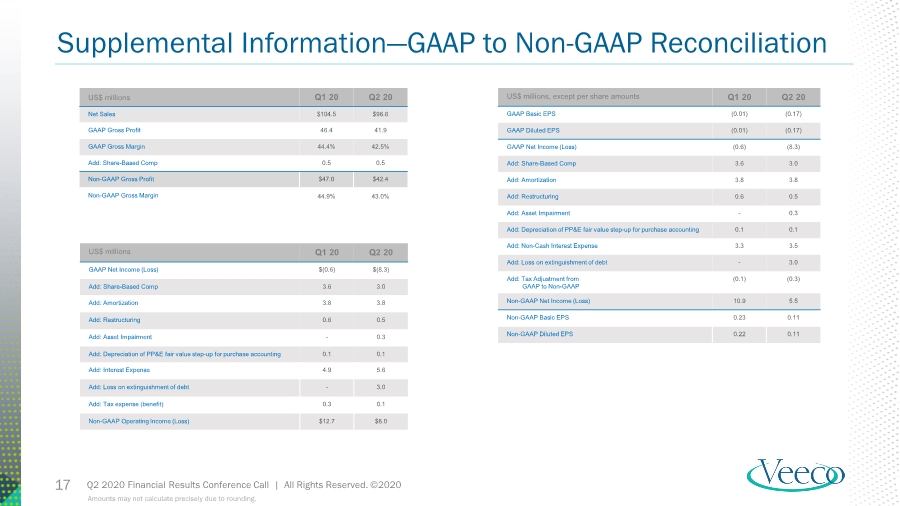
| Q2 2020 Financial Results Conference Call | All Rights Reserved. ©2020 17 Supplemental Information—GAAP to Non-GAAP Reconciliation Amounts may not calculate precisely due to rounding. US$ millions Q1 20 Q2 20 Net Sales $104.5 $98.6 GAAP Gross Profit 46.4 41.9 GAAP Gross Margin 44.4% 42.5% Add: Share-Based Comp 0.5 0.5 Non-GAAP Gross Profit $47.0 $42.4 Non-GAAP Gross Margin 44.9% 43.0% US$ millions Q1 20 Q2 20 GAAP Net Income (Loss) $(0.6) $(8.3) Add: Share-Based Comp 3.6 3.0 Add: Amortization 3.8 3.8 Add: Restructuring 0.6 0.5 Add: Asset Impairment - 0.3 Add: Depreciation of PP&E fair value step-up for purchase accounting 0.1 0.1 Add: Interest Expense 4.9 5.6 Add: Loss on extinguishment of debt - 3.0 Add: Tax expense (benefit) 0.3 0.1 Non-GAAP Operating Income (Loss) $12.7 $8.0 US$ millions, except per share amounts Q1 20 Q2 20 GAAP Basic EPS (0.01) (0.17) GAAP Diluted EPS (0.01) (0.17) GAAP Net Income (Loss) (0.6) (8.3) Add: Share-Based Comp 3.6 3.0 Add: Amortization 3.8 3.8 Add: Restructuring 0.6 0.5 Add: Asset Impairment - 0.3 Add: Depreciation of PP&E fair value step-up for purchase accounting 0.1 0.1 Add: Non-Cash Interest Expense 3.3 3.5 Add: Loss on extinguishment of debt - 3.0 Add: Tax Adjustment from GAAP to Non-GAAP (0.1) (0.3) Non-GAAP Net Income (Loss) 10.9 5.5 Non-GAAP Basic EPS 0.23 0.11 Non-GAAP Diluted EPS 0.22 0.11 |
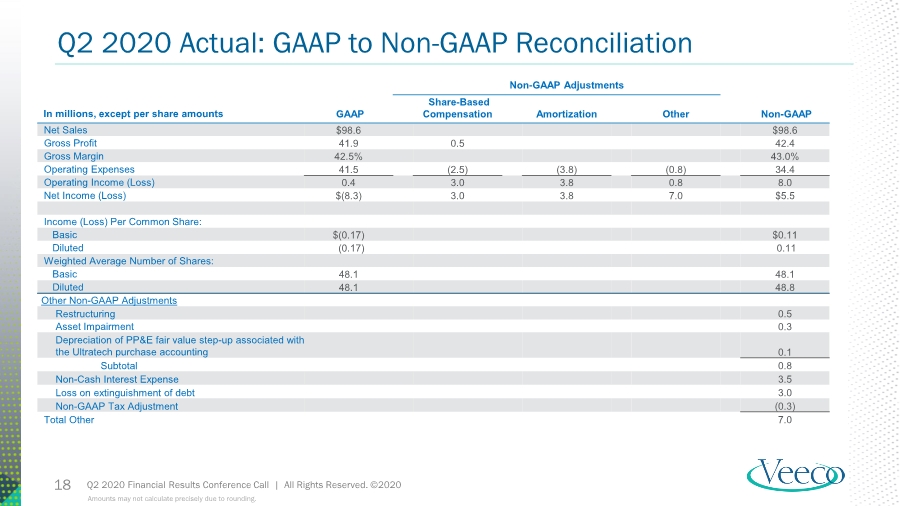
| Q2 2020 Financial Results Conference Call | All Rights Reserved. ©2020 18 Q2 2020 Actual: GAAP to Non-GAAP Reconciliation Amounts may not calculate precisely due to rounding. Non-GAAP Adjustments In millions, except per share amounts GAAP Share-Based Compensation Amortization Other Non-GAAP Net Sales $98.6 $98.6 Gross Profit 41.9 0.5 42.4 Gross Margin 42.5% 43.0% Operating Expenses 41.5 (2.5) (3.8) (0.8) 34.4 Operating Income (Loss) 0.4 3.0 3.8 0.8 8.0 Net Income (Loss) $(8.3) 3.0 3.8 7.0 $5.5 Income (Loss) Per Common Share: Basic $(0.17) $0.11 Diluted (0.17) 0.11 Weighted Average Number of Shares: Basic 48.1 48.1 Diluted 48.1 48.8 Other Non-GAAP Adjustments Restructuring 0.5 Asset Impairment 0.3 Depreciation of PP&E fair value step-up associated with the Ultratech purchase accounting 0.1 Subtotal 0.8 Non-Cash Interest Expense 3.5 Loss on extinguishment of debt 3.0 Non-GAAP Tax Adjustment (0.3) Total Other 7.0 |
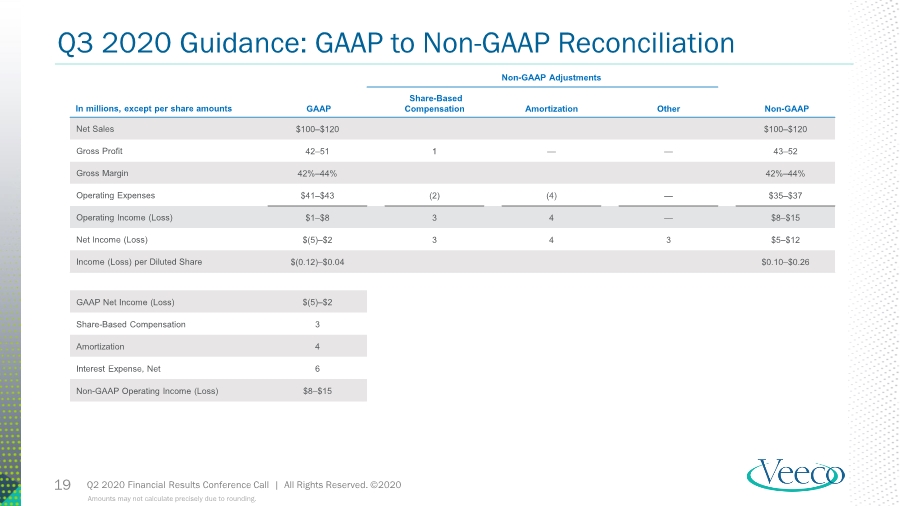
| Q2 2020 Financial Results Conference Call | All Rights Reserved. ©2020 19 Q3 2020 Guidance: GAAP to Non-GAAP Reconciliation Amounts may not calculate precisely due to rounding. Non-GAAP Adjustments In millions, except per share amounts GAAP Share-Based Compensation Amortization Other Non-GAAP Net Sales $100–$120 $100–$120 Gross Profit 42–51 1 —— 43–52 Gross Margin 42%–44% 42%–44% Operating Expenses $41–$43 (2) (4) — $35–$37 Operating Income (Loss) $1–$8 3 4 — $8–$15 Net Income (Loss) $(5)–$2 3 4 3 $5–$12 Income (Loss) per Diluted Share $(0.12)–$0.04 $0.10–$0.26 GAAP Net Income (Loss) $(5)–$2 Share-Based Compensation 3 Amortization 4 Interest Expense, Net 6 Non-GAAP Operating Income (Loss) $8–$15 |
| Thank You |