Attached files
| file | filename |
|---|---|
| EX-99.1 - EX-99.1 - FLOWSERVE CORP | d17916dex991.htm |
| 8-K - 8-K - FLOWSERVE CORP | d17916d8k.htm |

Exhibit 99.2 July 31, 2020 Second Quarter 2020 Earnings Conference Call Quarterly Presentation 2017 1Exhibit 99.2 July 31, 2020 Second Quarter 2020 Earnings Conference Call Quarterly Presentation 2017 1

Forward Looking Statements and Non-GAAP Measures Safe Harbor Statement: This presentation includes forward-looking statements within the meaning of Section 27A of the Securities Act of 1933 and Section 21E of the Securities Exchange Act of 1934, which are made pursuant to the safe harbor provisions of the Private Securities Litigation Reform Act of 1995, as amended. Words or phrases such as, may, should, expects, could, intends, plans, anticipates, estimates, believes, forecasts, predicts or other similar expressions are intended to identify forward-looking statements, which include, without limitation, earnings forecasts, statements relating to our business strategy and statements of expectations, beliefs, future plans and strategies and anticipated developments concerning our industry, business, operations and financial performance and condition. The forward-looking statements included in this presentation are based on our current expectations, projections, estimates and assumptions. These statements are only predictions, not guarantees. Such forward- looking statements are subject to numerous risks and uncertainties that are difficult to predict. These risks and uncertainties may cause actual results to differ materially from what is forecast in such forward- looking statements, and include, without limitation, the following: the impact of the global outbreak of COVID-19 on our business and operations; a portion of our bookings may not lead to completed sales, and our ability to convert bookings into revenues at acceptable profit margins; changes in global economic conditions and the potential for unexpected cancellations or delays of customer orders in our reported backlog; our dependence on our customers’ ability to make required capital investment and maintenance expenditures; if we are not able to successfully execute and realize the expected financial benefits from our strategic transformation and realignment initiatives, our business could be adversely affected; risks associated with cost overruns on fixed-fee projects and in taking customer orders for large complex custom engineered products; the substantial dependence of our sales on the success of the oil and gas, chemical, power generation and water management industries; the adverse impact of volatile raw materials prices on our products and operating margins; economic, political and other risks associated with our international operations, including military actions, trade embargoes, epidemics or pandemics or changes to tariffs or trade agreements that could affect customer markets, particularly North African, Russian and Middle Eastern markets and global oil and gas producers, and non-compliance with U.S. export/re-export control, foreign corrupt practice laws, economic sanctions and import laws and regulations; increased aging and slower collection of receivables, particularly in Latin America and other emerging markets; our exposure to fluctuations in foreign currency exchange rates, including in hyperinflationary countries such as Venezuela and Argentina; our furnishing of products and services to nuclear power plant facilities and other critical processes; potential adverse consequences resulting from litigation to which we are a party, such as litigation involving asbestos-containing material claims; expectations regarding acquisitions and the integration of acquired businesses; our relative geographical profitability and its impact on our utilization of deferred tax assets, including foreign tax credits; the potential adverse impact of an impairment in the carrying value of goodwill or other intangible assets; our dependence upon third-party suppliers whose failure to perform timely could adversely affect our business operations; the highly competitive nature of the markets in which we operate; environmental compliance costs and liabilities; potential work stoppages and other labor matters; access to public and private sources of debt financing; our inability to protect our intellectual property in the U.S., as well as in foreign countries; obligations under our defined benefit pension plans; our internal control over financial reporting may not prevent or detect misstatements because of its inherent limitations, including the possibility of human error, the circumvention or overriding of controls, or fraud; the recording of increased deferred tax asset valuation allowances in the future or the impact of tax law changes on such deferred tax assets could affect our operating results; our information technology infrastructure could be subject to service interruptions, data corruption, cyber-based attacks or network security breaches, which could disrupt our business operations and result in the loss of critical and confidential information; ineffective internal controls could impact the accuracy and timely reporting of our business and financial results; and other factors described from time to time in our filings with the Securities and Exchange Commission. All forward-looking statements included in this presentation are based on information available to us on the date hereof, and we assume no obligation to update any forward-looking statement. The Company reports its financial results in accordance with U.S. generally accepted accounting principles (GAAP). However, management believes that non-GAAP financial measures which exclude certain non-recurring items present additional useful comparisons between current results and results in prior operating periods, providing investors with a clearer view of the underlying trends of the business. Management also uses these non-GAAP financial measures in making financial, operating, planning and compensation decisions and in evaluating the Company's performance. Throughout our materials we refer to non-GAAP measures as “Adjusted.” Non-GAAP financial measures, which may be inconsistent with similarly captioned measures presented by other companies, should be viewed in addition to, and not as a substitute for, the Company’s reported results prepared in accordance with GAAP. We have provided tables in the appendix that reconcile these non-GAAP measures to their corresponding GAAP-based measures. Flowserve Q2 2020 Earnings Conference Call 2Forward Looking Statements and Non-GAAP Measures Safe Harbor Statement: This presentation includes forward-looking statements within the meaning of Section 27A of the Securities Act of 1933 and Section 21E of the Securities Exchange Act of 1934, which are made pursuant to the safe harbor provisions of the Private Securities Litigation Reform Act of 1995, as amended. Words or phrases such as, may, should, expects, could, intends, plans, anticipates, estimates, believes, forecasts, predicts or other similar expressions are intended to identify forward-looking statements, which include, without limitation, earnings forecasts, statements relating to our business strategy and statements of expectations, beliefs, future plans and strategies and anticipated developments concerning our industry, business, operations and financial performance and condition. The forward-looking statements included in this presentation are based on our current expectations, projections, estimates and assumptions. These statements are only predictions, not guarantees. Such forward- looking statements are subject to numerous risks and uncertainties that are difficult to predict. These risks and uncertainties may cause actual results to differ materially from what is forecast in such forward- looking statements, and include, without limitation, the following: the impact of the global outbreak of COVID-19 on our business and operations; a portion of our bookings may not lead to completed sales, and our ability to convert bookings into revenues at acceptable profit margins; changes in global economic conditions and the potential for unexpected cancellations or delays of customer orders in our reported backlog; our dependence on our customers’ ability to make required capital investment and maintenance expenditures; if we are not able to successfully execute and realize the expected financial benefits from our strategic transformation and realignment initiatives, our business could be adversely affected; risks associated with cost overruns on fixed-fee projects and in taking customer orders for large complex custom engineered products; the substantial dependence of our sales on the success of the oil and gas, chemical, power generation and water management industries; the adverse impact of volatile raw materials prices on our products and operating margins; economic, political and other risks associated with our international operations, including military actions, trade embargoes, epidemics or pandemics or changes to tariffs or trade agreements that could affect customer markets, particularly North African, Russian and Middle Eastern markets and global oil and gas producers, and non-compliance with U.S. export/re-export control, foreign corrupt practice laws, economic sanctions and import laws and regulations; increased aging and slower collection of receivables, particularly in Latin America and other emerging markets; our exposure to fluctuations in foreign currency exchange rates, including in hyperinflationary countries such as Venezuela and Argentina; our furnishing of products and services to nuclear power plant facilities and other critical processes; potential adverse consequences resulting from litigation to which we are a party, such as litigation involving asbestos-containing material claims; expectations regarding acquisitions and the integration of acquired businesses; our relative geographical profitability and its impact on our utilization of deferred tax assets, including foreign tax credits; the potential adverse impact of an impairment in the carrying value of goodwill or other intangible assets; our dependence upon third-party suppliers whose failure to perform timely could adversely affect our business operations; the highly competitive nature of the markets in which we operate; environmental compliance costs and liabilities; potential work stoppages and other labor matters; access to public and private sources of debt financing; our inability to protect our intellectual property in the U.S., as well as in foreign countries; obligations under our defined benefit pension plans; our internal control over financial reporting may not prevent or detect misstatements because of its inherent limitations, including the possibility of human error, the circumvention or overriding of controls, or fraud; the recording of increased deferred tax asset valuation allowances in the future or the impact of tax law changes on such deferred tax assets could affect our operating results; our information technology infrastructure could be subject to service interruptions, data corruption, cyber-based attacks or network security breaches, which could disrupt our business operations and result in the loss of critical and confidential information; ineffective internal controls could impact the accuracy and timely reporting of our business and financial results; and other factors described from time to time in our filings with the Securities and Exchange Commission. All forward-looking statements included in this presentation are based on information available to us on the date hereof, and we assume no obligation to update any forward-looking statement. The Company reports its financial results in accordance with U.S. generally accepted accounting principles (GAAP). However, management believes that non-GAAP financial measures which exclude certain non-recurring items present additional useful comparisons between current results and results in prior operating periods, providing investors with a clearer view of the underlying trends of the business. Management also uses these non-GAAP financial measures in making financial, operating, planning and compensation decisions and in evaluating the Company's performance. Throughout our materials we refer to non-GAAP measures as “Adjusted.” Non-GAAP financial measures, which may be inconsistent with similarly captioned measures presented by other companies, should be viewed in addition to, and not as a substitute for, the Company’s reported results prepared in accordance with GAAP. We have provided tables in the appendix that reconcile these non-GAAP measures to their corresponding GAAP-based measures. Flowserve Q2 2020 Earnings Conference Call 2
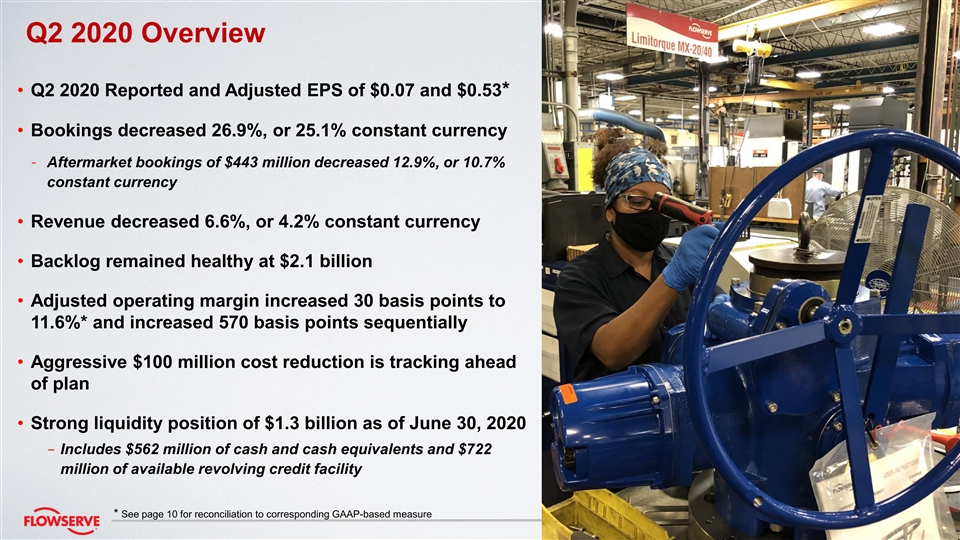
Q2 2020 Overview • Q2 2020 Reported and Adjusted EPS of $0.07 and $0.53* • Bookings decreased 26.9%, or 25.1% constant currency - Aftermarket bookings of $443 million decreased 12.9%, or 10.7% constant currency • Revenue decreased 6.6%, or 4.2% constant currency • Backlog remained healthy at $2.1 billion • Adjusted operating margin increased 30 basis points to 11.6%* and increased 570 basis points sequentially • Aggressive $100 million cost reduction is tracking ahead of plan • Strong liquidity position of $1.3 billion as of June 30, 2020 - Includes $562 million of cash and cash equivalents and $722 million of available revolving credit facility * See page 10 for reconciliation to corresponding GAAP-based measure Flowserve Q2 2020 Earnings Conference Call 3 3Q2 2020 Overview • Q2 2020 Reported and Adjusted EPS of $0.07 and $0.53* • Bookings decreased 26.9%, or 25.1% constant currency - Aftermarket bookings of $443 million decreased 12.9%, or 10.7% constant currency • Revenue decreased 6.6%, or 4.2% constant currency • Backlog remained healthy at $2.1 billion • Adjusted operating margin increased 30 basis points to 11.6%* and increased 570 basis points sequentially • Aggressive $100 million cost reduction is tracking ahead of plan • Strong liquidity position of $1.3 billion as of June 30, 2020 - Includes $562 million of cash and cash equivalents and $722 million of available revolving credit facility * See page 10 for reconciliation to corresponding GAAP-based measure Flowserve Q2 2020 Earnings Conference Call 3 3

Q2 Bookings & Sales Mix Bookings Sales End-Markets $808M $1.11B $925M $990M Oil & Gas • Oil price volatility reduced throughout Q2 • Refining utilization remains challenged 31% • Significant CAPEX reductions from integrated and 41% 41% 42% national oil companies North America Oil & Gas • Global oil production continues to decline Europe Chemical Chemical • Specialty chemical demand remains high 24% Asia-Pac • Surplus capacity and petrochem demand decrease Power 20% 21% with additional capacity coming online 22% Middle East & General Power 13% Africa Industries • Structurally challenged market further impacted by Latin America 11% Water decreased electricity demand 21% 21% • Maintenance and replacement opportunities exist in nuclear and fossil power installed base 29% 22% General Industries & Water 13% 11% • North American distribution down significantly 6% 5% 3% 3% • Mining and water opportunities continue globally 2020 2019 2020 2019 Flowserve Q2 2020 Earnings Conference Call 4Q2 Bookings & Sales Mix Bookings Sales End-Markets $808M $1.11B $925M $990M Oil & Gas • Oil price volatility reduced throughout Q2 • Refining utilization remains challenged 31% • Significant CAPEX reductions from integrated and 41% 41% 42% national oil companies North America Oil & Gas • Global oil production continues to decline Europe Chemical Chemical • Specialty chemical demand remains high 24% Asia-Pac • Surplus capacity and petrochem demand decrease Power 20% 21% with additional capacity coming online 22% Middle East & General Power 13% Africa Industries • Structurally challenged market further impacted by Latin America 11% Water decreased electricity demand 21% 21% • Maintenance and replacement opportunities exist in nuclear and fossil power installed base 29% 22% General Industries & Water 13% 11% • North American distribution down significantly 6% 5% 3% 3% • Mining and water opportunities continue globally 2020 2019 2020 2019 Flowserve Q2 2020 Earnings Conference Call 4

Original Equipment / Aftermarket Mix Original Equipment Aftermarket Bookings Mix % Sales Mix % Bookings Mix % Sales Mix % $ millions $ millions $ millions $ millions $597 $493 $508 $502 $498 $475 $463 $452 $462 $443 $442 $366 55% 54% 51% 51% 50% 50% 50% 50% 49% 49% 46% 45% 2020 Q2 2020 Q1 2019 Q2 2020 Q2 2020 Q1 2019 Q2 2020 Q2 2020 Q1 2019 Q2 2020 Q2 2020 Q1 2019 Q2 • Original equipment bookings decreased 38.7%, • Aftermarket bookings decreased 12.9%, or or 37.3% constant currency vs. Q2 2019 decreased 10.7% constant currency vs. Q2 2019 • Original equipment sales decreased 6.1%, or • Aftermarket sales decreased 7.1%, or 5.0% 3.3% constant currency vs. Q2 2019 constant currency vs. Q2 2019 Flowserve Q2 2020 Earnings Conference Call 5Original Equipment / Aftermarket Mix Original Equipment Aftermarket Bookings Mix % Sales Mix % Bookings Mix % Sales Mix % $ millions $ millions $ millions $ millions $597 $493 $508 $502 $498 $475 $463 $452 $462 $443 $442 $366 55% 54% 51% 51% 50% 50% 50% 50% 49% 49% 46% 45% 2020 Q2 2020 Q1 2019 Q2 2020 Q2 2020 Q1 2019 Q2 2020 Q2 2020 Q1 2019 Q2 2020 Q2 2020 Q1 2019 Q2 • Original equipment bookings decreased 38.7%, • Aftermarket bookings decreased 12.9%, or or 37.3% constant currency vs. Q2 2019 decreased 10.7% constant currency vs. Q2 2019 • Original equipment sales decreased 6.1%, or • Aftermarket sales decreased 7.1%, or 5.0% 3.3% constant currency vs. Q2 2019 constant currency vs. Q2 2019 Flowserve Q2 2020 Earnings Conference Call 5

[1] Q2 2020 Financial Scorecard [1] [1] [2] Adjusted EPS Bookings Revenue Adjusted OI% Operating Cash Flow PWC $ millions $ millions $ millions As a % of TTM Revenue $47 $1,105 28.6% 28.5% 11.6% 11.3% $990 $977 $0.54 $0.53 $925 $895 $808 26.4% $11 5.9% $0.21 2020 2020 Q1 2019 Q2 Q2 -$26 2020 Q2 2020 Q1 2019 Q2 2020 Q2 2020 Q1 2019 Q2 2020 Q2 2020 Q1 2019 Q2 2020 Q2 2020 Q1 2019 Q2 2020 Q2 2020 Q1 2019 Q2 Q2 Highlights • Constant currency bookings declined 25.1%, primarily driven by 37.3% original equipment decrease and the 41.2% decrease in our oil and gas markets • Constant currency revenue decreased 4.2%, including FPD’s 15.0% original equipment growth [1] • Adjusted operating margin increased 30 basis points following decisive cost actions that more than offset negative impacts from higher mix of project work and $65 million revenue decrease • Primary working capital as a percent of sales held flat despite COVID related disruptions to our operations [1] See page 10 for reconciliation to corresponding GAAP-based measure [2] Primary working capital “PWC” includes accounts receivable, inventory, contract assets, accounts payable and contract liabilities. Flowserve Q2 2020 Earnings Conference Call 6[1] Q2 2020 Financial Scorecard [1] [1] [2] Adjusted EPS Bookings Revenue Adjusted OI% Operating Cash Flow PWC $ millions $ millions $ millions As a % of TTM Revenue $47 $1,105 28.6% 28.5% 11.6% 11.3% $990 $977 $0.54 $0.53 $925 $895 $808 26.4% $11 5.9% $0.21 2020 2020 Q1 2019 Q2 Q2 -$26 2020 Q2 2020 Q1 2019 Q2 2020 Q2 2020 Q1 2019 Q2 2020 Q2 2020 Q1 2019 Q2 2020 Q2 2020 Q1 2019 Q2 2020 Q2 2020 Q1 2019 Q2 Q2 Highlights • Constant currency bookings declined 25.1%, primarily driven by 37.3% original equipment decrease and the 41.2% decrease in our oil and gas markets • Constant currency revenue decreased 4.2%, including FPD’s 15.0% original equipment growth [1] • Adjusted operating margin increased 30 basis points following decisive cost actions that more than offset negative impacts from higher mix of project work and $65 million revenue decrease • Primary working capital as a percent of sales held flat despite COVID related disruptions to our operations [1] See page 10 for reconciliation to corresponding GAAP-based measure [2] Primary working capital “PWC” includes accounts receivable, inventory, contract assets, accounts payable and contract liabilities. Flowserve Q2 2020 Earnings Conference Call 6

2020 Priorities and Outlook 2020 Outlook* • Protecting the health and safety of our workforce, customers and suppliers • Expect second half bookings and revenues to be essentially flat versus first half • Second half decremental operating margins expected in 20% – 25% range • Expect adjusted EPS in excess of first half’s $0.73 and remain confident in our ability to generate free cash flow • Converting our strong $2.1 billion backlog and providing support to maintain customers’ existing infrastructure • Significant $100 million cost reduction • Continuing Flowserve 2.0 Transformation and prioritizing investments to best position Flowserve for the future * Assumes no resumption of broad-based government-imposed, or illness-related, shutdowns of significant operating facilities Flowserve Q2 2020 Earnings Conference Call 7 72020 Priorities and Outlook 2020 Outlook* • Protecting the health and safety of our workforce, customers and suppliers • Expect second half bookings and revenues to be essentially flat versus first half • Second half decremental operating margins expected in 20% – 25% range • Expect adjusted EPS in excess of first half’s $0.73 and remain confident in our ability to generate free cash flow • Converting our strong $2.1 billion backlog and providing support to maintain customers’ existing infrastructure • Significant $100 million cost reduction • Continuing Flowserve 2.0 Transformation and prioritizing investments to best position Flowserve for the future * Assumes no resumption of broad-based government-imposed, or illness-related, shutdowns of significant operating facilities Flowserve Q2 2020 Earnings Conference Call 7 7

Questions & Answers Flowserve Q2 2020 Earnings Conference Call 8Questions & Answers Flowserve Q2 2020 Earnings Conference Call 8

Appendix Flowserve Q2 2020 Earnings Conference Call 9Appendix Flowserve Q2 2020 Earnings Conference Call 9

Q2 2020 Consolidated Financial Results 2nd Quarter 2nd Quarter Adjusted 2020 2020 2019 Constant Constant ($ millions) 2020 2019 Delta ($) Delta (%) Adjusted Adjusted Adjusted Delta ($) Delta (%) FX(%)* FX(%)* Items Results Results Bookings $ 808.3 $ 1,105.0 $ (296.7) -26.9% -25.1% $ - $ 808.3 $ 1,105.0 $ (296.7) -26.9% -25.1% Sales $ 925.0 $ 990.1 $ (65.1) -6.6% -4.2% $ - $ 925.0 $ 990.1 $ (65.1) -6.6% -4.2% (1) (5) Gross Profit $ 267.2 $ 318.0 $ (50.8) -16.0% $ (29.9) $ 297.1 $ 321.9 $ (24.8) -7.7% Gross Margin (%) 28.9% 32.1% (320) bps 32.1% 32.5% (40) bps (2) (6) SG&A $ 227.4 $ 223.7 $ 3.7 1.7% 3.0% $ 34.2 $ 193.1 $ 213.7 $ (20.6) -9.6% -8.2% SG&A (%) 24.6% 22.6% 200 bps 20.9% 21.6% (70) bps Income from Affiliates $ 3.1 $ 3.7 $ (0.6) -16.2% $ - $ 3.1 $ 3.7 $ (0.6) -16.2% Operating Income $ 42.9 $ 98.0 $ (55.1) -56.2% -51.3% $ (64.1) $ 107.0 $ 111.9 $ (4.9) -4.4% -0.1% Operating Margin (%) 4.6% 9.9% (530) bps 11.6% 11.3% 30 bps (3) Other Income / (Expense), (7) $ (13.8) $ (1.1) $ 12.7 NM $ (14.1) $ 0.3 $ 2.0 $ (1. 7) -85.0% net ** (4) (8) Tax Expense $ (5.4) $ (22.4) $ (17.0) -75.9% $ 17.9 $ (23.3) $ (25.9) $ (2.6) -10.0% Net Earnings $ 8.6 $ 58.2 $ (49.6) -85.2% $ (60.2) $ 68.9 $ 71.6 $ (2.7) -3.8% Diluted EPS $ 0.07 $ 0.44 $ (0.37) -84.1% $ (0.47) $ 0.53 $ 0.54 $ (0.01) -1.9% - Diluted EPS calculated using fully diluted shares of 130.7 and 131.8 million shares for Q2 2020 and Q2 2019, respectively ** Second Quarter 2020 and 2019 include losses of $14.1 million and $3.1 million arising from transactions in * Constant FX represents the year-over-year variance assuming 2020 results at 2019 FX rates currencies other than our sites’ functional currencies and impact of foreign exchange contracts, respectively 1. Cost of sales includes $29.9 million of realignment charges 5. Excludes $3.9 million of realignment charges 2. SG&A includes $28.6 million of realignment charges and $5.6 million of transformation charges 6. Excludes $2.4 million of net realignment benefit and $7.6 million of transformation charges 3. Below-the-line FX impacts 7. Excludes below-the-line FX loss 4. Includes tax impact of above items 8. Excludes tax impact of above items Flowserve Q2 2020 Earnings Conference Call 10Q2 2020 Consolidated Financial Results 2nd Quarter 2nd Quarter Adjusted 2020 2020 2019 Constant Constant ($ millions) 2020 2019 Delta ($) Delta (%) Adjusted Adjusted Adjusted Delta ($) Delta (%) FX(%)* FX(%)* Items Results Results Bookings $ 808.3 $ 1,105.0 $ (296.7) -26.9% -25.1% $ - $ 808.3 $ 1,105.0 $ (296.7) -26.9% -25.1% Sales $ 925.0 $ 990.1 $ (65.1) -6.6% -4.2% $ - $ 925.0 $ 990.1 $ (65.1) -6.6% -4.2% (1) (5) Gross Profit $ 267.2 $ 318.0 $ (50.8) -16.0% $ (29.9) $ 297.1 $ 321.9 $ (24.8) -7.7% Gross Margin (%) 28.9% 32.1% (320) bps 32.1% 32.5% (40) bps (2) (6) SG&A $ 227.4 $ 223.7 $ 3.7 1.7% 3.0% $ 34.2 $ 193.1 $ 213.7 $ (20.6) -9.6% -8.2% SG&A (%) 24.6% 22.6% 200 bps 20.9% 21.6% (70) bps Income from Affiliates $ 3.1 $ 3.7 $ (0.6) -16.2% $ - $ 3.1 $ 3.7 $ (0.6) -16.2% Operating Income $ 42.9 $ 98.0 $ (55.1) -56.2% -51.3% $ (64.1) $ 107.0 $ 111.9 $ (4.9) -4.4% -0.1% Operating Margin (%) 4.6% 9.9% (530) bps 11.6% 11.3% 30 bps (3) Other Income / (Expense), (7) $ (13.8) $ (1.1) $ 12.7 NM $ (14.1) $ 0.3 $ 2.0 $ (1. 7) -85.0% net ** (4) (8) Tax Expense $ (5.4) $ (22.4) $ (17.0) -75.9% $ 17.9 $ (23.3) $ (25.9) $ (2.6) -10.0% Net Earnings $ 8.6 $ 58.2 $ (49.6) -85.2% $ (60.2) $ 68.9 $ 71.6 $ (2.7) -3.8% Diluted EPS $ 0.07 $ 0.44 $ (0.37) -84.1% $ (0.47) $ 0.53 $ 0.54 $ (0.01) -1.9% - Diluted EPS calculated using fully diluted shares of 130.7 and 131.8 million shares for Q2 2020 and Q2 2019, respectively ** Second Quarter 2020 and 2019 include losses of $14.1 million and $3.1 million arising from transactions in * Constant FX represents the year-over-year variance assuming 2020 results at 2019 FX rates currencies other than our sites’ functional currencies and impact of foreign exchange contracts, respectively 1. Cost of sales includes $29.9 million of realignment charges 5. Excludes $3.9 million of realignment charges 2. SG&A includes $28.6 million of realignment charges and $5.6 million of transformation charges 6. Excludes $2.4 million of net realignment benefit and $7.6 million of transformation charges 3. Below-the-line FX impacts 7. Excludes below-the-line FX loss 4. Includes tax impact of above items 8. Excludes tax impact of above items Flowserve Q2 2020 Earnings Conference Call 10

Year-to-Date 2020 Consolidated Financial Results Year-to-Date Year-to-Date Adjusted 2020 2020 2019 Constant Constant ($ millions) Adjusted 2020 2019 Delta ($) Delta (%) Adjusted Adjusted Delta ($) Delta (%) FX(%)* FX(%)* Items Results Results Bookings $ 1,783.6 $ 2,165.1 $ (381.5) -17.6% -15.8% $ - $ 1,783.6 $ 2,165.1 $ (381.5) -17.6% -15.8% Sales $ 1,819.4 $ 1,880.1 $ (60.7) -3.2% -1.1% $ - $ 1,819.4 $ 1,880.1 $ (60.7) -3.2% -1.1% (1) (5) Gross Profit $ 533.1 $ 612.1 $ (79.0) -12.9% $ (39.3) $ 572.4 $ 621.5 $ (49.1) -7.9% Gross Margin (%) 29.3% 32.6% (330) bps 31.5% 33.1% (160) bps (2) (6) SG&A $ 471.0 $ 428.8 $ 42.2 9.8% 11.3% $ 51.6 $ 419.4 $ 427.8 $ (8.4) -2.0% -0.4% SG&A (%) 25.9% 22.8% 310 bps 23.0% 22.8% 20 bps Income from Affiliates $ 6.3 $ 6.0 $ 0.3 5.0% $ - $ 6.3 $ 6.0 $ 0.3 5.0% Operating Income $ 68.4 $ 189.2 $ (120.8) -63.8% -60.8% $ (90.9) $ 159.4 $ 199.6 $ (40.2) -20.1% -17.3% Operating Margin (%) 3.8% 10.1% (630) bps 8.8% 10.6% (180) bps (3) (8) Other Income / (Expense), $ 11.4 $ (2.2) $ 13.6 NM $ 11.6 $ (0.2) $ 3.6 $ (3.8) -105.6% net ** (4) (9) Tax Expense $ (41.7) $ (39.0) $ 2.7 6.9% $ (8.8) $ (32.9) $ (45.2) $ (12.3) -27.2% Net Earnings $ 8.0 $ 115.4 $ (107.4) -93.1% $ (88.1) $ 96.2 $ 125.4 $ (29.2) -23.3% Diluted EPS $ 0.06 $ 0.88 $ (0.82) -93.2% $ (0.67) $ 0.73 $ 0.95 $ (0.22) -23.2% - Diluted EPS calculated using fully diluted shares of 131.2 and 131.6 million shares for YTD 2020 and YTD 2019, respectively ** YTD 2020 and 2019 include a gain of $11.6 million and a loss of $5.8 million arising from transactions in * Constant FX represents the year-over-year variance assuming 2020 results at 2019 FX rates currencies other than our sites’ functional currencies and impact of foreign exchange contracts, respectively 1. Cost of sales includes $39.3 million of realignment charges 5. Excludes $9.4 million of realignment charges 2. SG&A includes $29.9 million of realignment charges, $11.3 million of transformation charges and $10.4 million related 6. Excludes $15.0 million of net realignment benefit and $16.0 million of transformation charges to discrete asset write-downs 7. Excludes below-the-line FX loss 3. Below-the-line FX impacts 8. Excludes tax impact of above items 4. Includes tax impact of above items Flowserve Q2 2020 Earnings Conference Call 11Year-to-Date 2020 Consolidated Financial Results Year-to-Date Year-to-Date Adjusted 2020 2020 2019 Constant Constant ($ millions) Adjusted 2020 2019 Delta ($) Delta (%) Adjusted Adjusted Delta ($) Delta (%) FX(%)* FX(%)* Items Results Results Bookings $ 1,783.6 $ 2,165.1 $ (381.5) -17.6% -15.8% $ - $ 1,783.6 $ 2,165.1 $ (381.5) -17.6% -15.8% Sales $ 1,819.4 $ 1,880.1 $ (60.7) -3.2% -1.1% $ - $ 1,819.4 $ 1,880.1 $ (60.7) -3.2% -1.1% (1) (5) Gross Profit $ 533.1 $ 612.1 $ (79.0) -12.9% $ (39.3) $ 572.4 $ 621.5 $ (49.1) -7.9% Gross Margin (%) 29.3% 32.6% (330) bps 31.5% 33.1% (160) bps (2) (6) SG&A $ 471.0 $ 428.8 $ 42.2 9.8% 11.3% $ 51.6 $ 419.4 $ 427.8 $ (8.4) -2.0% -0.4% SG&A (%) 25.9% 22.8% 310 bps 23.0% 22.8% 20 bps Income from Affiliates $ 6.3 $ 6.0 $ 0.3 5.0% $ - $ 6.3 $ 6.0 $ 0.3 5.0% Operating Income $ 68.4 $ 189.2 $ (120.8) -63.8% -60.8% $ (90.9) $ 159.4 $ 199.6 $ (40.2) -20.1% -17.3% Operating Margin (%) 3.8% 10.1% (630) bps 8.8% 10.6% (180) bps (3) (8) Other Income / (Expense), $ 11.4 $ (2.2) $ 13.6 NM $ 11.6 $ (0.2) $ 3.6 $ (3.8) -105.6% net ** (4) (9) Tax Expense $ (41.7) $ (39.0) $ 2.7 6.9% $ (8.8) $ (32.9) $ (45.2) $ (12.3) -27.2% Net Earnings $ 8.0 $ 115.4 $ (107.4) -93.1% $ (88.1) $ 96.2 $ 125.4 $ (29.2) -23.3% Diluted EPS $ 0.06 $ 0.88 $ (0.82) -93.2% $ (0.67) $ 0.73 $ 0.95 $ (0.22) -23.2% - Diluted EPS calculated using fully diluted shares of 131.2 and 131.6 million shares for YTD 2020 and YTD 2019, respectively ** YTD 2020 and 2019 include a gain of $11.6 million and a loss of $5.8 million arising from transactions in * Constant FX represents the year-over-year variance assuming 2020 results at 2019 FX rates currencies other than our sites’ functional currencies and impact of foreign exchange contracts, respectively 1. Cost of sales includes $39.3 million of realignment charges 5. Excludes $9.4 million of realignment charges 2. SG&A includes $29.9 million of realignment charges, $11.3 million of transformation charges and $10.4 million related 6. Excludes $15.0 million of net realignment benefit and $16.0 million of transformation charges to discrete asset write-downs 7. Excludes below-the-line FX loss 3. Below-the-line FX impacts 8. Excludes tax impact of above items 4. Includes tax impact of above items Flowserve Q2 2020 Earnings Conference Call 11
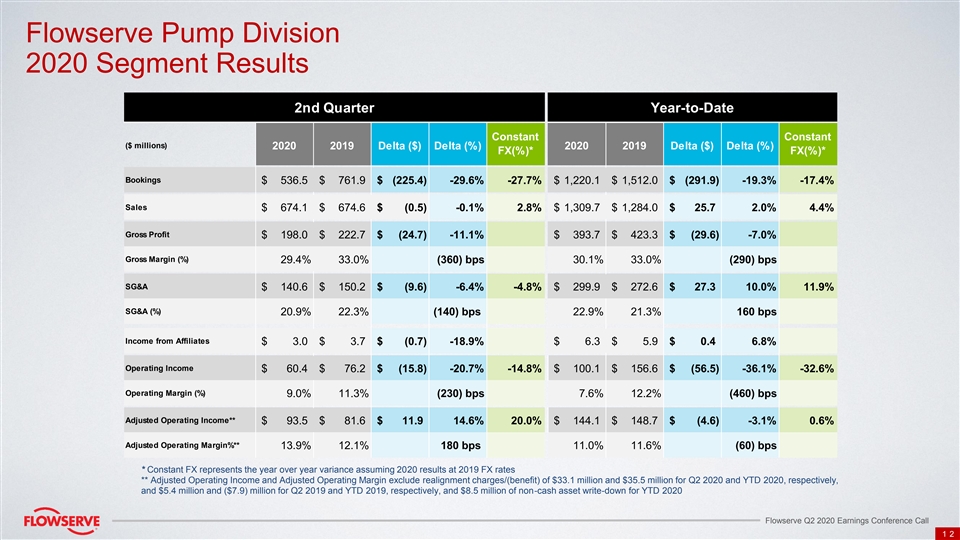
Flowserve Pump Division 2020 Segment Results 2nd Quarter Year-to-Date Constant Constant ($ millions) 2020 2019 Delta ($) Delta (%) 2020 2019 Delta ($) Delta (%) FX(%)* FX(%)* Bookings $ 536.5 $ 761.9 $ (225.4) -29.6% -27.7% $ 1,220.1 $ 1,512.0 $ (291.9) -19.3% -17.4% Sales $ 674.1 $ 674.6 $ (0.5) -0.1% 2.8% $ 1,309.7 $ 1,284.0 $ 25.7 2.0% 4.4% Gross Profit $ 198.0 $ 222.7 $ (24.7) -11.1% $ 393.7 $ 423.3 $ (29.6) -7.0% Gross Margin (%) 29.4% 33.0% (360) bps 30.1% 33.0% (290) bps SG&A $ 140.6 $ 150.2 $ (9.6) -6.4% -4.8% $ 299.9 $ 272.6 $ 27.3 10.0% 11.9% SG&A (%) 20.9% 22.3% (140) bps 22.9% 21.3% 160 bps Income from Affiliates $ 3.0 $ 3.7 $ (0.7) -18.9% $ 6.3 $ 5.9 $ 0.4 6.8% Operating Income $ 60.4 $ 76.2 $ (15.8) -20.7% -14.8% $ 100.1 $ 156.6 $ (56.5) -36.1% -32.6% Operating Margin (%) 9.0% 11.3% (230) bps 7.6% 12.2% (460) bps Adjusted Operating Income** $ 93.5 $ 81.6 $ 11.9 14.6% 20.0% $ 144.1 $ 148.7 $ (4.6) -3.1% 0.6% Adjusted Operating Margin%** 13.9% 12.1% 180 bps 11.0% 11.6% (60) bps * Constant FX represents the year over year variance assuming 2020 results at 2019 FX rates ** Adjusted Operating Income and Adjusted Operating Margin exclude realignment charges/(benefit) of $33.1 million and $35.5 million for Q2 2020 and YTD 2020, respectively, and $5.4 million and ($7.9) million for Q2 2019 and YTD 2019, respectively, and $8.5 million of non-cash asset write-down for YTD 2020 Flowserve Q2 2020 Earnings Conference Call 12Flowserve Pump Division 2020 Segment Results 2nd Quarter Year-to-Date Constant Constant ($ millions) 2020 2019 Delta ($) Delta (%) 2020 2019 Delta ($) Delta (%) FX(%)* FX(%)* Bookings $ 536.5 $ 761.9 $ (225.4) -29.6% -27.7% $ 1,220.1 $ 1,512.0 $ (291.9) -19.3% -17.4% Sales $ 674.1 $ 674.6 $ (0.5) -0.1% 2.8% $ 1,309.7 $ 1,284.0 $ 25.7 2.0% 4.4% Gross Profit $ 198.0 $ 222.7 $ (24.7) -11.1% $ 393.7 $ 423.3 $ (29.6) -7.0% Gross Margin (%) 29.4% 33.0% (360) bps 30.1% 33.0% (290) bps SG&A $ 140.6 $ 150.2 $ (9.6) -6.4% -4.8% $ 299.9 $ 272.6 $ 27.3 10.0% 11.9% SG&A (%) 20.9% 22.3% (140) bps 22.9% 21.3% 160 bps Income from Affiliates $ 3.0 $ 3.7 $ (0.7) -18.9% $ 6.3 $ 5.9 $ 0.4 6.8% Operating Income $ 60.4 $ 76.2 $ (15.8) -20.7% -14.8% $ 100.1 $ 156.6 $ (56.5) -36.1% -32.6% Operating Margin (%) 9.0% 11.3% (230) bps 7.6% 12.2% (460) bps Adjusted Operating Income** $ 93.5 $ 81.6 $ 11.9 14.6% 20.0% $ 144.1 $ 148.7 $ (4.6) -3.1% 0.6% Adjusted Operating Margin%** 13.9% 12.1% 180 bps 11.0% 11.6% (60) bps * Constant FX represents the year over year variance assuming 2020 results at 2019 FX rates ** Adjusted Operating Income and Adjusted Operating Margin exclude realignment charges/(benefit) of $33.1 million and $35.5 million for Q2 2020 and YTD 2020, respectively, and $5.4 million and ($7.9) million for Q2 2019 and YTD 2019, respectively, and $8.5 million of non-cash asset write-down for YTD 2020 Flowserve Q2 2020 Earnings Conference Call 12

Flowserve Pump Division 2020 Bookings and Sales 2nd Quarter Full Year Constant Constant ($ millions) 2020 2019 Delta (%) 2020 2019 Delta (%) FX(%)* FX(%)* 162 323 -50% -49% 419 640 -35% -33% OE 30% 42% (1200) bps 34% 42% (800) bps Bookings Mix ** 375 439 -15% -12% 801 872 -8% -6% AM 70% 58% 1200 bps 66% 58% 800 bps 272 244 11% 15% 525 451 16% 20% OE 40% 36% 400 bps 40% 35% 500 bps Sales Mix ** 402 431 -7% -4% 785 833 -6% -4% AM 60% 64% (400) bps 60% 65% (500) bps * Constant FX represents the year over year variance assuming 2020 results at 2019 FX rates ** Gross bookings and sales do not include interdivision eliminations Flowserve Q2 2020 Earnings Conference Call 13Flowserve Pump Division 2020 Bookings and Sales 2nd Quarter Full Year Constant Constant ($ millions) 2020 2019 Delta (%) 2020 2019 Delta (%) FX(%)* FX(%)* 162 323 -50% -49% 419 640 -35% -33% OE 30% 42% (1200) bps 34% 42% (800) bps Bookings Mix ** 375 439 -15% -12% 801 872 -8% -6% AM 70% 58% 1200 bps 66% 58% 800 bps 272 244 11% 15% 525 451 16% 20% OE 40% 36% 400 bps 40% 35% 500 bps Sales Mix ** 402 431 -7% -4% 785 833 -6% -4% AM 60% 64% (400) bps 60% 65% (500) bps * Constant FX represents the year over year variance assuming 2020 results at 2019 FX rates ** Gross bookings and sales do not include interdivision eliminations Flowserve Q2 2020 Earnings Conference Call 13
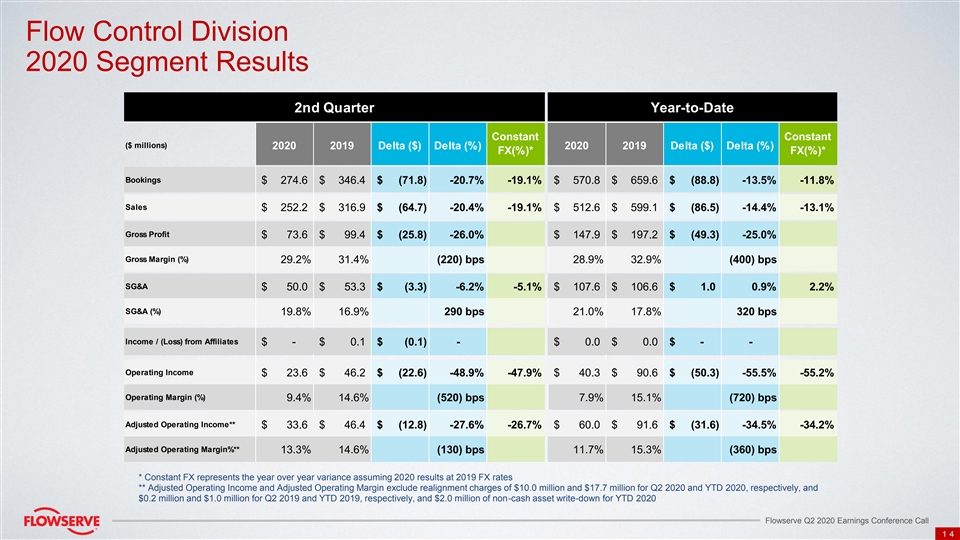
Flow Control Division 2020 Segment Results 2nd Quarter Year-to-Date Constant Constant ($ millions) 2020 2019 Delta ($) Delta (%) 2020 2019 Delta ($) Delta (%) FX(%)* FX(%)* Bookings $ 274.6 $ 346.4 $ (71.8) -20.7% -19.1% $ 570.8 $ 659.6 $ (88.8) -13.5% -11.8% Sales $ 252.2 $ 316.9 $ (64.7) -20.4% -19.1% $ 512.6 $ 599.1 $ (86.5) -14.4% -13.1% Gross Profit $ 73.6 $ 99.4 $ (25.8) -26.0% $ 147.9 $ 197.2 $ (49.3) -25.0% Gross Margin (%) 29.2% 31.4% (220) bps 28.9% 32.9% (400) bps SG&A $ 50.0 $ 53.3 $ (3.3) -6.2% -5.1% $ 107.6 $ 106.6 $ 1.0 0.9% 2.2% SG&A (%) 19.8% 16.9% 290 bps 21.0% 17.8% 320 bps Income / (Loss) from Affiliates $ - $ 0.1 $ (0.1) - $ 0.0 $ 0.0 $ - - Operating Income $ 23.6 $ 46.2 $ (22.6) -48.9% -47.9% $ 40.3 $ 90.6 $ (50.3) -55.5% -55.2% Operating Margin (%) 9.4% 14.6% (520) bps 7.9% 15.1% (720) bps Adjusted Operating Income** $ 33.6 $ 46.4 $ (12.8) -27.6% -26.7% $ 60.0 $ 91.6 $ (31.6) -34.5% -34.2% Adjusted Operating Margin%** 13.3% 14.6% (130) bps 11.7% 15.3% (360) bps * Constant FX represents the year over year variance assuming 2020 results at 2019 FX rates ** Adjusted Operating Income and Adjusted Operating Margin exclude realignment charges of $10.0 million and $17.7 million for Q2 2020 and YTD 2020, respectively, and $0.2 million and $1.0 million for Q2 2019 and YTD 2019, respectively, and $2.0 million of non-cash asset write-down for YTD 2020 Flowserve Q2 2020 Earnings Conference Call 14Flow Control Division 2020 Segment Results 2nd Quarter Year-to-Date Constant Constant ($ millions) 2020 2019 Delta ($) Delta (%) 2020 2019 Delta ($) Delta (%) FX(%)* FX(%)* Bookings $ 274.6 $ 346.4 $ (71.8) -20.7% -19.1% $ 570.8 $ 659.6 $ (88.8) -13.5% -11.8% Sales $ 252.2 $ 316.9 $ (64.7) -20.4% -19.1% $ 512.6 $ 599.1 $ (86.5) -14.4% -13.1% Gross Profit $ 73.6 $ 99.4 $ (25.8) -26.0% $ 147.9 $ 197.2 $ (49.3) -25.0% Gross Margin (%) 29.2% 31.4% (220) bps 28.9% 32.9% (400) bps SG&A $ 50.0 $ 53.3 $ (3.3) -6.2% -5.1% $ 107.6 $ 106.6 $ 1.0 0.9% 2.2% SG&A (%) 19.8% 16.9% 290 bps 21.0% 17.8% 320 bps Income / (Loss) from Affiliates $ - $ 0.1 $ (0.1) - $ 0.0 $ 0.0 $ - - Operating Income $ 23.6 $ 46.2 $ (22.6) -48.9% -47.9% $ 40.3 $ 90.6 $ (50.3) -55.5% -55.2% Operating Margin (%) 9.4% 14.6% (520) bps 7.9% 15.1% (720) bps Adjusted Operating Income** $ 33.6 $ 46.4 $ (12.8) -27.6% -26.7% $ 60.0 $ 91.6 $ (31.6) -34.5% -34.2% Adjusted Operating Margin%** 13.3% 14.6% (130) bps 11.7% 15.3% (360) bps * Constant FX represents the year over year variance assuming 2020 results at 2019 FX rates ** Adjusted Operating Income and Adjusted Operating Margin exclude realignment charges of $10.0 million and $17.7 million for Q2 2020 and YTD 2020, respectively, and $0.2 million and $1.0 million for Q2 2019 and YTD 2019, respectively, and $2.0 million of non-cash asset write-down for YTD 2020 Flowserve Q2 2020 Earnings Conference Call 14

Flow Control Division 2020 Bookings and Sales 2nd Quarter Full Year Constant Constant ($ millions) 2020 2019 Delta (%) 2020 2019 Delta (%) FX(%)* FX(%)* 205 276 -26% -24% 423 509 -17% -15% OE 75% 80% (500) bps 74% 77% (300) bps Bookings Mix ** 69 71 -2% -1% 148 150 -2% 0% AM 25% 20% 500 bps 26% 23% 300 bps 192 250 -23% -22% 392 465 -16% -14% OE 76% 79% (300) bps 77% 78% (100) bps Sales Mix ** 60 67 -10% -9% 120 134 -10% -10% AM 24% 21% 300 bps 23% 22% 100 bps * Constant FX represents the year over year variance assuming 2020 results at 2019 FX rates ** Gross bookings and sales do not include interdivision eliminations Flowserve Q2 2020 Earnings Conference Call 15Flow Control Division 2020 Bookings and Sales 2nd Quarter Full Year Constant Constant ($ millions) 2020 2019 Delta (%) 2020 2019 Delta (%) FX(%)* FX(%)* 205 276 -26% -24% 423 509 -17% -15% OE 75% 80% (500) bps 74% 77% (300) bps Bookings Mix ** 69 71 -2% -1% 148 150 -2% 0% AM 25% 20% 500 bps 26% 23% 300 bps 192 250 -23% -22% 392 465 -16% -14% OE 76% 79% (300) bps 77% 78% (100) bps Sales Mix ** 60 67 -10% -9% 120 134 -10% -10% AM 24% 21% 300 bps 23% 22% 100 bps * Constant FX represents the year over year variance assuming 2020 results at 2019 FX rates ** Gross bookings and sales do not include interdivision eliminations Flowserve Q2 2020 Earnings Conference Call 15

Investor Relations Contacts Jay Roueche Mike Mullin 972.443.6560 972.443.6636 jroueche@flowserve.com mmullin@flowserve.com Flowserve Q2 2020 Earnings Conference Call 16Investor Relations Contacts Jay Roueche Mike Mullin 972.443.6560 972.443.6636 jroueche@flowserve.com mmullin@flowserve.com Flowserve Q2 2020 Earnings Conference Call 16