Attached files
| file | filename |
|---|---|
| EX-99.3 - EXHIBIT 99.3 - AMERICAN INTERNATIONAL GROUP, INC. | tm2026340d1_ex99-3.htm |
| EX-99.1 - EXHIBIT 99.1 - AMERICAN INTERNATIONAL GROUP, INC. | tm2026340d1_ex99-1.htm |
| 8-K - FORM 8-K - AMERICAN INTERNATIONAL GROUP, INC. | tm2026340d1_8k.htm |
Exhibit 99.2

Second Quarter 2020 Financial Results Presentation August 3, 2020

This document and the remarks made within this presentation may include, and officers and representatives of American Interna tio nal Group, Inc. (AIG) may from time to time make and discuss, projections, goals, assumptions and statements that may constitute “forward - looking statements” within the meaning of the Private Securities Litigation Reform Act of 1995. These projections, goals, assumptions and statements are not historical facts but instead represent only a belief regar din g future events, many of which, by their nature, are inherently uncertain and outside AIG’s control. These projections, goals, assumptions and statements include statements prece ded by, followed by or including words such as “will,” “believe,” “anticipate,” “expect,” “intend,” “plan,” “focused on achieving,” “view,” “target,” “goal” or “estimate.” These pr oje ctions, goals, assumptions and statements may relate to future actions, prospective services or products, future performance or results of current and anticipated services or produc ts, sales efforts, expenses, the outcome of contingencies such as legal proceedings, anticipated organizational, business or regulatory changes, the effect of catastrophes and macroec ono mic events, such as COVID - 19, anticipated dispositions, monetization and/or acquisitions of businesses or assets, or successful integration of acquired businesses, man age ment succession and retention plans, exposure to risk, trends in operations and financial results. It is possible that AIG’s actual results and financial condition will diffe r, possibly materially, from the results and financial condition indicated in these projections, goals, assumptions and statements. Factors that could cause AIG’s actual results to differ, p oss ibly materially, from those in the specific projections, goals, assumptions and statements include: the adverse impact of COVID - 19, including with respect to AIG’s business, financial c ondition and results of operations; changes in market and industry conditions, including the significant global economic downturn, general market declines, prolonged econom ic recovery and disruptions to AIG’s operations driven by COVID - 19 and responses thereto, including new or changed governmental policy and regulatory actions; the occurrence of catast rophic events, both natural and man - made, including COVID - 19, pandemics, civil unrest and the effects of climate change; AIG’s ability to effectively execute on AIG 200 o perational programs designed to achieve underwriting excellence, modernization of AIG’s operating infrastructure, enhanced user and customer experiences and unification of AIG; t he impact of potential information technology, cybersecurity or data security breaches, including as a result of cyber - attacks or security vulnerabilities, the likelihood of w hich may increase due to extended remote business operations as a result of COVID - 19; disruptions in the availability of AIG’s electronic data systems or those of third parties; the effectiveness of our risk management policies and procedures, including with respect to our business continuity and disaster recovery plans; changes in judgments concerning po ten tial cost - saving opportunities; concentrations in AIG’s investment portfolios; changes to the valuation of AIG’s investments; actions by credit rating agencies; changes in jud gme nts concerning insurance underwriting and insurance liabilities; the effectiveness of strategies to recruit and retain key personnel and to implement effective succession plans; th e requirements, which may change from time to time, of the global regulatory framework to which AIG is subject; significant legal, regulatory or governmental proceedings; AIG’s ability to successfully manage Legacy Portfolios; AIG’s ability to successfully dispose of, monetize and/or acquire businesses or assets or successfully integrate acquired businesses; changes in judgments concerning the recognition of deferred tax assets and the impairment of goodwill; and such other factors discussed in Part I, Item 2. Management’s Discussion and An aly sis of Financial Condition and Results of Operations (MD&A) and Part II, Item 1A. Risk Factors in AIG’s Quarterly Report on Form 10 - Q for the quarterly period ended June 30, 2020 (w hich will be filed with the Securities and Exchange Commission), Part I, Item 2. MD&A in AIG’s Quarterly Report on Form 10 - Q for the quarterly period ended March 31, 2020 and Part I, Item 1A. Risk Factors and Part II, Item 7. MD&A in AIG’s Annual Report on Form 10 - K for the year ended December 31, 2019. COVID - 19 is adversely affecting, and is expected to continue to adversely affect, our business, financial condition and results of operations, its ultimate impact of which will depend on future developments that are uncertain and cannot be predicted, including the scope and duration of the crisis and actions ta ken by governmental and regulatory authorities in response thereto. Even after the crisis subsides, it is possible that the U.S. and other major economies will experience a pr olo nged recession, in which event our businesses, results of operations and financial condition could be materially and adversely affected. Statements about the effects of COVID - 19 on ou r business, financial condition and results of operations may constitute forward - looking statements and are subject to the risk that the actual impacts may differ, possibly ma terially, from what is reflected in those forward - looking statements due to factors and future developments that are uncertain, unpredictable and in many cases beyond our control, inc lud ing the scope and duration of the COVID - 19 and actions taken by governmental and regulatory authorities in response to mitigate its impact. AIG is not under any obligation (and expressly disclaims any obligation) to update or alter any projections, goals, assumptio ns or other statements, whether written or oral, that may be made from time to time, whether as a result of new information, future events or otherwise. This document and the remarks made orally may also contain certain non - GAAP financial measures. The reconciliation of such measu res to the most comparable GAAP measures in accordance with Regulation G is included in the earnings release and Second Quarter 2020 Financial Supplement available in th e I nvestor Information section of AIG's corporate website, www.aig.com, as well as in the Appendix to this presentation. Note: Amounts presented may not foot due to rounding. Cautionary Statement Regarding Forward - Looking Information 2
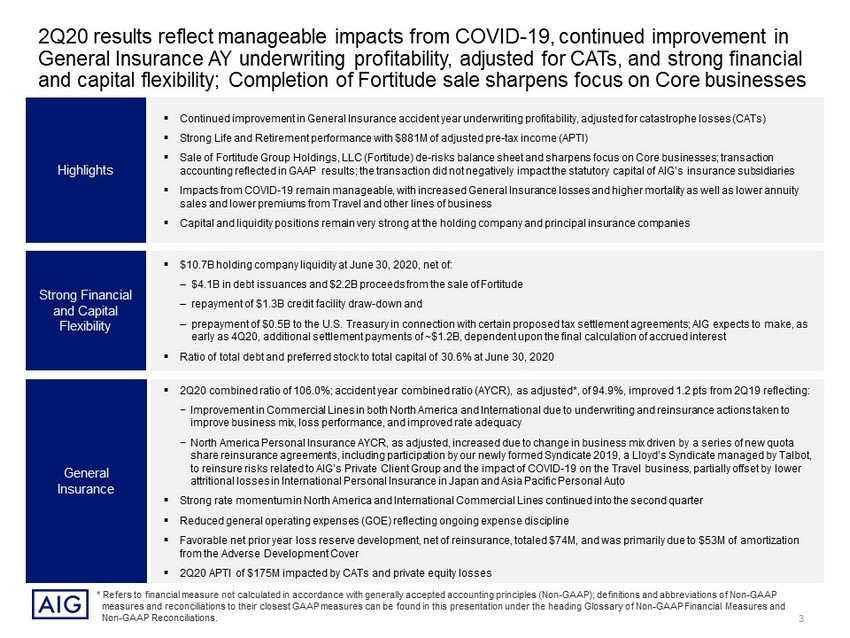
* Refers to financial measure not calculated in accordance with generally accepted accounting principles (Non - GAAP); definitions and abbreviations of Non - GAAP measures and reconciliations to their closest GAAP measures can be found in this presentation under the heading Glossary of N on - GAAP Financial Measures and Non - GAAP Reconciliations. Highlights ▪ Continued improvement in General Insurance accident year underwriting profitability, adjusted for catastrophe losses (CATs) ▪ Strong Life and Retirement performance with $881M of a djusted pre - tax income (APTI) ▪ Sale of Fortitude Group Holdings, LLC (Fortitude) de - risks balance sheet and sharpens focus on Core businesses; transaction accounting reflected in GAAP results; the transaction did not negatively impact the statutory capital of AIG’s insurance subs idi aries ▪ Impacts from COVID - 19 remain manageable, with increased General Insurance losses and higher mortality as well as lower annuity sales and lower premiums from Travel and other lines of business ▪ Capital and liquidity positions remain very strong at the holding company and principal insurance companies Strong Financial and Capital Flexibility ▪ $10.7B holding company liquidity at June 30, 2020, net of: ‒ $4.1B in debt issuances and $2.2B proceeds from the sale of Fortitude ‒ repayment of $1.3B credit facility draw - down and ‒ prepayment of $0.5B to the U.S. Treasury in connection with certain proposed tax settlement agreements; AIG expects to make, as early as 4Q20, additional settlement payments of ~$1.2B, dependent upon the final calculation of accrued interest ▪ Ratio of total debt and preferred stock to total capital of 30.6% at June 30, 2020 General Insurance ▪ 2Q20 combined ratio of 106.0%; accident year combined ratio (AYCR) , as adjusted*, of 94.9%, improved 1.2 pts from 2Q19 reflecting: − Improvement in Commercial Lines in both North America and International due to underwriting and reinsurance actions taken to improve business mix, loss performance, and improved rate adequacy − North America Personal Insurance AYCR, as adjusted, increased due to change in business mix driven by a series of new quota share reinsurance agreements, including participation by our newly formed Syndicate 2019, a Lloyd’s Syndicate managed by Talb ot, to reinsure risks related to AIG’s Private Client Group and the impact of COVID - 19 on the Travel business, partially offset by l ower attritional losses in International Personal Insurance in Japan and Asia Pacific Personal Auto ▪ Strong rate momentum in North America and International Commercial Lines continued into the second quarter ▪ Reduced general operating expenses (GOE) reflecting ongoing expense discipline ▪ Favorable net prior year loss reserve development, net of reinsurance, totaled $74M, and was primarily due to $53M of amortiz ati on from the Adverse Development Cover ▪ 2Q20 APTI of $175M impacted by CATs and private equity losses 2Q20 results reflect manageable impacts from COVID - 19, continued improvement in General Insurance AY underwriting profitability, adjusted for CATs, and strong financial and capital flexibility; Completion of Fortitude sale sharpens focus on Core businesses 3
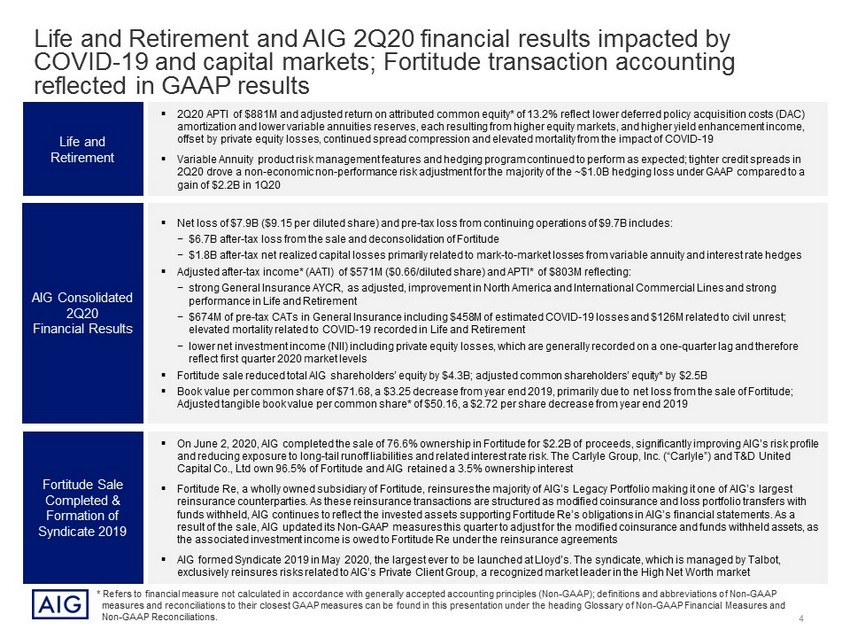
* Refers to financial measure not calculated in accordance with generally accepted accounting principles (Non - GAAP); definitions and abbreviations of Non - GAAP measures and reconciliations to their closest GAAP measures can be found in this presentation under the heading Glossary of N on - GAAP Financial Measures and Non - GAAP Reconciliations. Fortitude Sale Completed & Formation of Syndicate 2019 ▪ On June 2, 2020, AIG completed the sale of 76.6% ownership in Fortitude for $2.2B of proceeds, significantly improving AIG’s ris k profile and reducing exposure to long - tail runoff liabilities and related interest rate risk. The Carlyle Group, Inc. (“Carlyle”) and T& D United Capital Co., Ltd own 96.5% of Fortitude and AIG retained a 3.5% ownership interest ▪ Fortitude Re, a wholly owned subsidiary of Fortitude, reinsures the majority of AIG’s Legacy Portfolio making it one of AIG’s la rgest reinsurance counterparties. As these reinsurance transactions are structured as modified coinsurance and loss portfolio trans fer s with funds withheld, AIG continues to reflect the invested assets supporting Fortitude Re’s obligations in AIG’s financial statements. As a result of the sale, AIG updated its Non - GAAP measures this quarter to adjust for the modified coinsurance and funds withheld ass ets, as the associated investment income is owed to Fortitude Re under the reinsurance agreements ▪ AIG formed Syndicate 2019 in May 2020, the largest ever to be launched at Lloyd’s. The syndicate, which is managed by Talbot, exclusively reinsures risks related to AIG’s Private Client Group, a recognized market leader in the High Net Worth market AIG Consolidated 2Q20 Financial Results ▪ Net loss of $7.9B ($9.15 per diluted share) and pre - tax loss from continuing operations of $9.7B includes: − $6.7B after - tax loss from the sale and deconsolidation of Fortitude − $1.8B after - tax net realized capital losses primarily related to mark - to - market losses from variable annuity and interest rate h edges ▪ Adjusted after - tax income* (AATI) of $571M ($0.66/diluted share) and APTI* of $803M reflecting: − strong General Insurance AYCR, as adjusted, improvement in North America and International Commercial Lines and strong performance in Life and Retirement − $674M of pre - tax CATs in General Insurance including $458M of estimated COVID - 19 losses and $126M related to civil unrest; elevated mortality related to COVID - 19 recorded in Life and Retirement − lower net investment income (NII) including private equity losses, which are generally recorded on a one - quarter lag and therefo re reflect first quarter 2020 market levels ▪ Fortitude sale reduced total AIG shareholders’ equity by $4.3B; adjusted common shareholders’ equity* by $2.5B ▪ Book value per common share of $71.68, a $3.25 decrease from year end 2019, primarily due to net loss from the sale of Fortit ude ; Adjusted tangible book value per common share* of $50.16, a $2.72 per share decrease from year end 2019 Life and Retirement ▪ 2Q20 APTI of $881M and adjusted return on attributed common equity* of 13.2% reflect lower deferred policy acquisition costs (DA C) amortization and lower variable annuities reserves, each resulting from higher equity markets, and higher yield enhancement i nco me, offset by private equity losses, continued spread compression and elevated mortality from the impact of COVID - 19 ▪ Variable Annuity product risk management features and hedging program continued to perform as expected; tighter credit spread s i n 2Q20 drove a non - economic non - performance risk adjustment for the majority of the ~$1.0B hedging loss under GAAP compared to a gain of $2.2B in 1Q20 Life and Retirement and AIG 2Q20 financial results impacted by COVID - 19 and capital markets; Fortitude transaction accounting reflected in GAAP results 4
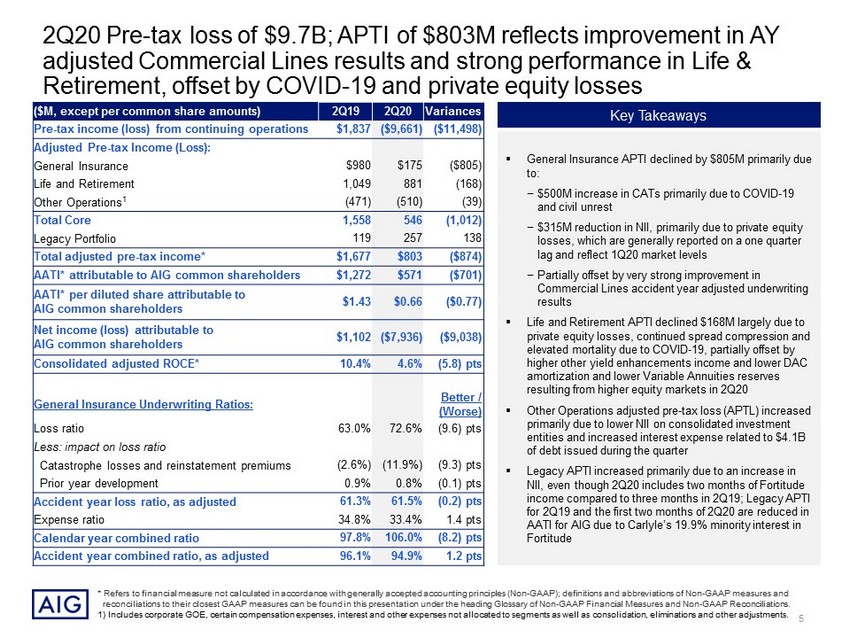
* Refers to financial measure not calculated in accordance with generally accepted accounting principles (Non - GAAP); definitions and abbreviations of Non - GAAP measures and reconciliations to their closest GAAP measures can be found in this presentation under the heading Glossary of Non - GAAP Financia l Measures and Non - GAAP Reconciliations. 1) Includes corporate GOE, certain compensation expenses, interest and other expenses not allocated to segments as well as conso lid ation, eliminations and other adjustments. Key Takeaways ▪ General Insurance APTI declined by $805M primarily due to: − $500M increase in CATs primarily due to COVID - 19 and civil unrest − $315M reduction in NII, primarily due to private equity losses, which are generally reported on a one quarter lag and reflect 1Q20 market levels − Partially offset by very strong improvement in Commercial Lines accident year adjusted underwriting results ▪ Life and Retirement APTI declined $168M largely due to private equity losses, continued spread compression and elevated mortality due to COVID - 19, partially offset by higher other yield enhancements income and lower DAC amortization and lower Variable Annuities reserves resulting from higher equity markets in 2Q20 ▪ Other Operations adjusted pre - tax loss (APTL) increased primarily due to lower NII on consolidated investment entities and increased interest expense related to $4.1B of debt issued during the quarter ▪ Legacy APTI increased primarily due to an increase in NII, even though 2Q20 includes two months of Fortitude income compared to three months in 2Q19; Legacy APTI for 2Q19 and the first two months of 2Q20 are reduced in AATI for AIG due to Carlyle’s 19.9% minority interest in Fortitude ($M, except per common share amounts) 2Q19 2Q20 Variances Pre - tax income ( loss) from continuing operations $1,837 ($9,661) ($11,498) Adjusted Pre - tax Income (Loss): General Insurance $980 $175 ($805) Life and Retirement 1,049 881 (168) Other Operations 1 (471) (510) (39) Total Core 1,558 546 (1,012) Legacy Portfolio 119 257 138 Total adjusted pre - tax income* $1,677 $803 ($874) AATI* attributable to AIG common shareholders $1,272 $571 ($701) AATI* per diluted share attributable to AIG common shareholders $1.43 $0.66 ($0.77) Net income (loss) attributable to AIG common shareholders $1,102 ($7,936) ($9,038) Consolidated adjusted ROCE* 10.4% 4.6% (5.8) pts General Insurance Underwriting Ratios: Better / (Worse) Loss ratio 63.0% 72.6% (9.6) pts Less: impact on loss ratio Catastrophe losses and reinstatement premiums (2.6%) (11.9%) (9.3) pts Prior year development 0.9% 0.8% (0.1) pts Accident year loss ratio, as adjusted 61.3% 61.5% (0.2) pts Expense ratio 34.8% 33.4% 1.4 pts Calendar year c ombined ratio 97.8% 106.0% (8.2) pts Accident year combined ratio, as adjusted 96.1% 94.9% 1.2 pts 2Q20 Pre - tax loss of $9.7B; APTI of $803M reflects improvement in AY adjusted Commercial Lines results and strong performance in Life & Retirement, offset by COVID - 19 and private equity losses 5

2Q19 and 2Q20 noteworthy items 1) Computed using a U.S. statutory tax rate of 21%. 2) Computed using weighted average diluted shares on an operating basis, which is provided on page 6 of the 2Q20 Financial Suppl eme nt. 3) Includes General Insurance and Legacy General Insurance Runoff. 4) The annualized expected rate of return for 2Q19 and 2Q20 is 8% and 6% for alternative investments and 6% and 4% for FVO fixed ma turity securities, respectively; FVO fixed maturity securities includes the fair value changes on the DIB and GCM asset portfolios. 5) The effective tax rate differs from the statutory tax rate of 21% primarily due to tax effects of the Majority Interest Forti tud e Sale. 2Q19 – Income / (Loss) 2Q20 – Income / (Loss) ($M, except per share amounts ) Pre - tax After - tax 1 EPS – Diluted 2 Pre - tax After - tax 1 EPS – diluted 2 General Insurance – Catastrophe losses, net of reinsurance, ex. COVID - 19 ($174) ($137) ($0.15) ($216) ($171) ($0.20) General Insurance – Catastrophe losses related to COVID - 19 - - - (458) (362) (0.42) Favorable prior year loss reserve development, net of reinsurance 3 63 50 0.06 76 60 0.07 Investment Performance: Better (worse) than expected alternative investment returns 4 199 157 0.18 (246) (194) (0.22) Better (worse) than expected Direct Investment Book (DIB) and Global Capital Markets (GCM) returns 14 11 0.01 24 19 0.02 Better (worse) than expected fair value changes on Fixed Maturity Securities – Other accounted under FVO 4 (32) (25) (0.03) 303 239 0.28 Total noteworthy items – APTI basis $70 $55 $0.06 ($517) ($408) ($0.47) Other Noteworthy Items: Loss on sale and deconsolidation of Fortitude – included in GAAP 5 - - - ($8,412) ($6,756) ($7.79) 6

1) Includes AIG notes, bonds, loans and mortgages payable, AIG Life Holdings, Inc. (AIGLH) notes and bonds payable and junior su bor dinated debt, and Validus notes and bonds payable. 2) June 30, 2020 AOCI is computed as GAAP AOCI of $9.2B excluding $4.2B of cumulative unrealized gains and losses related to For tit ude Re’s funds withheld assets. 3) The inclusion of RBC measures is intended solely for the information of investors and is not intended for the purpose of rank ing any insurance company or for use in connection with any marketing, advertising or promotional activities. ACL is defined as Authorized Control Level and CAL is defined as Company Ac tio n Level. RBC ratio for Domestic Life and Retirement companies excludes holding company, AGC Life Insurance Company. 2018 RBC ratio for Life and Retirement reflects the impact of ta x reform. 4) Preliminary range subject to change with completion of statutory closing process. 5) As of the date of this presentation, S&P, Moody’s, and A.M. Best have Stable outlooks. Fitch has a Negative outlook, with the ex ception of the Non - Life Insurance Companies, which is Stable. For General Insurance companies FSR and Life and Retirement companies FSR, ratings only reflect those of the core ins ura nce companies. Strong capital position at the parent company and principal insurance companies $51.2 $48.2 $9.0 $8.6 $0.5 $0.5 $5.0 $5.0 $1.8 $0.6 $21.8 $25.5 $1.5 $1.5 December 31, 2019 June 30, 2020 Hybrids Financial Debt NCI AOCI Preferred Equity Tax attribute DTA Adjusted S/E Ratios: Dec. 31 , 2019 June 30 , 2020 Hybrids / Total capital 1.7% 1.7% Financial debt / Total capital 24.0% 28.4% Total Hybrids & Financial debt / Total capital 25.7% 30.1% Preferred stock / Total capital 0.5% 0.5% Total debt and preferred stock / Total capital 26.2% 30.6% Total debt and preferred stock / Total capital (ex. AOCI) 2 27.8% 32.4% Capital Structure ($B) Year / Quarter End Life and Retirement Companies General Insurance Companies 2018 389% (CAL) 394% (ACL) 2019 402% (CAL) 419% (ACL) 2Q20E 4 420% - 430% (CAL) 440% - 450% (ACL) Risk Based Capital (RBC) Ratios 3 Credit Ratings 5 S&P Moody’s Fitch A.M. Best AIG – Senior Debt BBB+ Baa1 BBB+ NR General Insurance – FSR A+ A2 A A Life and Retirement – FSR A+ A2 A+ A 1 $90.8 $89.9 Total Equity: $67.4 Total Equity: $62.8 2 Pending finalization of Statutory financials 7

$5.1 12.9 $11.3 $7.7 $2.4 $3.0 $4.5 AIG Parent Liquidity Balance at 3/31/2020 Insurance Company Distributions Debt Issuances Sale of Fortitude Credit Facility Repayment Capital Contributions Related to Sale of Fortitude IRS Tax Prepayment Common & Preferred Dividends Interest Paid on Parent Debt Other AIG Parent Liquidity Balance at 6/30/2020 Undrawn Credit Facility AIG Parent Liquidity Sources Balance at 6/30/2020 AIG Parent liquidity balance remains strong at $10.7B at June 30, 2020 Changes in AIG Parent Liquidity ($B) Includes: Life Dividends: $25M GI Dividends: $178M Tax Payments from Subsidiaries: $240M $0.4 $7.5 $10.7 ($1.3) Unencumbered Securities Cash & S/T Investments ($0.5) $4.1 ($0.8) $2.2 ($0.3) ($0.3) ($0.3) Includes: Life Contributions: $135M GI Contributions: $700M $15.2 8

Investment portfolio credit quality continues to be strong with limited impact on ratings in 2Q20; AIG’s corporate debt portfolio is well diversified by asset class and industry sector Note: Amounts shown for segments are before consolidations and eliminations. NAIC Designation June 30, 2020 – $263.9B NAIC 1 61% NAIC 2 31% NAIC 3 - 6 8% Fair value of total Fixed Maturity securities increased 7% since March 31, 2020 $10.0 $25.8 $6.0 $1.7 $14.1 $5.8 $1.5 $7.0 $2.3 $3.5 $14.4 $4.6 $2.4 $7.1 $1.9 $1.3 $5.4 $1.3 $1.4 $8.3 $2.3 $0.8 $3.5 $1.2 $3.3 $14.7 $5.8 General Insurance Life and Retirement Other and Legacy Other Basic Energy Capital goods Consumer cyclical Consumer noncyclical Communications Utilities Financial Institutions Corporate Debt by Industry Sector June 30, 2020 – $156.8B $25.8 $100.1 $31.3 9

$3,014 $3,265 $396 $553 $2,025 $1,997 $593 $715 ($170) $423 ($56) $60 ($46) $193 ($68) $170 $463 $257 $280 $107 $136 $156 $47 ($6) 2Q20 2Q19 2Q20 2Q19 2Q20 2Q19 2Q20 2Q19 Interest & dividends Alternative investments All other NII of $3.4B ($3.2B APTI basis 1 ); Gross Investment Income, APTI basis 1 , decrease driven by private equity losses; 2Q19 results included a large IPO gain from a private equity holding Invested Assets & Gross Investment Income, APTI Basis Gross Investment Income, APTI basis ($M) 2Q20 Annualized Investment Yield 3.79% 5.02% 4.56% 3.15% 4.54% 4.14% General Insurance Life & Retirement Consolidated AIG 2Q20 Invested Assets $B Fixed Maturities Alternatives All Other General Insurance $75.3 $4.6 $2.9 Life & Retirement 179.0 2.9 4.5 Legacy & Other 2 51.0 0.5 7.7 Total AIG $305.3 $8.0 $15.1 $879 $572 $2,346 $2,115 $720 $620 $3,945 $3,307 10.94% 34.70% 19.37% (5.82%) (6.48%) (8.89%) General Insurance Life & Retirement Consolidated AIG Total Alternative Investments 10.91% 21.32% 33.26% (21.20%) Hedge Funds Private Equity Consolidated AIG Hedge Funds & Private Equity Fixed Maturities 3 Alternative Investments 2Q19 2Q20 2Q19 2Q20 2Q19 2Q20 2Q19 2Q20 3.79% 5.02% 4.56% 3.15% 4.54% 3.98% General Insurance Life & Retirement Total 2Q19 2Q20 3.79% 5.02% 4.56% 3.15% 4.54% 3.98% General Insurance Life & Retirement Total 2Q19 2Q20 1) Refers to financial measure not calculated in accordance with generally accepted accounting principles (Non - GAAP); definitions a nd abbreviations of Non - GAAP measures and reconciliations to their closest GAAP measures can be found in this presentation under the heading Glossary of Non - GAAP Financial Measures and Non - GAAP R econciliations. 2) As the Fortitude sale closed on June 2, 2020, 2Q20 adjusted pre - tax NII included $378M related to investment income on two month s of Fortitude assets compared to $498M in 2Q19. 3) Interest and dividends include amounts related to commercial mortgage loan prepayments and call and tender income; Life and R eti rement annualized yields include yield on collateral related to hedging program . 10

Continued execution of AIG 200, a global, multi - year initiative to achieve transformational change and $1B of GOE savings General Insurance 1 The Standard Commercial Underwriting Platform will modernize global underwriting capabilities by simplifying processes and tools to create a contemporary data architecture 2 Transform Japan business into a next - generation digital insurance company with the ability to offer “anywhere, anytime, any device” experience 3 Improve decision - making in Private Client Group through modernizing legacy technology and moving to digitized workloads Shared Services 4 Create AIG Global Operations , a multifunctional, fully integrated operating model with digitally enabled end - to - end process and increased scope and scale Information Technology 5 Transform IT operating model 6 Build a modern, scalable and secure technology foundation to improve operational stability and enable faster business technology deployment Finance 7 Transform Finance operating model 8 Modernize infrastructure through technology solutions and simplify finance and actuarial processes , while materially improving analytics capabilities Procurement 9 Create a highly efficient global procurement and sourcing organization to leverage our purchasing power, maximize value, minimize risk, and support sustained profitable growth Real Estate 10 Optimize portfolio to ensure it is cost effective, resilient and reflective of global footprint AIG 200 Costs to Achieve and GOE Benefits ($M) 1H’20 2020E 2021E 2022E Total Comments Investment / Costs to Achieve Capitalized assets, not in APTI initially $32 $100 $200 $100 $400 Amortized / depreciated in GOE / APTI when IT or capital asset placed into service 1 Restructuring and Other charges, in Net Income $109 $250 $300 $350 $900 No impact to APTI; primarily related to professional, IT and restructuring fees Total investment $141 $350 $500 $450 $1,300 Run - rate net GOE savings, cumulative 1 ~$140 0 $300 $600 $1,000 1H20 GOE savings of ~$40M, which translates to ~$140M on an annualized basis; part of the planned $300M by year - end Annual net benefit to APTI $150 2 ~75% in GI; ~12.5% in L&R; ~12.5% in Other Operations 1) Includes estimated amortization / depreciation related to the capitalized assets of ~$10M - $15M and ~$25M - $30M for 2021 and 2022, respectively. The unamortized balance will be expensed at ~$50M per year from 2023 - 2027 and the remainder will trail off in the periods thereafter . 2) Initial estimate based on full year expense savings due to AIG 200 that result in $300M exit run - rate in 4Q20. 11

61.3% 61.5% 22.2% 20.0% 12.6% 13.4% - 0.9% - 0.8% 2.6% 11.9% 2Q19 2Q20 AYLR, As Adj. Acq. Ratio GOE Ratio PYD Ratio CAT Ratio 61.3% 61.5% 34.8% 33.4% 96.1% 94.9% 2Q19 Change in Personal Insurance business mix AYLR U/W Actions Expense Ratio 2Q20 AYLR, As Adj. Expense Ratio Note: Calendar year combined ratios refers to a GAAP measure; the corresponding accident year, as adjusted, ratios refers to fin ancial measure not calculated in accordance with GAAP; definitions and abbreviations of Non - GAAP measures and reconciliations to their closest GAAP measures can be found in this presentation under the heading Glossary of Non - GAAP Financial Measures and Non - GAAP Reconciliations. 1) 2Q20 includes COVID - 19 losses of $458M, $126M related to civil unrest and $90M of natural CATs General Insurance: Calendar year underwriting results reflect $458M in COVID - 19 losses; AY, as adjusted, results reflect strong Commercial Lines improvement and the formation of Lloyd’s Syndicate 2019 on Personal Insurance Net Premiums Written ($M) Calendar Year Combined Ratios (CYCR) Accident Year Combined Ratios (excl. CATs) walk 97.8% 106.0% ($M) 2Q19 2Q20 Net premiums written $6,581 $5,549 Net premiums earned $6,694 $5,737 Loss and loss adjustment expense 4,215 4,167 Acquisition expenses 1,488 1,147 General operating expenses 844 766 Underwriting income (loss) $147 ($343) Net investment income $833 $518 Adjusted pre - tax income $980 $175 Exclude: Impact of CATs 1 (174) (674) Adjusted pre - tax income (ex. CATs) $1,154 $849 (1.4%) $2,364 $2,497 $1,516 $1,575 $943 $(150) $1,758 $1,627 2Q19 2Q20 International Personal Insurance North America Personal Insurance International Commercial Lines North America Commercial Lines $5,549 $6,581 45% 28% 36% 23% 1.2% 1.4% with 9.3 pt increase in CATs 14% 27% 29% (2%) 12
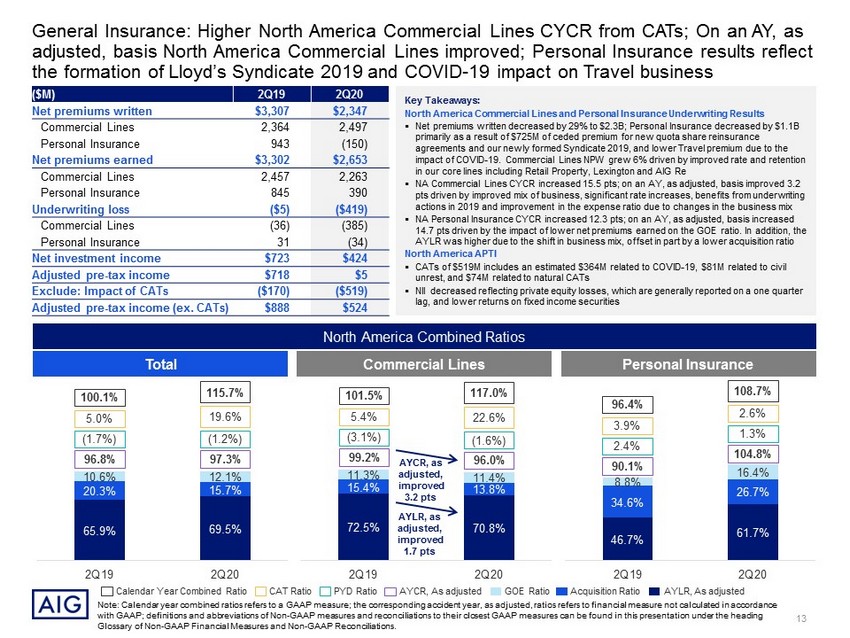
General Insurance: Higher North America Commercial Lines CYCR from CATs; On an AY, as adjusted, basis North America Commercial Lines improved; Personal Insurance results reflect the formation of Lloyd’s Syndicate 2019 and COVID - 19 impact on Travel business Key Takeaways: North America Commercial Lines and Personal Insurance Underwriting Results ▪ Net premiums written decreased by 29% to $2.3B; Personal Insurance decreased by $1.1B primarily as a result of $725M of ceded premium for new quota share reinsurance agreements and our newly formed Syndicate 2019, and lower Travel premium due to the impact of COVID - 19. Commercial Lines NPW grew 6% driven by improved rate and retention in our core lines including Retail Property, Lexington and AIG Re ▪ NA Commercial Lines CYCR increased 15.5 pts; on an AY, as adjusted, basis improved 3.2 pts driven by improved mix of business, significant rate increases, benefits from underwriting actions in 2019 and improvement in the expense ratio due to changes in the business mix ▪ NA Personal Insurance CYCR increased 12.3 pts; on an AY, as adjusted, basis increased 14.7 pts driven by the impact of lower net premiums earned on the GOE ratio. In addition, the AYLR was higher due to the shift in business mix, offset in part by a lower acquisition ratio North America APTI ▪ CATs of $519M includes an estimated $364M related to COVID - 19, $81M related to civil unrest, and $74M related to natural CATs ▪ NII decreased reflecting private equity losses, which are generally reported on a one quarter lag, and lower returns on fixed income securities ($M) 2Q19 2Q20 Net premiums written $3,307 $2,347 Commercial Lines 2,364 2,497 Personal Insurance 943 (150) Net premiums earned $3,302 $2,653 Commercial Lines 2,457 2,263 Personal Insurance 845 390 Underwriting loss ($5) ($419) Commercial Lines (36) (385) Personal Insurance 31 (34) Net investment income $723 $424 Adjusted pre - tax income $718 $5 Exclude: Impact of CATs ($170) ($519) Adjusted pre - tax income (ex. CATs) $888 $524 North America Combined Ratios 65.9% 69.5% 20.3% 15.7% 10.6% 12.1% 2Q19 2Q20 CAT Ratio Calendar Year Combined Ratio PYD Ratio Acquisition Ratio AYLR, As adjusted GOE Ratio AYCR, As adjusted 72.5% 70.8% 15.4% 13.8% 11.3% 11.4% 2Q19 2Q20 46.7% 61.7% 34.6% 26.7% 8.8% 16.4% 2Q19 2Q20 96.8% 100.1% 5.0% (1.7%) 97.3% 115.7% 19.6% (1.2%) Total 99.2% 101.5% 5.4% (3.1%) 96.0% 117.0% 22.6% (1.6%) Commercial Lines 90.1% 96.4% 3.9% 2.4% 104.8% 108.7% 2.6% 1.3% Personal Insurance AYLR, as adjusted, improved 1.7 pts AYCR, as adjusted, improved 3.2 pts Note: Calendar year combined ratios refers to a GAAP measure; the corresponding accident year, as adjusted, ratios refers to fin ancial measure not calculated in accordance with GAAP; definitions and abbreviations of Non - GAAP measures and reconciliations to their closest GAAP measures can be found in this presentation under the heading Glossary of Non - GAAP Financial Measures and Non - GAAP Reconciliations. 13

General Insurance: Increase to International CYCR; International AY, as adjusted, improved due to premium rate increases, underwriting actions and portfolio optimization Key Takeaways: International Commercial Lines and Personal Insurance Underwriting Results ▪ Net premiums written decreased 2% (1% on a constant dollar basis); Commercial Lines increased by 7% on a constant dollar basis driven by strong rate improvement and higher retention across most Commercial Lines. This was offset by the decline in net premiums written in Personal Insurance, in part from the impact of COVID - 19 on Travel and other lines of business ▪ Int’l Commercial Lines CYCR increased 4.0 pts; on an AY, as adjusted, basis improved 5.0 pts driven by premium rate increases, benefits from underwriting actions, portfolio optimization and ongoing expense discipline ▪ Int’l Personal Insurance CYCR decreased 0.2 pts; on an AY, as adjusted, basis improved 0.9 pts reflecting lower attritional losses in Japan and Asia Pacific Personal Auto ▪ Expense ratio improved 0.5 pts reflecting ongoing expense discipline International APTI ▪ CATs of $155M, includes an estimated $94M related to COVID - 19 and $45M related to civil unrest ▪ NII decreased reflecting lower income on private equity holdings ($M) 2Q19 2Q20 Net premiums written $3,274 $3,202 Commercial Lines 1,516 1,575 Personal Insurance 1,758 1,627 Net premiums earned $3,392 $3,084 Commercial Lines 1,574 1,506 Personal Insurance 1,818 1,578 Underwriting income $152 $76 Commercial Lines 51 (13) Personal Insurance 101 89 Net investment income $110 $94 Adjusted pre - tax income $262 $170 Exclude: Impact of CATs ($4) ($155) Adjusted pre - tax income (ex. CATs) $266 $325 56.9% 54.7% 24.1% 23.7% 14.5% 14.4% 2Q19 2Q20 CAT Ratio Calendar Year Combined Ratio PYD Ratio Acquisition Ratio AYLR, As adjusted GOE Ratio AYCR, As adjusted 95.5% 95.5% 0.1% (0.1%) 92.8% 97.6% 5.4% (0.6%) AYLR, as adjusted, improved 2.2 pts AYCR, as adjusted, improved 2.7 pts 61.6% 57.4% 21.1% 20.4% 14.2% 14.1% 2Q19 2Q20 52.8% 52.1% 26.7% 26.8% 14.9% 14.6% 2Q19 2Q20 96.9% 96.8% 0.3% (0.4%) 91.9% 100.8% 11.3% (2.4%) 94.4% 94.5% - 0.1% 93.5% 94.3% (0.4%) 1.2% Total Commercial Lines Personal Insurance International Combined Ratios AYLR, as adjusted, improved 4.2 pts AYCR, as adjusted, improved 5.0 pts AYLR, as adjusted, improved 0.7 pts AYCR, as adjusted, improved 0.9 pts Note: Calendar year combined ratios refers to a GAAP measure; the corresponding accident year, as adjusted, ratios refers to fin ancial measure not calculated in accordance with GAAP; definitions and abbreviations of Non - GAAP measures and reconciliations to their closest GAAP measures can be found in this presentation under the heading Glossary of Non - GAAP Financial Measures and Non - GAAP Reconciliations. 14

Life and Retirement: 2Q20 results recovered sharply from 1Q20 due to capital market improvements; APTI decreased from 2Q19 due to private equity losses, continued spread compression and elevated mortality from the impact of COVID - 19 Adjusted Pre - Tax Income ($M) Adjusted Return on Common Equity Premiums and Deposits* ($B) General Operating Expenses ($M) Institutional Markets Group Retirement Individual Retirement Life Insurance Institutional Markets Group Retirement Individual Retirement Life Insurance Institutional Markets Group Retirement Individual Retirement Life Insurance $588 $550 $293 $214 $86 $(9) $82 $126 $1,049 $881 2Q19 2Q20 $119 $100 $111 $132 $153 $148 $16 $19 $399 $399 2Q19 2Q20 * Refers to financial measure not calculated in accordance with generally accepted accounting principles (Non - GAAP); definitions and abbreviations of Non - GAAP measures and reconciliations to their closest GAAP measures can be found in this presentation under the heading Glossary of N on - GAAP Financial Measures and Non - GAAP Reconciliations. $3.9 $1.8 $2.0 $1.7 $1.0 $1.1 $0.3 $1.1 2Q19 2Q20 $7.2 $5.7 Premiums ($M) $16 $38 $5 $3 $425 $447 $152 $1,089 2Q19 2Q20 Institutional Markets Group Retirement Individual Retirement Life Insurance 17.3% 13.2% 2Q19 2Q20 $598 $1,577 15

2Q19 2Q20 ($0.3) ($1.5) $90.0 $98.8 $48.1 $47.9 $13.2 $8.1 $151.3 $154.8 2Q19 2Q20 General Accounts Separate Accounts Retail Mutual Funds Life and Retirement: Individual Retirement 2Q20 reflects equity market recovery; overall annuity sales were lower due to pricing discipline and broad industry sales channel disruptions resulting from COVID - 19 1) Includes death and other contract benefits. Net Flows excluding Retail Mutual Funds is ($0.7B) in 2Q20 compared with $0.5B in 2Q19. Key Takeaways ▪ 2Q20 APTI results reflect strong capital market recovery from 1Q20 resulting in favorable impacts to DAC and Variable Annuity reserves and higher other yield enhancements, offset by private equity losses ▪ Net flows are negative in 2Q20, and down compared to 2Q19 due to broad industry sales channel disruptions resulting from COVID - 19 ▪ Growth in assets under administration (AUA) driven by higher market values driven by lower interest rates, partially offset by negative net flows ▪ Continued spread compression as higher yielding investment assets roll off the in - force portfolio, the result of maturities, calls and structured asset paydowns, as well as maintaining pricing discipline Base Net Investment Spread Assets Under Administration ($B) Net Flows ($B) Premiums and Deposits Surrender and Other Withdrawals Net Flows 1 Fixed Annuities Variable Annuities Index Annuities Retail Mutual Funds $0.4 $1.5 $0.5 $0.7 $0.7 $1.3 $0.2 $0.4 $1.8 $3.9 2Q20 2Q19 $0.6 $1.0 $0.7 $1.0 $0.2 $0.2 $1.0 $1.1 $2.6 $3.4 2Q20 2Q19 1.89% 1.55% 3.08% 2.56% 2Q19 2Q20 Fixed Annuities Variable and Index Annuities ($ in millions) 2Q19 2Q20 Premiums and deposits $3,865 $1,794 Premiums 16 38 Policy fees 205 205 Net investment income 1,094 957 Advisory fee and other income 151 133 Total adjusted revenues 1,466 1,333 Benefits, losses and expenses 878 783 Adjusted pre-tax income (APTI) $588 $550 16
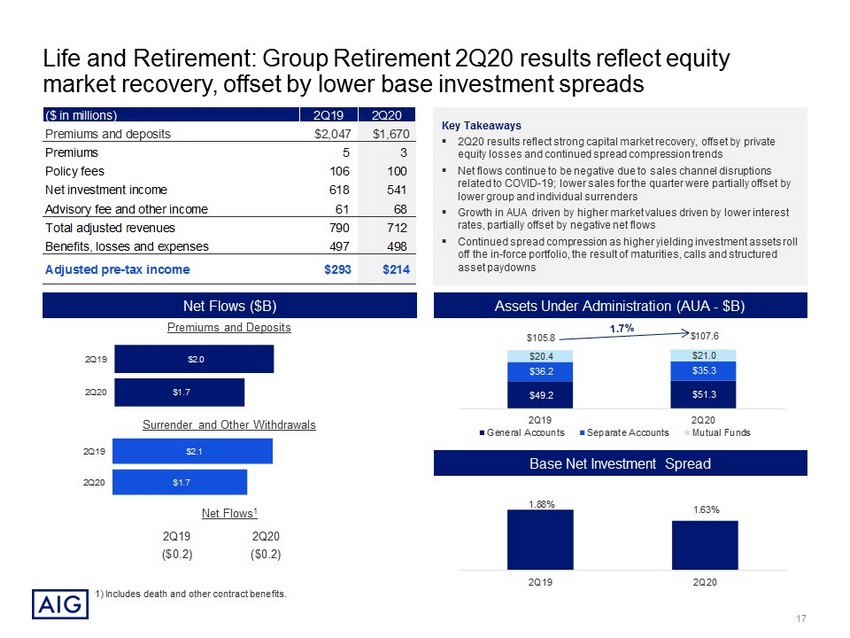
$49.2 $51.3 $36.2 $35.3 $20.4 $21.0 $105.8 $107.6 2Q19 2Q20 General Accounts Separate Accounts Mutual Funds Life and Retirement: Group Retirement 2Q20 results reflect equity market recovery, offset by lower base investment spreads Base Net Investment Spread Assets Under Administration (AUA - $B) Net Flows ($B) Key Takeaways ▪ 2Q20 results reflect strong capital market recovery, offset by private equity losses and continued spread compression trends ▪ Net flows continue to be negative due to sales channel disruptions related to COVID - 19; lower sales for the quarter were partially offset by lower group and individual surrenders ▪ Growth in AUA driven by higher market values driven by lower interest rates, partially offset by negative net flows ▪ Continued spread compression as higher yielding investment assets roll off the in - force portfolio, the result of maturities, calls and structured asset paydowns Premiums and Deposits Surrender and Other Withdrawals Net Flows 1 1.88% 1.63% 2Q19 2Q20 1) Includes death and other contract benefits. ($ in millions) 2Q19 2Q20 Premiums and deposits $2,047 $1,670 Premiums 5 3 Policy fees 106 100 Net investment income 618 541 Advisory fee and other income 61 68 Total adjusted revenues 790 712 Benefits, losses and expenses 497 498 Adjusted pre-tax income (APTI) $293 $214 2Q19 2Q20 ($0.2) ($0.2) $1.7 $2.1 2Q20 2Q19 $1.7 $2.0 2Q20 2Q19 17
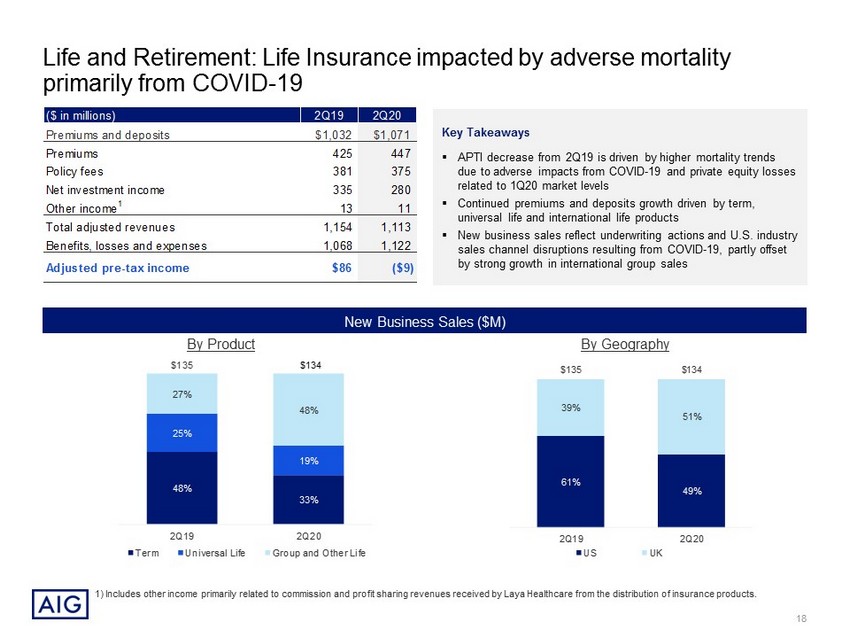
Life and Retirement: Life Insurance impacted by adverse mortality primarily from COVID - 19 1) Includes other income primarily related to commission and profit sharing revenues received by Laya Healthcare from the distri but ion of insurance products. New Business Sales ($M) By Product By Geography By Geography Key Takeaways ▪ APTI decrease from 2Q19 is driven by higher mortality trends due to adverse impacts from COVID - 19 and private equity losses related to 1Q20 market levels ▪ Continued premiums and deposits growth driven by term, universal life and international life products ▪ New business sales reflect underwriting actions and U.S. industry sales channel disruptions resulting from COVID - 19, partly offset by strong growth in international group sales 61% 49% 39% 51% $135 $134 2Q19 2Q20 US UK ($ in millions) 2Q19 2Q20 Premiums and deposits $1,032 $1,071 Premiums 425 447 Policy fees 381 375 Net investment income 335 280 Other income 1 13 11 Total adjusted revenues 1,154 1,113 Benefits, losses and expenses 1,068 1,122 Adjusted pre-tax income (APTI) $86 ($9) 48% 33% 25% 19% 27% 48% $135 2Q19 2Q20 Term Universal Life Group and Other Life $134 18

3.1 3.4 5.2 7.6 5.0 5.0 0.9 0.6 6.8 6.9 $21.0 $23.4 2Q19 2Q20 Life and Retirement: Institutional Markets closed two reinsurance transactions, driving an increase in premiums and deposits; higher APTI reflects business growth and strong investment results Premiums and Deposits ($M) GAAP Reserves by Line of Business ($B) Guaranteed Investment Contracts Stable Value Wrap Structured Settlements Pension Risk Transfer COLI/BOLI* Key Takeaways ▪ Premiums growth reflects higher Pension Risk Transfer issuance; closed two large Pension Risk Transfer reinsurance transactions ▪ NII increased driven by higher other yield enhancements and asset growth, partially offset by private equity losses ▪ Continued focus on maintaining pricing and expense discipline ($ in millions) 2Q19 2Q20 Premiums and deposits $268 $1,129 Premiums 152 1,089 Policy fees 43 40 Net investment income 223 262 Other income - - Total adjusted revenues 418 1,391 Benefits, losses and expenses 336 1,265 Adjusted pre-tax income (APTI) $82 $126 58 95 116 1,035 (1) 94 $268 $1,129 2Q19 2Q20 * COLI/BOLI = Corporate and Bank - owned life insurance 19
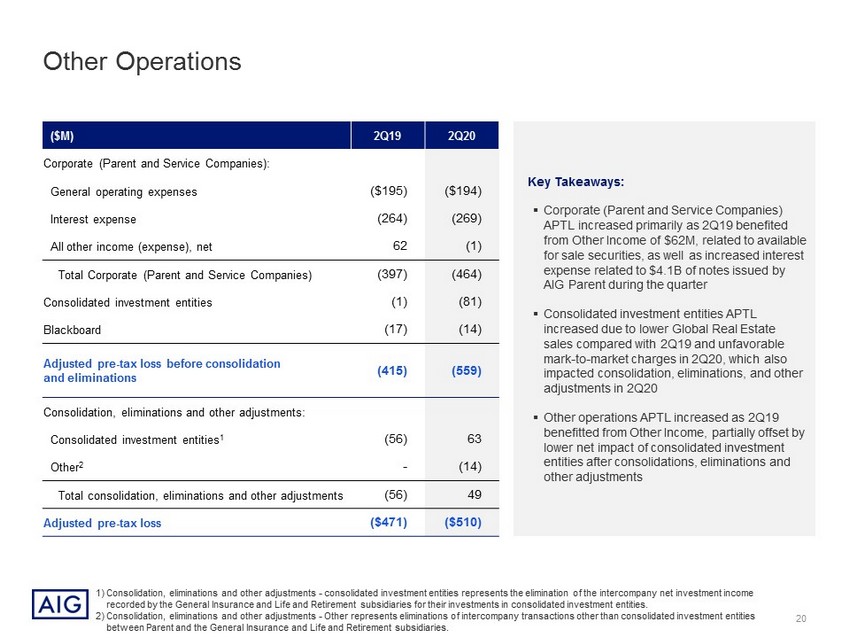
Other Operations Key Takeaways: ▪ Corporate (Parent and Service Companies) APTL increased primarily as 2Q19 benefited from Other Income of $62M, related to available for sale securities, as well as increased interest expense related to $4.1B of notes issued by AIG Parent during the quarter ▪ Consolidated investment entities APTL increased due to lower Global Real Estate sales compared with 2Q19 and unfavorable mark - to - market charges in 2Q20, which also impacted consolidation, eliminations, and other adjustments in 2Q20 ▪ Other operations APTL increased as 2Q19 benefitted from Other Income, partially offset by lower net impact of consolidated investment entities after consolidations, eliminations and other adjustments 1) Consolidation, eliminations and other adjustments - consolidated investment entities represents the elimination of the intercomp any net investment income recorded by the General Insurance and Life and Retirement subsidiaries for their investments in consolidated investment entit ies . 2) Consolidation, eliminations and other adjustments - Other represents eliminations of intercompany transactions other than consol idated investment entities between Parent and the General Insurance and Life and Retirement subsidiaries. ($M) 2Q19 2Q20 Corporate (Parent and Service Companies): General operating expenses ($195) ($194) Interest expense (264) (269) All other income (expense), net 62 (1) Total Corporate (Parent and Service Companies) (397) (464) Consolidated investment entities (1) (81) Blackboard (17) (14) Adjusted pre - tax loss before consolidation and eliminations (415) (559) Consolidation, eliminations and other adjustments: Consolidated investment entities 1 (56) 63 Other 2 - (14) Total consolidation, eliminations and other adjustments (56) 49 Adjusted pre - tax loss ($471) ($510) 20

Legacy Portfolio Key Takeaways ▪ Legacy APTI increased primarily due to an increase in NII even though 2Q20 includes two months of Fortitude income compared to three months in 2Q19; Legacy APTI for 2Q19 and the first two months of 2Q20 are reduced in AATI for AIG due to Carlyle’s 19.9% minority interest in Fortitude ▪ Following the sale of Fortitude, Legacy includes several small General Insurance and Life and Retirement run - off books, as well as DIB/GCM and AIG Financial Products ($M) 2Q19 2Q20 General Insurance run - off lines $43 $10 Life and Retirement run - off lines 38 13 Legacy Investments 38 234 Adjusted pre - tax income $119 $257 21
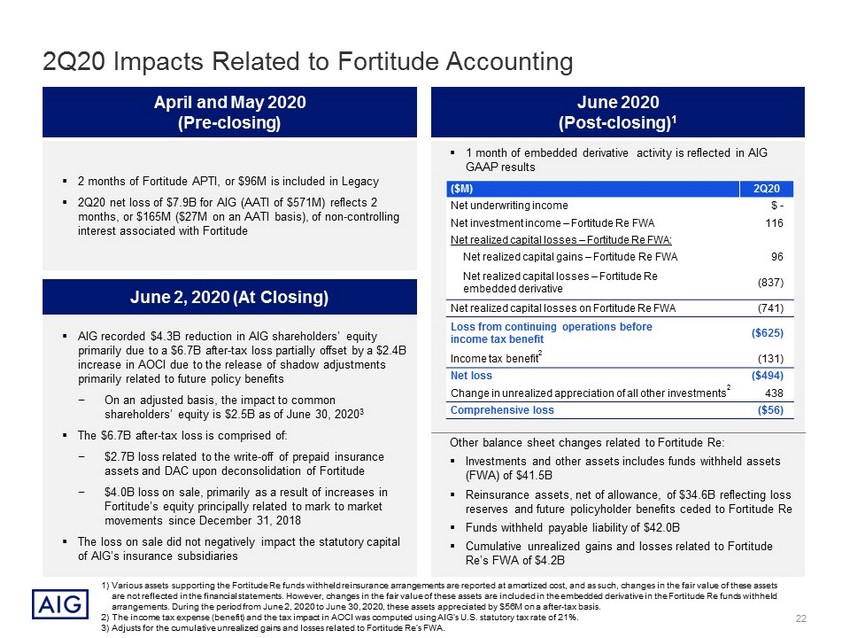
2Q20 Impacts Related to Fortitude Accounting June 2020 (Post - closing) 1 ▪ 1 month of embedded derivative activity is reflected in AIG GAAP results Other balance sheet changes related to Fortitude Re: ▪ Investments and other assets includes funds withheld assets (FWA) of $41.5B ▪ Reinsurance assets, net of allowance, of $34.6B reflecting loss reserves and future policyholder benefits ceded to Fortitude Re ▪ Funds withheld payable liability of $42.0B ▪ Cumulative unrealized gains and losses related to Fortitude Re’s FWA of $4.2B 1) Various assets supporting the Fortitude Re funds withheld reinsurance arrangements are reported at amortized cost, and as suc h, changes in the fair value of these assets are not reflected in the financial statements. However, changes in the fair value of these assets are included in the embedde d d erivative in the Fortitude Re funds withheld arrangements. During the period from June 2, 2020 to June 30, 2020, these assets appreciated by $56M on a after - tax basis. 2) The income tax expense (benefit) and the tax impact in AOCI was computed using AIG’s U.S. statutory tax rate of 21%. 3) Adjusts for the cumulative unrealized gains and losses related to Fortitude Re’s FWA. ($M) 2Q20 Net underwriting income $ - Net investment income – Fortitude Re FWA 116 Net realized capital losses – Fortitude Re FWA: Net realized capital gains – Fortitude Re FWA 96 Net realized capital losses – Fortitude Re embedded derivative (837) Net realized capital losses on Fortitude Re FWA (741) Loss from continuing operations before income tax benefit ($625) Income tax benefit 2 (131) Net loss ($494) Change in unrealized appreciation of all other investments 2 438 Comprehensive loss ($56) April and May 2020 (Pre - closing) ▪ 2 months of Fortitude APTI, or $96M is included in Legacy ▪ 2Q20 net loss of $7.9B for AIG (AATI of $571M) reflects 2 months, or $165M ($27M on an AATI basis), of non - controlling interest associated with Fortitude ▪ AIG recorded $4.3B reduction in AIG shareholders’ equity primarily due to a $6.7B after - tax loss partially offset by a $2.4B increase in AOCI due to the release of shadow adjustments primarily related to future policy benefits − On an adjusted basis, the impact to common shareholders’ equity is $2.5B as of June 30, 2020 3 ▪ The $6.7B after - tax loss is comprised of: − $2.7B loss related to the write - off of prepaid insurance assets and DAC upon deconsolidation of Fortitude − $4.0B loss on sale, primarily as a result of increases in Fortitude’s equity principally related to mark to market movements since December 31, 2018 ▪ The loss on sale did not negatively impact the statutory capital of AIG’s insurance subsidiaries June 2, 2020 (At Closing) 22

On June 2, 2020, AIG completed the sale of a majority interest in Fortitude; AIG’s GAAP balance sheet and income statement will continue to include investments retained as collateral by the AIG ceding companies as part of the funds withheld reinsurance arrangement; the difference in carrying value and fair value is primarily reported in AOCI Assets Liabilities ▪ A reinsurance recoverable was set up to reflect loss reserves and policyholders benefits ceded to Fortitude Re, which totalled $34.6B at June 30, 2020 ▪ AIG continues to reflect the FWA primarily in its investment portfolio, at carrying value of $41.5B at June 30, 2020 ▪ Loss reserves and policyholder benefits continue to include reserves ceded to Fortitude Re ▪ The funds withheld payable contains an embedded derivative which is marked - to - market each period. The carrying value of the funds withheld payable is $42.0B as of June 30, 2020 June 30, 2020 (in millions) Carrying Value of Assets Fair Value of Assets Corresponding Accounting Policy Fixed maturity securities - available for sale 1 $35,380 $35,380 Fair value through other comprehensive income Fixed maturity securities - fair value option 190 190 Fair value through net investment income Commercial mortgage loans 3,537 3,781 Amortized cost Real estate investments 385 600 Amortized cost Private equity funds / hedge funds 978 978 Fair value through net investment income Policy loans 431 431 Amortized cost Derivative assets, net 2 - - Fair value through realized capital gains (losses) Other 640 640 Amortized cost Total $41,541 $42,000 Summary of Assets Supporting the Funds Withheld Arrangements Financial Reporting Related to Fortitude Sale 1) The change in the net unrealized gains (losses) on available for sale securities related to the Fortitude Re FWA was $555M ($ 438 M after - tax) during the 2Q20 post deconsolidation period (June 2, 2020 - June 30, 2020). 2) The derivative assets have been presented net of collateral. The derivative assets supporting the Fortitude Re funds withheld ar rangements had a fair market value of $650M as of June 30, 2020. These derivative assets are fully collateralized. 23

Changes to Non - GAAP Measures AIG has updated its Non - GAAP measures to adjust for the FWA, as the associated earnings are passed through to Fortitude Re Adjusted Pre - tax Income ▪ Updated APTI NII to exclude NII on Fortitude Re FWA; AIG has updated its Non - GAAP measures to remove the impacts associated with the FWA, as the associated earnings and economics are passed through to Fortitude Re ▪ Change in presentation of net realized capital gains and losses (RCGL) – RCGL continues to be excluded from APTI, but the Fortitude Re FWA and embedded derivative are identified separately 24

Changes to Non - GAAP Measures (continued) Adjusted After - tax Income ▪ Updated to exclude NII on Fortitude Re FWA ▪ Change in presentation of RCGL – RCGL continues to be excluded from APTI, but the Fortitude Re FWA and embedded derivative are identified separately Adjusted Book Value per Share ▪ Updated to exclude the cumulative unrealized gains and losses related to Fortitude Re’s FWA since these fair value movements are economically transferred to Fortitude Re 25

Glossary of Non - GAAP Financial Measures and Non - GAAP Reconciliations 26

Glossary of Non - GAAP Financial Measures Throughout this presentation, we present our financial condition and results of operations in the way we believe will be most me aningful and representative of our business results. Some of the measurements we use are “Non - GAAP financial measures” under Securities and Exchange Commission rules and re gulations. GAAP is the acronym for generally accepted accounting principles in the United States. The non - GAAP financial measures we present may not be comparable to similarly - named measures reported by other companies. The reconciliations of such measures to the most comparable GAAP measures in accordance with Regulation G ar e i ncluded within the relevant tables or in the Second Quarter 2020 Financial Supplement available in the Investor Information section of AIG’s website, www.aig.com . We may use certain non - GAAP operating performance measures as forward - looking financial targets or projections. These financial targets or projections are provided based on management’s estimates. The most directly comparable GAAP financial targets or projections would be heavily dependen t u pon results that are beyond management’s control and the outcome of these items could be significantly different than management’s estimates. Therefore, we do not pro vid e quantitative reconciliations for these financial targets or projections as we cannot predict with accuracy future actual events (e.g., catastrophe losses) and impacts from ch ang es in macro - economic market conditions, including the interest rate environment (e.g. estimate for DIB & GCM returns, net reserve discount change and returns on alte rna tive investments). We use the following operating performance measures because we believe they enhance the understanding of the underlying profi tab ility of continuing operations and trends of our business segments. We believe they also allow for more meaningful comparisons with our insurance competitors. When we use th ese measures, reconciliations to the most comparable GAAP measure are provided on a consolidated basis. ▪ Adjusted Pre - tax Income (APTI) is derived by excluding the items set forth below from income from continuing operations before income tax. This definition is consistent across our segments. These items generally fall into one or more of the following broad categories: legacy matters having no relevan ce to our current businesses or operating performance; adjustments to enhance transparency to the underlying economics of transactions; and measures that we believe to be common to the industry. APTI is a GAAP measure for our segments. Excluded items include the following: ▪ Adjusted After - tax Income attributable to AIG Common Shareholders (AATI) is derived by excluding the tax effected adjusted pre - tax income (APTI) adjustments described above, dividends on preferred stock, and the following tax items from net income attributable to AIG: – deferred income tax valuation allowance releases and charges; – changes in uncertain tax positions and other tax items related to legacy matters having no relevance to our current businesse s o r operating performance; and – net tax charge related to the enactment of the Tax Cuts and Jobs Act (Tax Act); and by excluding the net realized capital gains (losses) and other charges from noncontrolling interests. Glossary of Non - GAAP • changes in fair value of securities used to hedge guaranteed living benefits; • changes in benefit reserves and deferred policy acquisition costs (DAC), value of business acquired (VOBA), and sales inducement assets (SIA) related to net realized capital gains and losses; • changes in the fair value of equity securities; • net investment income on Fortitude Re funds withheld assets post deconsolidation of Fortitude Re; • following deconsolidation of Fortitude Re, net realized capital gains and losses on Fortitude Re funds withheld assets held by AIG in support of Fortitude Re’s reinsurance obligations to AIG (Fortitude Re funds withheld assets); • loss (gain) on extinguishment of debt; • all net realized capital gains and losses except earned income (periodic settlements and changes in settlement accruals) on derivative instruments used for non - qualifying (economic) hedging or for asset replication. Earned income on such economic hedges is reclassified from net realized capital gains and losses to specific APTI line items based on the economic risk being hedged (e.g. net investment income and interest credited to policyholder account balances); • income or loss from discontinued operations; • net loss reserve discount benefit (charge); • pension expense related to a one - time lump sum payment to former employees; • income and loss from divested businesses; • non - operating litigation reserves and settlements; • restructuring and other costs related to initiatives designed to reduce operating expenses, improve efficiency and simplify our organization; • the portion of favorable or unfavorable prior year reserve development for which we have ceded the risk under retroactive reinsurance agreements and related changes in amortization of the deferred gain; • integration and transaction costs associated with acquired businesses; • losses from the impairment of goodwill; and • non - recurring costs associated with the implementation of non - ordinary course legal or regulatory changes or changes to accounting principles. 27

Glossary of Non - GAAP Financial Measures ▪ Book Value per Common Share, Excluding Accumulated Other Comprehensive Income (AOCI) adjusted for the cumulative unrealized g ain s and losses related to Fortitude Re’s Funds Withheld Assets and Book Value per Common Share, Excluding AOCI adjusted for the cumulative unrealized gains and losses r elated to Fortitude Re’s Funds Withheld Assets and Deferred Tax Assets (DTA) (Adjusted Book Value per Common Share) are used to show the amount of our net worth on a per - common share basis after eliminating items that can fluctuate significantly from period to period including changes in fair v alu e of AIG’s available for sale securities portfolio, foreign currency translation adjustments, and U.S. tax attribute deferred tax assets. These measures also eliminate the asymm etr ical impact resulting from changes in fair value of our available for sale securities portfolio wherein there is largely no offsetting impact for certain related insurance li abi lities. In addition, we adjust for the cumulative unrealized gains and losses related to Fortitude Re’s Funds Withheld Assets since these fair value movements are economically transferred to Fortitude Re. We exclude deferred tax as sets representing U.S. tax attributes related to net operating loss carryforwards and foreign tax credits as they have not yet bee n u tilized. Amounts for interim periods are estimates based on projections of full - year attribute utilization. As net operating loss carryforwards and foreign tax credits are utilize d, the portion of the DTA utilized is included in these book value per common share metrics. Book value per common share, excluding AOCI adjusted for the cumulative unrealized gains an d losses related to Fortitude Re’s Funds Withheld Assets, is derived by dividing Total AIG Common Shareholders’ equity, excluding AOCI adjusted for the cumulative unr eal ized gains and losses related to Fortitude Re’s Funds Withheld Assets, by total common shares outstanding. Adjusted Book Value per Common Share is derived by dividing Total AIG common shareholders’ equity, excluding AOCI adjusted for the cumulative unrealized gains and losses related to Fortitude Re’s Funds Withheld Assets and DTA (Adjusted Common Shareholders’ Equity) , by total common shares outstanding. ▪ Book Value per Common Share, Excluding Goodwill, Value of Business Acquired (VOBA), Value of Distribution Channel Acquired (V ODA ) and Other Intangible Assets (Tangible Book Value per Common Share), Tangible Book Value per Common Share, Excluding AOCI adjusted for the cumulative unre ali zed gains and losses related to Fortitude Re’s Funds Withheld Assets, and Tangible Book Value per Common Share, Excluding AOCI adjusted for the cumulative unrealized gains an d losses related to Fortitude Re’s Funds Withheld Assets and Deferred Tax Assets (DTA) (Adjusted Tangible Book Value per Common Share) are used to provide more accurate measure of the realizable value of shareholder on a per - common share basis. Tangible Book Value per Common Share is derived by d ividing Total AIG common shareholders’ equity, excluding Goodwill, VOBA, VODA and Other intangible assets, by total common shares outstanding (Tangible Book Value p er Common Share). Tangible Book value per common share, excluding AOCI adjusted for the cumulative unrealized gains and losses related to Fortitude Re’s Funds Withheld Assets, is derived by dividing Total AIG Common Shareholders’ equity, excluding intangible assets, AOCI adjusted for the cumulative unrealized gains and losses relate d t o Fortitude Re’s Funds Withheld Assets, by total common shares outstanding. Adjusted Tangible Book Value per Common Share is derived by dividing Total AIG common shareh old ers’ equity, excluding intangible assets, AOCI adjusted for the cumulative unrealized gains and losses related to Fortitude Re’s Funds Withheld Assets, and DTA (Adjusted Tangible Common Shareholders’ Equity) , by total common shares outstanding. ▪ AIG Return on Common Equity (ROCE) – Adjusted After - tax Income Excluding AOCI adjusted for the cumulative unrealized gains and l osses related to Fortitude Re’s Funds Withheld Assets and DTA (Adjusted Return on Common Equity) is used to show the rate of return on common shareholders’ equity. We believe this measure is useful to investors because it eliminates items that can fluctuate significantly from period to period, including changes in fair va lue of our available for sale securities portfolio, foreign currency translation adjustments and U.S. tax attribute deferred tax assets. This measure also eliminates the asymmetrical im pac t resulting from changes in fair value of our available for sale securities portfolio wherein there is largely no offsetting impact for certain related insurance liabiliti es. In addition, we adjust for the cumulative unrealized gains and losses related to Fortitude Re’s Funds Withheld Assets since these fair value movements are economically transferred to Fortitude Re. We exclude deferred tax as sets representing U.S. tax attributes related to net operating loss carryforwards and foreign tax credits as they have not yet bee n u tilized. Amounts for interim periods are estimates based on projections of full - year attribute utilization. As net operating loss carryforwards and foreign tax credits are utilize d, the portion of the DTA utilized is included in Adjusted Return on Common Equity. Adjusted Return on Common Equity is derived by dividing actual or annualized adjusted after - tax income attributable to AIG common shareholders by average Adjusted Common Shareholders’ Equity. ▪ Core, General Insurance, Life and Retirement and Legacy Adjusted Attributed Common Equity is an attribution of total AIG Adjusted Common Shareholders’ Equity to these segments based on our internal capital model, which incorporates the segments’ respective risk profiles. Adjusted attri but ed common equity represents our best estimates based on current facts and circumstances and will change over time. ▪ Core, General Insurance, Life and Retirement and Legacy Return on Common Equity – Adjusted After - tax Income (Adjusted Return on Attributed Common Equity) is used to show the rate of return on Adjusted Attributed Common Equity. Adjusted Return on Attributed Common Equity is derived by dividing actual or annualized Adjusted After - tax Income by Average Adjusted Attributed Common Equity. ▪ Adjusted After - tax Income Attributable to Core, General Insurance, Life and Retirement and Legacy is derived by subtracting attributed interest expense, income tax expense and attributed dividends on preferred stock from APTI. Attributed debt and the related interest expense and dividends on preferred stock are calculated based on our internal capital model. Tax expense or benefit is calculated based on an internal attribution methodology that considers amon g o ther things the taxing jurisdiction in which the segments conduct business, as well as the deductibility of expenses in those jurisdictions. Glossary of Non - GAAP 28

Glossary of Non - GAAP Financial Measures ▪ Adjusted Revenues exclude Net realized capital gains (losses), income from non - operating litigation settlements (included in Other income for GAA P purposes) and changes in fair value of securities used to hedge guaranteed living benefits (included in Net investment income for GAAP purposes). Adju ste d revenues is a GAAP measure for our operating segments. ▪ Ratios: We, along with most property and casualty insurance companies, use the loss ratio, the expense ratio and the combined ratio a s measures of underwriting performance. These ratios are relative measurements that describe, for every $100 of net premiums earned, the amount of losses and loss ad jus tment expenses (which for General Insurance excludes net loss reserve discount), and the amount of other underwriting expenses that would be incurred. A combined ratio o f l ess than 100 indicates underwriting income and a combined ratio of over 100 indicates an underwriting loss. Our ratios are calculated using the relevant segment information ca lculated under GAAP, and thus may not be comparable to similar ratios calculated for regulatory reporting purposes. The underwriting environment varies across countri es and products, as does the degree of litigation activity, all of which affect such ratios. In addition, investment returns, local taxes, cost of capital, regulation, product ty pe and competition can have an effect on pricing and consequently on profitability as reflected in underwriting income and associated ratios. ▪ Accident year loss and combined ratios, as adjusted: both the accident year loss and combined ratios, as adjusted, exclude catastrophe losses and related reinstatement premiums, prior year development, net of premium adjustments, and the impact of reserve discounting. Natural catastrophe loss es are generally weather or seismic events having a net impact on AIG in excess of $10 million each and man - made catastrophe losses, such as terrorism and civil disorders that ex ceed the $10 million threshold. We believe that as adjusted ratios are meaningful measures of our underwriting results on an ongoing basis as they exclude catastrophes and t he impact of reserve discounting which are outside of management’s control. We also exclude prior year development to provide transparency related to current accident year resu lts . Underwriting ratios are computed as follows: a) Loss ratio = Loss and loss adjustment expenses incurred ÷ Net premiums earned (NPE) b) Acquisition ratio = Total acquisition expenses ÷ NPE c) General operating expense ratio = General operating expenses ÷ NPE d) Expense ratio = Acquisition ratio + General operating expense ratio e) Combined ratio = Loss ratio + Expense ratio f) Catastrophe losses (CATs) and reinstatement premiums = [Loss and loss adjustment expenses incurred – (CATs)] ÷ [NPE +/( - ) CYRIPs] – Loss ratio g) Accident year loss ratio, as adjusted (AYLR) = [Loss and loss adjustment expenses incurred – CATs – PYD] ÷ [NPE +/( - ) Reinstatement premiums related to catastrophes (CYRIPs) +/( - ) RIPs related to prior year catastrophes (PYRIPs) + (Additional) returned premium related to PYD on loss sensitive business ((AP)RP) + Adjustment for ceded premiums under reinsurance contracts related to prior accident years] h) Accident year combined ratio, as adjusted = AYLR + Expense ratio i ) Prior year development net of (additional) return premium related to PYD on loss sensitive business = [Loss and loss adjustme n t expenses incurred – CATs – PYD] ÷ [NPE +/( - ) CYRIPs +/( - ) PYRIPs + (AP)RP] – Loss ratio – CAT ratio ▪ Premiums and deposits: includes direct and assumed amounts received and earned on traditional life insurance policies, group benefit policies and li fe - contingent payout annuities, as well as deposits received on universal life, investment - type annuity contracts, Federal Home Loan Bank (FHLB) fund ing agreements and mutual funds. Results from discontinued operations are excluded from all of these measures. Glossary of Non - GAAP 29

Non - GAAP Reconciliations Adjusted Pre - tax and After - tax Income - Consolidated (in millions) Quarterly 2Q19 2Q20 Pre - tax income (loss) from continuing operations $ 1,837 $ (9,661) Adjustments to arrive at Adjusted pre - tax income (loss) Changes in fair value of securities used to hedge guaranteed living benefits (75) (16) Changes in benefit reserves and DAC, VOBA and SIA related to net realized capital gains (losses) 73 (255) Changes in the fair value of equity securities 22 (56) Loss on extinguishment of debt 15 - Net investment income on Fortitude Re funds withheld assets (a) - (116) 1 Net realized capital (gains) losses on Fortitude Re funds withheld assets (a) - (96) 1 Net realized capital (gains) losses on Fortitude Re funds withheld embedded derivative (a) - 837 Net realized capital (gains) losses (b) (351) 1,619 L oss from divested businesses 1 8,412 Non - operating litigation reserves and settlements - - 1 F avorable prior year development and related amortization changes ceded under retroactive reinsurance agreements (125) (33) Net loss reserve discount charge 212 16 Integration and transaction costs associated with acquired businesses 6 4 Restructuring and other costs 60 134 Non - recurring costs related to regulatory or accounting changes 2 14 Adjusted pre - tax income $ 1,677 $ 803 (a) Represents activity subsequent to the deconsolidation of Fortitude Re on June 2, 2020. (b) Includes all net realized capital gains and losses except earned income (periodic settlements and changes in settlement a ccr uals) on derivative instruments used for non - qualifying (economic) hedging or for asset replication and net realized gains and losses on Fortitude Re funds withheld assets. 30

Non - GAAP Reconciliations Adjusted Pre - tax and After - tax Income - Consolidated (a) Includes the write - down of net operating loss deferred tax assets in certain foreign jurisdictions, which is offset by valua tion allowance release. ( b ) Represents activity subsequent to the deconsolidation of Fortitude Re on June 2, 2020. ( c ) Includes all net realized capital gains and losses except earned income (periodic settlements and changes in settlement acc rua ls) on derivative instruments used for non - qualifying (economic) hedging or for asset replication and net realized gains and losses on Fortitude Re funds withheld assets. ( d ) Includes the impact of non - U.S. tax rates which differ from the applicable U.S. statutory tax rate and tax - only adjustments. ( e ) Noncontrolling interests was primarily due to the 19.9 percent investment in Fortitude Group Holdings, LLC (Fortitude Holdings) by an affili at e of The Carlyle Group L.P. (Carlyle), which occurred in the fourth quarter of 2018. Carlyle was allocated 19.9 percent of Fortitude Holdings’ standalone financial results through the June 2, 2020 closing date of the Major ity Interest Fortitude Sale. Fortitude Holdings’ results were mostly eliminated in AIG’s consolidated income from continuing operations given that its results arose from intercompany transactions. Noncontrolling interests was calculated based on the standalone financial results of Fortitude Holdings. The most significant component of F or titude Holdings’ standalone results was the change in fair value of the embedded derivatives which changes with movements in interest rates an d c redit spreads, and which was recorded in net realized capital gains and losses of Fortitude Holdings. In accordance with AIG's adjusted after - tax income definition, realized capital gains and losses are excluded from noncontrolling interests. Subsequent to the Majority Interest Fortitude Sale, AIG’s owns 3.5 percent of Fortitude Holdings and no longer consolidates Fortitude Holdings in its financial statements as of such date. The minority interest in Fortitude is carried at co st within AIG’s consolidated investments, which was $100 million as of June 30, 2020. ( f ) Because we reported a net loss attributable to AIG common shareholders for the three months ended June 30, 2020, all common st ock equivalents are anti - dilutive and are therefore excluded from the calculation of diluted shares and diluted per share amounts. (in millions) Quarterly 2Q19 2Q20 After - tax net income (loss), including noncontrolling interests $ 1,390 $ (7,766) Noncontrolling interests (income) loss (281) (162) Net income (loss) attributable to AIG $ 1,109 $ (7,928) Dividends on preferred stock 7 8 Net income (loss) attributable to AIG common shareholders $ 1,102 $ (7,936) Adjustments to arrive at Adjusted after - tax income (loss) (amounts net of tax, at U.S. statutory tax rate for each respective period, except where noted): Changes in uncertain tax positions and other tax adjustments (a) 27 206 Deferred income tax valuation allowance (releases) charges 7 (183) Changes in fair value of securities used to hedge guaranteed living benefits (59) (12) Changes in benefit reserves and DAC, VOBA and SIA related to net realized capital gains (losses) 57 (202) Changes in the fair value of equity securities 17 (44) Loss on extinguishment of debt 11 - Net investment income on Fortitude Re funds withheld assets( b ) - (92) 1 Net realized capital (gains) losses on Fortitude Re funds withheld assets( b ) - (76) 1 Net realized capital (gains) losses on Fortitude Re funds withheld embedded derivative( b ) - 661 Net realized capital (gains) losses ( c )( d ) (265) 1,250 L oss from discontinued operations and divested businesses ( d ) 2 6,756 Non - operating litigation reserves and settlements 1 - F avorable prior year development and related amortization changes ceded under retroactive reinsurance agreements (98) (26) Net loss reserve discount charge 167 13 Integration and transaction costs associated with acquired businesses 5 3 Restructuring and other costs 47 106 Non - recurring costs related to regulatory or accounting changes 2 11 Noncontrolling interests primarily related to net realized capital gains (losses) of Fortitude Holdings' standalone results ( e ) 249 136 Adjusted after - tax income attributable to AIG common shareholders $ 1,272 $ 571 Weighted average diluted shares outstanding ( f ) 888.3 867.0 Income (loss) per common share attributable to AIG common shareholders (diluted) ( f ) $ 1.24 $ (9.15) Adjusted after - tax income per common share attributable to AIG common shareholders (diluted) 1.43 0.66 31

Non - GAAP Reconciliations Book Value Per Common Share (in millions, except per common share data) As of June 30, December 31, Book Value Per Common Share 2019 2020 2019 Total AIG shareholders' equity $ 64,539 $ 62,234 $ 65,675 Less: Preferred equity 485 485 485 Total AIG common shareholders' equity (a) 64,054 61,749 65,190 Less: Accumulated other comprehensive income (AOCI) 4,991 9,169 4,982 Add: Cumulative unrealized gains and losses related to Fortitude Re’s 1 Funds Withheld Assets - 4,215 - Total AIG common shareholders' equity, excluding AOCI adjusted for the cumulative unrealized gains and losses related to Fortitude Re’s Funds Withheld Assets (b) 59,063 56,795 60,208 Less: Deferred tax assets (DTA)* 9,577 8,643 8,977 Total adjusted common shareholders' equity (c) $ 49,486 $ 48,152 $ 51,231 Total common shares outstanding (d) 869.9 861.4 870.0 Book value per common share (a ÷ d) $ 73.63 $ 71.68 $ 74.93 Book value per common share, excluding AOCI adjusted for the cumulative unrealized gains and losses related to Fortitude Re’s Funds Withheld Assets ( b ÷ d ) 67.90 65.93 69.20 Adjusted book value per common share (c ÷ d) 56.89 55.90 58.89 * Represents deferred tax assets only related to U.S. net operating loss and foreign tax credit carryforwards on a U.S. GAAP bas is and excludes other balance sheet deferred tax assets and liabilities. Tangible Book Value Per Common Share Total AIG common shareholders' equity (a) $ 64,054 $ 61,749 $ 65,190 Less Intangible Assets: Goodwill 4,104 3,983 4,038 Value of business acquired 369 121 317 Value of distribution channel acquired 555 517 536 Other intangibles 337 323 333 Total intangibles assets 5,365 4,944 5,224 Total AIG tangible common shareholders' equity (e) 58,689 56,805 59,966 Less: Accumulated other comprehensive income (AOCI) 4,991 9,169 4,982 Add: Cumulative unrealized gains and losses related to Fortitude Re’s Funds Withheld Assets - 4,215 - Total AIG tangible common shareholders' equity, excluding intangible asset, AOCI adjusted for the cumulative unrealized gains and losses related to Fortitude Re’s Funds Withheld Assets (f) 53,698 51,851 54,984 Less: Deferred tax assets (DTA)* 9,577 8,643 8,977 Total adjusted tangible common shareholders' equity (g) $ 44,121 $ 43,208 $ 46,007 Total common shares outstanding (d) 869.9 861.4 870.0 Tangible book value per common share (e ÷ d) $ 67.47 $ 65.94 $ 68.93 Tangible book value per common share, excluding AOCI adjusted for the cumulative unrealized gains and losses related to Fortitude Re’s Funds Withheld Assets ( f ÷ d ) 61.73 60.19 63.20 Adjusted tangible book value per common share (g ÷ d) 50.72 50.16 52.88 32

Non - GAAP Reconciliations Return on Common Equity (in millions) Quarterly Return On Common Equity Computations 2Q19 2Q20 Actual or Annualized net income (loss) attributable to AIG common shareholders (a) $ 4,408 $ (31,744) Actual or Annualized adjusted after - tax income attributable to AIG common shareholders (b) $ 5,088 $ 2,284 Average AIG Common Shareholders' equity (c) $ 62,178 $ 60,719 Less: Average AOCI 3,560 4,088 Add: Average cumulative cumulative unrealized gains and losses related to Fortitude Re’s Funds Withheld Assets - 2,108 Less: Average DTA* 9,752 8,589 Average adjusted common shareholders' equity (d) $ 48,866 $ 50,150 ROCE (a ÷ c) 7.1% NM Adjusted return on common equity (b ÷ d) 10.4% 4.6% * Represents deferred tax assets only related to U.S. net operating loss and foreign tax credit carryforwards on a U.S. GAAP bas is and excludes other balance sheet deferred tax assets and liabilities. 33

Non - GAAP Reconciliations Return on Common Equity Life and Retirement (in millions) Quarterly 2Q19 2Q20 Adjusted pre - tax income $ 1,049 $ 881 Interest expense on attributed financial debt 44 71 Adjusted pre - tax income including attributed interest expense 1,005 810 Income tax expense 201 160 Adjusted after - tax income $ 804 $ 650 Dividends declared on preferred stock 3 3 Adjusted after - tax income attributable to common shareholders (a) $ 801 $ 647 Ending adjusted attributed common equity $ 18,820 $ 19,506 Average adjusted attributed common equity (b) 18,550 19,584 Adjusted return on attributed common equity (a ÷ b) 17.3 % 13.2 % General Insurance (in millions) Quarterly 2Q19 2Q20 Adjusted pre - tax income $ 980 $ 175 Interest expense on attributed financial debt 147 140 Adjusted pre - tax income including attributed interest expense 833 35 Income tax expense 184 10 Adjusted after - tax income $ 649 $ 25 Dividends declared on preferred stock 4 4 Adjusted after - tax income attributable to common shareholders (a) $ 645 $ 21 Ending adjusted attributed common equity $ 25,282 $ 24,889 Average adjusted attributed common equity (b) 25,054 24,910 Adjusted return on attributed common equity ( a ÷ b ) 10.3 % 0.3 % Legacy (in millions) Quarterly 2Q19 2Q20 Adjusted pre - tax income $ 119 $ 257 Interest expense on attributed financial debt - 1 - Adjusted pre - tax income including attributed interest expense 119 257 Income tax expense 26 54 Adjusted after - tax income attributable to common shareholders (a) $ 93 $ 203 Ending adjusted attributed common equity $ 6,792 $ 2,019 Average adjusted attributed common equity (b) 7,121 4,931 Adjusted return on attributed common equity (a ÷ b) 5.2 % 16.5 % Core (in millions) Quarterly 2Q19 2Q20 Adjusted pre - tax income $ 1,558 $ 546 Interest expense on attributed financial debt - - 1 Adjusted pre - tax income including attributed interest expense 1,558 546 Income tax expense (benefit) 340 143 Adjusted after - tax income $ 1,218 $ 403 Dividends declared on preferred stock 7 7 Adjusted after - tax income attributable to common shareholders (a) $ 1,211 $ 396 Ending adjusted attributed common equity $ 42,694 $ 46,133 Average adjusted attributed common equity (b) 41,746 45,219 Adjusted return on attributed common equity (a ÷ b) 11.6 % 3.5 % 34

Non - GAAP Reconciliations Accident Year Loss Ratio, as adjusted, and Accident Year Combined Ratio, as adjusted General Insurance - North America Quarterly 2Q19 2Q20 Loss ratio 69.2 87.9 Catastrophe losses and reinstatement premiums (5.0) (19.6) Prior year development 1.7 1.2 Accident year loss ratio, as adjusted 65.9 69.5 Acquisition ratio 20.3 15.7 General operating expense ratio 10.6 12.1 Expense ratio 30.9 27.8 Combined ratio 100.1 115.7 Accident year combined ratio, as adjusted 96.8 97.3 General Insurance - North America - Personal Insurance Quarterly 2Q19 2Q20 Loss ratio 53.0 65.6 Catastrophe losses and reinstatement premiums (3.9) (2.6) Prior year development (2.4) (1.3) Accident year loss ratio, as adjusted 46.7 61.7 Acquisition ratio 34.6 26.7 General operating expense ratio 8.8 16.4 Expense ratio 43.4 43.1 Combined ratio 96.4 108.7 Accident year combined ratio, as adjusted 90.1 104.8 General Insurance - North America - Commercial Lines Quarterly 2Q19 2Q20 Loss ratio 74.8 91.8 Catastrophe losses and reinstatement premiums (5.4) (22.6) Prior year development 3.1 1.6 Accident year loss ratio, as adjusted 72.5 70.8 Acquisition ratio 15.4 13.8 General operating expense ratio 11.3 11.4 Expense ratio 26.7 25.2 Combined ratio 101.5 117.0 Accident year combined ratio, as adjusted 99.2 96.0 General Insurance Quarterly 2Q18 2Q19 2Q20 Loss ratio 65.7 63.0 72.6 Catastrophe losses and reinstatement premiums (2.3) (2.6) (11.9) Prior year development 0.8 0.9 0.8 Adjustments for ceded premium under reinsurance contracts and other 1.2 - - Accident year loss ratio, as adjusted 65.4 61.3 61.5 Acquisition ratio 21.1 22.2 20.0 General operating expense ratio 14.5 12.6 13.4 Expense ratio 35.6 34.8 33.4 Combined ratio 101.3 97.8 106.0 Accident year combined ratio, as adjusted 101.0 96.1 94.9 35

Non - GAAP Reconciliations Accident Year Loss Ratio, as adjusted, and Accident Year Combined Ratio, as adjusted General Insurance - International - Commercial Lines Quarterly 2Q19 2Q20 Loss ratio 61.5 66.3 Catastrophe losses and reinstatement premiums (0.3) (11.3) Prior year development 0.4 2.4 Accident year loss ratio, as adjusted 61.6 57.4 Acquisition ratio 21.1 20.4 General operating expense ratio 14.2 14.1 Expense ratio 35.3 34.5 Combined ratio 96.8 100.8 Accident year combined ratio, as adjusted 96.9 91.9 General Insurance - International Quarterly 2Q19 2Q20 Loss ratio 56.9 59.5 Catastrophe losses and reinstatement premiums (0.1) (5.4) Prior year development 0.1 0.6 Accident year loss ratio, as adjusted 56.9 54.7 Acquisition ratio 24.1 23.7 General operating expense ratio 14.5 14.4 Expense ratio 38.6 38.1 Combined ratio 95.5 97.6 Accident year combined ratio, as adjusted 95.5 92.8 General Insurance - International - Personal Insurance Quarterly 2Q19 2Q20 Loss ratio 52.9 52.9 Catastrophe losses and reinstatement premiums - 0.4 Prior year development (0.1) (1.2) Accident year loss ratio, as adjusted 52.8 52.1 Acquisition ratio 26.7 26.8 General operating expense ratio 14.9 14.6 Expense ratio 41.6 41.4 Combined ratio 94.5 94.3 Accident year combined ratio, as adjusted 94.4 93.5 General Insurance - Global Commercial Lines Quarterly 2Q19 2Q20 Loss ratio 69.6 81.6 Catastrophe losses and reinstatement premiums (3.4) (18.1) Prior year development 2.1 1.9 Accident year loss ratio, as adjusted 68.3 65.4 Acquisition ratio 17.6 16.4 General operating expense ratio 12.4 12.5 Expense ratio 30.0 28.9 Combined ratio 99.6 110.5 Accident year combined ratio, as adjusted 98.3 94.3 36
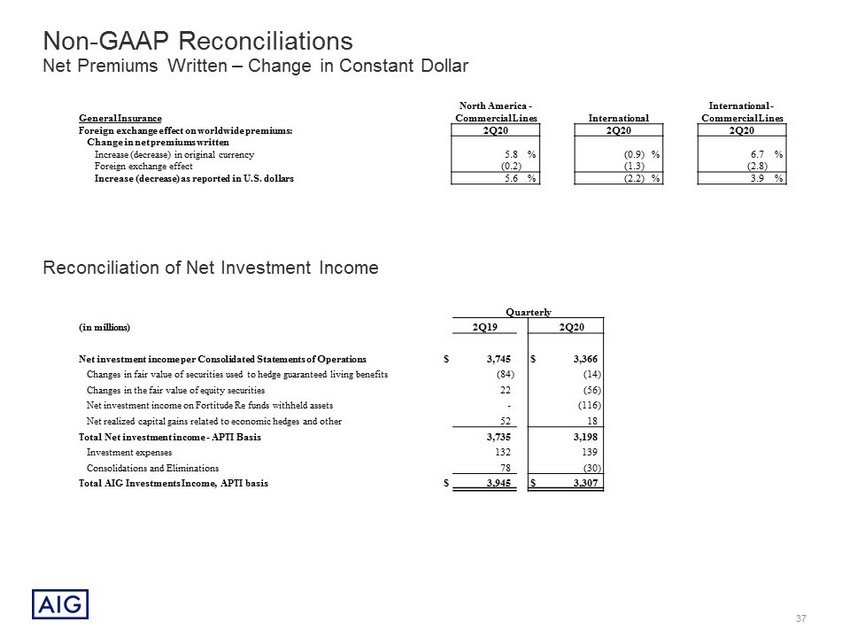
Non - GAAP Reconciliations Net Premiums Written – Change in Constant Dollar Reconciliation of Net Investment Income North America - International - General Insurance Commercial Lines International Commercial Lines Foreign exchange effect on worldwide premiums: 2Q20 2Q20 2Q20 Change in net premiums written Increase (decrease) in original currency 5.8 % (0.9) % 6.7 % Foreign exchange effect (0.2) (1.3) (2.8) Increase (decrease) as reported in U.S. dollars 5.6 % (2.2) % 3.9 % Quarterly (in millions) 2Q19 2Q20 Net investment income per Consolidated Statements of Operations $ 3,745 $ 3,366 Changes in fair value of securities used to hedge guaranteed living benefits (84) (14) Changes in the fair value of equity securities 22 (56) Net investment income on Fortitude Re funds withheld assets - (116) Net realized capital gains related to economic hedges and other 52 18 Total Net investment income - APTI Basis 3,735 3,198 Investment expenses 132 139 Consolidations and Eliminations 78 (30) Total AIG Investments Income, A PTI basis $ 3,945 $ 3,307 37

Non - GAAP Reconciliations Premiums (in millions) Six Months Ended Quarterly June 30, Individual Retirement: 2Q19 2Q20 2019 2020 Premiums $ 16 $ 38 $ 27 $ 79 Deposits 3,852 1,759 8,027 4,837 Other (3) (3) (3) (6) Premiums and deposits $ 3,865 $ 1,794 $ 8,051 $ 4,910 Individual Retirement (Fixed Annuities): Premiums $ 16 $ 29 $ 28 $ 64 Deposits 1,489 362 3,300 978 Other (3) (4) (5) (8) Premiums and deposits $ 1,502 $ 387 $ 3,323 $ 1,034 Individual Retirement (Variable Annuities): Premiums $ - $ 9 $ (1) $ 15 1 Deposits 656 532 1,213 1,385 Other - 1 2 1 1 Premiums and deposits $ 656 $ 542 $ 1,214 $ 1,401 Individual Retirement (Index Annuities): Premiums $ - $ - $ - $ - 1 Deposits 1,342 680 2,704 2,026 Other - - - - 1 Premiums and deposits $ 1,342 $ 680 $ 2,704 $ 2,026 Individual Retirement (Retail Mutual Funds): Premiums $ - $ - $ - $ - 1 Deposits 365 185 810 449 Other - - - - 1 Premiums and deposits $ 365 $ 185 $ 810 $ 449 Group Retirement: Premiums $ 5 $ 3 $ 9 $ 9 Deposits 2,042 1,667 4,101 3,516 Other - - - - 1 Premiums and deposits $ 2,047 $ 1,670 $ 4,110 $ 3,525 Life Insurance: Premiums $ 425 $ 447 $ 820 $ 866 Deposits 413 420 819 822 Other 194 204 388 398 Premiums and deposits $ 1,032 $ 1,071 $ 2,027 $ 2,086 Institutional Markets: Premiums $ 152 $ 1,089 $ 971 $ 1,846 Deposits 108 33 394 185 Other 8 7 15 15 Premiums and deposits $ 268 $ 1,129 $ 1,380 $ 2,046 Total Life and Retirement: Premiums $ 598 $ 1,577 $ 1,827 $ 2,800 Deposits 6,415 3,879 13,341 9,360 Other 199 208 400 407 Premiums and deposits $ 7,212 $ 5,664 $ 15,568 $ 12,567 38