Attached files
| file | filename |
|---|---|
| EX-99.2 - EX-99.2 FINANCIAL SUPPLEMENT - FEDERAL NATIONAL MORTGAGE ASSOCIATION FANNIE MAE | q220_exhibit992.htm |
| 8-K - 8-K - FEDERAL NATIONAL MORTGAGE ASSOCIATION FANNIE MAE | fnm-20200730.htm |

Contact: Pete Bakel Resource Center: 1-800-732-6643
202-752-2034 Exhibit 99.1
Date: July 30, 2020
Fannie Mae Reports Net Income of $2.5 Billion for Second Quarter 2020
Second Quarter 2020 Results | “During this time of economic uncertainty, Fannie Mae is a force for stability, affordability, and liquidity in the housing markets. In the second quarter, we helped hundreds of thousands of homeowners and renters get the guidance and support they needed to stay in their homes, while we delivered on record refinancing demand. Fannie Mae will continue to work with partners across the industry to fulfill our mission and our leadership role in housing finance.” Hugh R. Frater, Chief Executive Officer | ||||||||||||||||||||||||||||||||||
| • | Fannie Mae reported net income of $2.5 billion for the second quarter of 2020, compared with net income of $461 million for the first quarter of 2020. The increase in net income was due primarily to a decline in credit-related expense in the second quarter of 2020 compared with the first quarter of 2020. The company’s credit-related expense in the first quarter of 2020 was driven by a substantial increase in its allowance for loan losses due to the economic dislocation caused by the COVID-19 pandemic. The allowance for loan losses remained relatively flat in the second quarter of 2020. | ||||||||||||||||||||||||||||||||||
| • | Fannie Mae continues to provide economic relief to borrowers impacted by COVID-19 through its forbearance program. As of June 30, 2020, 5.7% of Fannie Mae’s single-family guaranty book of business based on loan count and 1.2% of the company’s multifamily guaranty book of business based on unpaid principal balance were in forbearance, the vast majority of which were related to COVID-19. | ||||||||||||||||||||||||||||||||||
| • | Fannie Mae’s net worth increased from $13.9 billion as of March 31, 2020 to $16.5 billion as of June 30, 2020. Based on its agreement with the U.S. Department of the Treasury, the company may retain quarterly earnings until its net worth reaches $25 billion. | ||||||||||||||||||||||||||||||||||
| • | Fannie Mae expects the impact of the COVID-19 pandemic to continue to negatively affect its financial results, contributing to lower net income in 2020 than in 2019. | ||||||||||||||||||||||||||||||||||
Business Highlights | |||||||||||||||||||||||||||||||||||
| • | Fannie Mae is providing substantial liquidity to lenders during the COVID-19 pandemic and fulfilling Fannie Mae’s mission to stabilize the housing finance market and provide liquidity, support, and access to affordable mortgage financing in all U.S. markets in all economic cycles. | ||||||||||||||||||||||||||||||||||
| • | Fannie Mae provided $542 billion in single-family liquidity to the mortgage market in the first half of 2020, including $288 billion through its whole loan conduit, enabling the financing of approximately 593,000 home purchases and 1,352,000 refinancings. Fannie Mae has financed approximately one in four single-family mortgage loans outstanding in the United States. | ||||||||||||||||||||||||||||||||||
| • | Fannie Mae provided $34 billion in multifamily financing in the first half of 2020, which enabled the financing of 373,000 units of multifamily housing. More than 90% of the multifamily units the company financed in the first half of 2020 were affordable to families earning at or below 120% of the area median income, providing support for both affordable and workforce housing. | ||||||||||||||||||||||||||||||||||
| • | Fannie Mae did not enter into credit risk transfer transactions in the second quarter of 2020 due to continuing adverse market conditions as a result of the COVID-19 pandemic. Although market conditions have improved, Fannie Mae currently does not have plans to engage in additional credit risk transfer transactions as the company and its financial advisors evaluate the Federal Housing Finance Agency’s (FHFA’s) recently re-proposed capital rule, which would reduce the amount of capital relief the company obtains from these transactions. Fannie Mae will continue to review its plans, which may be affected by the company’s evaluation of the proposed capital rule and changes in the rule as it is finalized, its progress in meeting FHFA’s 2020 conservatorship scorecard, the strength of future market conditions, and its review of the company’s overall business and capital plan to enable it to exit conservatorship. | ||||||||||||||||||||||||||||||||||

| Second Quarter 2020 Results | 1 | |||||||
WASHINGTON, DC — Fannie Mae (FNMA/OTCQB) reported net income of $2.5 billion and comprehensive income of $2.5 billion for the second quarter of 2020, compared with net income of $461 million and comprehensive income of $476 million for the first quarter of 2020. The increase in net income was due primarily to a decline in credit-related expense in the second quarter of 2020 compared with the first quarter of 2020. The company’s credit-related expense in the first quarter of 2020 was driven by a substantial increase in its allowance for loan losses due to the economic dislocation caused by the COVID-19 pandemic. The allowance for loan losses remained relatively flat in the second quarter of 2020.
| Fannie Mae Response to COVID-19 | ||
In March 2020, the COVID-19 outbreak in the United States was declared a national emergency. The COVID-19 pandemic resulted in stay-at-home orders, school closures, and widespread business shutdowns across the country. Although business activity has begun to resume to varying degrees, the speed and nature of the resumption of economic activity remains highly uncertain. The COVID-19 pandemic continues to have a significant impact on Fannie Mae’s business and financial results.
Fannie Mae Response
Fannie Mae is taking a number of actions to help borrowers, renters, lenders, and its employees manage the negative impact of the COVID-19 pandemic.
Borrowers and Renters
•Fannie Mae has implemented new policies to enable the company’s single-family and multifamily loan servicers to better assist borrowers and renters impacted by COVID-19, including to:
◦provide forbearance to single-family borrowers reporting they are experiencing a financial hardship due to the COVID-19 outbreak for up to 180 days, and at the borrower’s request, extend the forbearance period up to a maximum of 12 months total; approximately 972,000 single-family loans in the company’s book of business were in forbearance as of June 30, 2020;
◦offer options following forbearance, including a repayment plan, payment deferral, or a loan modification that aims to maintain or reduce a borrower’s monthly payment;
◦suspend foreclosures and foreclosure-related activities for single-family properties through at least August 31, 2020, other than for vacant or abandoned properties;
◦report as current to credit bureaus homeowners who comply with their forbearance plan and were current prior to receiving COVID-19-related forbearance and provide that no late fees are charged for homeowners in a forbearance plan; and
◦provide forbearance to multifamily borrowers experiencing a financial hardship due to the COVID-19 outbreak for up to 6 months on the condition that the borrower suspend all renter evictions for nonpayment of rent during the forbearance period, through the 120-day eviction moratorium under the CARES Act, which ended on July 25, 2020, or any longer period required by state or local law.
•Fannie Mae created the #HeretoHelp educational effort and updated the company’s KnowYourOptions.com website to help keep people in their homes, providing information and resources on relief options for borrowers and renters impacted by COVID-19. The website includes the Renters Resource Finder, an online tool that allows renters to enter their building address to determine whether they live in a Fannie Mae-financed property and learn what resources they can access for help. Resources include access to Fannie Mae’s Disaster Response Network, which offers free assistance to renters in Fannie Mae-financed rental properties, such as HUD-approved housing counselors that can help create a personalized action plan, offer financial coaching and budgeting, and provide other support.
| Second Quarter 2020 Results | 2 | |||||||
Lenders
•Fannie Mae provided more than $453 billion in liquidity to the single-family and multifamily mortgage markets from the beginning of March 2020 through June 2020, including more than $241 billion through the company’s whole loan conduit to support small and mid-sized lenders, including community lenders, fulfilling Fannie Mae’s mission to stabilize the housing finance market and provide liquidity, support, and access to affordable mortgage financing in all U.S. markets in all economic cycles.
•Fannie Mae limited the duration of single-family servicers’ obligations to advance principal and interest payments on delinquent loans to four months.
•Fannie Mae continues to build its digital mortgage capabilities, enabling the company to adapt quickly to lenders’ needs. In addition, the company is offering measures to help ensure lenders have the clarity and flexibility to continue to lend in a prudent and responsible manner during the COVID-19 pandemic. These measures include: offering additional methods of obtaining verbal verification of borrower employment; using the company’s digital tools to offer flexibilities related to the lender’s process for obtaining inspections and appraisals; and allowing remote online notarization options.
Employees
•Fannie Mae has taken steps to protect the safety and resiliency of its workforce. The company has required nearly all of its workforce to work remotely since mid-March and continues to assess when it will be safe for employees to return to the office.
•To date, the company’s business resiliency plans and technology systems have effectively supported its company-wide telework arrangement, allowing Fannie Mae to continue its critical function of supporting mortgage market liquidity.
•Fannie Mae offers support services and resources for employees and their families affected by COVID-19, including the company’s Employee Assistance Program that provides a helpline number to support loved ones who may not be covered otherwise.
•Fannie Mae continued to pay most contractors (e.g., cafeteria staff) and accelerated payments to identified small businesses.
Risks and Uncertainties
Fannie Mae’s current forecasts and expectations relating to the impact of the COVID-19 pandemic are subject to many uncertainties and may change, perhaps substantially. It is difficult to assess or predict the impact of this unprecedented event on the company’s business, financial results, or financial condition. Factors that will impact the extent to which the COVID-19 pandemic affects the company’s business, financial results, and financial condition include: the duration, spread, and severity of COVID-19 outbreaks; the actions taken to contain the virus or treat its impact, including government actions to mitigate the economic impact of the pandemic; the extent to which consumers, workers, and families feel safe resuming business activities and school; the nature and extent of the forbearance, modification, and other loss mitigation options borrowers affected by the pandemic obtain from Fannie Mae; accounting elections and estimates relating to the impact of the COVID-19 pandemic; borrower and renter behavior in response to the pandemic and its economic impact; how quickly and to what extent normal economic and operating conditions can resume, including whether any future outbreaks interrupt economic recovery; and how quickly and to what extent affected borrowers, renters, and counterparties can recover from the negative economic impact of the pandemic. See “Risk Factors” in the company’s Second Quarter 2020 Form 10-Q for a discussion of the risks to the company’s business, financial results, and financial condition relating to the COVID-19 pandemic. See “Forward-Looking Statements” in the company’s Second Quarter 2020 Form 10-Q for a discussion of factors that could cause actual conditions, events, or results to differ materially from those described in the company’s forecasts, expectations, and other forward-looking statements in this release.
| Second Quarter 2020 Results | 3 | |||||||
Summary of Financial Results | ||
(Dollars in millions) | 2Q20 | 1Q20 | Variance | 2Q19 | Variance | |||||||||||||||||||||||||||
Net interest income | $ | 5,777 | $ | 5,347 | $ | 430 | $ | 5,227 | $ | 550 | ||||||||||||||||||||||
Fee and other income | 90 | 120 | (30) | 113 | (23) | |||||||||||||||||||||||||||
Net revenues | 5,867 | 5,467 | 400 | 5,340 | 527 | |||||||||||||||||||||||||||
| Investment gains (losses), net | 149 | (158) | 307 | 461 | (312) | |||||||||||||||||||||||||||
| Fair value losses, net | (1,018) | (276) | (742) | (754) | (264) | |||||||||||||||||||||||||||
| Administrative expenses | (754) | (749) | (5) | (744) | (10) | |||||||||||||||||||||||||||
| Credit-related income (expenses): | ||||||||||||||||||||||||||||||||
| Benefit (provision) for credit losses | (12) | (2,583) | 2,571 | 1,225 | (1,237) | |||||||||||||||||||||||||||
Foreclosed property expense | (10) | (80) | 70 | (128) | 118 | |||||||||||||||||||||||||||
| Total credit-related income (expenses) | (22) | (2,663) | 2,641 | 1,097 | (1,119) | |||||||||||||||||||||||||||
Temporary Payroll Tax Cut Continuation Act of 2011 (“TCCA”) fees | (660) | (637) | (23) | (600) | (60) | |||||||||||||||||||||||||||
| Credit enhancement expense | (360) | (376) | 16 | (276) | (84) | |||||||||||||||||||||||||||
| Change in expected credit enhancement recoveries | 273 | 188 | 85 | — | 273 | |||||||||||||||||||||||||||
Other expenses, net | (261) | (218) | (43) | (203) | (58) | |||||||||||||||||||||||||||
Income before federal income taxes | 3,214 | 578 | 2,636 | 4,321 | (1,107) | |||||||||||||||||||||||||||
Provision for federal income taxes | (669) | (117) | (552) | (889) | 220 | |||||||||||||||||||||||||||
Net income | $ | 2,545 | $ | 461 | $ | 2,084 | $ | 3,432 | $ | (887) | ||||||||||||||||||||||
Total comprehensive income | $ | 2,532 | $ | 476 | $ | 2,056 | $ | 3,365 | $ | (833) | ||||||||||||||||||||||
Net revenues, which consist of net interest income and fee and other income, were $5.9 billion for the second quarter of 2020, compared with $5.5 billion for the first quarter of 2020.
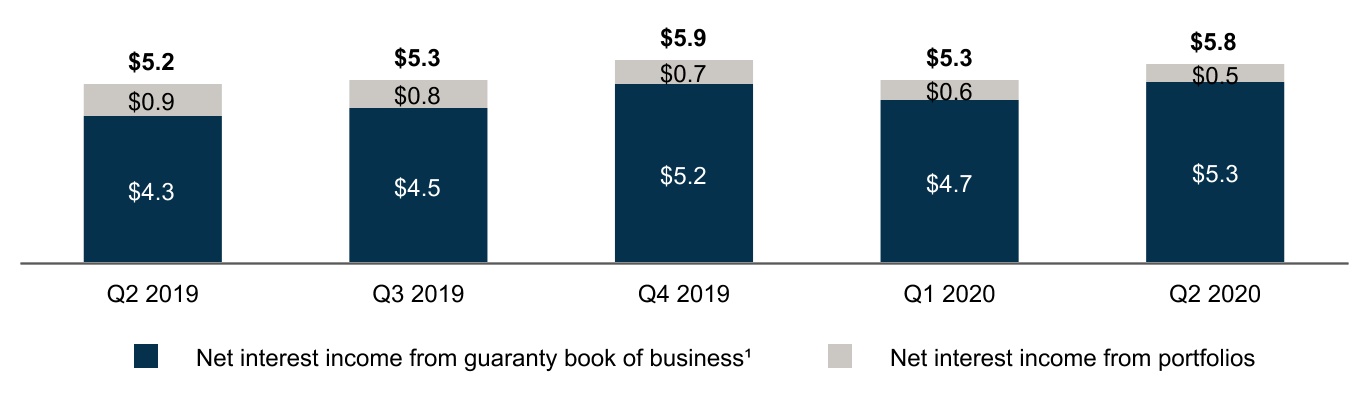
Net interest income was $5.8 billion for the second quarter of 2020, compared with $5.3 billion for the first quarter of 2020. The increase in net interest income was due primarily to higher amortization income driven by an increase in mortgage prepayment activity as a result of the historically low interest rate environment in the second quarter of 2020. The company’s net interest income for the second quarter of 2020 was impacted by an update to the application of its accounting policy for nonaccrual loans that allowed the company to continue accruing interest income on delinquent loans that were current as of March 1, 2020 and have been negatively impacted by the COVID-19 pandemic. As a result of this update, the company recognized $1.5 billion in net interest income related to these loans in the second quarter. See “Note 1, Summary of Significant Accounting Policies—New Accounting Guidance” in the company’s Second Quarter 2020 Form 10-Q for more information on the company’s policy for nonaccrual loans.
Net Interest Income
(Dollars in Billions)
| Second Quarter 2020 Results | 4 | |||||||
(1)Includes revenues generated by the 10 basis point guaranty fee increase the company implemented pursuant to the TCCA, the incremental revenue from which is remitted to Treasury and not retained by Fannie Mae.
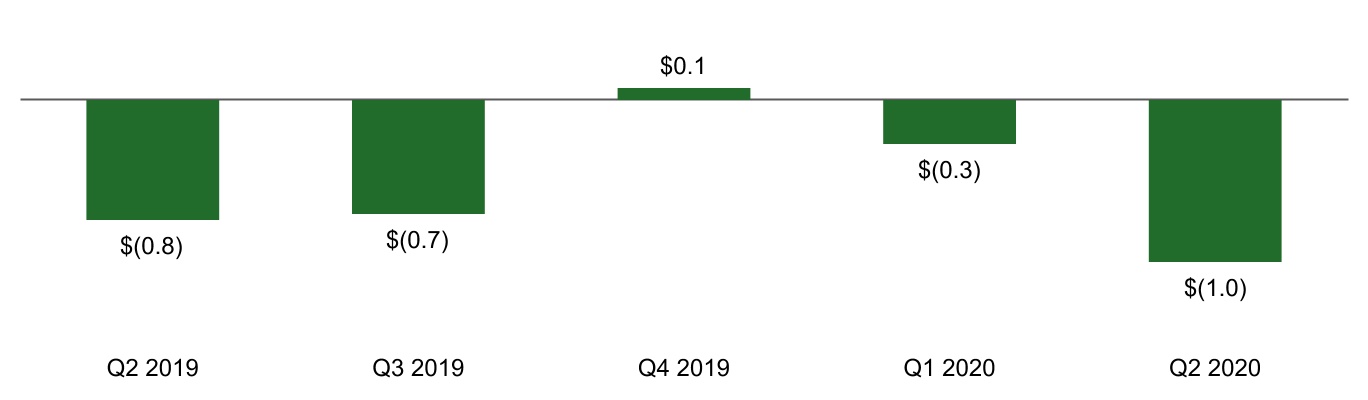
Net fair value losses were $1.0 billion in the second quarter of 2020, compared with $276 million in the first quarter of 2020. The increase in net fair value losses in the second quarter of 2020 was driven primarily by a shift from gains to losses on Connecticut Avenue Securities® (CAS) debt reported at fair value resulting from tightening spreads between CAS debt yields and LIBOR during the second quarter of 2020.
Fair Value Gains (Losses), Net
(Dollars in Billions)
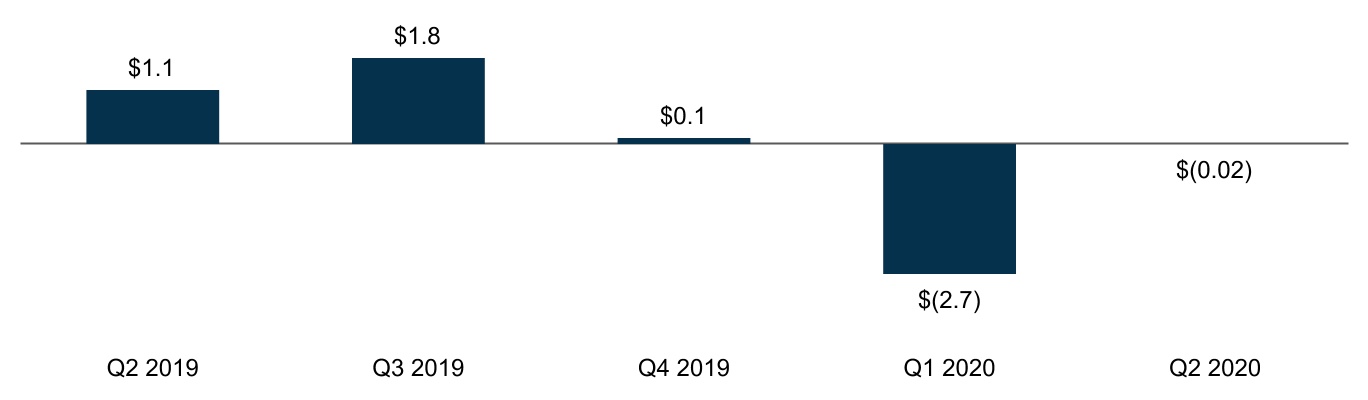
Credit-related income (expense) consists of a benefit or provision for credit losses and foreclosed property expense. Credit-related expense decreased to $22 million in the second quarter of 2020 from $2.7 billion in the first quarter of 2020. Credit-related expense in the first quarter was driven by a substantial increase in the allowance for loan losses due to the economic dislocation caused by the COVID-19 pandemic. The allowance for loan losses remained relatively flat in the second quarter of 2020.
Credit-Related Income (Expense)
(Dollars in Billions)
| Second Quarter 2020 Results | 5 | |||||||
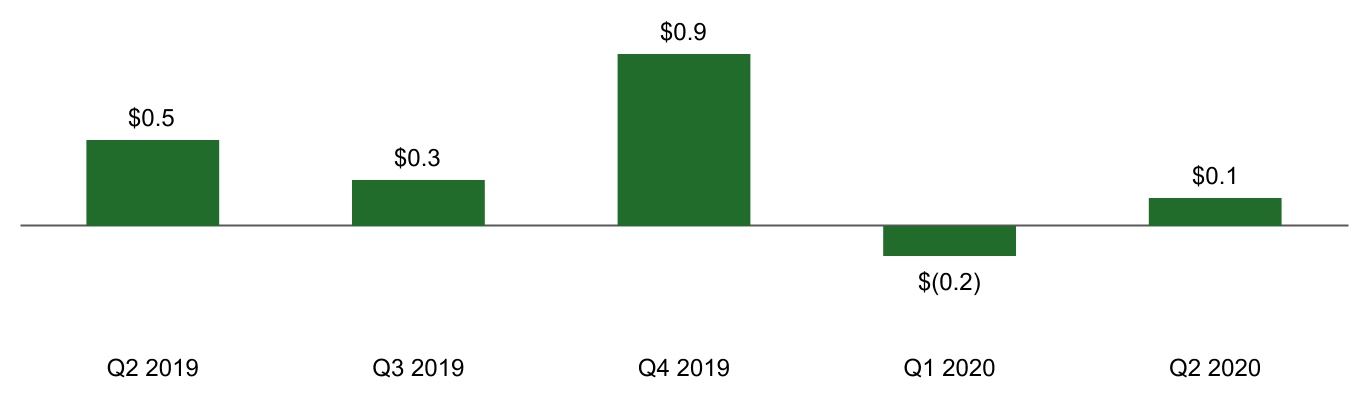
Net investment gains were $149 million in the second quarter of 2020, compared with net investment losses of $158 million in the first quarter of 2020. The shift to net investment gains in the second quarter of 2020 was due primarily to an increase in the fair value of single-family held-for-sale loans in the second quarter of 2020.
Investment Gains (Losses), Net
(Dollars in Billions)
Providing Liquidity and Support to the Market | ||
Fannie Mae’s mission is to provide a stable source of liquidity to support housing for low-and moderate-income borrowers and renters. In the first half of 2020, more than 90% of the multifamily units the company financed were affordable to families earning at or below 120% of the area median income, providing support for both affordable and workforce housing.
Through its single-family and multifamily business segments, Fannie Mae provided more than $575 billion in liquidity to the mortgage market in the first half of 2020, including $288 billion through its whole loan conduit, enabling the financing of approximately 2.3 million home purchases, refinancings, or rental units.
Fannie Mae Provided More Than $575 Billion in Liquidity in the First Half of 2020
| Unpaid Principal Balance | Units | |||||||||||||
| $161B | 593K Single-Family Home Purchases | |||||||||||||
| $381B | 1.3M Single-Family Refinancings | |||||||||||||
| $34B | 373K Multifamily Rental Units | |||||||||||||
| Second Quarter 2020 Results | 6 | |||||||
Business Segments | ||
Fannie Mae’s two reportable business segments—Single-Family and Multifamily—engage in complementary business activities to provide liquidity, access to credit, and affordability in all U.S. housing markets at all times, while effectively managing risk.
Single-Family Business Financial Results | ||
(Dollars in millions) | 2Q20 | 1Q20 | Variance | 2Q19 | Variance | |||||||||||||||||||||||||||
| Net interest income | $ | 4,939 | $ | 4,541 | $ | 398 | $ | 4,419 | $ | 520 | ||||||||||||||||||||||
| Fee and other income | 71 | 94 | (23) | 88 | (17) | |||||||||||||||||||||||||||
| Net revenues | 5,010 | 4,635 | 375 | 4,507 | 503 | |||||||||||||||||||||||||||
| Investment gains (losses), net | 96 | (152) | 248 | 417 | (321) | |||||||||||||||||||||||||||
| Fair value gains (losses), net | (1,030) | (460) | (570) | (758) | (272) | |||||||||||||||||||||||||||
| Administrative expenses | (625) | (629) | 4 | (634) | 9 | |||||||||||||||||||||||||||
| Credit-related income (expense) | 216 | (2,250) | 2,466 | 1,126 | (910) | |||||||||||||||||||||||||||
| TCCA fees | (660) | (637) | (23) | (600) | (60) | |||||||||||||||||||||||||||
| Credit enhancement expense | (307) | (316) | 9 | (229) | (78) | |||||||||||||||||||||||||||
| Change in expected credit enhancement recoveries | 208 | 58 | 150 | — | 208 | |||||||||||||||||||||||||||
| Other expenses, net | (252) | (163) | (89) | (189) | (63) | |||||||||||||||||||||||||||
| Income before federal income taxes | 2,656 | 86 | 2,570 | 3,640 | (984) | |||||||||||||||||||||||||||
| Provision for federal income taxes | (556) | (18) | (538) | (769) | 213 | |||||||||||||||||||||||||||
| Net income | $ | 2,100 | $ | 68 | $ | 2,032 | $ | 2,871 | $ | (771) | ||||||||||||||||||||||
| Serious delinquency rate | 2.65 | % | 0.66 | % | 0.70 | % | ||||||||||||||||||||||||||
Business Highlights
•The average single-family conventional guaranty book of business increased by over $50 billion during the second quarter of 2020. The average charged guaranty fee, net of Temporary Payroll Tax Cut Continuation Act of 2011 (TCCA) fees, on the single-family conventional guaranty book increased from 43.8 basis points as of March 31, 2020 to 44.2 basis points as of June 30, 2020.
•Fannie Mae’s average charged guaranty fee on newly acquired conventional single-family loans, net of TCCA fees, decreased 2.7 basis points to 46.7 basis points in the second quarter of 2020 from 49.4 basis points in the first quarter of 2020, driven primarily by the stronger credit profile of the single-family loans acquired in the second quarter of 2020 compared with the first quarter of 2020.
•Single-family acquisition volume was over $350 billion in the second quarter of 2020, an increase of 84% compared with the first quarter of 2020. The increase was driven by a $137 billion increase in refinance volume due to the historically low interest rate environment, resulting in the highest level of refinance volumes in any quarter since the third quarter of 2003.
•The single-family serious delinquency rate increased to 2.65% as of June 30, 2020, from 0.66% as of March 31, 2020, due to economic dislocation caused by the COVID-19 pandemic, which increased borrower participation in forbearance plans. The single-family serious delinquency rate excluding loans in forbearance was 0.59% as of June 30, 2020. Single-family seriously delinquent loans are loans that are 90 days or more past due or in the foreclosure process.
•As of June 30, 2020, 5.7% of Fannie Mae’s single-family guaranty book of business based on loan count were in forbearance, the vast majority of which were related to COVID-19; 25% of these loans in forbearance were still current.
| Second Quarter 2020 Results | 7 | |||||||
| Multifamily Business Financial Results | ||
| (Dollars in millions) | 2Q20 | 1Q20 | Variance | 2Q19 | Variance | |||||||||||||||||||||||||||
| Net interest income | $ | 838 | $ | 806 | $ | 32 | $ | 808 | $ | 30 | ||||||||||||||||||||||
| Fee and other income | 19 | 26 | (7) | 25 | (6) | |||||||||||||||||||||||||||
| Net revenues | 857 | 832 | 25 | 833 | 24 | |||||||||||||||||||||||||||
| Fair value gains (losses), net | 12 | 184 | (172) | 4 | 8 | |||||||||||||||||||||||||||
| Administrative expenses | (129) | (120) | (9) | (110) | (19) | |||||||||||||||||||||||||||
| Credit-related expense | (238) | (413) | 175 | (29) | (209) | |||||||||||||||||||||||||||
| Credit enhancement expense | (53) | (60) | 7 | (47) | (6) | |||||||||||||||||||||||||||
| Change in expected credit enhancement recoveries | 65 | 130 | (65) | — | 65 | |||||||||||||||||||||||||||
| Other income (expenses), net | 44 | (61) | 105 | 30 | 14 | |||||||||||||||||||||||||||
| Income before federal income taxes | 558 | 492 | 66 | 681 | (123) | |||||||||||||||||||||||||||
| Provision for federal income taxes | (113) | (99) | (14) | (120) | 7 | |||||||||||||||||||||||||||
| Net income | $ | 445 | $ | 393 | $ | 52 | $ | 561 | $ | (116) | ||||||||||||||||||||||
| Serious delinquency rate | 1.00 | % | 0.05 | % | 0.05 | % | ||||||||||||||||||||||||||
Business Highlights
•The multifamily guaranty book of business increased by over $12 billion during the second quarter of 2020 to nearly $360 billion. The average charged guaranty fee on the multifamily book was stable compared with the prior quarter at approximately 72 basis points as of June 30, 2020.
•New multifamily business volume was $34 billion in the first half of 2020. Approximately $48 billion of new business capacity remains under the $100 billion multifamily business volume cap structure for the five-quarter period ending December 31, 2020.
•The multifamily serious delinquency rate increased to 1.00% as of June 30, 2020 from 0.05% as of March 31, 2020, due to the economic dislocation caused by the COVID-19 pandemic, which increased borrower participation in forbearance plans. The multifamily serious delinquency rate excluding loans in forbearance was 0.09% as of June 30, 2020. Multifamily seriously delinquent loans are loans that are 60 days or more past due.
•As of June 30, 2020, based on unpaid principal balance, 1.2% of Fannie Mae’s multifamily guaranty book of business was in forbearance, the vast majority of which were related to COVID-19. Seniors Housing loans, which constituted 5% of the company’s multifamily guaranty book of business as of June 30, 2020, comprised nearly half of the total multifamily unpaid principal balance of loans in forbearance.
| Second Quarter 2020 Results | 8 | |||||||
Proposed Capital Framework | ||
On May 20, 2020, FHFA released a proposed new regulatory capital framework for Fannie Mae and Freddie Mac. The proposed framework is expected to require Fannie Mae to hold significantly more capital than the rule FHFA first proposed in June 2018. The proposed rule includes a mortgage-risk-sensitive framework, similar to the 2018 proposal, but differs from the 2018 proposal in a number of ways, including the following:
•The proposed rule includes supplemental capital requirements relating to the amount and form of the capital the company holds, based on definitions of capital used in U.S. banking regulators’ regulatory capital framework. The proposal specifies complementary leverage-based and risk-based requirements, which together determine the requirements for each tier of capital;
•The proposed rule requires Fannie Mae to hold capital buffers that can be drawn down in periods of financial stress and then rebuilt over time as economic conditions improve. If Fannie Mae falls below the prescribed buffer amounts, the company must restrict capital distributions such as stock repurchases and dividends, as well as discretionary bonus payments to executives, until the buffer amounts are restored;
•The proposed rule provides less capital relief for credit risk transfer activities than the 2018 proposal;
•The proposed rule imposes specific minimum percentages, or “floors,” on the risk-weight applicable to single-family and multifamily exposures, as well as to retained portions of credit risk transfer transactions; and
•The proposed rule incorporates additional elements based on U.S. banking regulators’ regulatory capital framework, including the introduction of the advanced approach to complement the standardized approach for measuring risk-weighted assets.
The capital requirements and buffers established by the proposed rule would have a delayed compliance date, unless adjusted by FHFA, of the later of one year from publication of the final rule or the date the company’s conservatorship terminates.
Fannie Mae continues to study the proposed capital rule and its potential impact on the company and the housing market. Comments on the proposed capital rule are due by August 31, 2020. Fannie Mae does not yet know what changes FHFA may make to the capital rule before it is finalized or when it will be finalized.
See “Legislation and Regulation” in the company’s Second Quarter 2020 Form 10-Q for more information on the proposed capital rule, including a discussion of how the final capital rule may impact Fannie Mae’s business.
Selection of Financial Advisor to Assist with Recapitalization Plan | ||
In June 2020, Fannie Mae hired Morgan Stanley & Co. LLC as underwriting financial advisor to assist the company in developing and implementing a plan for recapitalizing the company and responsibly ending its conservatorship. Fannie Mae’s advisor is working closely with the company, FHFA, and Treasury to consider business and capital structures, market impacts and timing, and available capital-raising alternatives, among other items.
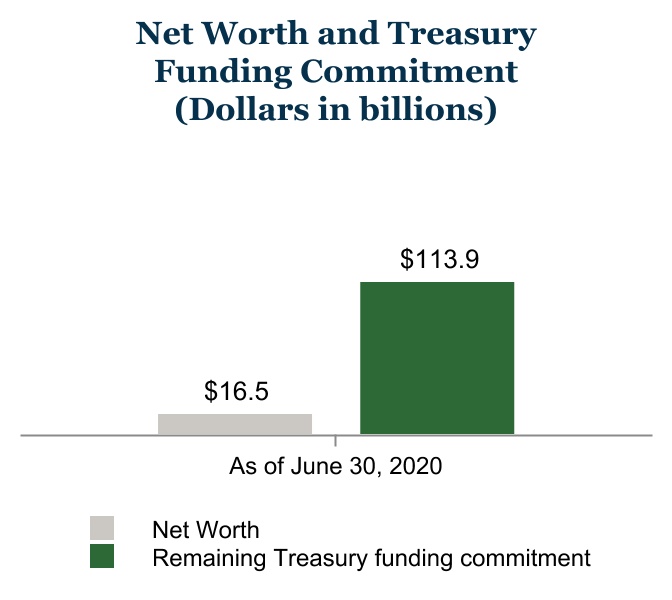
Net Worth, Treasury Funding and Senior Preferred Stock Dividends | ||
Treasury has made a commitment under a senior preferred stock purchase agreement to provide funding to Fannie Mae under certain circumstances if the company has a net worth deficit. Pursuant to the senior preferred stock purchase agreement, the company issued shares of senior preferred stock to Treasury in 2008.
Under the terms of the senior preferred stock, Fannie Mae will not owe senior preferred stock dividends to Treasury until it has accumulated over $25 billion in net worth as of the end of a quarter. Accordingly, no dividends were payable to Treasury for the second quarter of 2020, and none are payable for the third quarter of 2020.
| Second Quarter 2020 Results | 9 | |||||||
The charts below show information about Fannie Mae’s net worth, the remaining amount of Treasury’s funding commitment to Fannie Mae, senior preferred stock dividends the company has paid Treasury and funds the company has drawn from Treasury pursuant to its funding commitment.
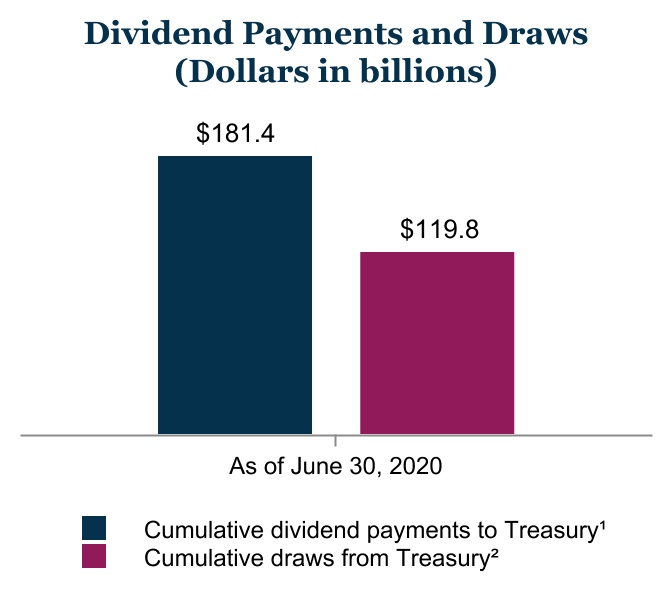
(1)Aggregate amount of dividends the company has paid to Treasury on the senior preferred stock from 2008 through June 30, 2020. Under the terms of the senior preferred stock purchase agreement, dividend payments the company makes to Treasury do not offset its draws of funds from Treasury.
(2)Aggregate amount of funds the company has drawn from Treasury pursuant to the senior preferred stock purchase agreement from 2008 through June 30, 2020.
The aggregate liquidation preference of the senior preferred stock was $135.4 billion as of June 30, 2020, unchanged from March 31, 2020 as a result of the decrease in the company’s net worth during the first quarter of 2020. The aggregate liquidation preference of the senior preferred stock will increase to $138.0 billion as of September 30, 2020 due to the $2.5 billion increase in the company’s net worth during the second quarter of 2020.
If the company were to draw additional funds from Treasury under the senior preferred stock purchase agreement with respect to a future period, the amount of remaining funding under the agreement would be reduced by the amount of the company’s draw, and the aggregate liquidation preference of the senior preferred stock would increase by the amount of that draw.
For a description of the terms of the senior preferred stock purchase agreement and the senior preferred stock, see “Business—Conservatorship, Treasury Agreements and Housing Finance Reform” in the company’s 2019 Form 10-K.
-
Fannie Mae’s financial statements for the second quarter of 2020 are available in the accompanying Annex; however, investors and interested parties should read the company’s Second Quarter 2020 Form 10-Q, which was filed today with the Securities and Exchange Commission and is available on Fannie Mae’s website, www.fanniemae.com. The company provides further discussion of its financial results and condition, credit performance, and other matters in its Second Quarter 2020 Form 10-Q. Additional information about the company’s financial and credit performance is contained in Fannie Mae’s Q2 2020 Financial Supplement at www.fanniemae.com.
# # #
In this release, the company has presented a number of estimates, forecasts, expectations, and other forward-looking statements, including statements regarding: the company’s business plans, the company’s future business and financial results, the future impact of the COVID-19 pandemic on the company’s business and financial results, the impact of FHFA’s proposed capital framework on the company’s business and results, future dividend payments to Treasury, and the future liquidation preference of the senior preferred stock. These estimates, forecasts, expectations, and statements are forward-looking statements based on the company’s current assumptions
| Second Quarter 2020 Results | 10 | |||||||
regarding numerous factors and are subject to significant uncertainties and changes in circumstances. Actual results, and future projections, could be materially different from what is set forth in these forward-looking statements due to a variety of factors, including those described in “Forward-Looking Statements” and “Risk Factors” in the company’s Second Quarter 2020 Form 10-Q and its 2019 Form 10-K.
Fannie Mae provides website addresses in its news releases solely for readers’ information. Other content or information appearing on these websites is not part of this release.
Fannie Mae helps make the 30-year fixed-rate mortgage and affordable rental housing possible for millions of Americans. We partner with lenders to create housing opportunities for families across the country. We are driving positive changes in housing finance to make the home buying process easier, while reducing costs and risk. To learn more, visit fanniemae.com and follow us on twitter.com/fanniemae.
| Second Quarter 2020 Results | 11 | |||||||
ANNEX
FANNIE MAE
(In conservatorship)
Condensed Consolidated Balance Sheets — (Unaudited)
(Dollars in millions)
| As of | |||||||||||||||||||||||
| June 30, 2020 | December 31, 2019 | ||||||||||||||||||||||
| ASSETS | |||||||||||||||||||||||
| Cash and cash equivalents | $ | 54,510 | $ | 21,184 | |||||||||||||||||||
Restricted cash (includes $58,581 and $33,294, respectively, related to consolidated trusts) | 65,714 | 40,223 | |||||||||||||||||||||
| Federal funds sold and securities purchased under agreements to resell or similar arrangements | 25,450 | 13,578 | |||||||||||||||||||||
| Investments in securities: | |||||||||||||||||||||||
Trading, at fair value (includes $5,727 and $3,037, respectively, pledged as collateral) | 106,744 | 48,123 | |||||||||||||||||||||
Available-for-sale, at fair value (with an amortized cost of $1,990, net of allowance for credit losses of $3 as of June 30, 2020) | 2,120 | 2,404 | |||||||||||||||||||||
| Total investments in securities | 108,864 | 50,527 | |||||||||||||||||||||
| Mortgage loans: | |||||||||||||||||||||||
Loans held for sale, at lower of cost or fair value | 7,580 | 6,773 | |||||||||||||||||||||
| Loans held for investment, at amortized cost: | |||||||||||||||||||||||
| Of Fannie Mae | 107,771 | 94,911 | |||||||||||||||||||||
Of consolidated trusts | 3,356,950 | 3,241,494 | |||||||||||||||||||||
Total loans held for investment (includes $7,303 and $7,825, respectively, at fair value) | 3,464,721 | 3,336,405 | |||||||||||||||||||||
| Allowance for loan losses | (12,966) | (9,016) | |||||||||||||||||||||
| Total loans held for investment, net of allowance | 3,451,755 | 3,327,389 | |||||||||||||||||||||
| Total mortgage loans | 3,459,335 | 3,334,162 | |||||||||||||||||||||
| Advances to lenders | 7,983 | 6,453 | |||||||||||||||||||||
| Deferred tax assets, net | 13,119 | 11,910 | |||||||||||||||||||||
Accrued interest receivable, net (includes $9,451 and $8,172, respectively, related to consolidated trusts and net of an allowance of $172 as of June 30, 2020) | 9,679 | 8,604 | |||||||||||||||||||||
| Acquired property, net | 1,844 | 2,366 | |||||||||||||||||||||
| Other assets | 14,178 | 14,312 | |||||||||||||||||||||
| Total assets | $ | 3,760,676 | $ | 3,503,319 | |||||||||||||||||||
| LIABILITIES AND EQUITY | |||||||||||||||||||||||
| Liabilities: | |||||||||||||||||||||||
Accrued interest payable (includes $9,312 and $9,361, respectively, related to consolidated trusts) | $ | 10,054 | $ | 10,228 | |||||||||||||||||||
| Debt: | |||||||||||||||||||||||
Of Fannie Mae (includes $4,546 and $5,687, respectively, at fair value) | 275,637 | 182,247 | |||||||||||||||||||||
Of consolidated trusts (includes $23,883 and $21,880, respectively, at fair value) | 3,444,338 | 3,285,139 | |||||||||||||||||||||
Other liabilities (includes $1,638 and $376, respectively, related to consolidated trusts) | 14,170 | 11,097 | |||||||||||||||||||||
| Total liabilities | 3,744,199 | 3,488,711 | |||||||||||||||||||||
| Commitments and contingencies (Note 13) | — | — | |||||||||||||||||||||
| Fannie Mae stockholders’ equity: | |||||||||||||||||||||||
Senior preferred stock (liquidation preference of $135,444 and $131,178, respectively) | 120,836 | 120,836 | |||||||||||||||||||||
Preferred stock, 700,000,000 shares are authorized—555,374,922 shares issued and outstanding | 19,130 | 19,130 | |||||||||||||||||||||
Common stock, no par value, no maximum authorization—1,308,762,703 shares issued and 1,158,087,567 shares outstanding | 687 | 687 | |||||||||||||||||||||
| Accumulated deficit | (116,909) | (118,776) | |||||||||||||||||||||
| Accumulated other comprehensive income | 133 | 131 | |||||||||||||||||||||
Treasury stock, at cost, 150,675,136 shares | (7,400) | (7,400) | |||||||||||||||||||||
Total stockholders’ equity (See Note 1: Senior Preferred Stock Purchase Agreement and Senior Preferred Stock for information on the related dividend obligation and liquidation preference) | 16,477 | 14,608 | |||||||||||||||||||||
| Total liabilities and equity | $ | 3,760,676 | $ | 3,503,319 | |||||||||||||||||||
See Notes to Condensed Consolidated Financial Statements in the Second Quarter 2020 Form 10-Q
| Second Quarter 2020 Results | 12 | |||||||
FANNIE MAE
(In conservatorship)
Condensed Consolidated Statements of Operations and Comprehensive Income — (Unaudited)
(Dollars in millions, except per share amounts)
| For the Three Months Ended June 30, | For the Six Months Ended June 30, | ||||||||||||||||||||||||||||||||||||||||||||||
| 2020 | 2019 | 2020 | 2019 | ||||||||||||||||||||||||||||||||||||||||||||
| Interest income: | |||||||||||||||||||||||||||||||||||||||||||||||
| Trading securities | $ | 219 | $ | 432 | $ | 535 | $ | 859 | |||||||||||||||||||||||||||||||||||||||
| Available-for-sale securities | 26 | 45 | 57 | 98 | |||||||||||||||||||||||||||||||||||||||||||
| Mortgage loans | 27,007 | 29,511 | 55,945 | 59,373 | |||||||||||||||||||||||||||||||||||||||||||
Federal funds sold and securities purchased under agreements to resell or similar arrangements | 14 | 257 | 121 | 520 | |||||||||||||||||||||||||||||||||||||||||||
| Other | 25 | 41 | 59 | 73 | |||||||||||||||||||||||||||||||||||||||||||
| Total interest income | 27,291 | 30,286 | 56,717 | 60,923 | |||||||||||||||||||||||||||||||||||||||||||
| Interest expense: | |||||||||||||||||||||||||||||||||||||||||||||||
Short-term debt | (54) | (119) | (156) | (244) | |||||||||||||||||||||||||||||||||||||||||||
| Long-term debt | (21,460) | (24,940) | (45,437) | (50,656) | |||||||||||||||||||||||||||||||||||||||||||
| Total interest expense | (21,514) | (25,059) | (45,593) | (50,900) | |||||||||||||||||||||||||||||||||||||||||||
| Net interest income | 5,777 | 5,227 | 11,124 | 10,023 | |||||||||||||||||||||||||||||||||||||||||||
| Benefit (provision) for credit losses | (12) | 1,225 | (2,595) | 1,875 | |||||||||||||||||||||||||||||||||||||||||||
| Net interest income after benefit (provision) for credit losses | 5,765 | 6,452 | 8,529 | 11,898 | |||||||||||||||||||||||||||||||||||||||||||
| Investment gains (losses), net | 149 | 461 | (9) | 594 | |||||||||||||||||||||||||||||||||||||||||||
| Fair value losses, net | (1,018) | (754) | (1,294) | (1,585) | |||||||||||||||||||||||||||||||||||||||||||
| Fee and other income | 90 | 113 | 210 | 247 | |||||||||||||||||||||||||||||||||||||||||||
| Non-interest loss | (779) | (180) | (1,093) | (744) | |||||||||||||||||||||||||||||||||||||||||||
| Administrative expenses: | |||||||||||||||||||||||||||||||||||||||||||||||
| Salaries and employee benefits | (382) | (376) | (775) | (762) | |||||||||||||||||||||||||||||||||||||||||||
| Professional services | (231) | (233) | (443) | (458) | |||||||||||||||||||||||||||||||||||||||||||
| Other administrative expenses | (141) | (135) | (285) | (268) | |||||||||||||||||||||||||||||||||||||||||||
| Total administrative expenses | (754) | (744) | (1,503) | (1,488) | |||||||||||||||||||||||||||||||||||||||||||
| Foreclosed property expense | (10) | (128) | (90) | (268) | |||||||||||||||||||||||||||||||||||||||||||
| Temporary Payroll Tax Cut Continuation Act of 2011 (“TCCA”) fees | (660) | (600) | (1,297) | (1,193) | |||||||||||||||||||||||||||||||||||||||||||
| Credit enhancement expense | (360) | (276) | (736) | (492) | |||||||||||||||||||||||||||||||||||||||||||
| Change in expected credit enhancement recoveries | 273 | — | 461 | — | |||||||||||||||||||||||||||||||||||||||||||
| Other expenses, net | (261) | (203) | (479) | (365) | |||||||||||||||||||||||||||||||||||||||||||
| Total expenses | (1,772) | (1,951) | (3,644) | (3,806) | |||||||||||||||||||||||||||||||||||||||||||
| Income before federal income taxes | 3,214 | 4,321 | 3,792 | 7,348 | |||||||||||||||||||||||||||||||||||||||||||
| Provision for federal income taxes | (669) | (889) | (786) | (1,516) | |||||||||||||||||||||||||||||||||||||||||||
| Net income | 2,545 | 3,432 | 3,006 | 5,832 | |||||||||||||||||||||||||||||||||||||||||||
| Other comprehensive income (loss): | |||||||||||||||||||||||||||||||||||||||||||||||
Changes in unrealized losses on available-for-sale securities, net of reclassification adjustments and taxes | (11) | (65) | 7 | (101) | |||||||||||||||||||||||||||||||||||||||||||
| Other, net of taxes | (2) | (2) | (5) | (5) | |||||||||||||||||||||||||||||||||||||||||||
| Total other comprehensive income (loss) | (13) | (67) | 2 | (106) | |||||||||||||||||||||||||||||||||||||||||||
| Total comprehensive income | $ | 2,532 | $ | 3,365 | $ | 3,008 | $ | 5,726 | |||||||||||||||||||||||||||||||||||||||
| Net income | $ | 2,545 | $ | 3,432 | $ | 3,006 | $ | 5,832 | |||||||||||||||||||||||||||||||||||||||
Dividends distributed or amounts attributable to senior preferred stock | (2,532) | (3,365) | (3,008) | (5,726) | |||||||||||||||||||||||||||||||||||||||||||
| Net income (loss) attributable to common stockholders | $ | 13 | $ | 67 | $ | (2) | $ | 106 | |||||||||||||||||||||||||||||||||||||||
| Earnings per share: | |||||||||||||||||||||||||||||||||||||||||||||||
| Basic | $ | 0.00 | $ | 0.01 | $ | 0.00 | $ | 0.02 | |||||||||||||||||||||||||||||||||||||||
| Diluted | 0.00 | 0.01 | 0.00 | 0.02 | |||||||||||||||||||||||||||||||||||||||||||
| Weighted-average common shares outstanding: | |||||||||||||||||||||||||||||||||||||||||||||||
| Basic | 5,867 | 5,762 | 5,867 | 5,762 | |||||||||||||||||||||||||||||||||||||||||||
| Diluted | 5,893 | 5,893 | 5,867 | 5,893 | |||||||||||||||||||||||||||||||||||||||||||
See Notes to Condensed Consolidated Financial Statements in the Second Quarter 2020 Form 10-Q
| Second Quarter 2020 Results | 13 | |||||||
FANNIE MAE
(In conservatorship)
Condensed Consolidated Statements of Cash Flows — (Unaudited)
(Dollars in millions)
| For the Six Months Ended June 30, | |||||||||||||||||||||||
| 2020 | 2019 | ||||||||||||||||||||||
| Net cash provided by (used in) operating activities | $ | (39,322) | $ | 2,180 | |||||||||||||||||||
| Cash flows provided by (used in) investing activities: | |||||||||||||||||||||||
| Proceeds from maturities and paydowns of trading securities held for investment | 23 | 28 | |||||||||||||||||||||
| Proceeds from sales of trading securities held for investment | — | 49 | |||||||||||||||||||||
| Proceeds from maturities and paydowns of available-for-sale securities | 189 | 268 | |||||||||||||||||||||
| Proceeds from sales of available-for-sale securities | 121 | 376 | |||||||||||||||||||||
| Purchases of loans held for investment | (293,666) | (90,612) | |||||||||||||||||||||
| Proceeds from repayments of loans acquired as held for investment of Fannie Mae | 4,634 | 5,557 | |||||||||||||||||||||
| Proceeds from sales of loans acquired as held for investment of Fannie Mae | 427 | 5,821 | |||||||||||||||||||||
Proceeds from repayments and sales of loans acquired as held for investment of consolidated trusts | 448,375 | 211,956 | |||||||||||||||||||||
| Advances to lenders | (123,805) | (54,440) | |||||||||||||||||||||
| Proceeds from disposition of acquired property and preforeclosure sales | 3,239 | 3,870 | |||||||||||||||||||||
Net change in federal funds sold and securities purchased under agreements to resell or similar arrangements | (11,872) | 13,376 | |||||||||||||||||||||
| Other, net | (937) | (743) | |||||||||||||||||||||
| Net cash provided by investing activities | 26,728 | 95,506 | |||||||||||||||||||||
| Cash flows provided by (used in) financing activities: | |||||||||||||||||||||||
| Proceeds from issuance of debt of Fannie Mae | 393,641 | 374,284 | |||||||||||||||||||||
| Payments to redeem debt of Fannie Mae | (299,933) | (389,779) | |||||||||||||||||||||
| Proceeds from issuance of debt of consolidated trusts | 401,749 | 158,970 | |||||||||||||||||||||
| Payments to redeem debt of consolidated trusts | (423,582) | (224,145) | |||||||||||||||||||||
| Payments of cash dividends on senior preferred stock to Treasury | — | (5,601) | |||||||||||||||||||||
| Other, net | (464) | 132 | |||||||||||||||||||||
| Net cash provided by (used in) financing activities | 71,411 | (86,139) | |||||||||||||||||||||
| Net increase in cash, cash equivalents and restricted cash | 58,817 | 11,547 | |||||||||||||||||||||
| Cash, cash equivalents and restricted cash at beginning of period | 61,407 | 49,423 | |||||||||||||||||||||
| Cash, cash equivalents and restricted cash at end of period | $ | 120,224 | $ | 60,970 | |||||||||||||||||||
| Cash paid during the period for: | |||||||||||||||||||||||
| Interest | $ | 57,733 | $ | 57,637 | |||||||||||||||||||
| Income taxes | — | 700 | |||||||||||||||||||||
See Notes to Condensed Consolidated Financial Statements in the Second Quarter 2020 Form 10-Q
| Second Quarter 2020 Results | 14 | |||||||
FANNIE MAE
(In conservatorship)
Condensed Consolidated Statements of Changes in Equity (Deficit) — (Unaudited)
(Dollars and shares in millions)
| Fannie Mae Stockholders’ Equity (Deficit) | ||||||||||||||||||||||||||||||||||||||||||||||||||||||||||||||
| Shares Outstanding | Senior Preferred Stock | Preferred Stock | Common Stock | Accumulated Deficit | Accumulated Other Comprehensive Income | Treasury Stock | Total Equity | |||||||||||||||||||||||||||||||||||||||||||||||||||||||
| Senior Preferred | Preferred | Common | ||||||||||||||||||||||||||||||||||||||||||||||||||||||||||||
| Balance as of March 31, 2020 | 1 | 556 | 1,158 | $ | 120,836 | $ | 19,130 | $ | 687 | $ | (119,454) | $ | 146 | $ | (7,400) | $ | 13,945 | |||||||||||||||||||||||||||||||||||||||||||||
| Senior preferred stock dividends paid | — | — | — | — | — | — | — | — | — | — | ||||||||||||||||||||||||||||||||||||||||||||||||||||
| Comprehensive income: | ||||||||||||||||||||||||||||||||||||||||||||||||||||||||||||||
| Net income | — | — | — | — | — | — | 2,545 | — | — | 2,545 | ||||||||||||||||||||||||||||||||||||||||||||||||||||
| Other comprehensive income, net of tax effect: | ||||||||||||||||||||||||||||||||||||||||||||||||||||||||||||||
Changes in net unrealized gains on available- for-sale securities (net of taxes of $3) | — | — | — | — | — | — | — | (11) | — | (11) | ||||||||||||||||||||||||||||||||||||||||||||||||||||
Reclassification adjustment for gains included in net income (net of taxes of $0) | — | — | — | — | — | — | — | — | — | — | ||||||||||||||||||||||||||||||||||||||||||||||||||||
Other (net of taxes of $0) | — | — | — | — | — | — | — | (2) | — | (2) | ||||||||||||||||||||||||||||||||||||||||||||||||||||
| Total comprehensive income | 2,532 | |||||||||||||||||||||||||||||||||||||||||||||||||||||||||||||
| Balance as of June 30, 2020 | 1 | 556 | 1,158 | $ | 120,836 | $ | 19,130 | $ | 687 | $ | (116,909) | $ | 133 | $ | (7,400) | $ | 16,477 | |||||||||||||||||||||||||||||||||||||||||||||
| Fannie Mae Stockholders’ Equity (Deficit) | ||||||||||||||||||||||||||||||||||||||||||||||||||||||||||||||
| Shares Outstanding | Senior Preferred Stock | Preferred Stock | Common Stock | Accumulated Deficit | Accumulated Other Comprehensive Income | Treasury Stock | Total Equity | |||||||||||||||||||||||||||||||||||||||||||||||||||||||
| Senior Preferred | Preferred | Common | ||||||||||||||||||||||||||||||||||||||||||||||||||||||||||||
| Balance as of December 31, 2019 | 1 | 556 | 1,158 | $ | 120,836 | $ | 19,130 | $ | 687 | $ | (118,776) | $ | 131 | $ | (7,400) | $ | 14,608 | |||||||||||||||||||||||||||||||||||||||||||||
| Transition impact, net of tax, from the adoption of the current expected credit loss standard | — | — | — | — | — | — | (1,139) | — | — | (1,139) | ||||||||||||||||||||||||||||||||||||||||||||||||||||
| Balance as of January 1, 2020, adjusted | 1 | 556 | 1,158 | 120,836 | 19,130 | 687 | (119,915) | 131 | (7,400) | 13,469 | ||||||||||||||||||||||||||||||||||||||||||||||||||||
| Senior preferred stock dividends paid | — | — | — | — | — | — | — | — | — | — | ||||||||||||||||||||||||||||||||||||||||||||||||||||
| Comprehensive income: | ||||||||||||||||||||||||||||||||||||||||||||||||||||||||||||||
| Net income | — | — | — | — | — | — | 3,006 | — | — | 3,006 | ||||||||||||||||||||||||||||||||||||||||||||||||||||
| Other comprehensive income, net of tax effect: | ||||||||||||||||||||||||||||||||||||||||||||||||||||||||||||||
Changes in net unrealized gains on available- for-sale securities (net of taxes of $1) | — | — | — | — | — | — | — | 4 | — | 4 | ||||||||||||||||||||||||||||||||||||||||||||||||||||
Reclassification adjustment for gains included in net income (net of taxes of $1) | — | — | — | — | — | — | — | 3 | — | 3 | ||||||||||||||||||||||||||||||||||||||||||||||||||||
Other (net of taxes of $1) | — | — | — | — | — | — | — | (5) | — | (5) | ||||||||||||||||||||||||||||||||||||||||||||||||||||
| Total comprehensive income | 3,008 | |||||||||||||||||||||||||||||||||||||||||||||||||||||||||||||
| Balance as of June 30, 2020 | 1 | 556 | 1,158 | $ | 120,836 | $ | 19,130 | $ | 687 | $ | (116,909) | $ | 133 | $ | (7,400) | $ | 16,477 | |||||||||||||||||||||||||||||||||||||||||||||
See Notes to Condensed Consolidated Financial Statements in the Second Quarter 2020 Form 10-Q
| Second Quarter 2020 Results | 15 | |||||||
FANNIE MAE
(In conservatorship)
Condensed Consolidated Statements of Changes in Equity (Deficit) — (Unaudited)
(Dollars and shares in millions)
| Fannie Mae Stockholders’ Equity (Deficit) | ||||||||||||||||||||||||||||||||||||||||||||||||||||||||||||||
| Shares Outstanding | Senior Preferred Stock | Preferred Stock | Common Stock | Accumulated Deficit | Accumulated Other Comprehensive Income | Treasury Stock | Total Equity | |||||||||||||||||||||||||||||||||||||||||||||||||||||||
| Senior Preferred | Preferred | Common | ||||||||||||||||||||||||||||||||||||||||||||||||||||||||||||
| Balance as of March 31, 2019 | 1 | 556 | 1,158 | $ | 120,836 | $ | 19,130 | $ | 687 | $ | (128,175) | $ | 283 | $ | (7,400) | $ | 5,361 | |||||||||||||||||||||||||||||||||||||||||||||
| Senior preferred stock dividends paid | — | — | — | — | — | — | (2,361) | — | — | (2,361) | ||||||||||||||||||||||||||||||||||||||||||||||||||||
| Comprehensive income: | ||||||||||||||||||||||||||||||||||||||||||||||||||||||||||||||
| Net income | — | — | — | — | — | — | 3,432 | — | — | 3,432 | ||||||||||||||||||||||||||||||||||||||||||||||||||||
| Other comprehensive income, net of tax effect: | ||||||||||||||||||||||||||||||||||||||||||||||||||||||||||||||
Changes in net unrealized gains on available- for-sale securities (net of taxes of $3) | — | — | — | — | — | — | — | 9 | — | 9 | ||||||||||||||||||||||||||||||||||||||||||||||||||||
Reclassification adjustment for gains included in net income (net of taxes of $19) | — | — | — | — | — | — | — | (74) | — | (74) | ||||||||||||||||||||||||||||||||||||||||||||||||||||
Other (net of taxes of $0) | — | — | — | — | — | — | — | (2) | — | (2) | ||||||||||||||||||||||||||||||||||||||||||||||||||||
| Total comprehensive income | 3,365 | |||||||||||||||||||||||||||||||||||||||||||||||||||||||||||||
| Balance as of June 30, 2019 | 1 | 556 | 1,158 | $ | 120,836 | $ | 19,130 | $ | 687 | $ | (127,104) | $ | 216 | $ | (7,400) | $ | 6,365 | |||||||||||||||||||||||||||||||||||||||||||||
| Fannie Mae Stockholders’ Equity (Deficit) | ||||||||||||||||||||||||||||||||||||||||||||||||||||||||||||||
| Shares Outstanding | Senior Preferred Stock | Preferred Stock | Common Stock | Accumulated Deficit | Accumulated Other Comprehensive Income | Treasury Stock | Total Equity | |||||||||||||||||||||||||||||||||||||||||||||||||||||||
| Senior Preferred | Preferred | Common | ||||||||||||||||||||||||||||||||||||||||||||||||||||||||||||
| Balance as of December 31, 2018 | 1 | 556 | 1,158 | $ | 120,836 | $ | 19,130 | $ | 687 | $ | (127,335) | $ | 322 | $ | (7,400) | $ | 6,240 | |||||||||||||||||||||||||||||||||||||||||||||
| Senior preferred stock dividends paid | — | — | — | — | — | — | (5,601) | — | — | (5,601) | ||||||||||||||||||||||||||||||||||||||||||||||||||||
| Comprehensive income: | ||||||||||||||||||||||||||||||||||||||||||||||||||||||||||||||
| Net income | — | — | — | — | — | — | 5,832 | — | — | 5,832 | ||||||||||||||||||||||||||||||||||||||||||||||||||||
| Other comprehensive income, net of tax effect: | ||||||||||||||||||||||||||||||||||||||||||||||||||||||||||||||
Changes in net unrealized gains on available- for-sale securities (net of taxes of $5) | — | — | — | — | — | — | — | 17 | — | 17 | ||||||||||||||||||||||||||||||||||||||||||||||||||||
Reclassification adjustment for gains included in net income (net of taxes of $31) | — | — | — | — | — | — | — | (118) | — | (118) | ||||||||||||||||||||||||||||||||||||||||||||||||||||
Other (net of taxes of $1) | — | — | — | — | — | — | — | (5) | — | (5) | ||||||||||||||||||||||||||||||||||||||||||||||||||||
| Total comprehensive income | 5,726 | |||||||||||||||||||||||||||||||||||||||||||||||||||||||||||||
| Balance as of June 30, 2019 | 1 | 556 | 1,158 | $ | 120,836 | $ | 19,130 | $ | 687 | $ | (127,104) | $ | 216 | $ | (7,400) | $ | 6,365 | |||||||||||||||||||||||||||||||||||||||||||||
See Notes to Condensed Consolidated Financial Statements in the Second Quarter 2020 Form 10-Q
| Second Quarter 2020 Results | 16 | |||||||