Attached files
| file | filename |
|---|---|
| EX-99.1 - PRESS RELEASE - Consolidated Communications Holdings, Inc. | exh_991.htm |
| 8-K - FORM 8-K - Consolidated Communications Holdings, Inc. | f8k_072920.htm |
Exhibit 99.2

Q2 2020 Earnings July 3 0, 2020

Safe Harbor The Securities and Exchange Commission (“SEC”) encourages companies to disclose forward - looking information so that investors ca n better understand a company’s future prospects and make informed investment decisions. Certain statements in this communication are forward - looki ng statements and are made pursuant to the safe harbor provisions of the Securities Litigation Reform Act of 1995. These forward - looking statemen ts reflect, among other things, our current expectations, plans, strategies, and anticipated financial results. There are a number of risks, uncertaint ies, and conditions that may cause our actual results to differ materially from those expressed or implied by these forward - looking statements. These risks and uncertainties include a number of factors related to our business, including the uncertainties relating to the impact of the novel coronavirus (COVID - 19 ) pandemic on the company’s business, results of operations, cash flows, stock price and employees; economic and financial market conditions ge ner ally and economic conditions in our service areas; various risks to the price and volatility of our common stock; changes in the valuation of pen sion plan assets; the substantial amount of debt and our ability to repay or refinance it or incur additional debt in the future; our need for a si gni ficant amount of cash to service and repay the debt restrictions contained in our debt agreements that limit the discretion of management in operating the busin ess; regulatory changes, including changes to subsidies, rapid development and introduction of new technologies and intense competition in the telecom mun ications industry; risks associated with our possible pursuit of acquisitions; system failures; cyber - attacks, information or security breaches or techno logy failure of ours or of a third party; losses of large customers or government contracts; risks associated with the rights - of - way for the network; disrupt ions in the relationship with third party vendors; losses of key management personnel and the inability to attract and retain highly qualified management a nd personnel in the future; changes in the extensive governmental legislation and regulations governing telecommunications providers and the provision of te lecommunications services; new or changing tax laws or regulations; telecommunications carriers disputing and/or avoiding their obligations to pa y network access charges for use of our network; high costs of regulatory compliance; the competitive impact of legislation and regulatory changes in the telecommunications industry; and liability and compliance costs regarding environmental regulations; and risks associated with discontinuing pay ing dividends on our common stock. A detailed discussion of these and other risks and uncertainties that could cause actual results and events to differ mat erially from such forward - looking statements are discussed in more detail in our filings with the SEC, including our reports on Form 10 - K and Form 10 - Q. Many of these circumstances are beyond our ability to control or predict. Moreover, forward - looking statements necessarily involve assumption s on our part. These forward - looking statements generally are identified by the words “believe,” “expect,” “anticipate,” “estimate,” “project,” “inte nd,” “plan,” “should,” “may,” “will,” “would,” “will be,” “will continue” or similar expressions. Such forward - looking statements involve known and unknown r isks, uncertainties and other factors that may cause actual results, performance or achievements of Consolidated Communications Holdings, Inc. and its subs idi aries to be different from those expressed or implied in the forward - looking statements. All forward - looking statements attributable to us or persons acting on our behalf are expressly qualified in their entirety by the cautionary statements that appear throughout this communication. Furthermore, forw ard - looking statements speak only as of the date they are made. Except as required under the federal securities laws or the rules and regulations of t he SEC, we disclaim any intention or obligation to update or revise publicly any forward - looking statements. You should not place undue reliance on for ward - looking statements.

Non - GAAP Measures This presentation includes certain non - GAAP historical and forward - looking financial measures, including but not limited to “ EBITDA,” “adjusted EBITDA,” “total net debt to last twelve month adjusted EBITDA ratio ,” and “ free cash flow.” In addition to providing key metrics for management to evaluate the Company’s performance, we believes these measurements assist investors in their understanding of operating performance and in identifying historical and prospective trends. A reconciliation of the differences between these non - GAAP financial measures and the most directly comparable financial measures presented in accordance with GAAP are available on the Company’s website at https:// ir.consolidated.com . Non - GAAP measures are not presented to be replacements or alternatives to the GAAP measures, and investors are urged to consider these non - GAAP measures i n addition to, and not in substitution for, measures prepared in accordance with GAAP. Consolidated may present or calculate i ts non - GAAP measures differently from other companies. Consolidated has filed a Form 8 - K reporting the quarterly results for the second quarter of 2020. The 8 - K must be read in conju nction with this presentation and contains additional important details on the quarterly results. .
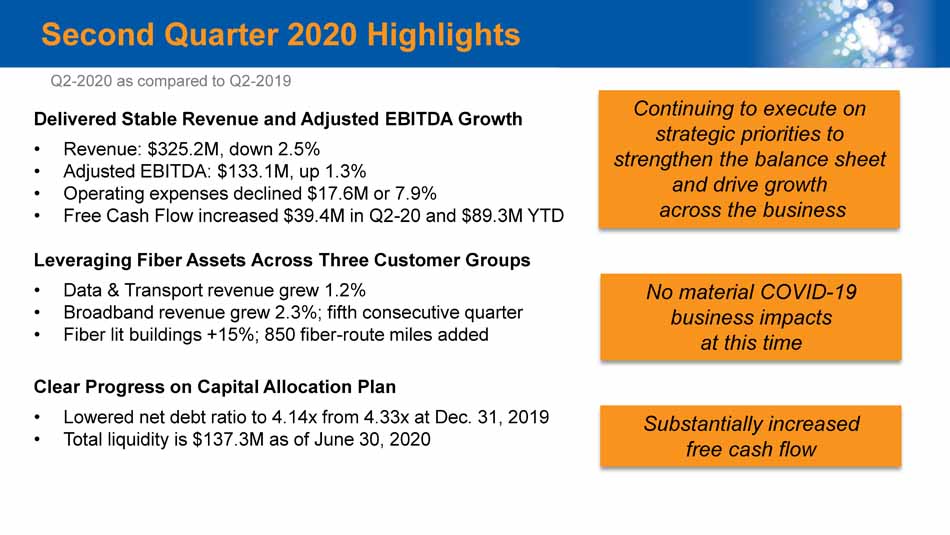
Second Quarter 2020 Highlights Delivered Stable Revenue and Adjusted EBITDA Growth • Revenue: $325.2M, down 2.5% • Adjusted EBITDA: $133.1M, up 1.3% • Operating expenses declined $17.6M or 7.9% • Free Cash Flow increased $39.4M in Q2 - 20 and $89.3M YTD Leveraging Fiber Assets Across Three Customer Groups • Data & Transport revenue grew 1.2% • Broadband revenue grew 2.3%; fifth consecutive quarter • Fiber lit buildings +15%; 850 fiber - route miles added Clear Progress on Capital Allocation Plan • Lowered net debt ratio to 4.14x from 4.33x at Dec. 31, 2019 • Total liquidity is $137.3M as of June 30, 2020 Q2 - 2020 as compared to Q2 - 2019 Continuing to execute on strategic priorities to strengthen the balance sheet and drive growth across the business No material COVID - 19 business impacts at this time Substantially increased free cash flow

Second Quarter 2020 Results • Improved revenue trends in Q2 driven by broadband and data/transport growth; higher voice retention • Adjusted EBITDA margins improved as a result of improved cost structure, technology and process improvements $ in millions • Cost management resulted in a 7.9% or $17.6M reduction in operating expenses • Wireless cash distributions totaled $9.6M in Q2 Q2 - 20 Y/Y YTD 2020 Y/Y Total Revenue $325.2 (2.5%) $650.8 (3.2%) Adjusted EBITDA $133.1 1.3% $264.7 1.1% Adjusted EBITDA margin 40.9% 1.3% 40.7% 1.7% Second Quarter Highlights

Commercial and Carrier Revenue Data and Transport Revenue $ in millions, Q2 - 2020 as compared to Q2 - 2019 • Data and Transport Revenue +1.2% • On - net buildings: 12,882, +15.4% • Tower wireless connections: 3,900, +2.9% • Other revenue decreased $3M primarily due to lower equipment sales • Launched Enterprise@Home solution • Launched Cisco Webex Contact Center • Expanded ProConnect UC to Northern New England • Launched CCiTV for small businesses • Managing high volume wireless site capacity upgrades Q2 - 20 Results Commercial and Carrier Highlights Commercial and Carrier Revenue Q2 - 20 Y/Y YTD 2020 Y/Y $145.8 (2.2%) $292.8 (2.6%) Q2 - 20 Y/Y YTD 2020 Y/Y $89.6 1.2% $179.1 1.4%

$70.17 $73.32 $70.86 $74.91 Q1-19 Q1-20 Q2-19 Q2-20 Consumer Revenue • Consumer broadband revenue +2.3% • Consumer ARPU +5.7% • Voice revenue decline improved from 12.4% in Q2 - 19 to 4.7% in Q2 - 20 • CCiTV driving broadband speed upgrades and net adds • Lead with broadband; upgrade to faster speeds • Increase consumer ARPU; reduce churn • Leverage public - private partnerships to expand broadband services economically • CCiTV expansion to new markets in 2020; launched service in Texas in Q2 Broadband Revenue Q2 - 20 Results Consumer Strategy and Highlights Consumer ARPU $ in millions, Q2 - 2020 as compared to Q2 - 2019 +5.7% + 4.5% Q2 - 20 Y/Y YTD 2020 Y/Y $65.6 2.3% $129.6 2.0% Q1 - 19 Q1 - 20 Q2 - 19 Q2 - 20
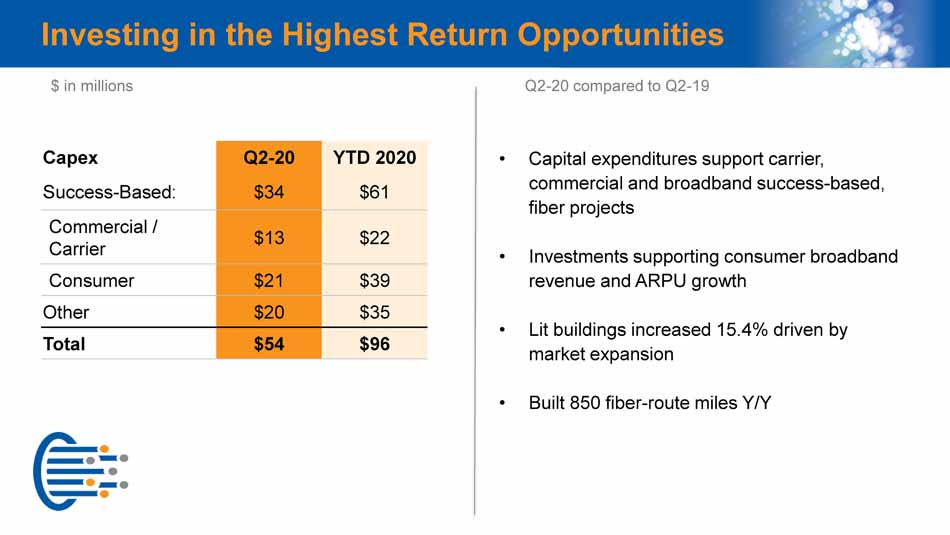
Investing in the Highest Return Opportunities • Capital expenditures support carrier, commercial and broadband success - based, fiber projects • Investments supporting consumer broadband revenue and ARPU growth • Lit buildings increased 15.4% driven by market expansion • Built 850 fiber - route miles Y/Y Capex Q2 - 20 YTD 2020 Success - Based: $34 $61 Commercial / Carrier $13 $22 Consumer $21 $39 Other $20 $35 Total $54 $96 $ in millions Q2 - 20 compared to Q2 - 19

Consolidated’s Fiber - Rich Network 45,850 Fiber - route miles 2M+ Fiber - strand miles 12,900 On - net locations 550 F iber hub s/COs 3,900 F iber connections to wireless providers 13 Data centers 23 Operating states Data Centers Operating States Fiber Networks Leased Fiber

Core Regional Fiber Networks

Consolidated Strategic Imperatives Execute on Disciplined Capital Allocation Plan • Pay down debt to achieve net debt to Adjusted EBITDA target of <4x by the end of 2020 • Target substantially all free cash flow to delever and strengthen the balance sheet Leverage Fiber Assets Across Three Diverse Customer Groups • Top 10 fiber provider in the U.S.; 23 states; 45,850 fiber route miles • Consumer, Commercial and Carrier growth opportunities • Competitive offerings with next - generation products and services Stabilize EBITDA; Grow Free Cash Flow • Generate stable earnings and cash flow; disciplined investments with the highest return • Strong cash flow generated from wireless partnerships: ~$36M in 2019, $19.7M in 1H20 Strategic Asset Portfolio Review • Continue to evaluate assets for investment or monetization • Ensure all assets have a long - term, strategic fit

Free Cash Flow (1) Includes acquisition and non - recurring related costs, and certain miscellaneous items. (2) 2019 Free Cash Flow excludes $27.9 million in dividend payments in Q2 - 19 and $55.4 million in 1H 2019 made prior to the change in capital allocation policy announced in April 2019. Improved Cash Flow; Stronger Balance Sheet $ in millions Q2 - 20 Q2 - 19 1H 2020 1H 2019 Adjusted EBITDA $133.1 $131.4 $264.7 $261.7 Interest Payments ($37.2) ($41.6) ($61.5) ($66.0) Pension and OPEB Payments ($6.8) ($8.2) ($14.8) ($15.8) Restructuring, Severance and Other (1) $0.6 ($7.2) $0.1 ($12.5) Income Tax Payments, net of refunds ($0.2) ($0.4) ($0.2) ($0.5) Working Capital and Other $7.2 $14.3 ($6.6) ($3.6) Cash provided by Operating Activities $96.7 $88.3 $181.7 $163.3 Capital expenditures ($53.8) ($66.4) ($96.2) ($119.7) Proceeds from sale of assets $3.9 $13.3 $6.1 $14.2 Free Cash Flow (2) $46.8 $35.2 $91.6 $57.8

Q&A Q2 2020 Earnings