Attached files
| file | filename |
|---|---|
| EX-99.1 - EX-99.1 - CTO Realty Growth, Inc. | cto-20200729xex99d1.htm |
| 8-K - 8-K - CTO Realty Growth, Inc. | cto-20200729x8k.htm |
Exhibit 99.2
| PRESENTATION JULY 2020 NYSE Amencan: CTO Q2 2020 INVESTOR |
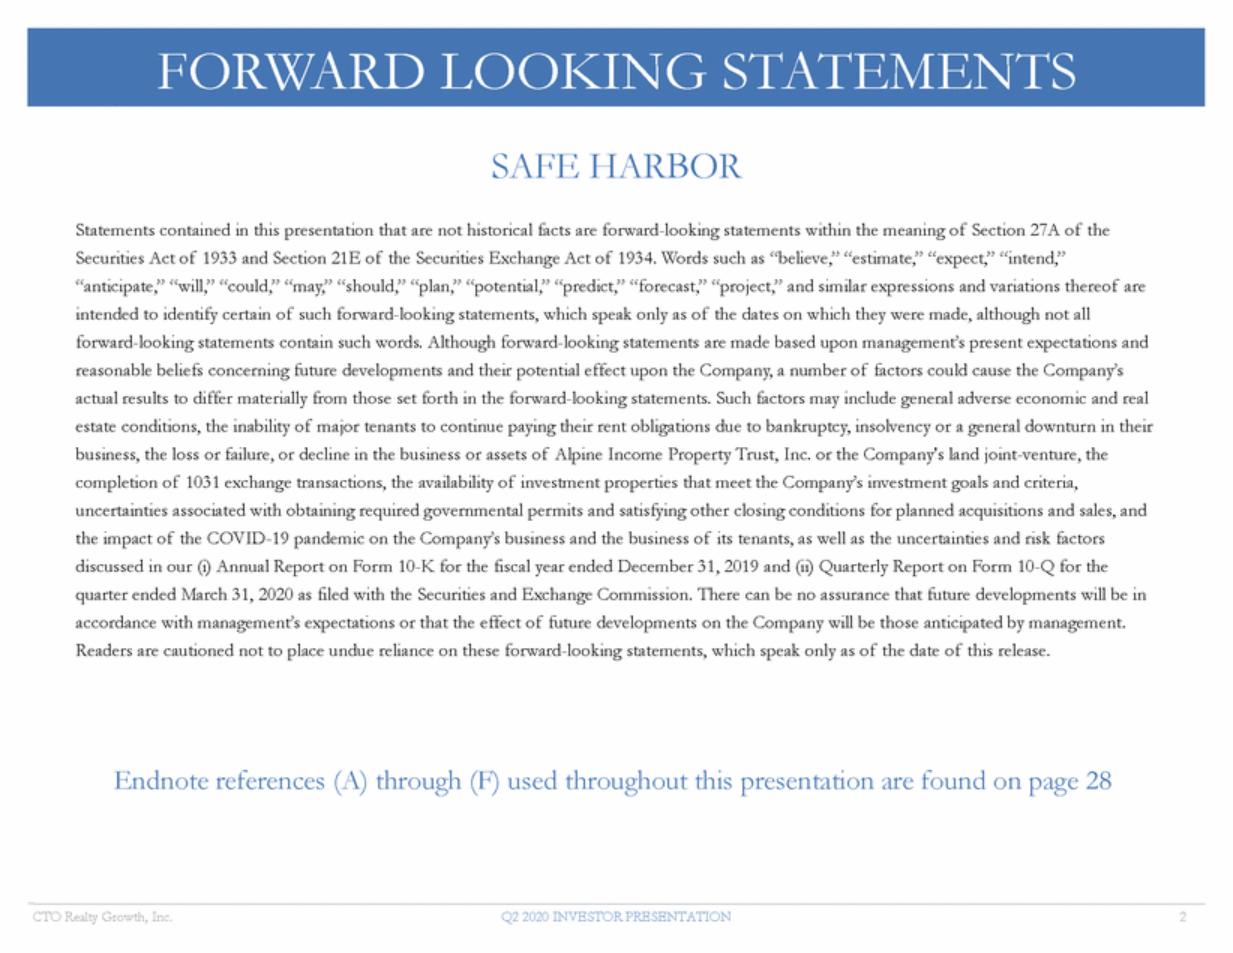
| SAFE HARBOR Statements contained in this presentation that are not historical facts are forward-looking statements within the meaning of Section 27A of the Securities Act of 1933 and Section 21E of the Securities Exchange Act of 1934. Words such as “believe,” “estimate,” “expect,” “intend,” “anticipate,” “will,” “could,” “may,” “should,” “plan,” “potential,” “predict,” “forecast,” “project,” and similar expressions and variations thereof are intended to identify certain of such forward-looking statements, which speak only as of the dates on which they were made, although not all forward-looking statements contain such words. Although forward-looking statements are made based upon management’s present expectations and reasonable beliefs concerning future developments and their potential effect upon the Company, a number of factors could cause the Company’s actual results to differ materially from those set forth in the forward-looking statements. Such factors may include general adverse economic and real estate conditions, the inability of major tenants to continue paying their rent obligations due to bankruptcy, insolvency or a general downturn in their business, the loss or failure, or decline in the business or assets of Alpine Income Property Trust, Inc. or the Company's land joint-venture, the completion of 1031 exchange transactions, the availability of investment properties that meet the Company’s investment goals and criteria, uncertainties associated with obtaining required governmental permits and satisfying other closing conditions for planned acquisitions and sales, and the impact of the COVID-19 pandemic on the Company’s business and the business of its tenants, as well as the uncertainties and risk factors discussed in our (i) Annual Report on Form 10-K for the fiscal year ended December 31, 2019 and (ii) Quarterly Report on Form 10-Q for the quarter ended March 31, 2020 as filed with the Securities and Exchange Commission. There can be no assurance that future developments will be in accordance with management’s expectations or that the effect of future developments on the Company will be those anticipated by management. Readers are cautioned not to place undue reliance on these forward-looking statements, which speak only as of the date of this release. Endnote references (A) through (F) used throughout this presentation are found on page 28 CTO Realty Growth, Inc. Q2 2020 INVESTOR PRESENTATION 2 FORWARD LOOKING STATEMENTS |
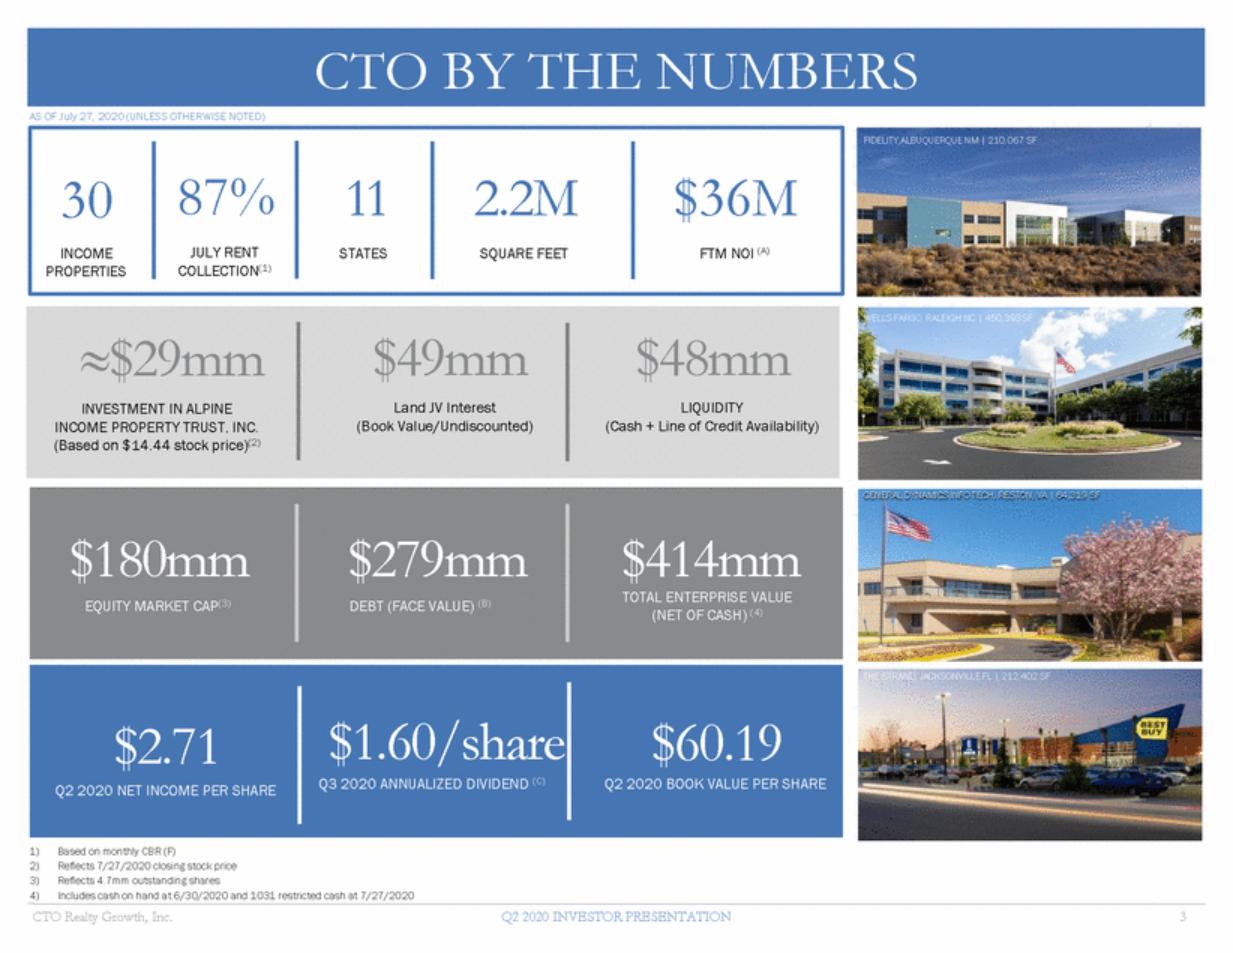
| AS OF July 27, 2020 (UNLESS OTHERWISE NOTED) FIDELITY,ALBUQUERQUE NM | 210,067 SF WELLS FARGO, RALEIGH NC | 450,393 SF GENERAL DYNAMICS INFO TECH, RESTON, VA | 64,319 SF (NET OF CASH) (4) THE STRAND, JACKSONVILLE FL | 212,402 SF Q3 2020 ANNUALIZED DIVIDEND (C) Q2 2020 BOOK VALUE PER SHARE Q2 2020 NET INCOME PER SHARE 1) 2) 3) 4) Based on monthly CBR (F) Reflects 7/27/2020 closing stock price Reflects 4.7mm outstanding shares Includes cash on hand at 6/30/2020 and 1031 restricted cash at 7/27/2020 CTO Realty Growth, Inc. Q2 2020 INVESTOR PRESENTATION 3 $2.71$1.60/share$60.19 $180mm$279mm$414mm EQUITY MARKET CAP(3) DEBT (FACE VALUE) (B)TOTAL ENTERPRISE VALUE ≈$29mm$49mm$48mm INVESTMENT IN ALPINE Land JV Interest LIQUIDITY INCOME PROPERTY TRUST, INC. (Book Value/Undiscounted) (Cash + Line of Credit Availability) (Based on $14.44 stock price)(2) 3087%112.2M$36M INCOME JULY RENT STATES SQUARE FEET FTM NOI (A) PROPERTIES COLLECTION(1) CTO BY THE NUMBERS |
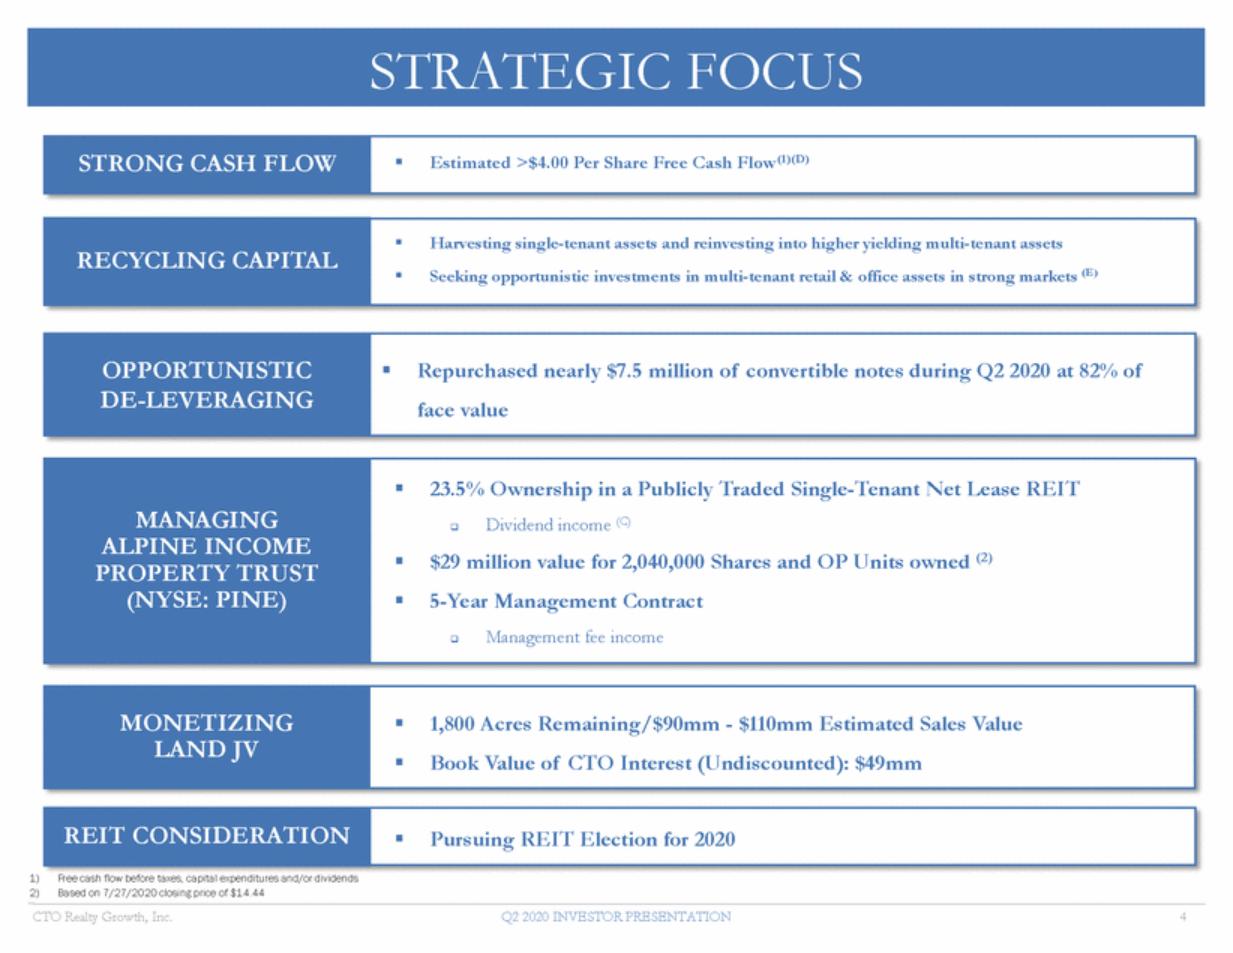
| 1)Free cash flow before taxes, capital expenditures and/or dividends 2)Based on 7/27/2020 closing price of $14.44 CTO Realty Growth, Inc. Q2 2020 INVESTOR PRESENTATION 4 REIT CONSIDERATION Pursuing REIT Election for 2020 MONETIZING LAND JV 1,800 Acres Remaining/$90mm - $110mm Estimated Sales Value Book Value of CTO Interest (Undiscounted): $49mm MANAGING ALPINE INCOME PROPERTY TRUST (NYSE: PINE) 23.5% Ownership in a Publicly Traded Single-Tenant Net Lease REIT Dividend income (C) $29 million value for 2,040,000 Shares and OP Units owned (2) 5-Year Management Contract Management fee income OPPORTUNISTIC DE-LEVERAGING Repurchased nearly $7.5 million of convertible notes during Q2 2020 at 82% of face value RECYCLING CAPITAL Harvesting single-tenant assets and reinvesting into higher yielding multi-tenant assets Seeking opportunistic investments in multi-tenant retail & office assets in strong markets (E) STRONG CASH FLOW Estimated >$4.00 Per Share Free Cash Flow(1)(D) STRATEGIC FOCUS |
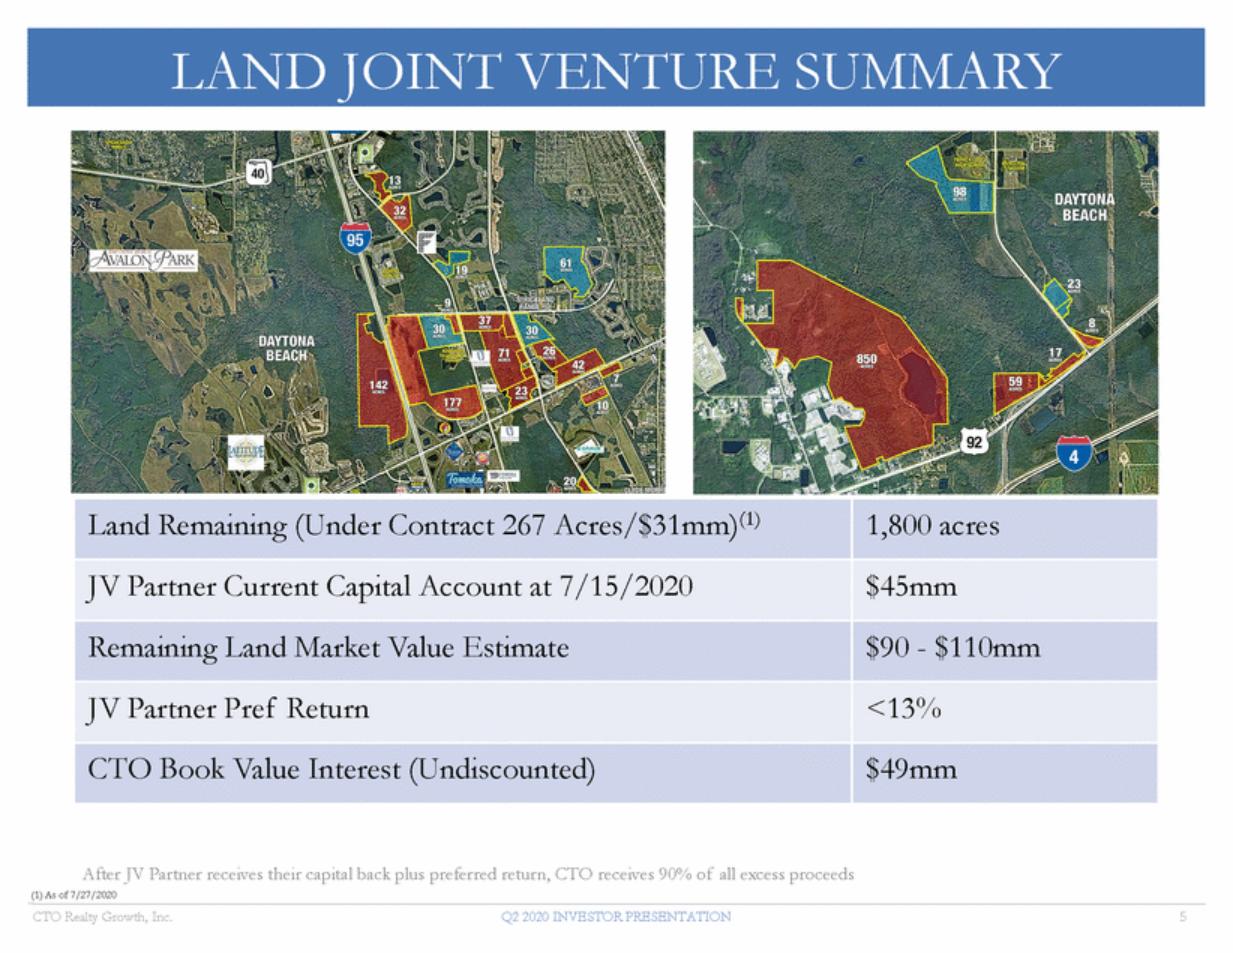
| After JV Partner receives their capital back plus preferred return, CTO receives 90% of all excess proceeds (1) As of 7/27/2020 CTO Realty Growth, Inc. Q2 2020 INVESTOR PRESENTATION 5 Land Remaining (Under Contract 267 Acres/$31mm)(1) 1,800 acres JV Partner Current Capital Account at 7/15/2020 $45mm Remaining Land Market Value Estimate $90 - $110mm JV Partner Pref Return <13% CTO Book Value Interest (Undiscounted) $49mm LAND JOINT VENTURE SUMMARY |
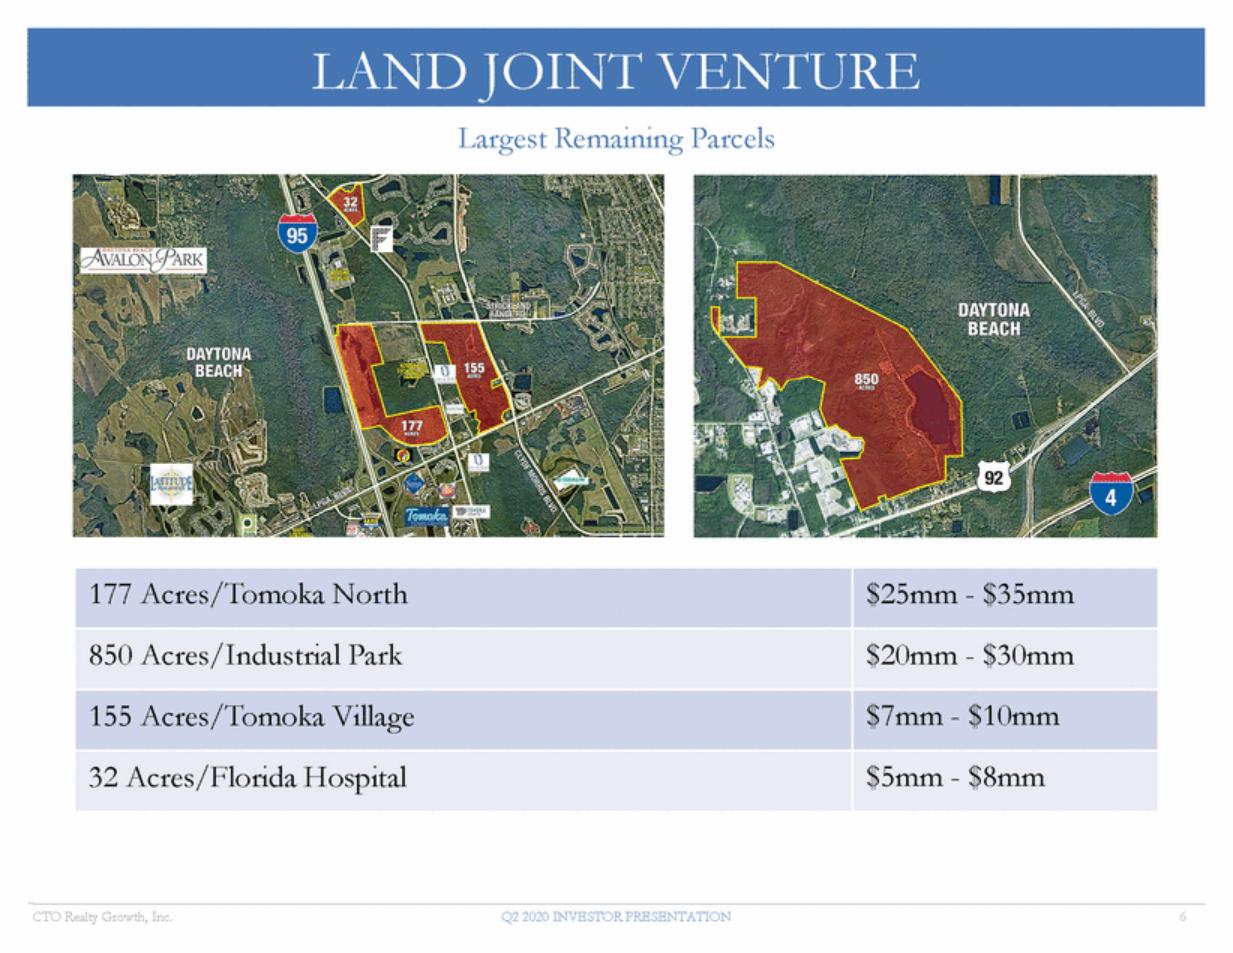
| Largest Remaining Parcels CTO Realty Growth, Inc. Q2 2020 INVESTOR PRESENTATION 6 177 Acres/Tomoka North $25mm - $35mm 850 Acres/Industrial Park $20mm - $30mm 155 Acres/Tomoka Village $7mm - $10mm 32 Acres/Florida Hospital $5mm - $8mm LAND JOINT VENTURE |
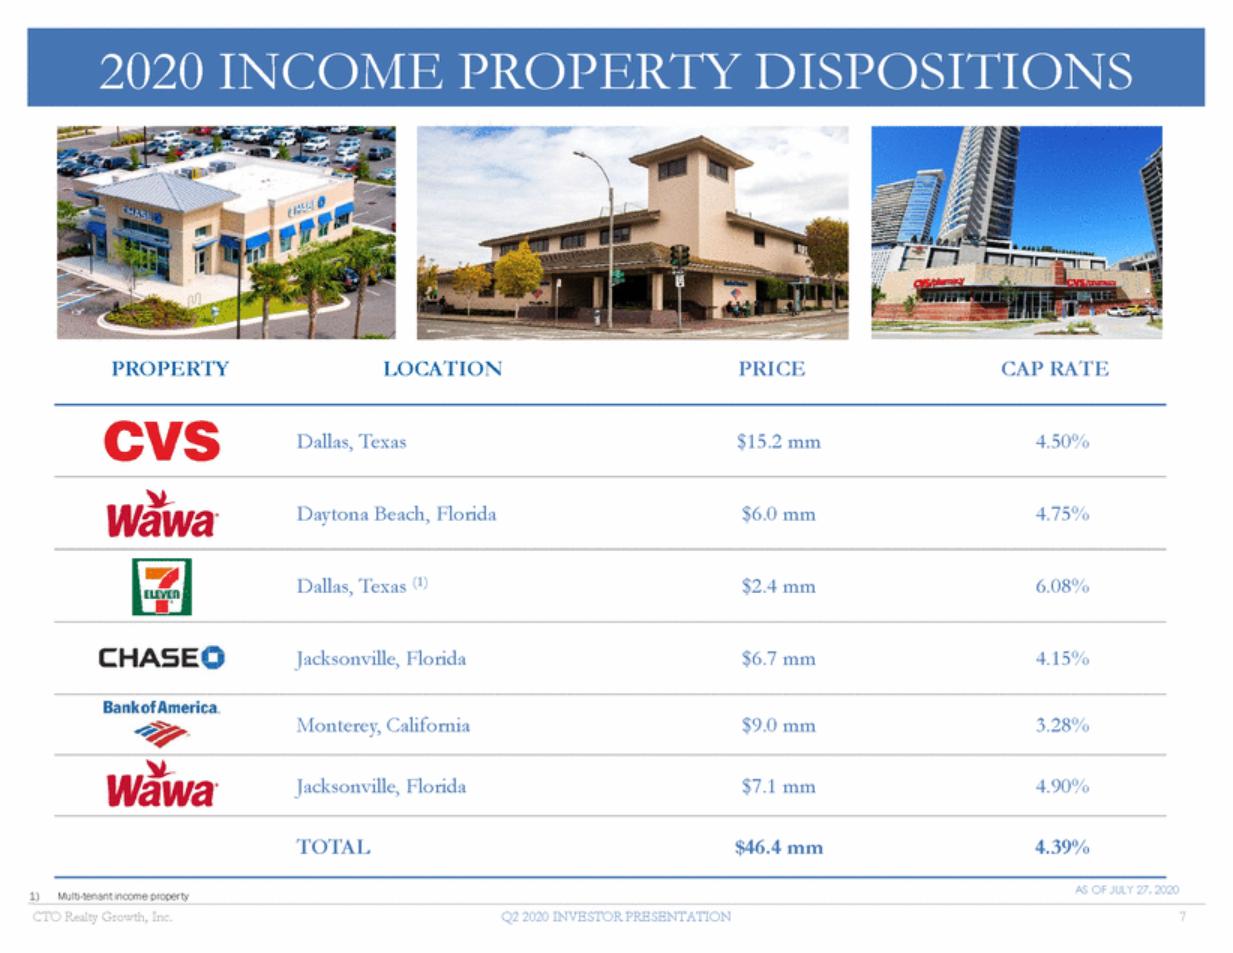
| PROPERTY LOCATION PRICE CAP RATE Dallas, Texas $15.2 mm 4.50% Daytona Beach, Florida $6.0 mm 4.75% Dallas, Texas (1) $2.4 mm 6.08% Jacksonville, Florida $6.7 mm 4.15% Monterey, California $9.0 mm 3.28% Jacksonville, Florida $7.1 mm 4.90% TOTAL $46.4 mm 4.39% AS OF JULY 27, 2020 1)Multi-tenant income property CTO Realty Growth, Inc. Q2 2020 INVESTOR PRESENTATION 7 2020 INCOME PROPERTY DISPOSITIONS |
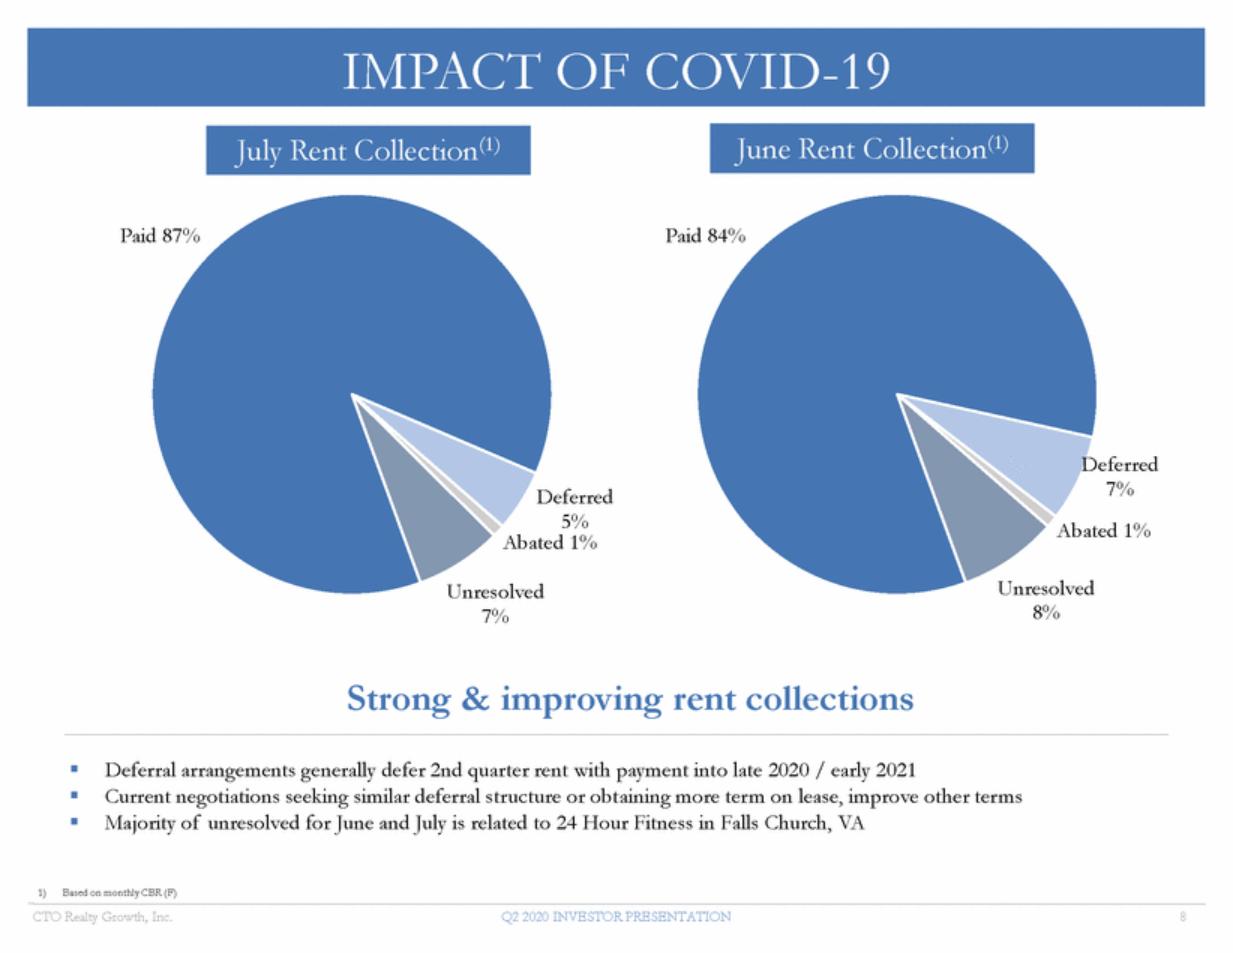
| Paid 87% Paid 84% Deferred 7% Abated 1% Deferred 5% Abate d 1% Unresolved 8% Unresolved 7% Strong & improving rent collections Deferral arrangements generally defer 2nd quarter rent with payment into late 2020 / early 2021 Current negotiations seeking similar deferral structure or obtaining more term on lease, improve other terms Majority of unresolved for June and July is related to 24 Hour Fitness in Falls Church, VA 1)Based on monthly CBR (F) CTO Realty Growth, Inc. Q2 2020 INVESTOR PRESENTATION 8 June Rent Collection(1) July Rent Collection(1) IMPACT OF COVID-19 |
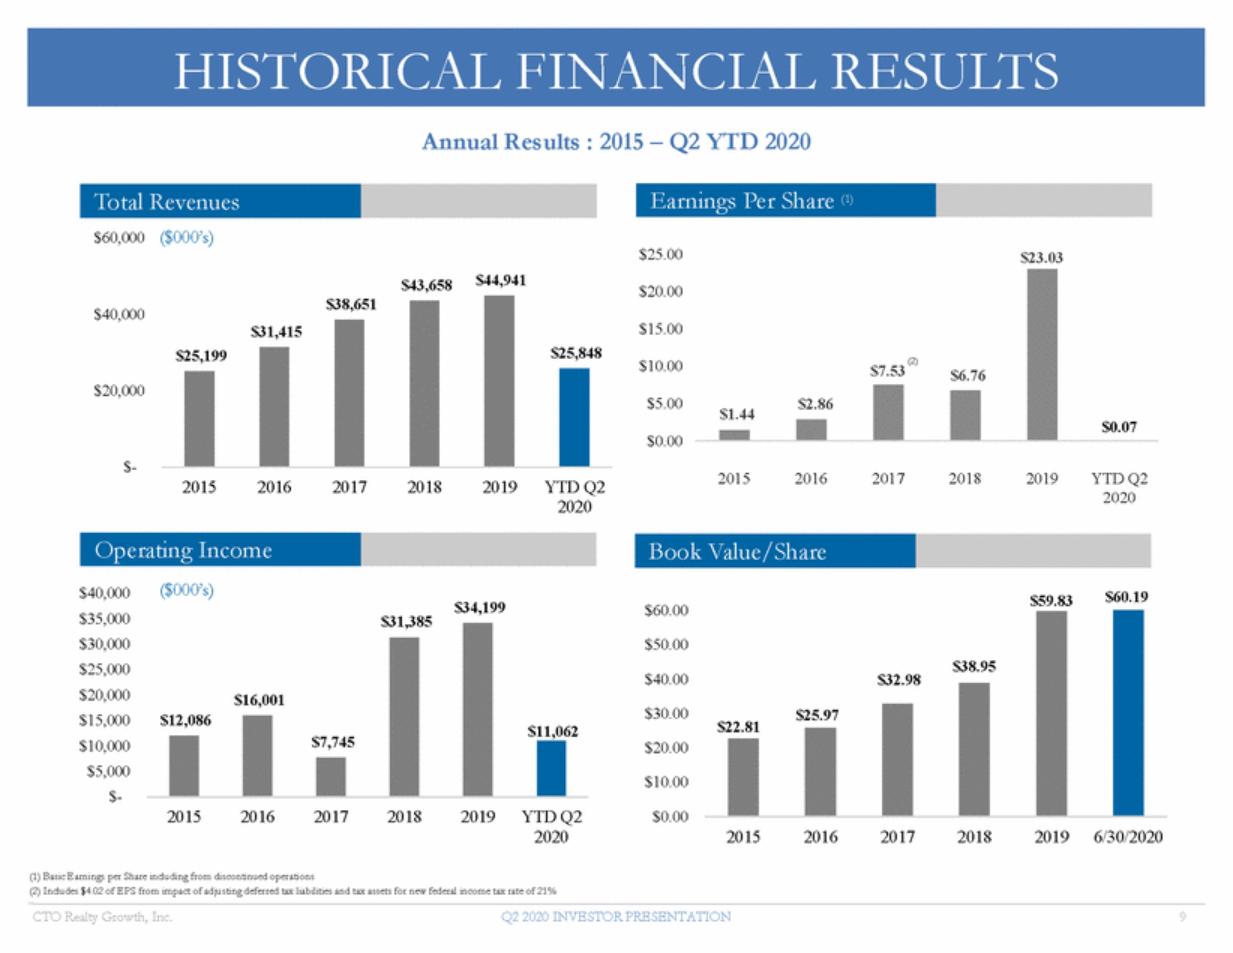
| Annual Results : 2015 – Q2 YTD 2020 ($000’s) $60,000 $25.00 $23.03 $44,941 $43,658 $20.00 $40,000 $15.00 (2) $10.00 $7.53 $6.76 $20,000 $5.00 $2.86 $1.44 $0.07 $0.00 $-2015 2016 2017 2018 2019 YTD Q2 2020 2015 2016 2017 2018 2019 YTD Q2 2020 ($000’s) $40,000 $35,000 $30,000 $25,000 $20,000 $15,000 $10,000 $5,000 $-$60.19 $59.83 $34,199 $60.00 $31,385 $50.00 $40.00 $30.00 $22.81 $20.00 $10.00 2015 2016 2017 2018 2019 YTD Q2 2020 $0.00 2015 2016 2017 2018 2019 6/30/2020 (1) Basic Earnings per Share including from discontinued operations (2) Includes $4.02 of EPS from impact of adjusting deferred tax liabilities and tax assets for new federal income tax rate of 21% CTO Realty Growth, Inc. Q2 2020 INVESTOR PRESENTATION 9 $11,062 $16,001 $12,086 $7,745 $32.98$38.95 $25.97 Book Value/Share Operating Income $25,848 $38,651 $31,415 $25,199 Earnings Per Share (1) Total Revenues HISTORICAL FINANCIAL RESULTS |
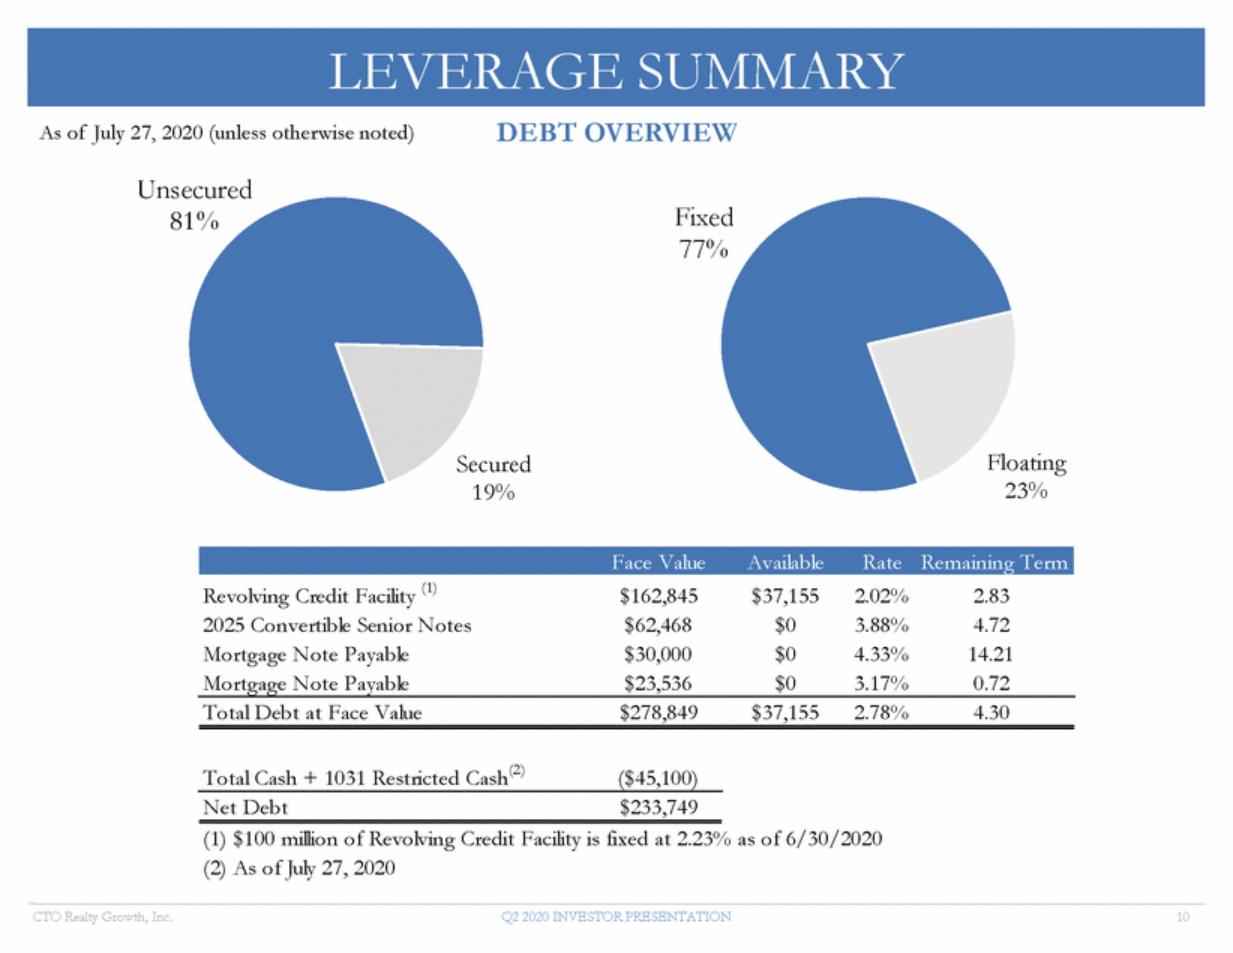
| DEBT OVERVIEW As of July 27, 2020 (unless otherwise noted) Unsecured 81% Fixed 77% Floating 23% Secured 19% Revolving Credit Facility (1) 2025 Convertible Senior Notes Mortgage Note Payable Mortgage Note Payable $162,845 $62,468 $30,000 $23,536 $37,155 $0 $0 $0 2.02% 3.88% 4.33% 3.17% 2.83 4.72 14.21 0.72 Total Debt at Face Value $278,849 $37,155 2.78% 4.30 Total Cash + 1031 Restricted Cash(2) ($45,100) Net Debt $233,749 (1) $100 million of Revolving Credit Facility is fixed at 2.23% as of 6/30/2020 (2) As of July 27, 2020 CTO Realty Growth, Inc. Q2 2020 INVESTOR PRESENTATION 10 Face Value Available Rate Remaining Term LEVERAGE SUMMARY |
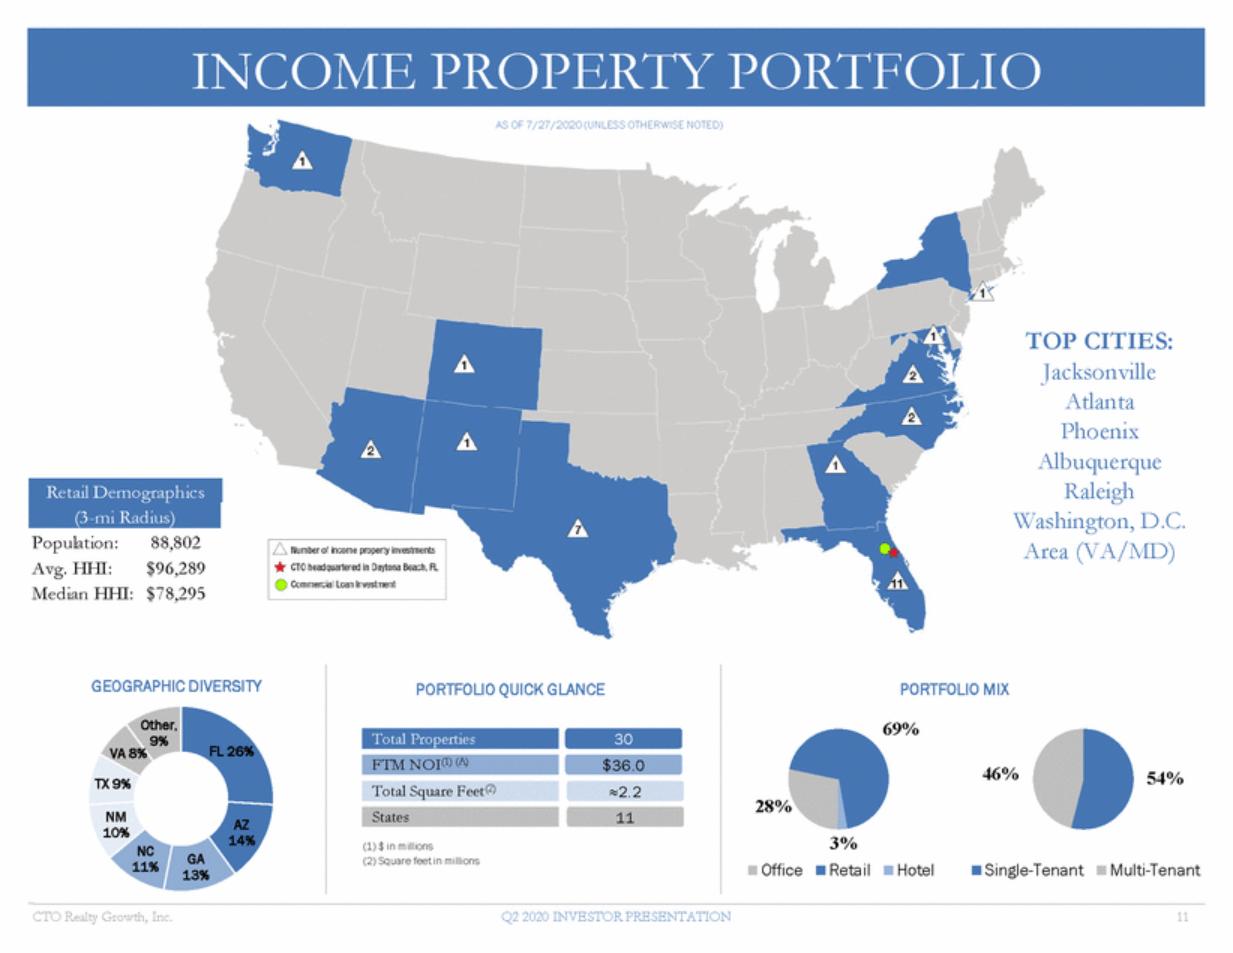
| AS OF 7/27/2020 (UNLESS OTHERWISE NOTED) TOP CITIES: Jacksonville Atlanta Phoenix Albuquerque Raleigh Washington, D.C. Area (VA/MD) Population: Avg. HHI: Median HHI: 88,802 $96,289 $78,295 GEOGRAPHIC DIVERSITY PORTFOLIO QUICK GLANCE PORTFOLIO MIX Other, 69% 30 $36.0 ≈2.2 11 9% FL 26% VA 8% 46% 54% TX 9% 28% NM 10% AZ 14% 3% Retail (1) $ in millions (2) Square feet in millions NC 11% GA 13% Office Hotel Single-Tenant Multi-Tenant CTO Realty Growth, Inc. Q2 2020 INVESTOR PRESENTATION 11 States Total Square Feet(2) FTM NOI(1) (A) Total Properties Retail Demographics (3-mi Radius) INCOME PROPERTY PORTFOLIO |
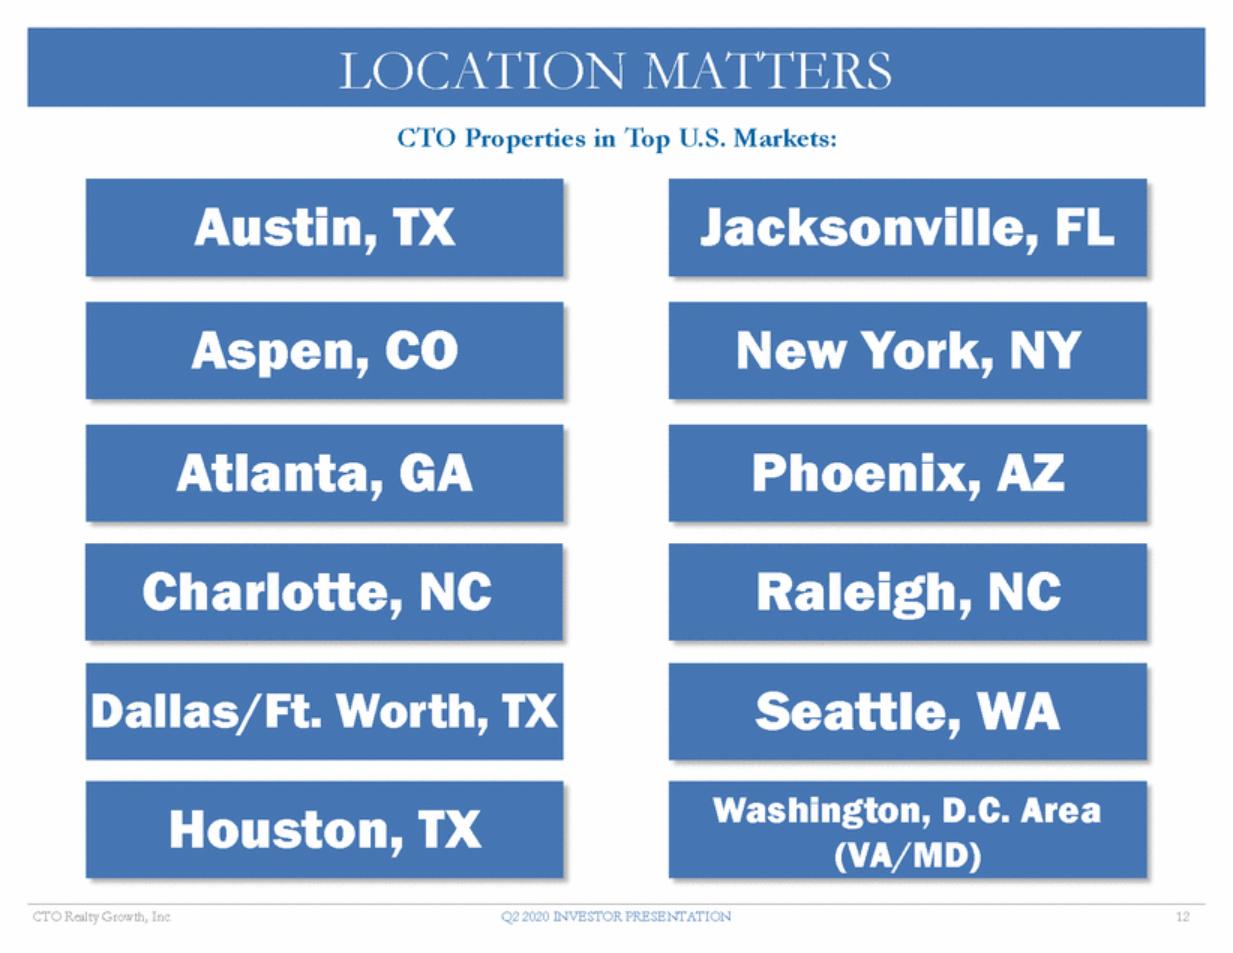
| CTO Properties in Top U.S. Markets: CTO Realty Growth, Inc. Q2 2020 INVESTOR PRESENTATION 12 Houston, TX Washington, D.C. Area (VA/MD) Dallas/Ft. Worth, TX Seattle, WA Charlotte, NC Raleigh, NC Phoenix, AZ Atlanta, GA New York, NY Aspen, CO Jacksonville, FL Austin, TX LOCATION MATTERS |
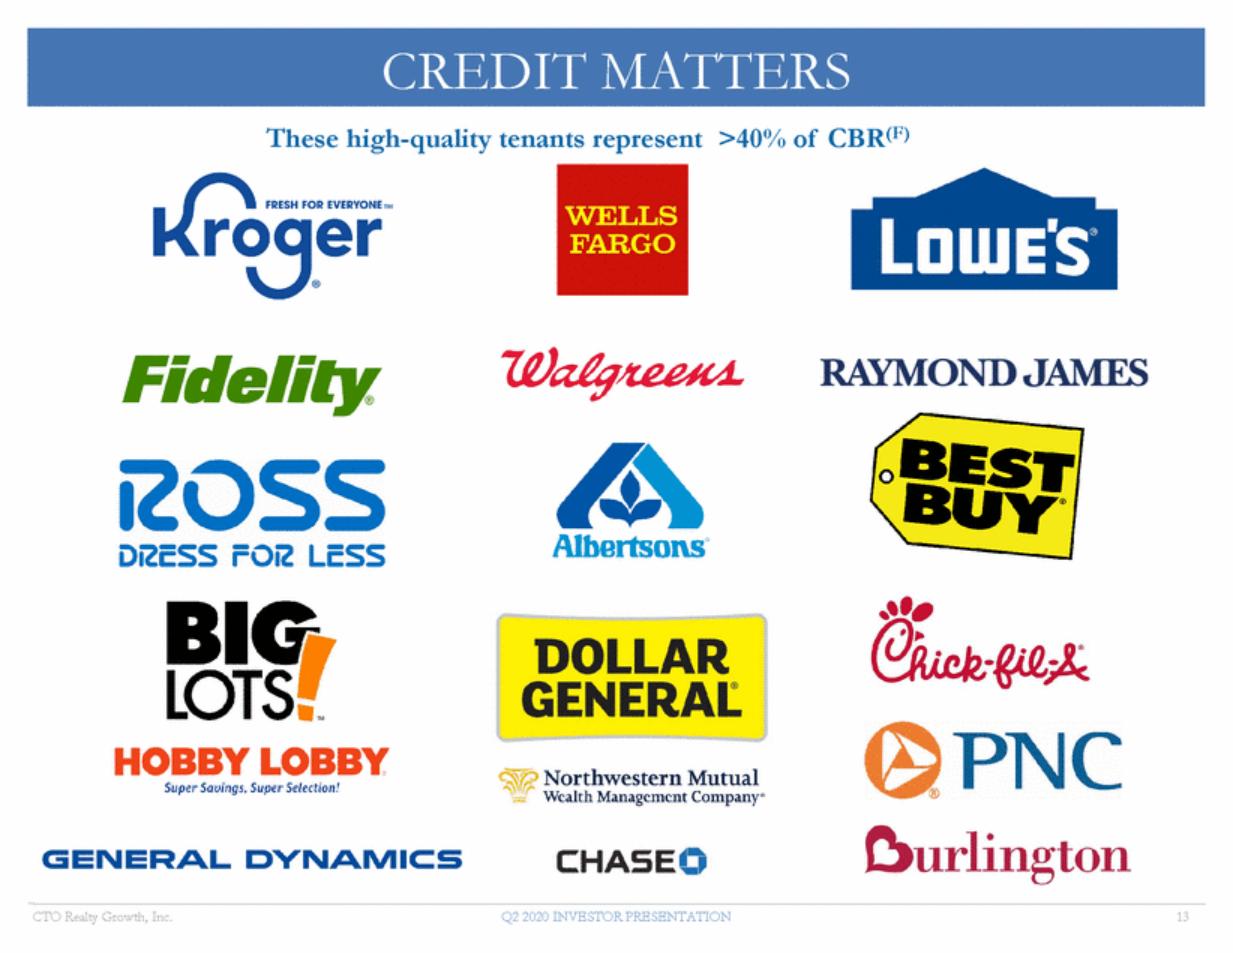
| MATTERS These high-quality tenants represent >40°/o of CBR(F) w Fidelil}! RAYMOND JAMES A)t, Albertsons0 iZOSS Di2ESS FOi2 LESS ..... BICft - A LOTS•. HOBBY LOBBY Super Sauings ,Super Selection! PNC Clurlington p Northwestern Mutual -\I Wealth Management Company GENERAL DYNAMICS C:HASEO CTO Realty Growth, Inc. Q2 2020 INVESTOR PRESENTATION 13 DOLLAR GENERA[ CREDIT |
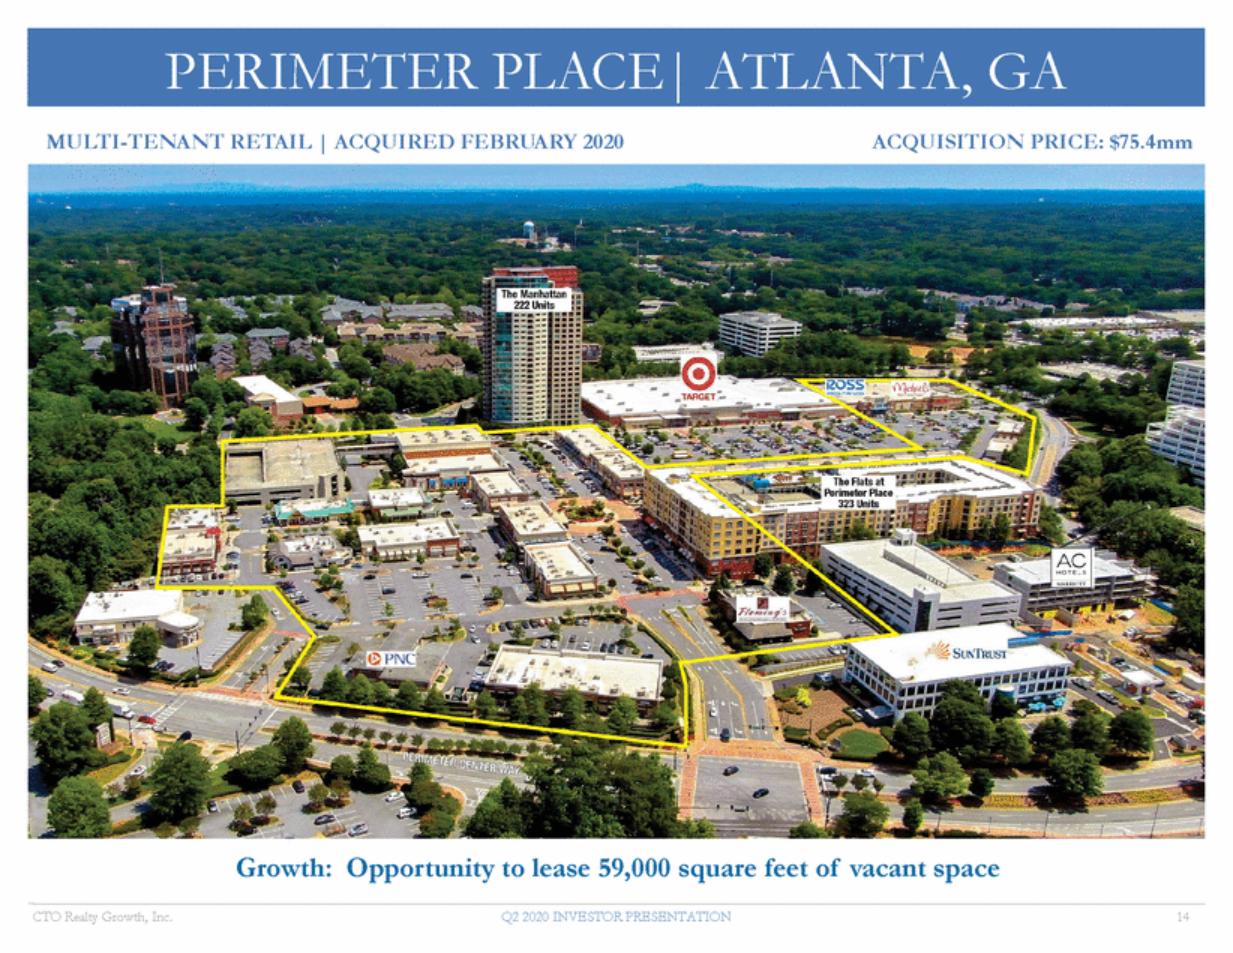
| MULTI-TENANT RETAIL | ACQUIRED FEBRUARY 2020 ACQUISITION PRICE: $75.4mm Growth: Opportunity to lease 59,000 square feet of vacant space CTO Realty Growth, Inc. Q2 2020 INVESTOR PRESENTATION 14 PERIMETER PLACE| ATLANTA, GA |
| Opportunity to Build a Stronger Brand CTO Realty Growth, Inc. Q2 2020 INVESTOR PRESENTATION 15 Rebranding Perimeter Place to Ashford Lane PERIMETER REBRANDING |

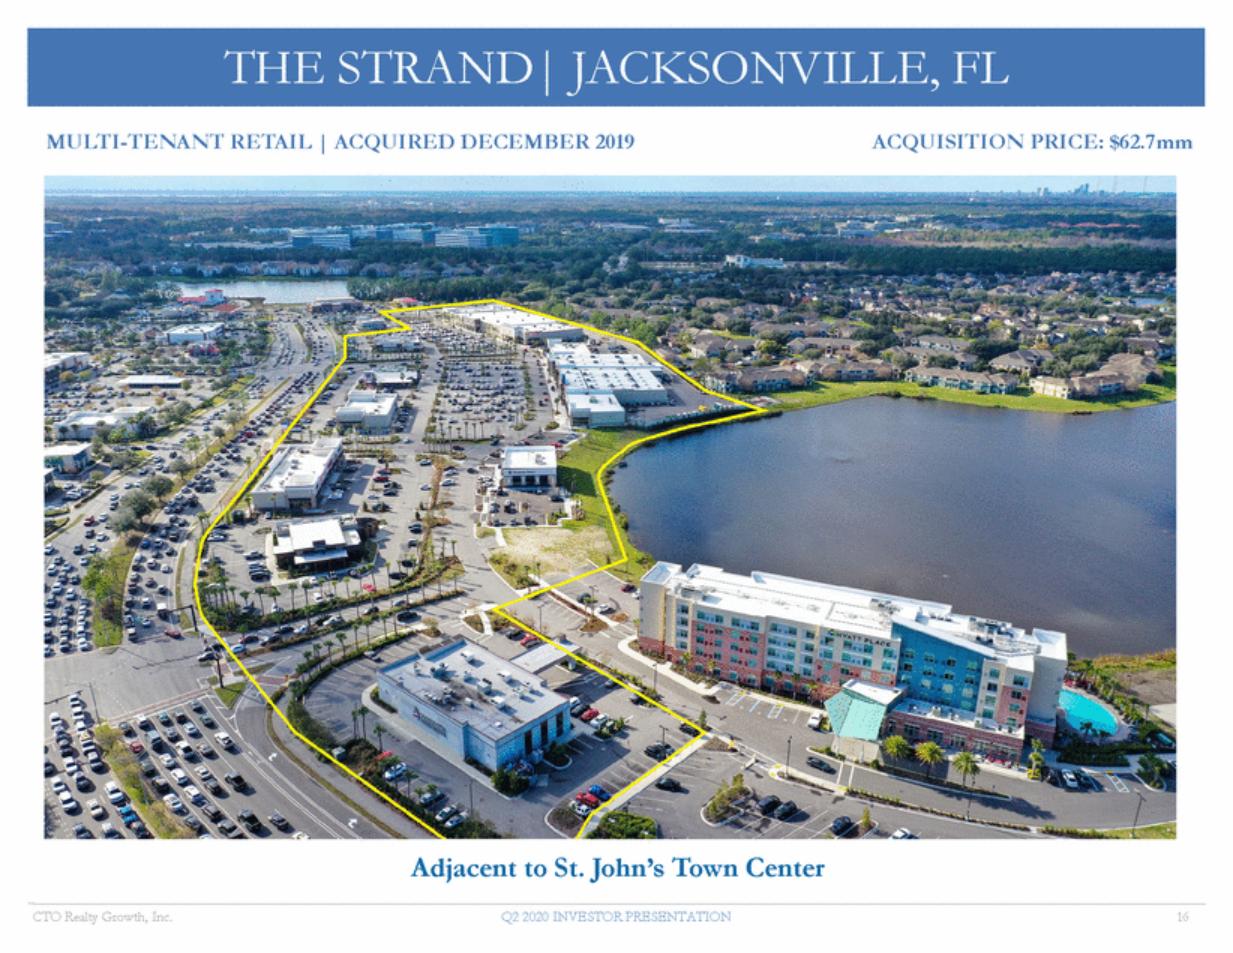
| MULTI-TENANT RETAIL | ACQUIRED DECEMBER 2019 ACQUISITION PRICE: $62.7mm Adjacent to St. John’s Town Center CTO Realty Growth, Inc. Q2 2020 INVESTOR PRESENTATION 16 THE STRAND| JACKSONVILLE, FL |
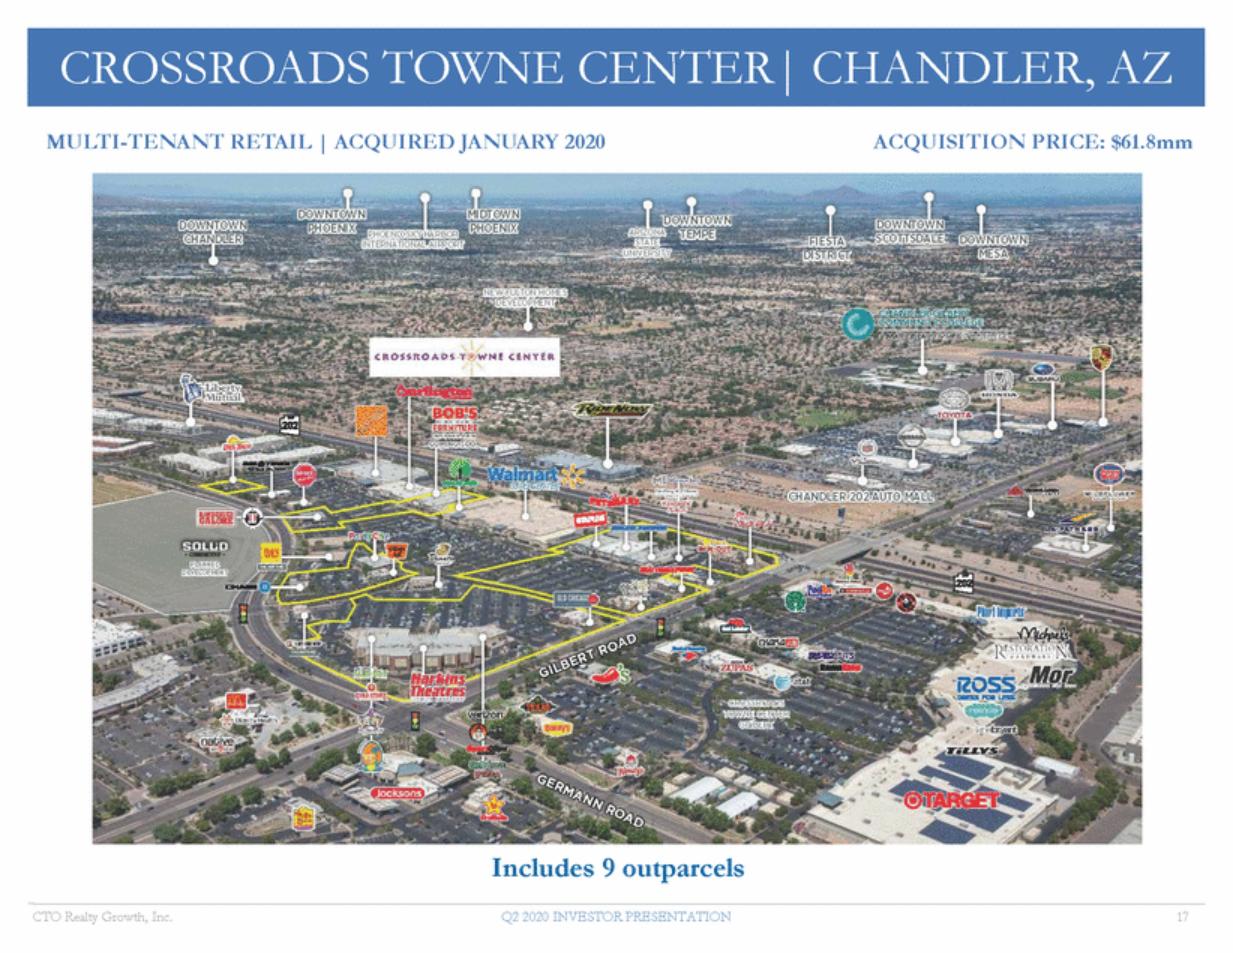
| MULTI-TENANT RETAIL | ACQUIRED JANUARY 2020 ACQUISITION PRICE: $61.8mm Includes 9 outparcels CTO Realty Growth, Inc. Q2 2020 INVESTOR PRESENTATION 17 CROSSROADS TOWNE CENTER| CHANDLER, AZ |
| SINGLE-TENANT OFFICE| ACQUIRED OCTOBER 2018 ACQUISITION PRICE: $44mm CTO Realty Growth, Inc. Q2 2020 INVESTOR PRESENTATION 18 FIDELITY | ALBUQUERQUE, NM |

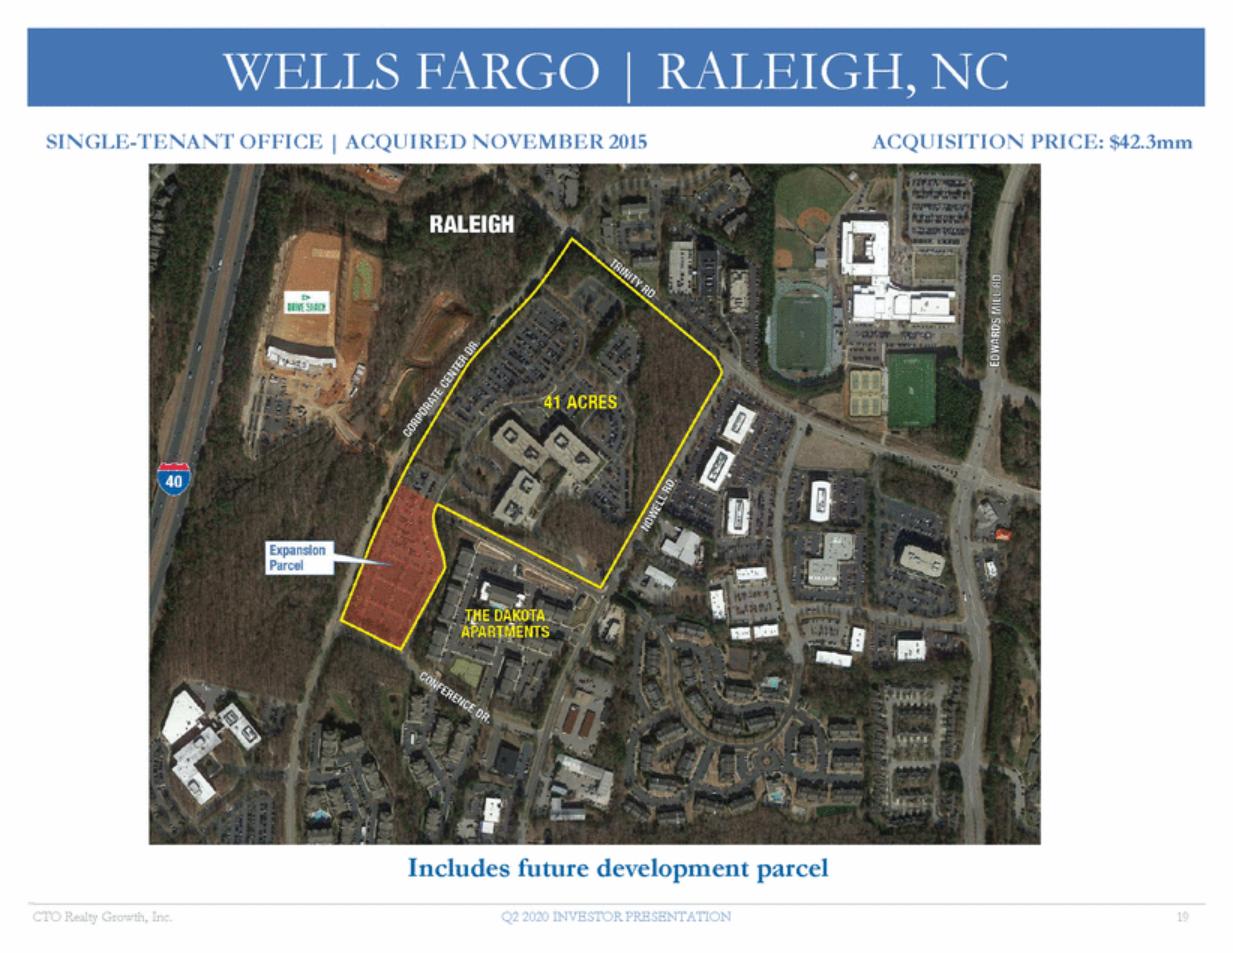
| I ACQUIRED NOVEMBER2015 SINGLE-TENANT OFFICE ACQUISITION PRICE: $42.3mm Includes future development parcel CTO Realty Growth, Inc. Q2 2020 INVESTOR PRESENTATION 19 RALEIGH, NC WELLS FARGO |
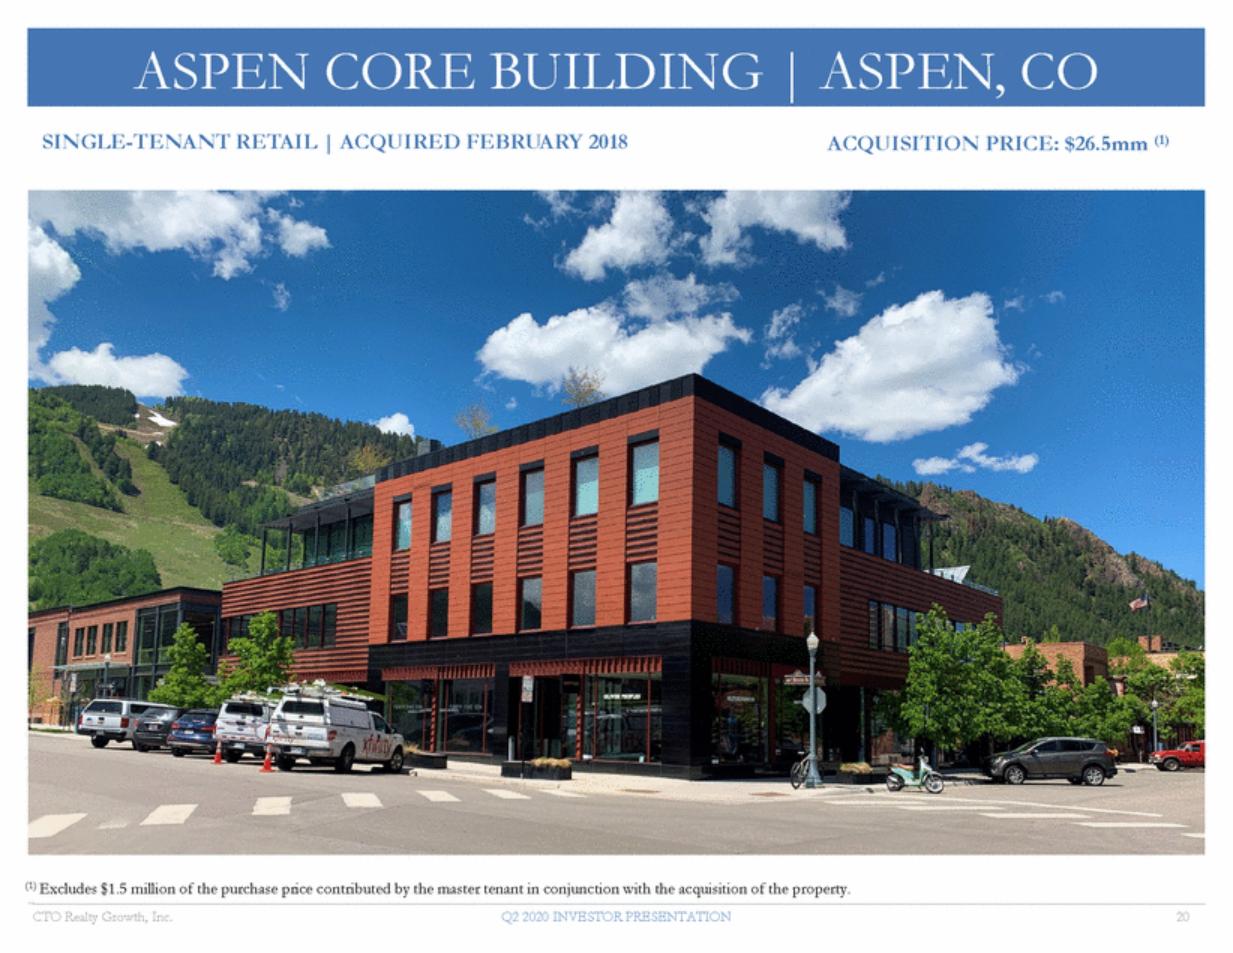
| SINGLE-TENANT RETAIL | ACQUIRED FEBRUARY 2018 ACQUISITION PRICE: $26.5mm (1) (1) Excludes $1.5 million of the purchase price contributed by the master tenant in conjunction with the acquisition of the property. CTO Realty Growth, Inc. Q2 2020 INVESTOR PRESENTATION 20 ASPEN CORE BUILDING | ASPEN, CO |
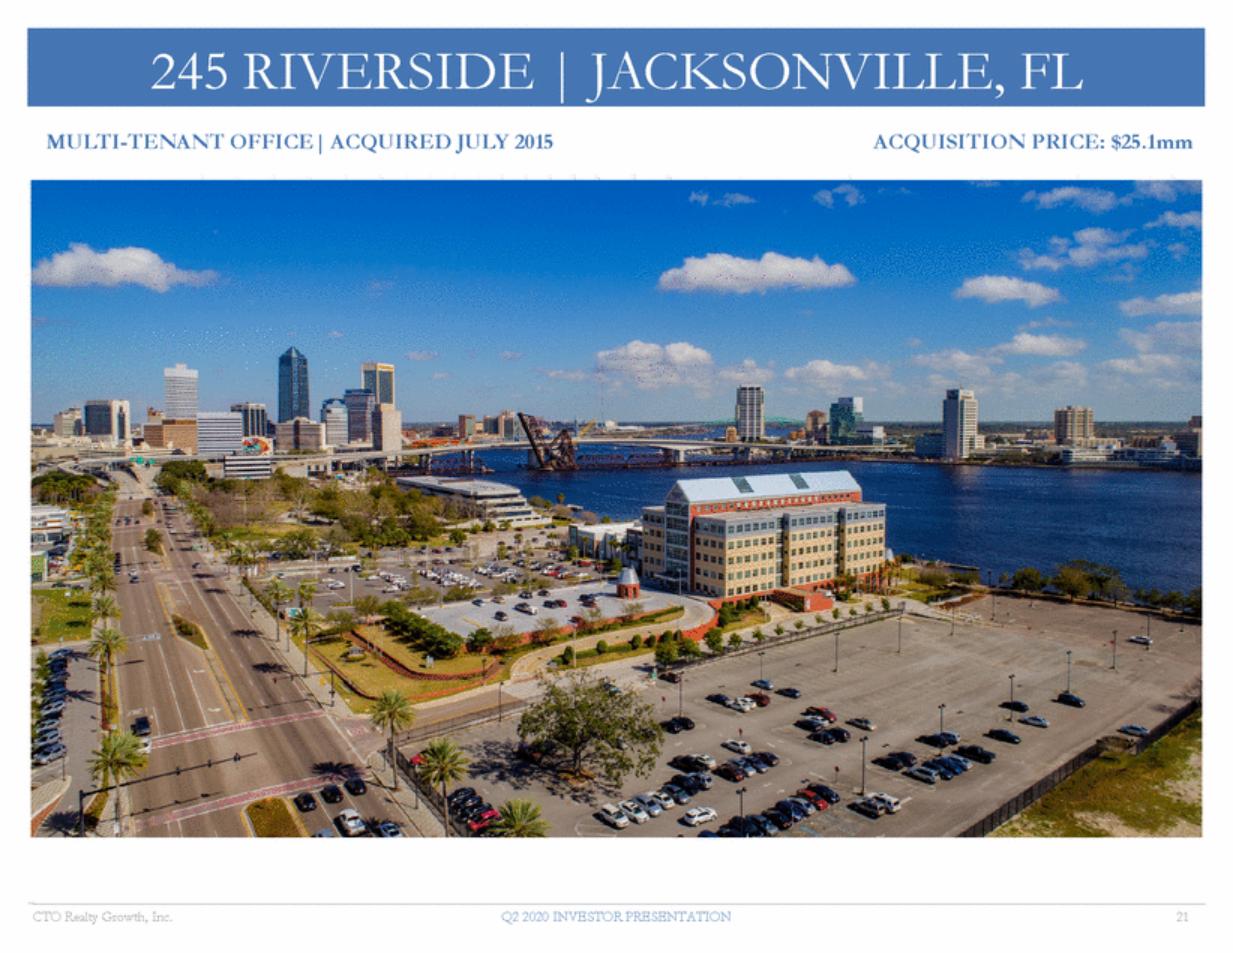
| MULTI-TENANT OFFICE| ACQUIRED JULY 2015 ACQUISITION PRICE: $25.1mm CTO Realty Growth, Inc. Q2 2020 INVESTOR PRESENTATION 21 245 RIVERSIDE | JACKSONVILLE, FL |
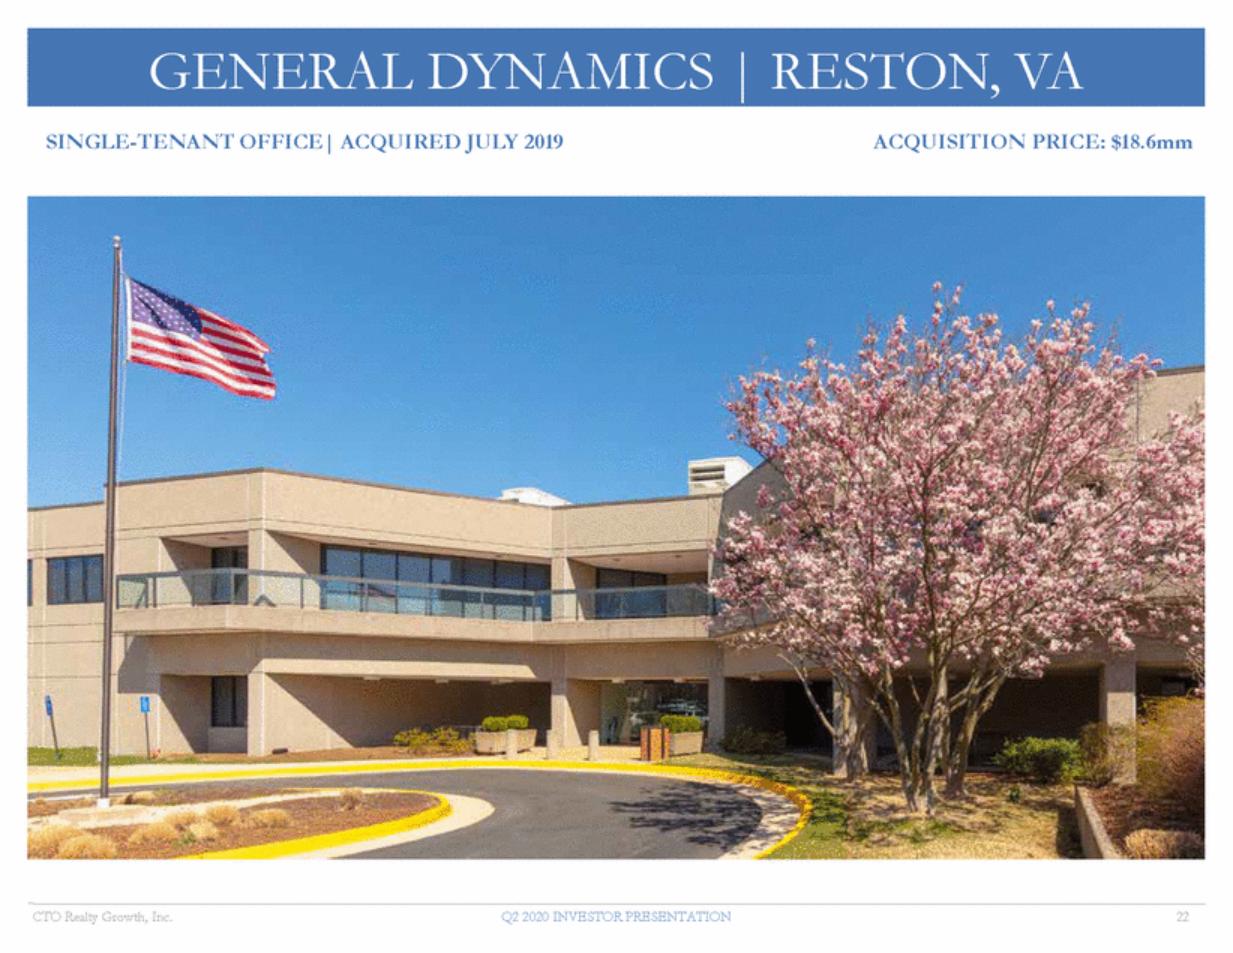
| SINGLE-TENANT OFFICE| ACQUIRED JULY 2019 ACQUISITION PRICE: $18.6mm CTO Realty Growth, Inc. Q2 2020 INVESTOR PRESENTATION 22 GENERAL DYNAMICS | RESTON, VA |
| GROUND LEASE | ACQUIRED JULY 2019 ACQUISITION PRICE: $16.3mm CTO Realty Growth, Inc. Q2 2020 INVESTOR PRESENTATION 23 CARPENTER HOTEL | AUSTIN, TX |

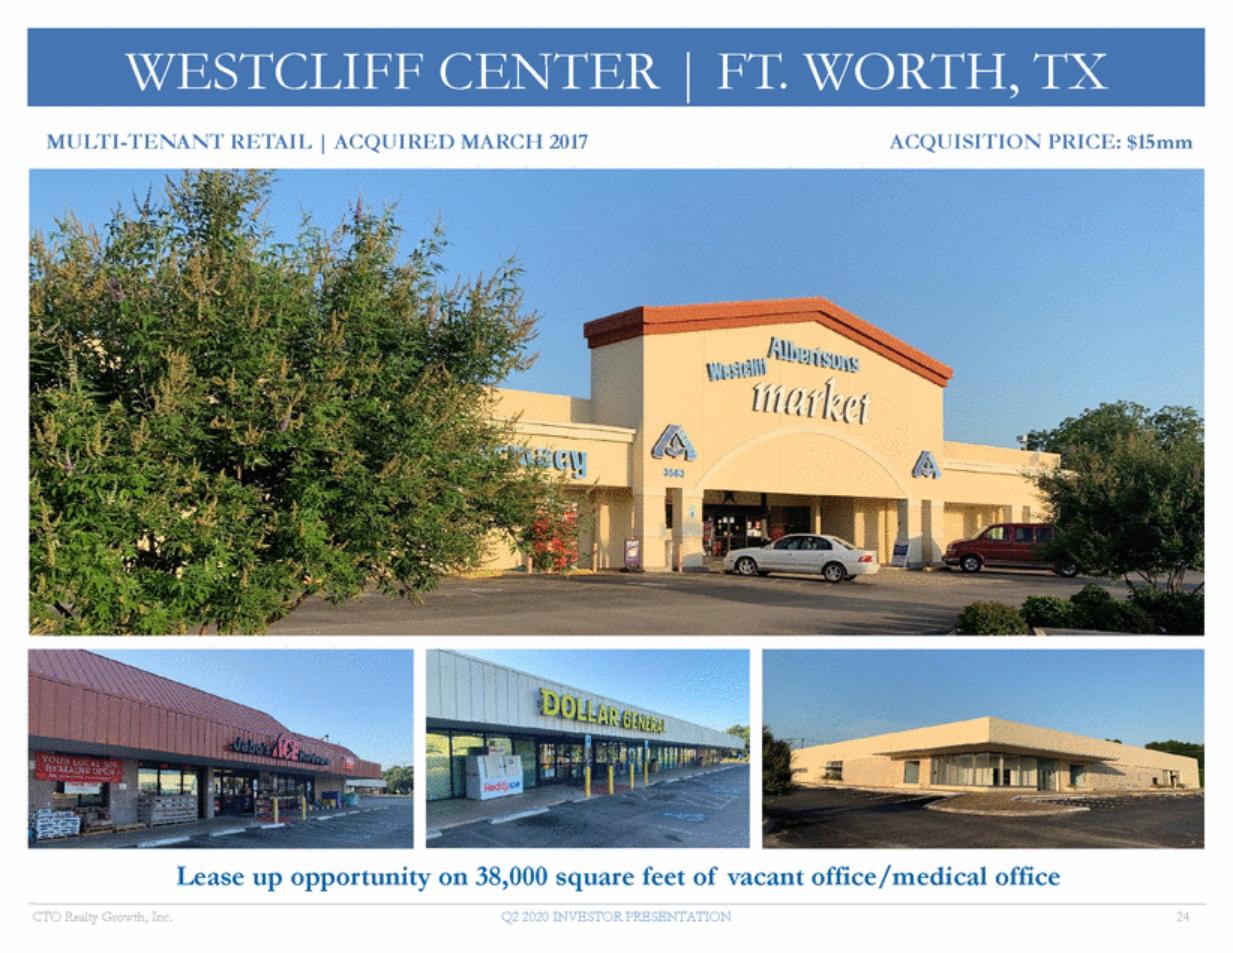
| I ACQUIRED MARCH 2017 MULTI-TENANT RETAIL ACQUISITION PRICE: $15mm Lease up opportunity on 38,000 square feet of vacant office/medical office CTO Realty Growth, Inc. Q2 2020 INVESTOR PRESENTATION 24 FT. WORTH, TX WESTCLIFF CENTER |
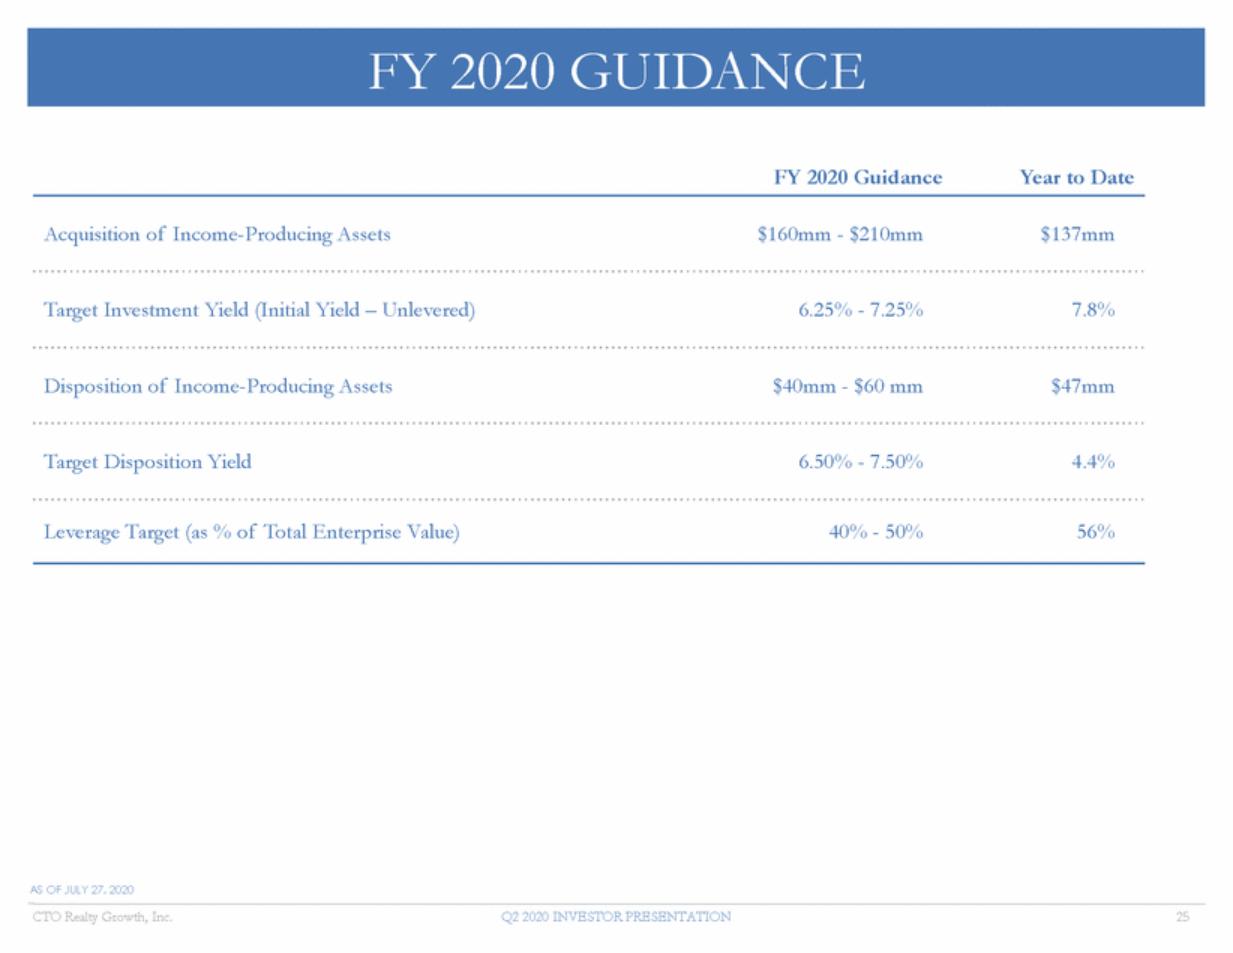
| FY 2020 Guidance Year to Date Acquisition of Income-Producing Assets $160mm - $210mm $137mm Target Investment Yield (Initial Yield – Unlevered) 6.25% - 7.25% 7.8% Disposition of Income-Producing Assets $40mm - $60 mm $47mm Target Disposition Yield 6.50% - 7.50% 4.4% Leverage Target (as % of Total Enterprise Value) 40% - 50% 56% AS OF JULY 27, 2020 CTO Realty Growth, Inc. Q2 2020 INVESTOR PRESENTATION 25 FY 2020 GUIDANCE |
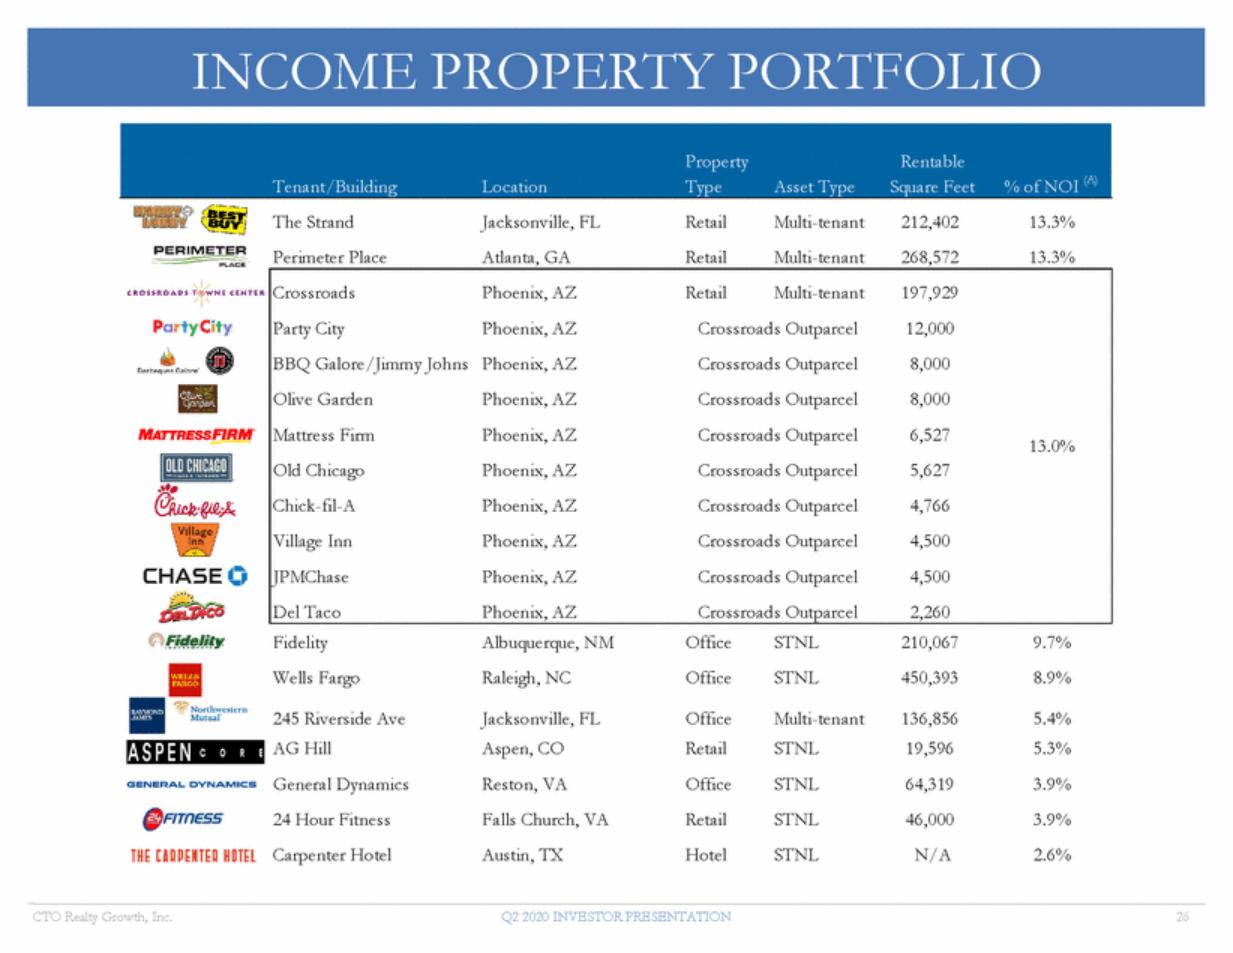
| CTO Realty Growth, Inc. Q2 2020 INVESTOR PRESENTATION 26 PropertyRentable Tenant/BuildingLocationTypeAsset TypeSquare Feet% of NOI (A) The StrandJacksonville, FLRetailMulti-tenant212,40213.3% Perimeter PlaceAtlanta, GARetailMulti-tenant268,57213.3% CrossroadsPhoenix, AZRetailMulti-tenant197,929 Party CityPhoenix, AZCrossroads Outparcel12,000 BBQ Galore/Jimmy Johns Phoenix, AZCrossroads Outparcel8,000 Olive GardenPhoenix, AZCrossroads Outparcel8,000 Mattress FirmPhoenix, AZCrossroads Outparcel6,52713.0% Old ChicagoPhoenix, AZCrossroads Outparcel5,627 Chick-fil-APhoenix, AZCrossroads Outparcel4,766 Village InnPhoenix, AZCrossroads Outparcel4,500 JPMChasePhoenix, AZCrossroads Outparcel4,500 Del TacoPhoenix, AZCrossroads Outparcel2,260 FidelityAlbuquerque, NMOfficeSTNL210,0679.7% Wells FargoRaleigh, NCOfficeSTNL450,3938.9% 245 Riverside AveJacksonville, FLOfficeMulti-tenant136,8565.4% AG HillAspen, CORetailSTNL 19,5965.3% General DynamicsReston, VAOfficeSTNL64,3193.9% 24 Hour FitnessFalls Church, VARetailSTNL46,0003.9% Carpenter HotelAustin, TXHotelSTNLN/A2.6% INCOME PROPERTY PORTFOLIO |
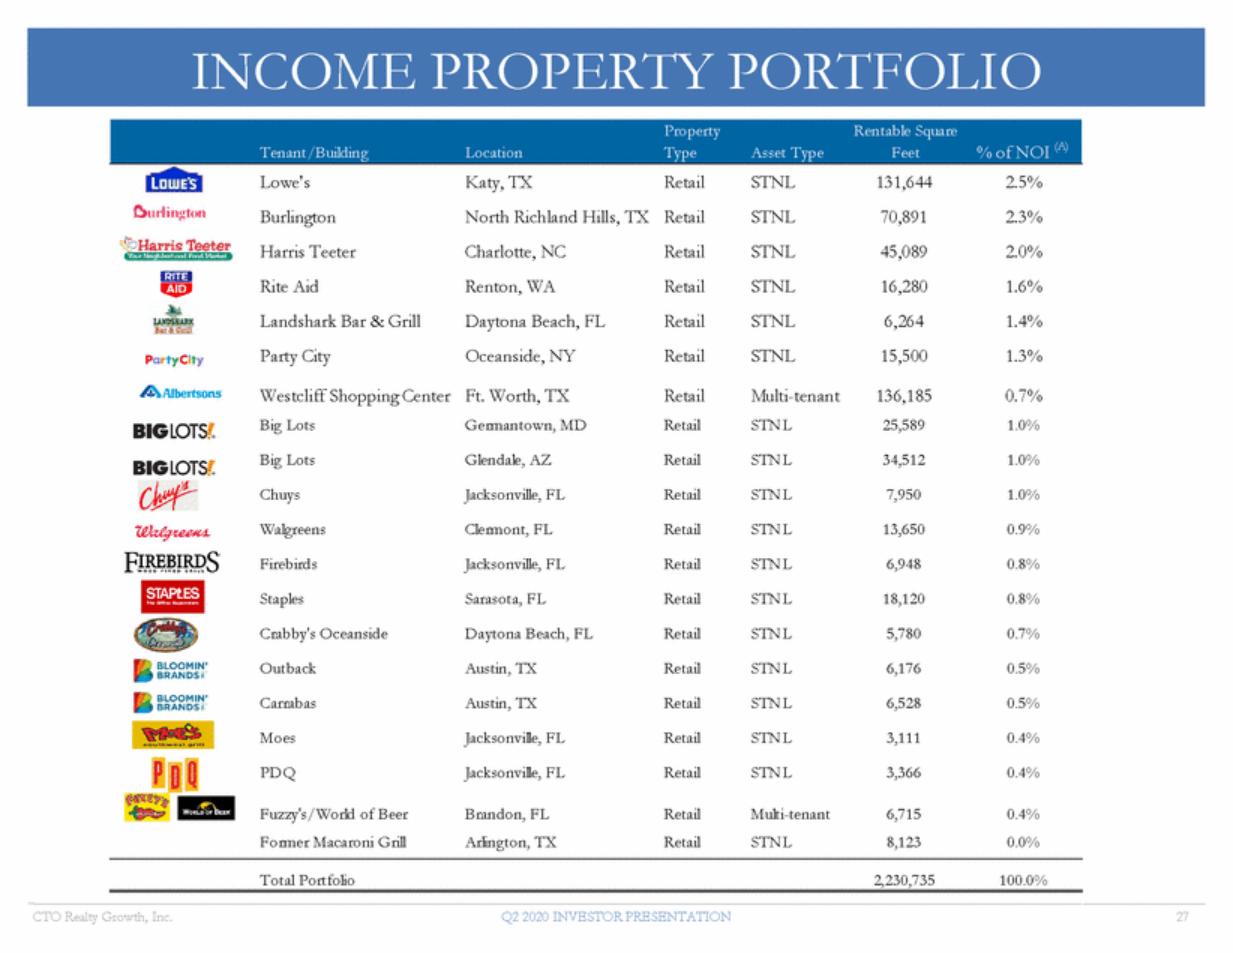
| Property Rentable Square Tenant/Building Location Type Asset TypeFeet% of NOI (A) Lowe's Katy, TX Retail STNL 131,644 2.5% Burlington North Richland Hills, TX Retail STNL 70,891 2.3% Harris Teeter Charlotte, NC Retail STNL 45,089 2.0% Rite Aid Renton, WA Retail STNL 16,280 1.6% Landshark Bar & Grill Daytona Beach, FL Retail STNL 6,264 1.4% Party City Oceanside, NY Retail STNL 15,500 1.3% Westcliff Shopping Center Ft. Worth, TX Retail Multi-tenant 136,185 0.7% Big Lots Germantown, MD Retail STNL 25,589 1.0% Big Lots Glendale, AZ Retail STNL 34,512 1.0% Chuys Jacksonville, FL Retail STNL 7,950 1.0% Walgreens Clermont, FL Retail STNL 13,650 0.9% Firebirds Jacksonville, FL Retail STNL 6,948 0.8% Staples Sarasota, FL Retail STNL 18,120 0.8% Crabby's Oceanside Daytona Beach, FL Retail STNL 5,780 0.7% Outback Austin, TX Retail STNL 6,176 0.5% Carrabas Austin, TX Retail STNL 6,528 0.5% Moes Jacksonville, FL Retail STNL 3,111 0.4% PDQ Jacksonville, FL Retail STNL 3,366 0.4% Fuzzy's/World of Beer Brandon, FL Retail Multi-tenant 6,715 0.4% Former Macaroni Grill Arlington, TX Retail STNL 8,123 0.0% Total Portfolio 2,230,735100.0% CTO Realty Growth, Inc.Q2 2020 INVESTOR PRESENTATION 27 INCOME PROPERTY PORTFOLIO |
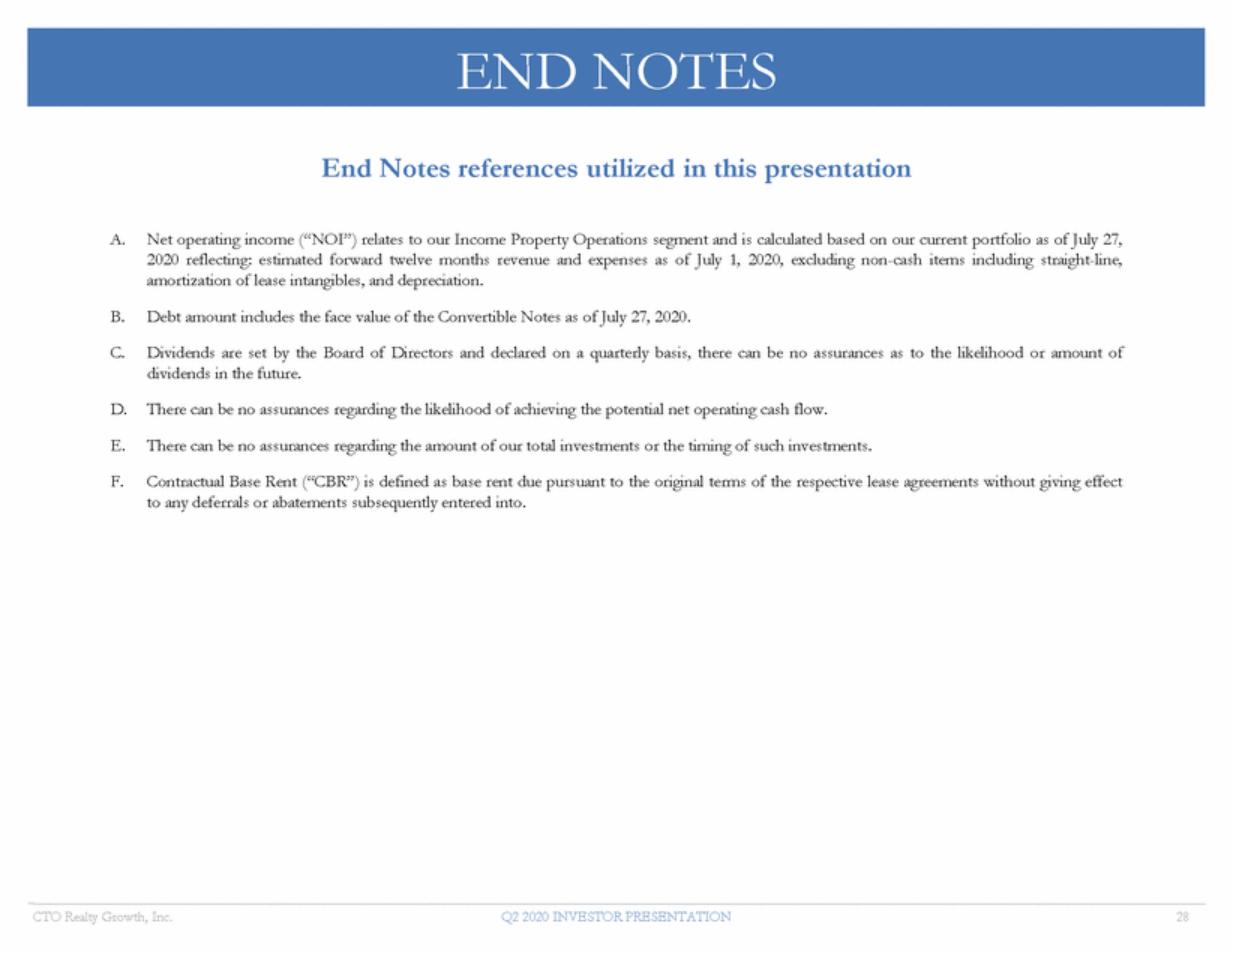
| End Notes references utilized in this presentation A. Net operating income (“NOI”) relates to our Income Property Operations segment and is calculated based on our current portfolio as of July 27, 2020 reflecting: estimated forward twelve months revenue and expenses as of July 1, 2020, excluding non-cash items including straight-line, amortization of lease intangibles, and depreciation. B. Debt amount includes the face value of the Convertible Notes as of July 27, 2020. C. Dividends are set by the Board of Directors and declared on a quarterly basis, there can be no assurances as to the likelihood or amount of dividends in the future. D. There can be no assurances regarding the likelihood of achieving the potential net operating cash flow. E. There can be no assurances regarding the amount of our total investments or the timing of such investments. F. Contractual Base Rent (“CBR”) is defined as base rent due pursuant to the original terms of the respective lease agreements without giving effect to any deferrals or abatements subsequently entered into. CTO Realty Growth, Inc. Q2 2020 INVESTOR PRESENTATION 28 END NOTES |
| PRESENTATION JULY 2020 NYSE Amencan: CTO Q2 2020 INVESTOR |