Attached files
| file | filename |
|---|---|
| 8-K - 8-K - TransUnion | ck0001552033-20200728.htm |
| EX-99.1 - EX-99.1 - TransUnion | exhibit9916302020.htm |

v Exhibit 99.2 v v TransUnion Second Quarter 2020 Earnings Chris Cartwright, President and CEO Todd Cello, CFO

Forward-Looking Statement This presentation contains forward-looking statements within the meaning of the Private Securities Litigation Reform Act of 1995. These statements are based on the current beliefs and expectations of TransUnion’s management and are subject to significant risks and uncertainties. Actual results may differ materially from those described in the forward-looking statements. Factors that could cause TransUnion’s actual results to differ materially from those described in the forward-looking statements, including the effects of the COVID-19 pandemic and the timing of the recovery from the COVID-19 pandemic, can be found in TransUnion’s Annual Report on Form 10-K for the year ended December 31, 2019, as modified in any subsequent Quarterly Report on Form 10-Q or Current Report on Form 8-K, which are filed with the Securities and Exchange Commission and are available on TransUnion's website (www.transunion.com/tru) and on the Securities and Exchange Commission's website (www.sec.gov). TransUnion undertakes no obligation to update the forward-looking statements to reflect the impact of events or circumstances that may arise after the date of the forward-looking statements. Factors that could cause actual results to differ materially from those described in the forward-looking statements. Non-GAAP Financial Information This investor presentation includes certain non-GAAP measures that are more fully described in Exhibit 99.1, “Non-GAAP Financial Measures,” of our Current Report on Form 8-K filed on July 28, 2020. These financial measures should be reviewed in conjunction with the relevant GAAP financial measures and are not presented as alternative measures of GAAP. Other companies in our industry may define or calculate these measures differently than we do, limiting their usefulness as comparative measures. Because of these limitations, these non-GAAP financial measures should not be considered in isolation or as substitutes for performance measures calculated in accordance with GAAP. Reconciliations of these non-GAAP financial measures to their most directly comparable GAAP financial measures are presented in the tables of Exhibit 99.1 of our Current Report on Form 8-K filed on July 28, 2020. The Company is also providing a scenario-based outlook in this investor presentation for the third quarter 2020. We are unable to provide a reconciliation between the potential financial outcomes for the non-GAAP measures of Adjusted Revenue, Adjusted EBITDA, Adjusted EPS and Adjusted Tax Rate provided in the scenario-based outlook to the GAAP measures of revenue, net income attributable to TransUnion, earnings per share and the tax rate without unreasonable efforts due to the unavailability of reliable estimates for certain items included in our outlook. These items are not within the Company’s control and may vary greatly between periods and could significantly impact future financial results. © 2020 Trans Union LLC All Rights Reserved | 2

• Focus on the welfare of our associates, customers, consumers and communities • Continue to work from home globally • Appreciate the selfless and tireless work of healthcare professionals, first responders and other essential workers • Embrace the opportunity to foster greater diversity and inclusion for all associates © 2020 Trans Union LLC All Rights Reserved | 3

1 Second quarter 2020 overview 2 Current business trends 3 Strategic long-term investments 4 Detailed financial performance 5 Scenario-based outlook © 2020 Trans Union LLC All Rights Reserved | 4

Second Quarter 2020 Overview Delivered revenue, Adjusted EBITDA and Adjusted Diluted EPS solidly in our upside case scenario Benefitted as our associates, customers and consumers transitioned to a work from home and socially distanced reality Experienced generally positive trends since April; re-openings and government stimulus added momentum to the recovery Supported our customers with insights and thought leadership, re-designed and new products, and customized campaigns © 2020 Trans Union LLC All Rights Reserved | 5

U.S. Markets – Financial Services Trend Online Credit Report Unit Volumes Total U.S. Markets Financial Services Volume Additional trend data since Q1 2020 Earnings Release +5% January February March April May June July(1) 2019 2020 © 2020 Trans Union LLC All Rights Reserved | 6 (1) Volume growth/decline reflects year-over-year change for 7-day period ended July 24th.

U.S. Markets – Financial Services End-Market Trends Online Credit Report Unit Volumes Mortgage Auto Additional trend data since Q1 Additional trend data since Q1 2020 Earnings Release 2020 Earnings Release +64% (1%) January February March April May June July(1) January February March April May June July(1) Consumer Lending Card and Banking Additional trend data since Q1 Additional trend data since Q1 2020 Earnings Release 2020 Earnings Release (11%) +1% January February March April May June July(1) January February March April May June July(1) (1) Volume growth/decline reflects year-over- 2019 2020 © 2020 Trans Union LLC All Rights Reserved | 7 year change for 7-day period ended July 24th.

Healthcare Vertical Trends Our solutions reduce provider risk and increase cash flow • Front-end solutions: insurance eligibility checks, identity screens and payment estimation ─ Sharp volume declines early in Q2 as patients and providers delayed or cancelled elective and preventive care ─ Partially offset from SaaS pricing model for our payment estimation solution, volume floors and pricing minimums for other solutions • Back-end solutions: identify opportunities for reimbursement ─ Potential that back-end recovery volumes may decline in 2H 2020 due to curtailment in elective and preventative care © 2020 Trans Union LLC All Rights Reserved | 8

Insurance Vertical Trends Provide insurers with marketing and underwriting solutions, analytics and investigative tools for claims • Delivered low-single-digit revenue decline as insurers: ─ Improved digital experience for consumers ─ Recognized an increased need for fraud mitigation tools ─ Focused on realizing efficiencies • Focused on selling our Risk Verification Product to combat fraud; highlighted cost-reduction benefits of DriverRisk • Expect our Insurance vertical to continue to post solid results due to favorable market position and strong contract signings © 2020 Trans Union LLC All Rights Reserved | 9

Other U.S. Markets Vertical Trends Vertical What We Do Current Trends TransUnion Outlook Background screening Public Government agencies largely Expect continued and fraud mitigation continue to operate unabated strong performance Sector solutions Volume declines due to Critical data for Expect industry to recover collections hiatus, forbearance Collections third-party collections in first half of 2021 programs and government stimulus Tenant: recovered relatively quickly Help property owners Tenant: expect trends to persist Tenant and after initially sharp decline and employers make Employment: expect modest recovery Employment: weak trends given Employment informed decisions as economies slowly re-open increased unemployment Credit checks for Significant decline in April followed Expect trends to persist Telco plans and devices by faster-than-expected recovery © 2020 Trans Union LLC All Rights Reserved | 10

Consumer Interactive Trends Consumers recognize value of credit and identity protection, credit monitoring and related financial education tools • Direct channel: ─ Good performance behind continued successful marketing to consumers focused on their credit health • Indirect channel: ─ Indirect partners curtailing marketing programs, resulting in a decline in subscribers; if trends persist, expect larger headwind in 2H 2020 ─ Meaningful discussion with potential new partners © 2020 Trans Union LLC All Rights Reserved | 11

International Year-to-Date Trends Year-over-Year Constant Currency Adj. Revenue Growth / (Decline) Canada [Q2: (2)%] India [Q2: (23)%] 0% Latin America [Q2: (22)%] Africa [Q2: (21)%] Asia Pacific [Q2: (12)%] U.K. [Q2: (16)%] Jan-20 Feb-20 Mar-20 Apr-20 May-20 Jun-20 Note: Q2 adjusted revenue performance shown in constant currency. © 2020 Trans Union LLC All Rights Reserved | 12

International Trends Country or Revenue Portfolio Diversification Current Trends Region Contribution (Beyond Financial Services) 7% of Total TU Fraud solutions, government, Markets under stress; U.K. (31% of International) gaming, affordability suite strong fraud solution volumes 4% of Total TU Fraud solutions, DTC offerings, Weak lending markets; offset partially Canada (17% of International) insurance and government verticals through TU-specific strategies 4% of Total TU Analytics and decisioning, fraud solutions, Dramatic drop in April with progressive India (17% of International) DTC offerings, commercial credit improvement in May/June Latin 4% of Total TU Limited recovery Data analytics business (Brazil) America (17% of International) other than Colombia 2% of Total TU Diversified portfolio with leading positions Continue to see fits and starts of Africa (10% of International) in retail, auto information, insurance recovery in South Africa Asia 2% of Total TU Portfolio and risk management, Hong Kong: largely re-opened Pacific (9% of International) fraud solutions, DTC offerings Philippines: severe lockdowns continue © 2020 Trans Union LLC All Rights Reserved | 13 Note: Revenue Contribution based on FY 2019 Adjusted Revenue. Amounts may not foot due to rounding.

Global Solutions Will Improve Our Ability to Aggressively and Strategically Develop and Diffuse Innovation Globally • Built a series of solution-focused teams populated with talented associates with deep product and market knowledge • Hired global fraud leader and quickly standardized three of four existing fraud solutions • Accelerated launch of existing products, including CreditVision Acute Relief © 2020 Trans Union LLC All Rights Reserved | 14

Global Operations Allows Us to Expand Our Core Capabilities, Enhancing the Customer Experience and Driving Greater Efficiencies • Global Procurement: leverage and build on existing spend discipline while creating consistent global standards • Global Capability Centers (GCC): replicate success of first GCC in Chennai, India to reduce technology costs and improve capabilities ─ Chennai GCC recently named 40th “Best Company to Work For” out of 1,000+ companies • Process Optimization: further enhance the customer experience © 2020 Trans Union LLC All Rights Reserved | 15

Project Rise is Our Accelerated Technology Initiative to Ensure that We Are Even More Effective, Efficient, Secure, Reliable, and Performant • Identified a series of critical, global applications that will be deployed in early 2021 with others to follow • Streamlining and rationalizing our application ecosystem • Remain confident in our timeline and the benefits of our Project Rise investment © 2020 Trans Union LLC All Rights Reserved | 16

Year-over-Year Change Adjusted Revenue (4)% Constant Currency Adjusted Revenue (3)% Consolidated Q2 2020 Organic Adjusted Revenue (5)% Highlights Organic Constant Currency Adjusted Revenue (3)% Adjusted EBITDA (8)% Constant Currency Adjusted EBITDA (7)% Organic Constant Currency Adjusted EBITDA (7)% Adjusted Diluted EPS (4)% Note: For additional information, refer to the “Non-GAAP Financial Information” section on slide 2. © 2020 Trans Union LLC All Rights Reserved | 17

Inorganic Organic Constant Reported FX Impact Impact Currency U.S. Markets Adjusted (0)% — — (0)% Q2 2020 Revenue Financial 4% — — 4% Year-over-Year Services Financial Emerging (5)% — (0)% (6)% Highlights Verticals Adjusted (2)% — — (2)% EBITDA Note: Rows may not foot due to rounding. For additional information, refer to the “Non-GAAP Financial Information” section on slide 2. © 2020 Trans Union LLC All Rights Reserved | 18

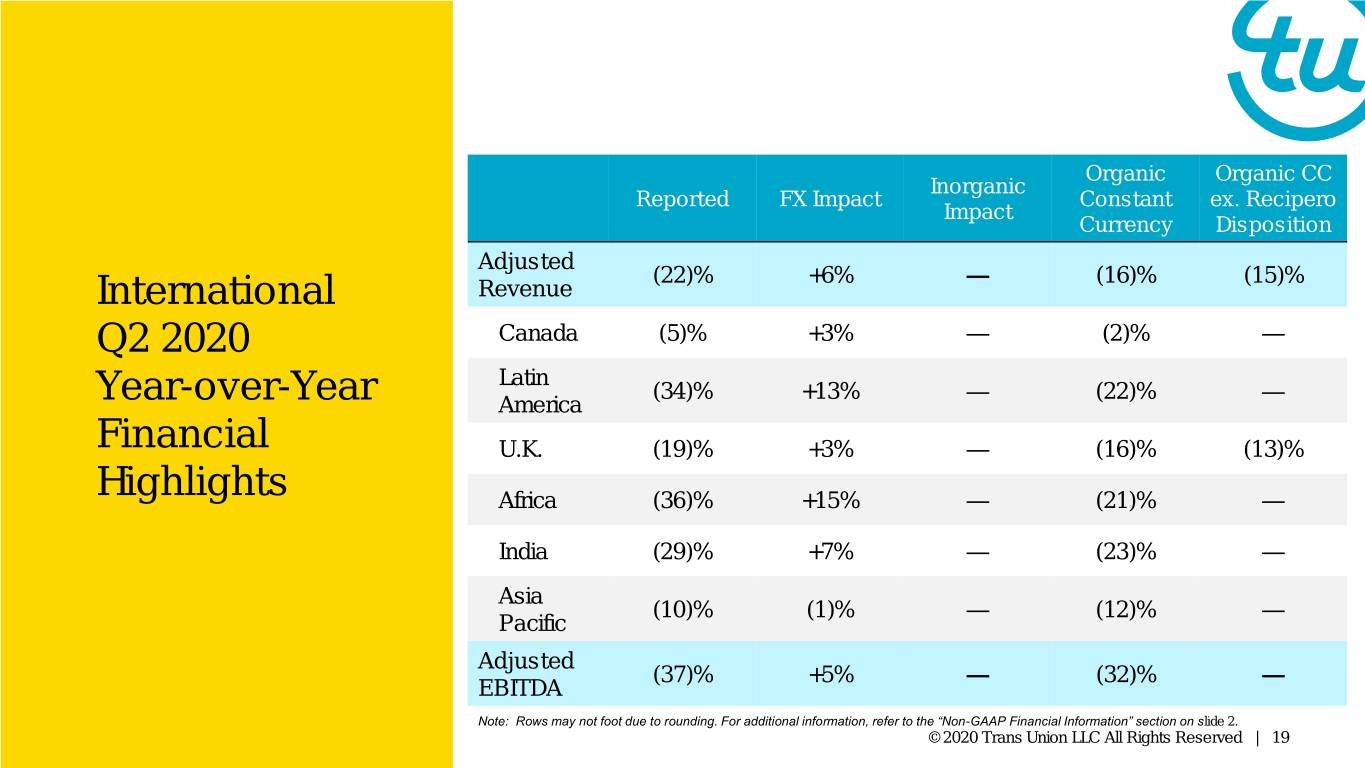
Organic Organic CC Inorganic Reported FX Impact Constant ex. Recipero Impact Currency Disposition Adjusted (22)% +6% — (16)% (15)% International Revenue Q2 2020 Canada (5)% +3% — (2)% — Latin (34)% +13% — (22)% — Year-over-Year America Financial U.K. (19)% +3% — (16)% (13)% Highlights Africa (36)% +15% — (21)% — India (29)% +7% — (23)% — Asia (10)% (1)% — (12)% — Pacific Adjusted (37)% +5% — (32)% — EBITDA Note: Rows may not foot due to rounding. For additional information, refer to the “Non-GAAP Financial Information” section on slide 2. © 2020 Trans Union LLC All Rights Reserved | 19

Consumer Inorganic Organic Constant Reported FX Impact Interactive Impact Currency Adjusted Q2 2020 4% — — 4% Revenue Year-over-Year Adjusted 4% — — 4% Financial EBITDA Highlights Note: For additional information, refer to the “Non-GAAP Financial Information” section on slide 2. © 2020 Trans Union LLC All Rights Reserved | 20

Strong Liquidity Position and Commitment to Prudently Manage our Balance Sheet Liquidity Leverage $432M Cash on hand $3.20B Total net debt $300M Undrawn revolver capacity $1.06B TTM Adjusted EBITDA $732M Total liquidity 3.0x Reported net leverage ratio • Significant cash build in Q2, resulting in • Slight reduction in leverage from 3.1x at Q1 highest amount on hand since our IPO • Meaningful portion of debt hedged (~70%) • Cash collections remain essentially in-line with pre-COVID-19 trends • No debt maturities until the end of 2024 © 2020 Trans Union LLC All Rights Reserved | 21

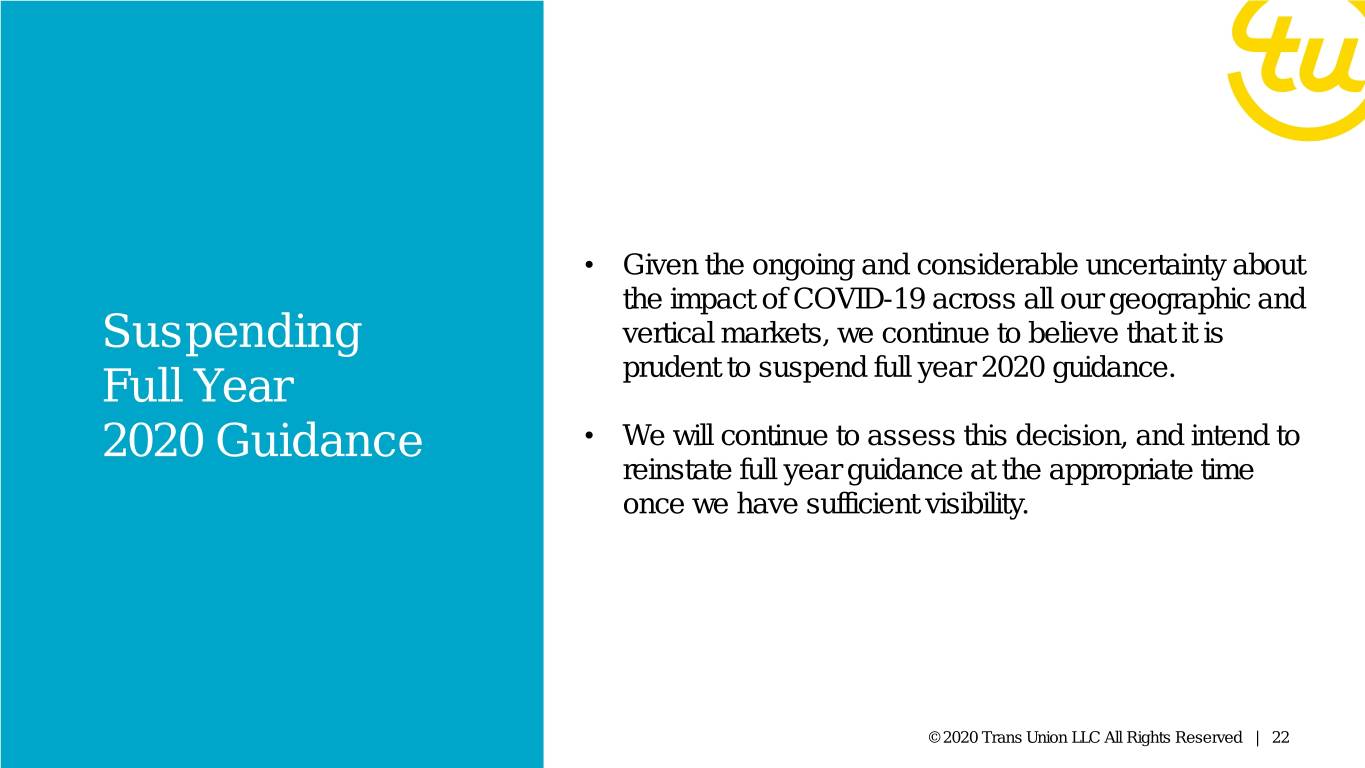
• Given the ongoing and considerable uncertainty about the impact of COVID-19 across all our geographic and Suspending vertical markets, we continue to believe that it is Full Year prudent to suspend full year 2020 guidance. 2020 Guidance • We will continue to assess this decision, and intend to reinstate full year guidance at the appropriate time once we have sufficient visibility. © 2020 Trans Union LLC All Rights Reserved | 22

Third Quarter 2020 Scenario-based Outlook Market Potential Balance Sheet Assumptions Financial Outcome Implications • Adjusted Revenue: decline 0% to 5% ─ Includes 1 point of FX headwind ─ U.S. Markets: flat to low-single-digits percent growth • Cash builds assuming no Base Current trends ─ International: low-teens percent decline debt prepayment or M&A continue through ─ Consumer Interactive: low-single-digits percent decline Case September 2020 • Leverage remains fairly • Adjusted EBITDA: decline 6% to 12% stable ─ Includes 1 point of FX headwind • Adjusted EPS: decline less than Adjusted EBITDA © 2020 Trans Union LLC All Rights Reserved | 23 Note: For additional information, refer to the “Non-GAAP Financial Information” section on slide 2.

Third Quarter 2020 Scenario-based Outlook Market Potential Balance Sheet Assumptions Financial Outcome Implications • Adjusted Revenue: growth • Cash builds fairly significantly Meaningful assuming no debt Upside improvement in • Adjusted EBITDA: better than 6% decline and could grow prepayment or M&A Case current trends throughout Q3 • Adjusted EPS: decline less than Adjusted EBITDA • Leverage decreases slightly • Cash would not build as it • Adjusted Revenue: greater than 5% decline Meaningful does in other two scenarios Downside deterioration in • Adjusted EBITDA: greater than 12% decline Case current trends • Leverage increases slightly throughout Q3 but expected to remain • Adjusted EPS: decline in line with Adjusted EBITDA below 3.5x © 2020 Trans Union LLC All Rights Reserved | 24 Note: For additional information, refer to the “Non-GAAP Financial Information” section on slide 2.

Prior Outlook Updated Outlook (provided with Q4 2019 earnings) Adj. Tax Rate: 25.5%(1) Adj. Tax Rate: 23% – 25% Full Year 2020 Outlook Total D&A: ~$375M Total D&A: ~$360M • D&A ex. step-up and • D&A ex. step-up and – Other Items subsequent M&A: ~$180M subsequent M&A: ~$170M Net Interest Exp.: ~$140M Net Interest Exp.: ~$125M CapEx: ~8% of revenue CapEx: ~8% of revenue (though lower than Q4 outlook on an absolute dollar spend basis) (1) Expected full-year 2020 GAAP effective tax rate of 22.6% plus the elimination of excess tax benefits for share-based compensation and other items of 2.9%. Note: For additional information, refer to the “Non-GAAP Financial Information” section on slide 2. © 2020 Trans Union LLC All Rights Reserved | 25

• Continuing to execute plans to proactively address and weather the current crisis environment • Investing to position TransUnion for continued best-in-class growth • Prioritizing welfare of associates and broader communities © 2020 Trans Union LLC All Rights Reserved | 26

Q&A © 2020 Trans Union LLC All Rights Reserved | 27
