Attached files
| file | filename |
|---|---|
| EX-99.3 - EX-99.3 - ECOLAB INC. | ecl-20200728xex99d3.htm |
| EX-99.1 - EX-99.1 - ECOLAB INC. | ecl-20200728xex99d1.htm |
| 8-K - 8-K - ECOLAB INC. | ecl-20200728x8k.htm |
Exhibit 99.2
| Please see Ecolab’s news release dated July 28, 2020 for additional information, including discussion on the use of certain non-GAAP financial measures. Second Quarter 2020 Teleconference Supplemental Data |
| Please see Ecolab’s news release dated July 28, 2020 for additional information, including discussion on the use of certain non-GAAP financial measures. . Cautionary Statement 2 Forward-Looking Information This communication contains forward looking statements as that term is defined in the Private Securities Litigation Reform Act of 1995. These forward-looking statements include, but are not limited to, statements regarding our financial and business performance and prospects, including the impact of the coronavirus (COVID-19) outbreak on our sales, operating results and cash flows. These statements are based on the current expectations of management. There are a number of risks and uncertainties that could cause actual results to differ materially from the forward-looking statements. In particular, with respect to the coronavirus, numerous factors will determine the extent of the impact on our business, including the extent to which the COVID-19 pandemic continues to spread; actions by various governments to address the COVID-19 pandemic; scientific advances to combat COVID-19; the time it takes for our key end markets to recover; the financial health of our customers and channel partners; potential supply chain disruptions; and the health and welfare of our employees. Additional risks and uncertainties are set forth under Item 1A of our most recent Form 10-K, and our other public filings with the SEC and include the effects and duration of the coronavirus (COVID-19) pandemic; the vitality of the markets we serve; the impact of economic factors such as the worldwide economy; our ability to execute key business initiatives; potential information technology infrastructure failures or breaches in data security; our ability to attract, retain and develop high caliber management talent to lead our business; our ability to innovate and to commercialize digital solutions; exposure to global economic, political and legal risks; difficulty in procuring raw materials or fluctuations in raw material costs; and other uncertainties or risks reported from time to time in our reports to the SEC. In light of these risks, uncertainties and factors, the forward-looking events discussed in this communication may not occur. We caution that undue reliance should not be placed on forward-looking statements, which speak only as of the date made. Ecolab does not undertake, and expressly disclaims, any duty to update any forward-looking statement, except as required by law. Non-GAAP Financial Information This communication includes Company information that does not conform to generally accepted accounting principles (GAAP). Management believes that a presentation of this information is meaningful to investors because it provides insight with respect to ongoing operating results of the Company and allows investors to better evaluate the financial results of the Company. These measures should not be viewed as an alternative to GAAP measures of performance. Furthermore, these measures may not be consistent with similar measures provided by other companies. Reconciliations of our non-GAAP measures included within this presentation are included in the “Non-GAAP Financial Measures” section of this presentation. |
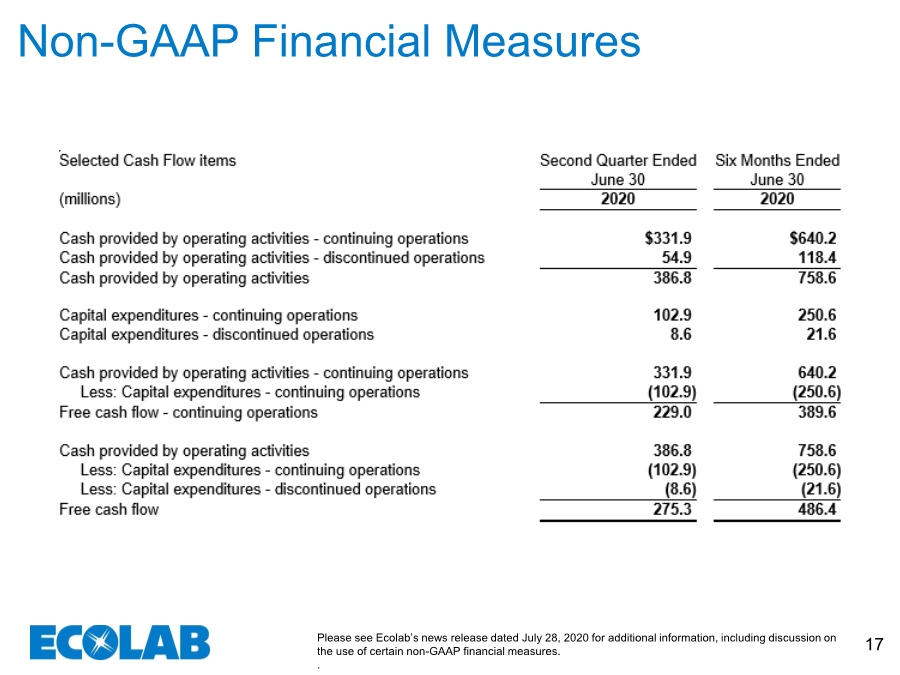
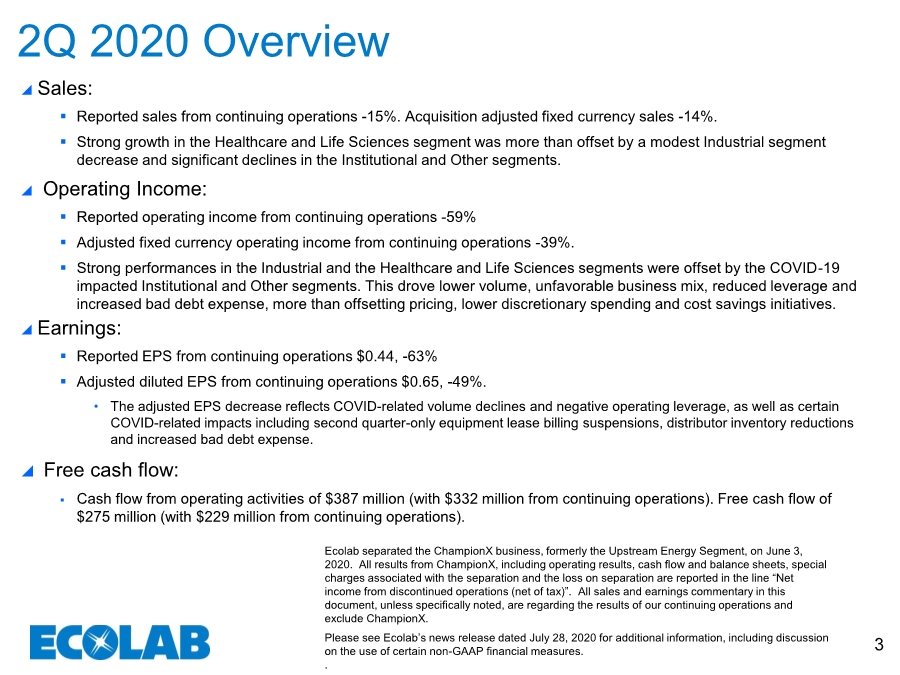
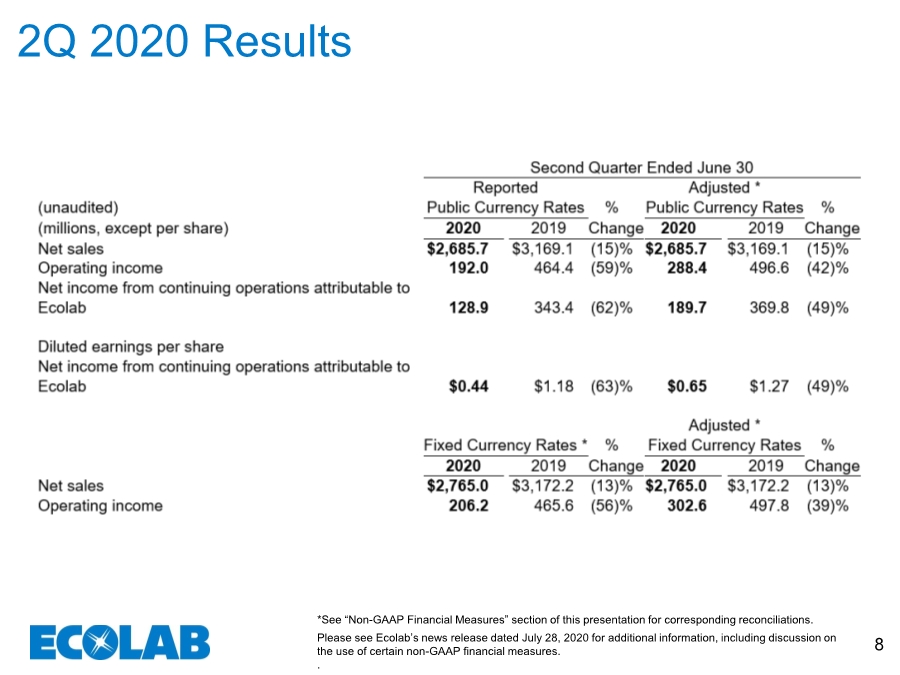
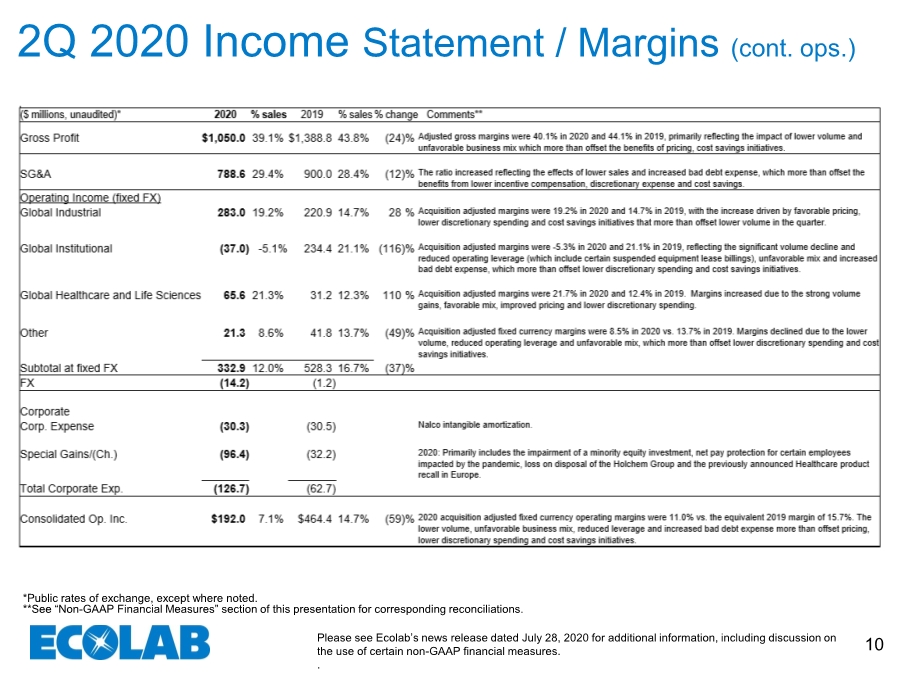
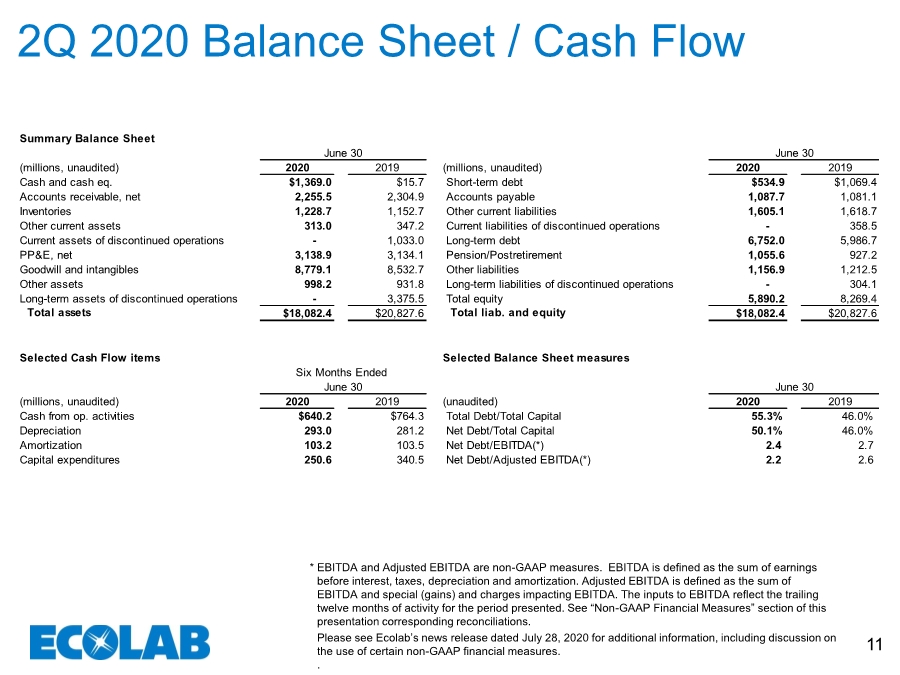
| Please see Ecolab’s news release dated July 28, 2020 for additional information, including discussion on the use of certain non-GAAP financial measures. . 3 Sales: ▪ Reported sales from continuing operations -15%. Acquisition adjusted fixed currency sales -14%. ▪ Strong growth in the Healthcare and Life Sciences segment was more than offset by a modest Industrial segment decrease and significant declines in the Institutional and Other segments. Operating Income: ▪ Reported operating income from continuing operations -59% ▪ Adjusted fixed currency operating income from continuing operations -39%. ▪ Strong performances in the Industrial and the Healthcare and Life Sciences segments were offset by the COVID-19 impacted Institutional and Other segments. This drove lower volume, unfavorable business mix, reduced leverage and increased bad debt expense, more than offsetting pricing, lower discretionary spending and cost savings initiatives. Earnings: ▪ Reported EPS from continuing operations $0.44, -63% ▪ Adjusted diluted EPS from continuing operations $0.65, -49%. • The adjusted EPS decrease reflects COVID-related volume declines and negative operating leverage, as well as certain COVID-related impacts including second quarter-only equipment lease billing suspensions, distributor inventory reductions and increased bad debt expense. Free cash flow: ▪ Cash flow from operating activities of $387 million (with $332 million from continuing operations). Free cash flow of $275 million (with $229 million from continuing operations). 2Q 2020 Overview Ecolab separated the ChampionX business, formerly the Upstream Energy Segment, on June 3, 2020. All results from ChampionX, including operating results, cash flow and balance sheets, special charges associated with the separation and the loss on separation are reported in the line “Net income from discontinued operations (net of tax)”. All sales and earnings commentary in this document, unless specifically noted, are regarding the results of our continuing operations and exclude ChampionX. |
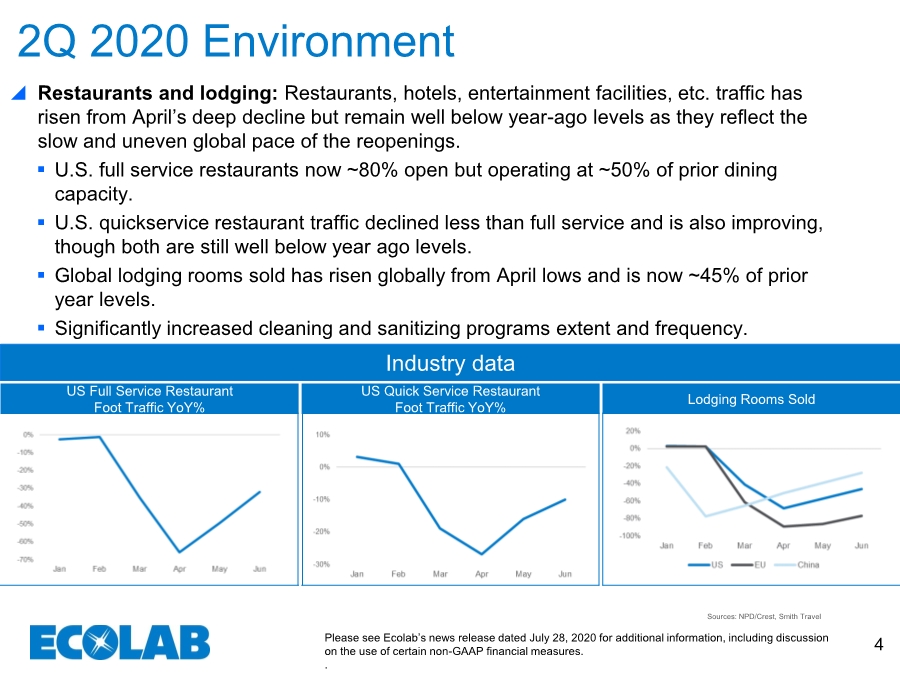
| Please see Ecolab’s news release dated July 28, 2020 for additional information, including discussion on the use of certain non-GAAP financial measures. . 4 Restaurants and lodging: Restaurants, hotels, entertainment facilities, etc. traffic has risen from April’s deep decline but remain well below year-ago levels as they reflect the slow and uneven global pace of the reopenings. ▪ U.S. full service restaurants now ~80% open but operating at ~50% of prior dining capacity. ▪ U.S. quickservice restaurant traffic declined less than full service and is also improving, though both are still well below year ago levels. ▪ Global lodging rooms sold has risen globally from April lows and is now ~45% of prior year levels. ▪ Significantly increased cleaning and sanitizing programs extent and frequency. 2Q 2020 Environment Sources: NPD/Crest, Smith Travel US Full Service Restaurant Foot Traffic YoY% Industry data US Quick Service Restaurant Foot Traffic YoY% Lodging Rooms Sold |
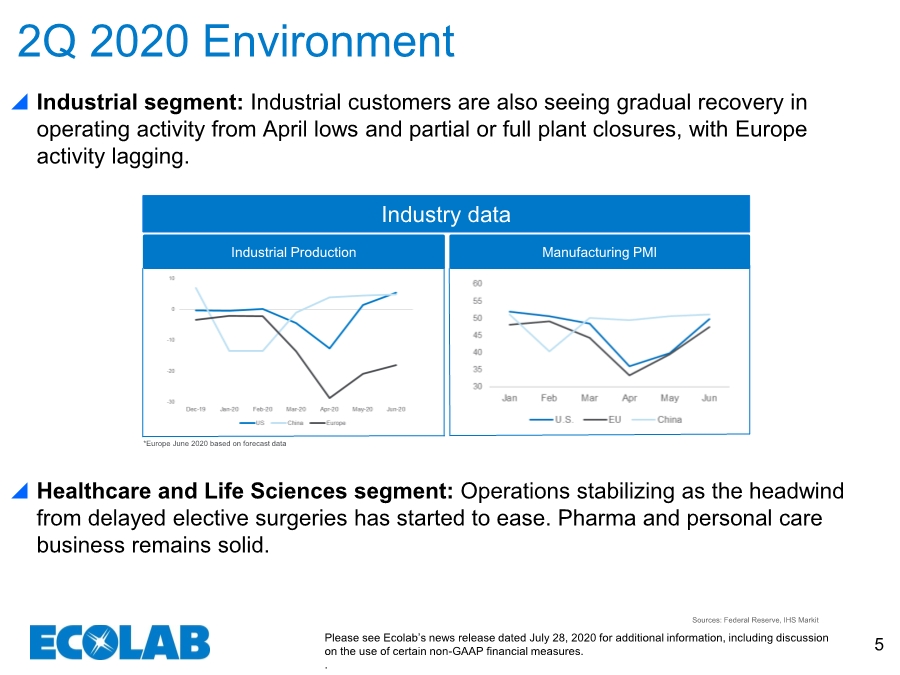
| Please see Ecolab’s news release dated July 28, 2020 for additional information, including discussion on the use of certain non-GAAP financial measures. . 5 2Q 2020 Environment Sources: Federal Reserve, IHS Markit Industrial segment: Industrial customers are also seeing gradual recovery in operating activity from April lows and partial or full plant closures, with Europe activity lagging. Healthcare and Life Sciences segment: Operations stabilizing as the headwind from delayed elective surgeries has started to ease. Pharma and personal care business remains solid. Industrial Production Industry data *Europe June 2020 based on forecast data Manufacturing PMI |
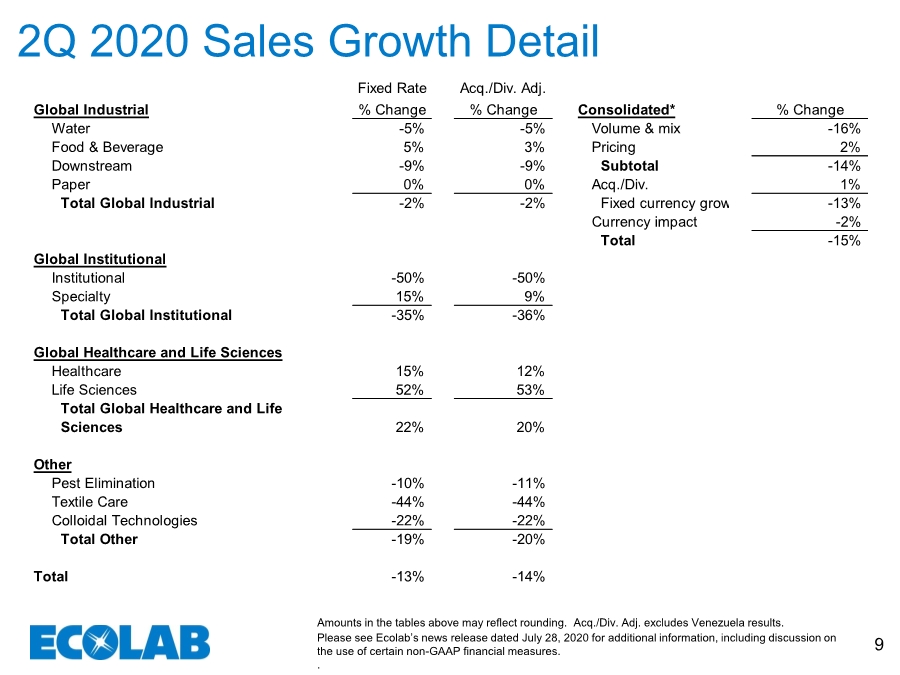
| Please see Ecolab’s news release dated July 28, 2020 for additional information, including discussion on the use of certain non-GAAP financial measures. . 6 Demand increased ▪ Life Sciences +53% acquisition adjusted led by strong vapor biodecontamination technology sales. Expect strong growth for full year. ▪ Healthcare +12% acquisition adjusted as increased cleaning and sanitizing more than offset reduced elective surgeries. Expect good full year growth. ▪ Specialty +9% acquisition adjusted as increased cleaning and sanitizing in groceries and quick serve more than offset slower quick service foot traffic. Expect good growth for full year. Demand similar ▪ Food & Beverage +3% acquisition adjusted as strong trends in food processing, further benefiting from increased cleaning and sanitizing, more than offset COVID-19 related plant and bar closures in beverage/brewing. Expect steady growth for full year. ▪ Water -5% as customer facility slowdowns/closures impacted April; reopenings led to moderate sequential improvement in the balance of the quarter. Expect full year sales to be similar to last year. ▪ Paper flat as board and tissue sales offset lower graphic paper. Expect flat growth for full year. Demand decreased ▪ Institutional -50% due to global closure of in-unit dining and weak lodging trends; we saw improvement as the quarter progressed as restaurants gradually reopened, while hotels and entertainment facilities are seeing a slower recovery. Expect sales to improve as the year progresses but full year sales will likely show a significant decline. ▪ Downstream -9% reflecting customer facility slowdowns/closures and lower transportation fuel demand in the quarter. Expect full year to show lower sales. ▪ Pest -11% acquisition adjusted as it reflected restaurant and hotel declines and growth in healthcare, quick service and food & beverage. Expect moderately lower sales for full year. 2Q 2020 Sales Comments |
| Please see Ecolab’s news release dated July 28, 2020 for additional information, including discussion on the use of certain non-GAAP financial measures. . 7 2H 2020 Comments Assuming a gradual, if uneven, recovery from the first half COVID- 19 impact, we expect a gradual sequential improvement from second quarter levels through the second half as our product and service innovation, investments in new hygiene and digital technologies, and successful sales initiatives augment a continuing recovery in customer activity. |
| Please see Ecolab’s news release dated July 28, 2020 for additional information, including discussion on the use of certain non-GAAP financial measures. . 8 2Q 2020 Results *See “Non-GAAP Financial Measures” section of this presentation for corresponding reconciliations. |
| Please see Ecolab’s news release dated July 28, 2020 for additional information, including discussion on the use of certain non-GAAP financial measures. . 9 2Q 2020 Sales Growth Detail Amounts in the tables above may reflect rounding. Acq./Div. Adj. excludes Venezuela results. Fixed Rate Acq./Div. Adj. Global Industrial % Change % Change Consolidated* % Change Water -5% -5% Volume & mix -16% Food & Beverage 5% 3% Pricing 2% Downstream -9% -9% Subtotal -14% Paper 0% 0% Acq./Div. 1% Total Global Industrial -2% -2% Fixed currency growth -13% Currency impact -2% Total -15% Global Institutional Institutional -50% -50% *Amounts above do not sum due to rounding. Specialty 15% 9% Total Global Institutional -35% -36% Global Healthcare and Life Sciences Healthcare 15% 12% Life Sciences 52% 53% Total Global Healthcare and Life Sciences 22% 20% Other Pest Elimination -10% -11% Textile Care -44% -44% Colloidal Technologies -22% -22% Total Other -19% -20% Total -13% -14% |
| Please see Ecolab’s news release dated July 28, 2020 for additional information, including discussion on the use of certain non-GAAP financial measures. . 10 2Q 2020 Income Statement / Margins (cont. ops.) *Public rates of exchange, except where noted. **See “Non-GAAP Financial Measures” section of this presentation for corresponding reconciliations. |
| Please see Ecolab’s news release dated July 28, 2020 for additional information, including discussion on the use of certain non-GAAP financial measures. . 11 2Q 2020 Balance Sheet / Cash Flow EBITDA and Adjusted EBITDA are non-GAAP measures. EBITDA is defined as the sum of earnings before interest, taxes, depreciation and amortization. Adjusted EBITDA is defined as the sum of EBITDA and special (gains) and charges impacting EBITDA. The inputs to EBITDA reflect the trailing twelve months of activity for the period presented. See “Non-GAAP Financial Measures” section of this presentation corresponding reconciliations. * Summary Balance Sheet (millions, unaudited) 2020 2019 (millions, unaudited) 2020 2019 Cash and cash eq. $1,369.0 $15.7 Short-term debt $534.9 $1,069.4 Accounts receivable, net 2,255.5 2,304.9 Accounts payable 1,087.7 1,081.1 Inventories 1,228.7 1,152.7 Other current liabilities 1,605.1 1,618.7 Other current assets 313.0 347.2 Current liabilities of discontinued operations - 358.5 Current assets of discontinued operations - 1,033.0 Long-term debt 6,752.0 5,986.7 PP&E, net 3,138.9 3,134.1 Pension/Postretirement 1,055.6 927.2 Goodwill and intangibles 8,779.1 8,532.7 Other liabilities 1,156.9 1,212.5 Other assets 998.2 931.8 Long-term liabilities of discontinued operations - 304.1 Long-term assets of discontinued operations - 3,375.5 Total equity 5,890.2 8,269.4 Total assets $18,082.4 $20,827.6 Total liab. and equity $18,082.4 $20,827.6 Selected Cash Flow items (millions, unaudited) 2020 2019 (unaudited) 2020 2019 Cash from op. activities $640.2 $764.3 Total Debt/Total Capital 55.3% 46.0% Depreciation 293.0 281.2 Net Debt/Total Capital 50.1% 46.0% Amortization 103.2 103.5 Net Debt/EBITDA(*) 2.4 2.7 Capital expenditures 250.6 340.5 Net Debt/Adjusted EBITDA(*) 2.2 2.6 June 30 June 30 Six Months Ended Selected Balance Sheet measures June 30 June 30 |
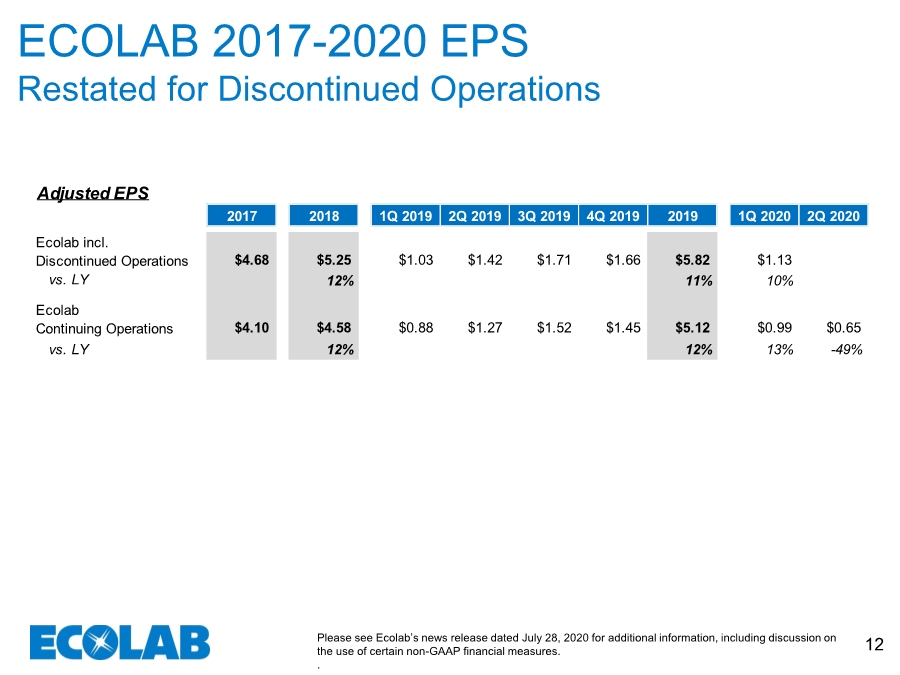
| Please see Ecolab’s news release dated July 28, 2020 for additional information, including discussion on the use of certain non-GAAP financial measures. . 12 ECOLAB 2017-2020 EPS Restated for Discontinued Operations Adjusted EPS 2017 2018 1Q 2019 2Q 2019 3Q 2019 4Q 2019 2019 1Q 2020 2Q 2020 Ecolab incl. Discontinued Operations $4.68 $5.25 $1.03 $1.42 $1.71 $1.66 $5.82 $1.13 vs. LY 12% 11% 10% Ecolab Continuing Operations $4.10 $4.58 $0.88 $1.27 $1.52 $1.45 $5.12 $0.99 $0.65 vs. LY 12% 12% 13% -49% |
| Please see Ecolab’s news release dated July 28, 2020 for additional information, including discussion on the use of certain non-GAAP financial measures. . 13 Appendix |
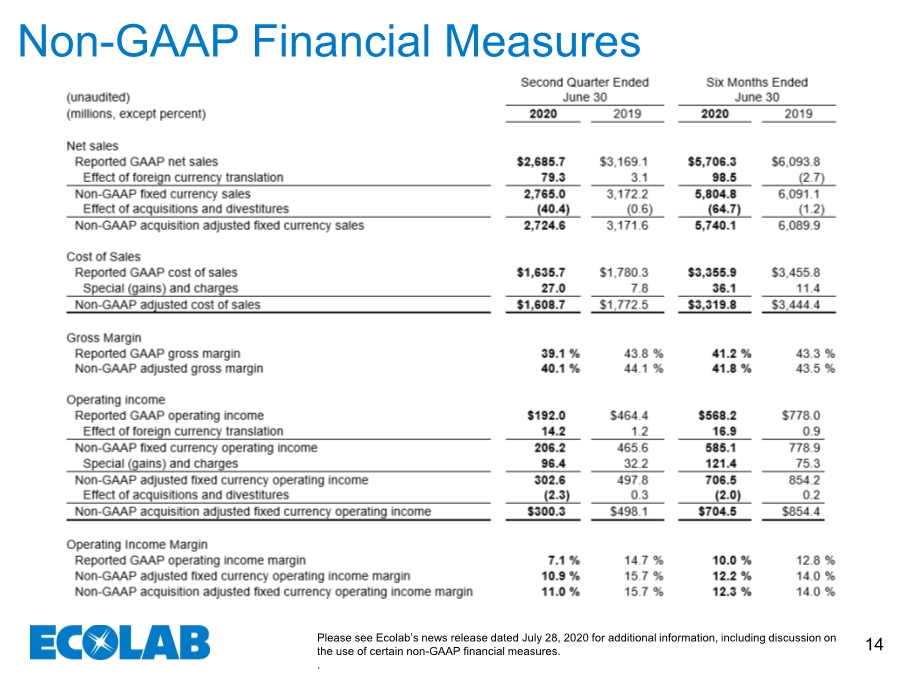
| Please see Ecolab’s news release dated July 28, 2020 for additional information, including discussion on the use of certain non-GAAP financial measures. . 14 Non-GAAP Financial Measures |
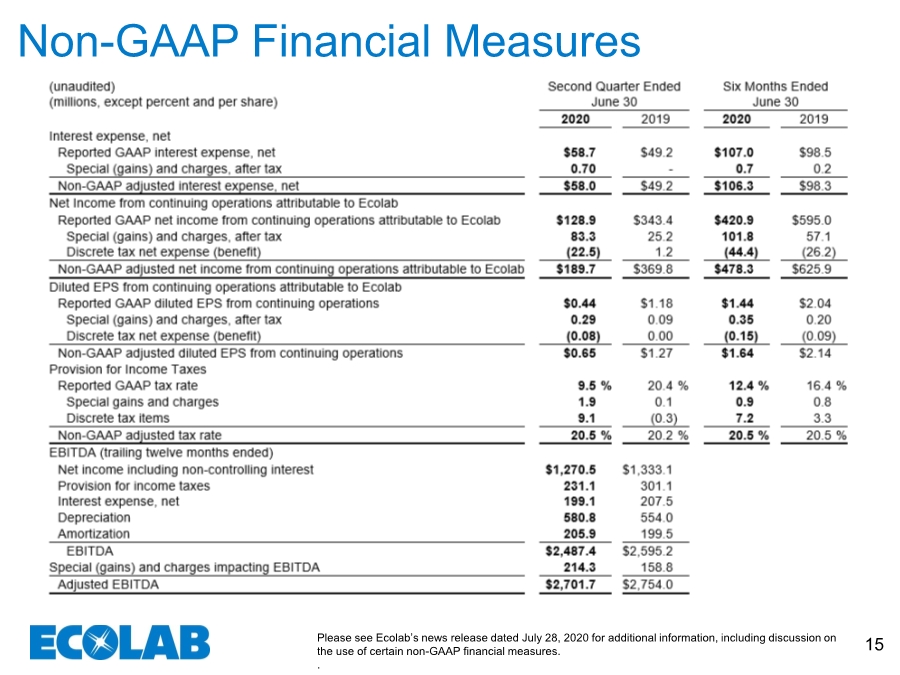
| Please see Ecolab’s news release dated July 28, 2020 for additional information, including discussion on the use of certain non-GAAP financial measures. . 15 Non-GAAP Financial Measures |
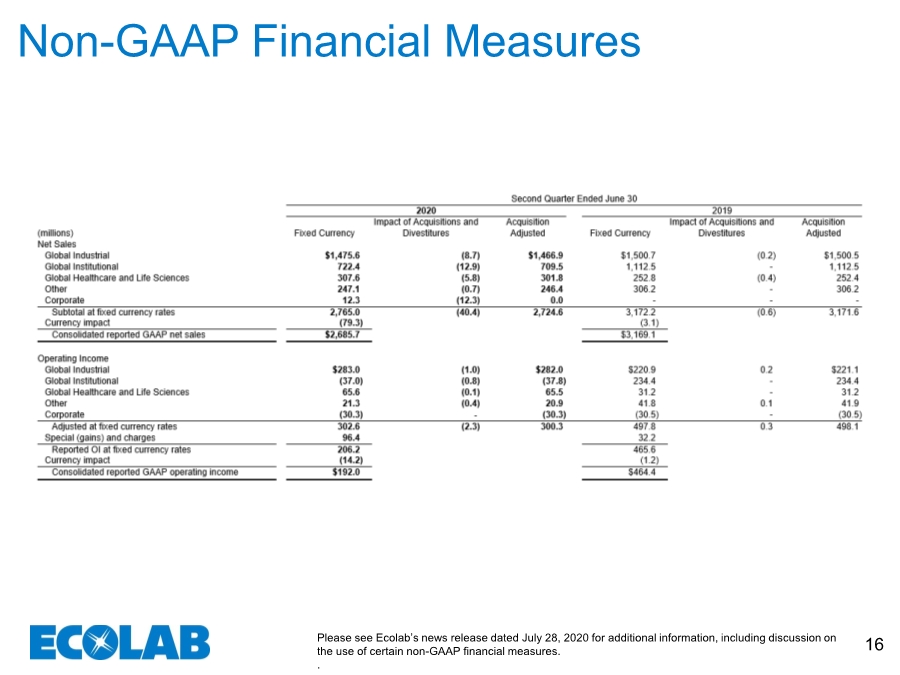
| Please see Ecolab’s news release dated July 28, 2020 for additional information, including discussion on the use of certain non-GAAP financial measures. . 16 Non-GAAP Financial Measures |
| Please see Ecolab’s news release dated July 28, 2020 for additional information, including discussion on the use of certain non-GAAP financial measures. . 17 Non-GAAP Financial Measures |