Attached files
| file | filename |
|---|---|
| EX-99.1 - EXHIBIT 99.1 - OCEANFIRST FINANCIAL CORP | ex991-earningsreleasejune2.htm |
| 8-K - 8-K - OCEANFIRST FINANCIAL CORP | ocfc8-kearningsrelease.htm |

. . . Exhibit 99.2 OceanFirst Financial Corp. Supplement to Q2 2020 Earnings Press Release July 23, 2020 . . .

SUPPLEMENT TO Q2 2020 EARNINGS .PRESS . . RELEASE Forward Looking Statements In addition to historical information, this presentation contains certain forward-looking statements within the meaning of the Private Securities Litigation Reform Act of 1995 which are based on certain assumptions and describe future plans, strategies and expectations of the Company. These forward-looking statements are generally identified by use of the words “believe,” “expect,” “intend,” “anticipate,” “estimate,” “project,” “will,” “should,” “may,” “view,” “opportunity,” “potential,” or similar expressions or expressions of confidence. The Company’s ability to predict results or the actual effect of future plans or strategies is inherently uncertain. Factors which could have a material adverse effect on the operations of the Company and its subsidiaries include, but are not limited to the following: changes in interest rates, general economic conditions, public health crises (such as the governmental, social and economic effects of the novel coronavirus), levels of unemployment in the Bank’s lending area, real estate market values in the Bank’s lending area, future natural disasters and increases to flood insurance premiums, the level of prepayments on loans and mortgage-backed securities, legislative/regulatory changes, monetary and fiscal policies of the U.S. Government including policies of the U.S. Treasury and the Board of Governors of the Federal Reserve System, the quality or composition of the loan or investment portfolios, demand for loan products, deposit flows, competition, demand for financial services in the Company’s market area, accounting principles and guidelines, the Bank’s ability to successfully integrate acquired operations and the other risks described in the Company’s filings with the Securities and Exchange Commission. These risks and uncertainties should be considered in evaluating forward-looking statements and undue reliance should not be placed on such statements. The Company does not undertake, and specifically disclaims any obligation, to publicly release the result of any revisions which may be made to any forward-looking statements to reflect events or circumstances after the date of such statements or to reflect the occurrence of anticipated or unanticipated events. Annualized, pro forma, projected and estimated numbers are used for illustrative purpose only, are not forecasts and may not reflect actual results. This presentation is not an offer to sell securities, nor is it a solicitation of an offer to buy securities in any locality, state, country or other jurisdiction where such distribution, publication, availability or use would be contrary to law or regulation or which would require any registration or licensing within such jurisdiction. Neither the Securities and Exchange Commission nor any other regulatory body has approved or disapproved of the securities of the Company or passed upon the accuracy or adequacy of the presentation. Any representation to the contrary is a criminal offense. Except as otherwise indicated, this presentation speaks as of the date hereof. The delivery of this presentation shall not, under any circumstances, create any implication that there has been no change in the affairs of the . . . Company after the date hereof. JULY | 2020 2 Data Classification: General Business

INVESTOR PRESENTATION . . . Commercial Forbearance Portfolio Over 90% of Commercial Forbearances Have Been Evaluated as of July 15, 2020 1st Forbearance Peak $1,240 M 64% of Commercial Clients Have Committed to Monthly Payments Beginning in Q3 Projected 2nd Forbearance Peak $500M 3/18/20 4/18/20 5/18/20 6/18/20 7/18/20 8/18/20 9/18/20 10/18/20 11/18/20 12/18/20 JULY | 2020 Note: Data based on the date of execution of a forbearance agreement 3 Data Classification: General Business The Second 90 Day Forbearance Periods Began in Late June

INVESTOR PRESENTATION . . . Consumer Forbearance Portfolio 1st Forbearance Peak $329 M Projected 2nd Forbearance Peak $237M 33% of Residential Mortgage Clients Have Committed to Monthly Payments Beginning in Q3 3/3/20 4/3/20 5/3/20 6/3/20 7/3/20 8/3/20 9/3/20 10/3/20 11/3/20 12/3/20 Note: Data based on the date of execution of a forbearance agreement The Second 90 Day Forbearance Periods Began in Early June JULY | 2020 4 Data Classification: General Business

SUPPLEMENT TO Q2 2020 EARNINGS .PRESS . . RELEASE Commercial Loan Forbearance Commercial Portfolio Forbearance Requests Total Outstanding Balance: $5.6bn Total Forbearance Requests: $1.2bn *WA LTV: 53.6% Forbearance requests are *WA DSCR: 2.09 well-secured and represent No delinquency (in life of loan): 71% 21% of commercial portfolio. Based on client commitments forbearance should decrease to 8.9% of the commercial portfolio during Q3. Forbearance Data as of July 15, 2020 JULY | 2020 *WA LTV and WA DSCR as of most recent financial review 5 Forbearance requests require credit approvalData Classification: General Business

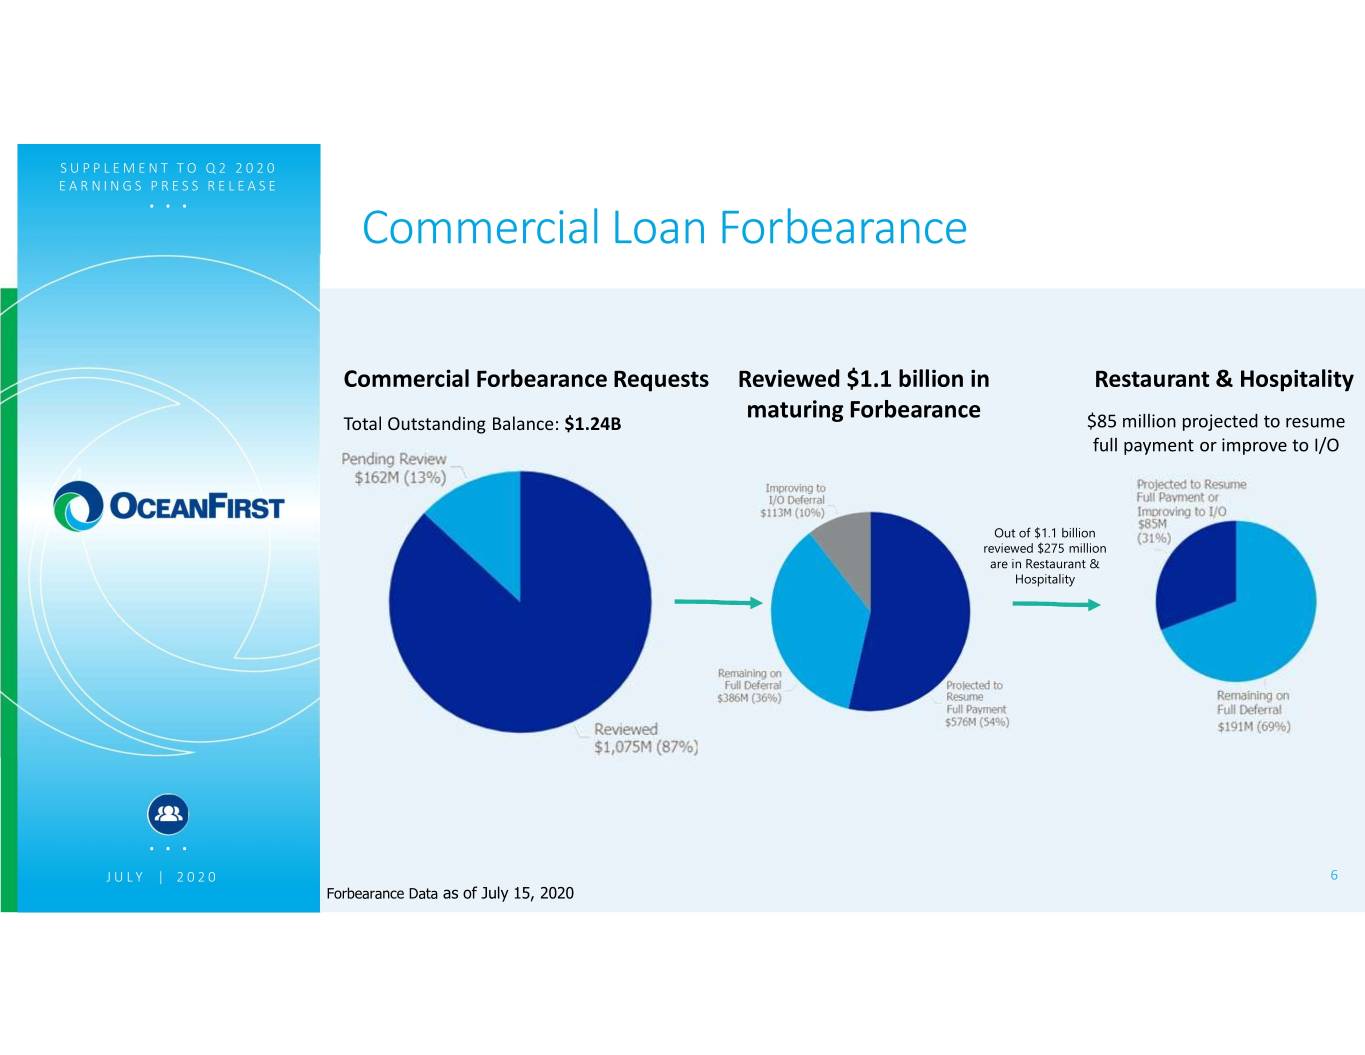
SUPPLEMENT TO Q2 2020 EARNINGS .PRESS . . RELEASE Commercial Loan Forbearance Commercial Forbearance Requests Reviewed $1.1 billion in Restaurant & Hospitality maturing Forbearance Total Outstanding Balance: $1.24B $85 million projected to resume full payment or improve to I/O Out of $1.1 billion reviewed $275 million are in Restaurant & Hospitality . . . JULY | 2020 6 Forbearance Data as of July 15, 2020 Data Classification: General Business

SUPPLEMENT TO Q2 2020 EARNINGS .PRESS . . RELEASE Commercial Loan Forbearance Forbearance requests are moderating 90Day Initial Forbearance Initial 180 Day . . . Forbearance Continuing JULY | 2020 7 Forbearance Data as of July 15, 2020 Data Classification: General Business

SUPPLEMENT TO Q2 2020 EARNINGS .PRESS . . RELEASE Residential and Consumer Loan Forbearance Consumer Forbearances Peaked at $329M on June 13, 2020 Residential & Consumer Portfolio 90 Day Forbearance Portfolio 180 Day Forbearance Portfolio Total Outstanding Balance: $2.8bn Total Outstanding Balance: $91M Total Outstanding Balance: $161M WA LTV: 70% WA LTV: 68% WA LTV: 70% WA FICO Score: 753 WA FICO Score: 734 As of forbearance request date Based upon customer commitments, it is estimated $30M, or 33%, of current 90 day forbearance requests will return to monthly JULY | 2020 payments in the 3rd Quarter. 8 Forbearance Data as of July 15, 2020 Data Classification: General Business

SUPPLEMENT TO Q2 2020 EARNINGS .PRESS . . RELEASE Residential and Consumer Loan Forbearance Each Forbearance period is 90 days, or a total of up to 180 days. 90Day Initial Forbearance Initial 180 Day . . . Forbearance Continuing JULY | 2020 9 Forbearance Data as of July 15, 2020 Data Classification: General Business

SUPPLEMENT TO Q2 2020 EARNINGS .PRESS . . RELEASE PPP Application Status Loans approved to date have an estimated fee income of approximately $17.6 million that will be earned over the life of the loan. . . . JULY | 2020 10 Data Classification: General Business

SUPPLEMENT TO Q2 2020 EARNINGS .PRESS . . RELEASE Loan Growth 471 504 110 416 8,400 7,951 ($'millions) March 31, 2020 PPP Originations Loan Originations Loan Sales Payoffs/Paydowns June 30, 2020 Note: Loan balances include loans held for sale. . . . JULY | 2020 11 Data Classification: General Business

SUPPLEMENT TO Q2 2020 EARNINGS .PRESS . . RELEASE Deposit Growth Initially utilized to build liquidity and fund PPP loans; terms of 6, 9, and 12 months at 1.15%. 291 281 8,968 504 7,892 ($'millions) March 31, 2020 PPP Brokered CDs Other Net Growth (1) June 30, 2020 (1) Other Net Growth – Growth driven by a new treasury relationship in New York with a WAR = 33 BP. . . . JULY | 2020 12 Data Classification: General Business

SUPPLEMENT TO Q2 2020 EARNINGS .PRESS . . RELEASE 2Q-20 NIM Contraction 3.52% 0.13% 0.06% 0.02% 0.07% 3.24% (%) Q1-20 NIM Excess 0.00%balance sheet Subordinated 0.00% debt PPP 0.00% loans Lower rate 0.00% environment Q2-20 NIM liquidity issuance Headwinds Tailwinds • Impact of surplus liquidity related to COVID-19 • Further opportunity to lower deposit costs • Additional funding costs related to the sub debt • Strong Loan-to-Deposit position issuance in May-20 • PPP loans added at an average yield of 2.81% . . . • Lower accretion levels related to purchase accounting expected in future quarters JULY | 2020 13 Data Classification: General Business

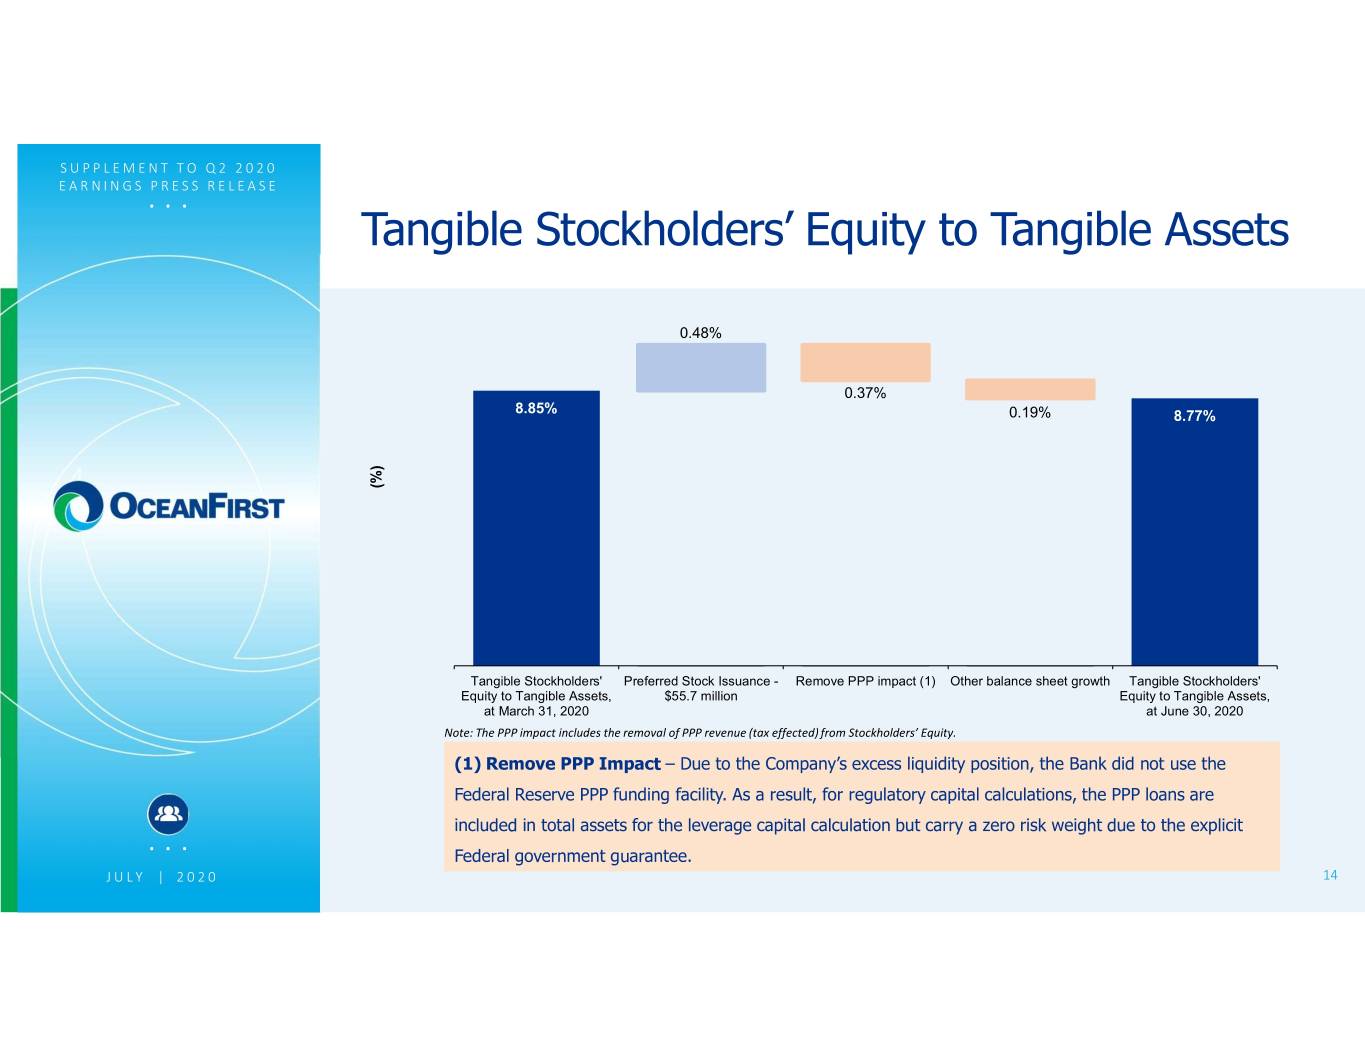
SUPPLEMENT TO Q2 2020 EARNINGS .PRESS . . RELEASE Tangible Stockholders’ Equity to Tangible Assets 0.48% 0.37% 8.85% 0.19% 8.77% (%) Tangible Stockholders' Preferred Stock Issuance - Remove PPP impact (1) Other balance sheet growth Tangible Stockholders' Equity to Tangible Assets, $55.7 million Equity to Tangible Assets, at March 31, 2020 at June 30, 2020 Note: The PPP impact includes the removal of PPP revenue (tax effected) from Stockholders’ Equity. (1) Remove PPP Impact – Due to the Company’s excess liquidity position, the Bank did not use the Federal Reserve PPP funding facility. As a result, for regulatory capital calculations, the PPP loans are included in total assets for the leverage capital calculation but carry a zero risk weight due to the explicit . . . Federal government guarantee. JULY | 2020 14 Data Classification: General Business

SUPPLEMENT TO Q2 2020 EARNINGS .PRESS . . RELEASE Investor Relations Inquiries Jill A. Hewitt Senior Vice President, Director of Investor Relations & Corporate Communications jhewitt@oceanfirst.com (732) 240-4500, ext. 7513 . . . JULY | 2020 15
