Attached files
| file | filename |
|---|---|
| EX-99.4 - EX-99.4 - Eastern Bankshares, Inc. | d846554dex994.htm |
| EX-23.3 - EX-23.3 - Eastern Bankshares, Inc. | d846554dex233.htm |
| EX-3.1 - EX-3.1 - Eastern Bankshares, Inc. | d846554dex31.htm |
| EX-1.2 - EX-1.2 - Eastern Bankshares, Inc. | d846554dex12.htm |
| EX-1.1 - EX-1.1 - Eastern Bankshares, Inc. | d846554dex11.htm |
Table of Contents
As filed with the Securities and Exchange Commission on July 23, 2020
Registration No. 333-239251
UNITED STATES
SECURITIES AND EXCHANGE COMMISSION
WASHINGTON, D.C. 20549
AMENDMENT NO. 1
TO
FORM S-1
REGISTRATION STATEMENT
UNDER
THE SECURITIES ACT OF 1933
Eastern Bankshares, Inc.
Eastern Bank 401(k) Plan
(Exact Name of Registrant as Specified in Its Charter)
| Massachusetts | 6712 | 84-4199750 | ||
| (State or Other Jurisdiction of Incorporation or Organization) |
(Primary Standard Industrial Classification Code) |
(I.R.S. Employer Identification Number) |
265 Franklin Street
Boston, MA 02110
(800) 327-8376
(Address, Including Zip Code, and Telephone Number, Including Area Code, of Registrant’s Principal Executive Offices)
Mr. Robert F. Rivers
Chief Executive Officer and
Chair of the Board of Directors
265 Franklin Street
Boston, MA 02110
(800) 327-8376
(Address, Including Zip Code, and Telephone Number, Including Area Code, of Agent for Service)
Copies to:
| Michael K. Krebs, Esq. Nutter, McClennen & Fish, LLP 155 Seaport Boulevard Boston, MA 02210 (617) 439-2000 |
Kathleen C. Henry, Esq. Executive Vice President, General Counsel and Corporate Secretary 265 Franklin Street Boston, MA 02110 (800) 327-8376 |
Lee A. Meyerson, Esq. Lesley Peng, Esq. Simpson Thacher & Bartlett LLP 425 Lexington Avenue New York, NY 10017 (212) 455-2000 |
Approximate date of commencement of proposed sale to the public: As soon as practicable after this registration statement becomes effective.
If any of these securities being registered on this Form are to be offered on a delayed or continuous basis pursuant to Rule 415 under the Securities Act of 1933, check the following box: ☒
If this Form is filed to register additional shares for an offering pursuant to Rule 462(b) under the Securities Act, please check the following box and list the Securities Act registration statement number of the earlier effective registration statement for the same offering: ☐
If this Form is a post-effective amendment filed pursuant to Rule 462(c) under the Securities Act, check the following box and list the Securities Act registration statement of the earlier effective registration statement for the same offering: ☐
If this Form is a post-effective amendment filed pursuant to Rule 462(d) under the Securities Act, check the following box and list the Securities Act registration statement number of the earlier effective registration statement for the same offering: ☐
Indicate by check mark whether the registrant is a large accelerated filer, an accelerated filer, a non-accelerated filer, or a smaller reporting company, or an emerging growth company. See the definitions of “large accelerated filer,” “accelerated filer,” “smaller reporting company,” and “emerging growth company” in Rule 12b-2 of the Exchange Act:
| Large accelerated filer | ☐ | Accelerated filer | ☐ | |||
| Non-accelerated filer | ☒ | Smaller reporting company | ☐ | |||
| Emerging growth company | ☒ | |||||
If an emerging growth company, indicate by check mark if the registrant has elected not to use the extended transition period for complying with any new or revised financial accounting standards provided pursuant to Section 7(a)(2)(B) of the Securities Act. ☐
CALCULATION OF REGISTRATION FEE
|
| ||||||||
| Title of each class of securities to be registered |
Amount to be registered |
Proposed maximum offering price per share |
Proposed maximum aggregate offering price |
Amount of registration fee(3) | ||||
| Common stock, $0.01 par value per share |
210,084,636 | $10.00 | $2,100,846,360(1) | $272,689.86 | ||||
| Participation interests(2) |
11,141,591 | |||||||
|
| ||||||||
|
| ||||||||
| (1) | Estimated solely for the purpose of calculating the registration fee. |
| (2) | The securities of Eastern Bankshares, Inc. to be purchased by the Eastern Bank 401(k) Plan are included in the amount shown for common stock. Accordingly, in accordance with Rule 457(h)(2), no separate fee is required for the participation interests. |
| (3) | Previously paid. |
The registrant hereby amends the registration on such date or dates as may be necessary to delay its effective date until the registrant shall file a further amendment which specifically states that this registration statement shall thereafter become effective in accordance with Section 8(a) of the Securities Act of 1933 or until the registration statement shall become effective on such date as the Securities and Exchange Commission, acting pursuant to said Section 8(a), may determine.
Table of Contents
The information in this preliminary prospectus is not complete and may be changed. We may not sell these securities until the registration statement filed with the Securities and Exchange Commission is effective. This preliminary prospectus is not an offer to sell these securities and it is not soliciting offers to buy these securities in any state or other jurisdiction where the offer or sale is not permitted.
SUBJECT TO COMPLETION, DATED JULY 23, 2020
SUBSCRIPTION AND COMMUNITY
OFFERING PROSPECTUS

(Proposed holding company for Eastern Bank)
Up to 175,375,000 shares of common stock
(Subject to increase to up to 201,681,250 shares)
Eastern Bankshares, Inc., a Massachusetts corporation, is offering shares of common stock for sale in connection with the conversion of Eastern Bank Corporation, a mutual holding company, from the mutual to the stock form of organization. Eastern Bankshares, Inc. has never offered common stock for sale to the public, and consequently, there is no trading market for our common stock. We expect to list our common stock on the Nasdaq Global Select Market under the symbol “EBC.” We are an “emerging growth company” as defined in the Jumpstart Our Business Startups Act of 2012.
We are offering up to 175,375,000 shares of common stock for sale at $10.00 per share on a best efforts basis. We may sell up to 201,681,250 shares of common stock because of demand for the shares or changes in market conditions, without resoliciting subscribers. We must sell a minimum of 129,625,000 shares in order to complete the offering.
Upon the completion of the offering, we intend to donate to our charitable foundation, the Eastern Bank Charitable Foundation, a number of shares of our common stock equal to 4% of the shares that will be outstanding immediately after that donation.
The shares of common stock are first being offered in a “subscription offering” to eligible depositors and tax-qualified employee benefit plans of Eastern Bank, as well as employees, officers, trustees, directors and corporators of Eastern Bank, Eastern Insurance Group LLC, Eastern Bankshares, Inc. and Eastern Bank Corporation. Shares not purchased in the subscription offering may be offered for sale to the general public in a “community offering,” with a preference given to residents of the communities served by Eastern Bank. Any shares of common stock not purchased in the subscription or community offerings may be offered to the public through a syndicate of broker-dealers, referred to in this prospectus as the “syndicated offering.” The syndicated offering may commence before the subscription and community offerings (including any extensions) have expired. However, no shares purchased in the subscription offering or the community offering will be issued until the completion of any syndicated offering. In this prospectus, we refer to the subscription, community and syndicated offerings collectively as the “offering.”
The minimum order is 25 shares. Generally, no individual may purchase more than 200,000 shares. The subscription and community offerings are expected to expire at 2:00 p.m., Eastern Time, on [EXPIRATION DATE]. We may extend this expiration date without notice to you until [EXTENSION DATE]. Once submitted, orders are irrevocable unless the subscription and community offerings are terminated or extended, with regulatory approval, beyond [EXTENSION DATE], or the number of shares of common stock to be sold is increased to more than 201,681,250 shares or decreased to less than 129,625,000 shares. If the subscription and community offerings are extended past [EXTENSION DATE], all subscribers will be notified and given an opportunity to confirm, change or cancel their orders. If you do not respond to this notice, we will promptly return your funds with interest or cancel your deposit account withdrawal authorization. If the number of shares to be sold in the offering is increased to more than 201,681,250 shares or decreased to less than 129,625,000 shares, we will resolicit subscribers, and all funds delivered to us to purchase shares of common stock in the subscription and community offerings will be returned promptly with interest. Funds received in the subscription and the community offerings will be held in a segregated account at Eastern Bank and will earn interest at 0.02% per annum until completion or termination of the offering.
We have engaged Keefe, Bruyette & Woods, Inc. to be our selling agent, assisting us in selling the shares on a best efforts basis in the subscription and community offerings. J.P. Morgan Securities LLC is serving generally as our capital markets advisor. J.P. Morgan Securities LLC and Keefe, Bruyette & Woods, Inc. will serve as joint book-running managers for any syndicated offering. Neither Keefe, Bruyette & Woods, Inc. nor J.P. Morgan Securities LLC is required to purchase any shares of common stock that are sold in the offering.
OFFERING SUMMARY
Price: $10.00 per Share
| Minimum | Midpoint | Maximum | Adjusted Maximum |
|||||||||||||
| Number of shares |
129,625,000 | 152,500,000 | 175,375,000 | 201,681,250 | ||||||||||||
| Gross offering proceeds |
$ | 1,296,250,000 | $ | 1,525,000,000 | $ | 1,753,750,000 | $ | 2,016,812,500 | ||||||||
| Estimated offering expenses, excluding selling agent fees and expenses |
$ | 10,577,000 | $ | 10,577,000 | $ | 10,577,000 | $ | 10,577,000 | ||||||||
| Estimated selling agent fees and expenses and underwriters’ compensation (1) |
$ | 23,364,979 | $ | 27,349,042 | $ | 31,333,104 | $ | 35,914,776 | ||||||||
|
|
|
|
|
|
|
|
|
|||||||||
| Estimated net proceeds |
$ | 1,262,308,021 | $ | 1,487,073,958 | $ | 1,711,839,896 | $ | 1,970,320,724 | ||||||||
|
|
|
|
|
|
|
|
|
|||||||||
| Estimated net proceeds per share |
$ | 9.74 | $ | 9.75 | $ | 9.76 | $ | 9.77 | ||||||||
| (1) | Assumes 80% of shares are sold in the subscription and community offerings and 20% of shares are sold in the syndicated offering, and includes reimbursement of selling agent’s expenses. See the section of this prospectus titled “Pro Forma Data” and “The Conversion and Offering—Plan of Distribution; Selling Agent and Underwriter Compensation” for information regarding compensation to be received by Keefe, Bruyette & Woods, Inc. and J.P. Morgan Securities LLC in the subscription and community offerings and the compensation to be received by J.P. Morgan Securities LLC, Keefe, Bruyette & Woods, Inc., and other participating broker-dealers in the syndicated offering. If all shares are sold in the syndicated offering, excluding those purchased by our insiders and by our employee stock ownership plan and donated to our charitable foundation, for which no selling agent fee will be paid, the selling agent fees and expenses would be approximately $64.7 million, $77.3 million, $88.8 million and $102.1 million at the minimum, midpoint, maximum, and adjusted maximum of the offering range, respectively. |
This investment involves a degree of risk, including the possible loss of principal.
Please read “Risk Factors ” beginning on page 19.
Shares of our common stock are not deposits or accounts and are not insured or guaranteed by the Federal Deposit Insurance Corporation, or any other government agency. None of the Securities and Exchange Commission, the Board of Governors of the Federal Reserve System, the Massachusetts Commissioner of Banks, the Federal Deposit Insurance Corporation, nor any state securities regulator has approved or disapproved of these securities or determined if this prospectus is accurate or complete. Any representation to the contrary is a criminal offense.

For assistance, please contact the Stock Information Center at [stock center number].
The date of this prospectus is [prospectus date].
Table of Contents

Table of Contents
| 1 | ||||
| 19 | ||||
| 48 | ||||
| 50 | ||||
| 66 | ||||
| 67 | ||||
| 69 | ||||
| 70 | ||||
| 71 | ||||
| 72 | ||||
| 74 | ||||
| 80 | ||||
| MANAGEMENT’S DISCUSSION AND ANALYSIS OF FINANCIAL CONDITION AND RESULTS OF OPERATIONS |
81 | |||
| 121 | ||||
| 132 | ||||
| 143 | ||||
| 145 | ||||
| 152 | ||||
| 153 | ||||
| 161 | ||||
| 162 | ||||
| 180 | ||||
| 183 | ||||
| 187 | ||||
| 188 | ||||
| 189 | ||||
| 189 | ||||
| 190 | ||||
| F-1 | ||||
i
Table of Contents
The following summary explains material information in this prospectus. It may not contain all of the information that is important to you. Before making an investment decision, you should read this entire document carefully, including the consolidated financial statements and the notes thereto, and the section titled “Risk Factors.”
In this prospectus, the terms “we,” “our,” “us,” “Eastern” and “company” refer collectively to Eastern Bank Corporation, Eastern Bankshares, Inc., Eastern Bank and Eastern Insurance Group LLC unless the context indicates another meaning. Any reference in this prospectus to the term the “Bank” refers to Eastern Bank, and any reference to the “Foundation” refers to the Eastern Bank Charitable Foundation. Any reference in this prospectus to the term “offering” refers to the offering of Eastern Bankshares, Inc. common stock in the subscription, community and syndicated offerings described in this prospectus.
The Companies; Our Business
Eastern Bankshares, Inc. is a Massachusetts corporation formed in 2020 to conduct the offering. Upon completion of the offering, Eastern Bankshares, Inc. will own all of Eastern Bank’s capital stock, and through Eastern Bank and its wholly owned subsidiary Eastern Insurance Group LLC, Eastern Bankshares, Inc. will provide a variety of banking, trust and investment, and insurance services. Eastern Bankshares, Inc. currently does not intend to engage in any material business activity other than those relating to owning all of the capital stock of Eastern Bank. (Please refer to the section of this prospectus titled “The Conversion and Offering—Reorganization of Eastern Immediately Prior to Completion of Offering” for a description of the reorganization of Eastern that will occur simultaneously with the completion of the offering.)
Eastern Bankshares, Inc.’s executive offices are located at 265 Franklin Street, Boston, MA 02110, and its telephone number is 1.800.EASTERN (1.800.327.8376).
The historical financial data presented in this prospectus are derived from the financial statements of Eastern Bank Corporation, including Eastern Bank Corporation’s audited consolidated financial statements as of and for the years ended December 31, 2019 and 2018 and Eastern Bank Corporation’s unaudited consolidated financial statements as of and for the three months ended March 31, 2020 and 2019. The section of this prospectus titled “Recent Developments” includes certain unaudited financial data of Eastern Bank Corporation as of and for the six months ended June 30, 2020.
Eastern Bank is a Massachusetts-chartered bank headquartered in Boston that has served our community for over 200 years. Founded in 1818 as a local savings bank, we have evolved over the years into a diversified commercial bank, providing a broad array of products and services to retail, commercial and small business customers. We operate primarily in the greater Boston market with 89 banking offices located in eastern Massachusetts and southern and coastal New Hampshire. We have two business segments: banking and insurance agency operations. As of March 31, 2020, we had consolidated total assets of $12.3 billion, total gross loans of $9.1 billion, total deposits of $10.3 billion and total stockholders’ equity of $1.7 billion.
Our mission is to invest in our customers, communities and colleagues to help them prosper and grow. We pride ourselves on understanding our customers’ financial needs and delivering a diverse suite of tailored, high-quality solutions through a consultative approach that fosters long-term relationships. We have stayed true to our communities since 1818, especially over the last few decades through the generosity of the Eastern Bank Charitable Foundation and the robust volunteerism of our talented employees. We consistently invest in our colleagues and believe our diverse and inclusive workforce is crucial to our success. Overall, we like to think of ourselves as good people, doing good things to help people prosper.
We believe that, as a result of our differentiated approach to banking, we have established a distinctive brand and reputation in the market, contributing to Eastern having the greatest share of deposits in the Boston market for any full-service bank headquartered in Boston. (Based upon the most currently available FDIC data as of June 30, 2019, our total deposits of $8.7 billion represented 2.4% of the Boston market.) We believe our focus on long-term client
1
Table of Contents
relationships contributes to our stable, low-cost deposit base, and that our long-term presence in the market enables us to prudently underwrite and originate high-quality assets and deliver more stable returns. In addition, we believe these benefits from our focus on long-term client relationships position us well for times of stress and allow us to successfully manage through the full range of economic cycles.
For the quarter ended March 31, 2020 our annualized return on average assets was 0.29% driven by a net interest margin of 0.94%, cost of total deposits of 0.23% and fee income as a percent of revenue of 29.49%. At March 31, 2020, our ratio of common equity tier 1 capital to total assets, which we refer to as our “CET1 ratio,” was 12.42%, and our ratio of net loans to deposits was 87.03%. We are committed to expanding our business in a disciplined manner with a long-term perspective. We believe that we have prudently grown our business over the past five years, with a focus on transaction deposits and loans to commercial clients. For the five-year period from January 1, 2015 through December 31, 2019, our checking accounts (our primary relationship deposit product) grew from $4.2 billion to $5.3 billion, representing a compounded annual growth rate of 5.2%, and our commercial loans (our primary strategic focus for loan growth) grew from $4.1 billion to $6.2 billion, representing a compounded annual growth rate of 8.6%.
Our diversified products and services include lending, deposit, wealth and insurance products. Deposits obtained through our branch banking network have traditionally been the principal source of funds for use in lending and for other general business purposes. We offer a range of demand deposits, interest checking, money market accounts, savings accounts, and time certificates of deposit. Our lending focuses on the following loan categories: commercial and industrial (including our Asset Based Lending Portfolio), commercial real estate, commercial construction, small business banking, residential real estate, and home equity loans. Through Eastern Bank’s wealth management offering, we provide a wide range of trust services. Eastern Insurance Group LLC, a wholly owned subsidiary of Eastern Bank, acts as an agent in offering insurance solutions for clients with personal, commercial or employee benefits-related insurance needs. Eastern Insurance Group LLC operates through 22 non-branch offices located primarily in eastern Massachusetts.
Our website address is www.easternbank.com. Information on this website is not and should not be considered a part of this prospectus.
Eastern Insurance Group LLC, a wholly owned subsidiary of Eastern Bank, acts as an agent in offering property and casualty as well as life and health insurance to both personal and commercial customers. Personal lines insurance products include life, accident and health, automobile, and property and liability insurance including fire, condominium, home and tenants, among others. Commercial insurance products include group life and health, commercial property and liability, surety, and workers compensation insurance, among others. Eastern Insurance Group LLC operates through 22 non-branch offices in Eastern Massachusetts, one office in Keene, New Hampshire, and one office in Providence, Rhode Island. From 2004 through 2018, we expanded Eastern Insurance Group LLC by acquiring 31 independent insurance agencies, having average revenue of $1.4 million.
Regulation and Supervision
Upon the completion of the offering, Eastern Bankshares, Inc. will be subject to regulation and supervision by the Board of Governors of the Federal Reserve System, which we refer to as the Federal Reserve Board. The activities of Eastern Bank are subject to regulation and supervision by the Federal Deposit Insurance Corporation, which we refer to as the FDIC, and the Consumer Financial Protection Bureau, which we refer to as the CFPB. Eastern Bank is also subject to various Massachusetts and New Hampshire business and banking regulations, and supervision by the Massachusetts Commissioner of Banks. In addition, Eastern Bankshares, Inc. will be subject to various Massachusetts business and banking regulations. Our insurance agency, Eastern Insurance Group LLC, is subject to regulation and supervision by the Massachusetts Division of Insurance, and various state insurance regulatory authorities in other states that license, regulate and supervise insurance producers, brokers and agents. Upon the completion of the offering, we expect that Eastern Bankshares, Inc. common stock will be listed for trading on the Nasdaq Global Select Market (“Nasdaq”) and will be subject to the rules thereof for listed companies.
2
Table of Contents
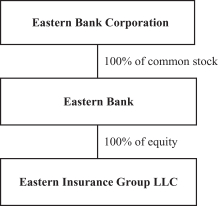
Our Organizational Structure and the Proposed Offering
The following diagram shows our current organizational structure.
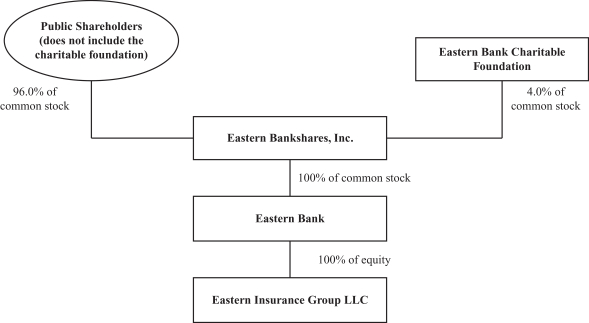
The following diagram shows our organizational structure immediately following the offering and our donation of shares of our common stock to the Eastern Bank Charitable Foundation.
Our Competitive Strengths
Abiding commitment to long-term, customer-centric relationships. We pride ourselves on understanding our customers’ financial needs and delivering a diverse suite of tailored, high-quality solutions through a consultative approach that fosters long-term relationships. We have served our communities for over 200 years, evolving from a traditional mutual savings bank serving a relatively narrow geographic region northeast of Boston to a full-service commercial bank with a presence across eastern Massachusetts and southern New Hampshire. We believe that over time we have developed long-standing customer relationships and established a distinctive brand, which emphasizes our commitment to our community and social activism.
Well-positioned in attractive greater Boston market. The Boston Metropolitan Statistical Area is one of the largest banking markets in the country with a high concentration of affluent, highly-educated individuals and
3
Table of Contents
successful businesses. It has a diverse and vibrant business community supported by world class higher education institutions. We believe we have distinguished ourselves in the market through our distinctive approach to banking, notably our focus on customers, commitment to community and diversity of our workforce. Our strong brand, reputation and client relationships have become key drivers of our performance in the market.
Stable, low-cost deposit base. We believe our business model of fostering deep client relationships and our long-standing position in our communities allows us to attract deposit customers that are focused on more than just price. As a result, we have a stable, low-cost deposit base. Our average cost of total deposits for the quarter ended March 31, 2020 was 0.23% compared to 0.84% for the peer group used by RP Financial, LC for purposes of its independent valuation discussed elsewhere in this prospectus. Our funding advantage and deep client relationships enable us to prudently deploy our liquidity into high-quality loans and generate attractive returns. Generally, we do not take brokered deposits.
Strong capital and liquidity position. At March 31, 2020, our CET1 ratio was 12.42%, and our cash and securities as a percentage of assets was 18.77%. On a pro forma basis, giving effect to the offering and the proposed use of proceeds discussed elsewhere in this prospectus, we will be the most well-capitalized and most liquid bank in the peer group used by RP Financial, LC in its appraisal. Assuming an offering at the mid-point of the valuation range, our pro forma CET1 ratio of 24.52% will be 263 bps above the next most well-capitalized bank in that peer group as of March 31, 2020. We believe our strong capital position will serve as a strong foundation in a period of significant economic uncertainty like we are experiencing today, providing us the financial flexibility to continue to invest in our businesses and execute on our strategic initiatives. A large proportion of our balance sheet will be comprised of highly liquid assets, which will allow us to continue to meet customer liquidity and funding needs in times of stress.
Disciplined underwriting and risk management. We focus on originating high-quality loans for our clients, which we believe generate stable returns. We believe our experienced credit risk professionals and conservative credit culture, combined with centralized processes and consistent underwriting standards, have generally allowed us to maintain high asset quality. We believe we have positioned the company to successfully navigate a wide range of credit and interest rate environments, including the current uncertain economic environment due to the Covid-19 pandemic and current low interest rates. We have long maintained a diversified loan portfolio with limited industry or property type concentrations. Our loans to borrowers engaged in various wholesale trade businesses, including household appliances, alcoholic beverage wholesalers, and grocery wholesalers, represent the largest concentration among our commercial borrowers, constituting 12% of our commercial portfolio at March 31, 2020. Our largest property type concentration in our commercial real estate portfolio as of March 31, 2020 is multi-family at 19%.
Culture of technological innovation. We believe our ability to innovate and integrate new products, services and technology distinguishes us from many of our similarly-sized peers. Important to our development and refinement of technology-driven products and services in recent years has been customizing the interface between our customers and our outsourced core data processing systems. By customizing the software that connects our digital platforms to our core system, we believe we are able to develop, test and deploy new features and products more quickly than many of our peers. In addition, during the Covid-19 global pandemic, we were able to quickly transition more than half our workforce to work remotely, with our technology team working closely with senior management to ensure that systems and applications were in place to support a secure remote work environment while meeting an unprecedented surge in customer needs.
Experienced management team supported by a high-performing and diverse workforce. We believe that we have a highly experienced leadership team with deep roots in our markets, which on average has 30.9 years of experience working in banking or the financial services sector, has successfully operated through the full range of economic cycles. Complementing their experience at Eastern, most of our executive officers have had prior management experience at other leading companies and institutions, including publicly-traded banking companies. Our leadership team is supported by a high quality, highly motivated, diverse set of managers and employees committed to delivering a strong customer value proposition. We are recognized as an employer of choice by providing employees with opportunities for advancement and growth in an attractive business environment.
Commitment to communities. We believe our strong commitment to our communities provides a competitive advantage by strengthening customer relationships and increasing loyalty. The communities in our footprint are one of our three core constituencies (along with our colleagues and customers). We support our communities in a number of
4
Table of Contents
ways, including: through extensive employee volunteer efforts; through our donations to the Eastern Bank Charitable Foundation, a private foundation we formed in 1994; through executives providing board leadership to community organizations; and through the Bank’s social justice advocacy work. The Eastern Bank Charitable Foundation, which had total assets of $111.8 million as of March 31, 2020, funds a range of non-profit organizations serving our communities and creates partnerships with other organizations to “scale up” key initiatives (such as enhancing early childhood education). For the three-year period ended December 31, 2019, the Eastern Bank Charitable Foundation’s annual charitable donations averaged approximately $7.6 million. Our stock donation to the Foundation upon completion of the offering will allow the Foundation, and indirectly the communities that we serve, both now and in the future, to share in our long-term growth.
Our commitment to our community also is reflected in Eastern Bank’s latest FDIC CRA rating, which was “Outstanding.”
Business Strategy
Our goal is to enhance our position as one of the leading community banking institutions in our market, providing a broad array of banking and other financial services to retail, commercial and small business customers. In recent years, we have focused significant effort on and invested heavily in our infrastructure to create sophisticated and competitive products and services, a strong, experienced work force and awareness of our banking brand.
As a result, we believe we are well positioned to capitalize on the opportunities available in our market by focusing on the following core strategies.
Develop new customer relationships and deepen existing relationships. We seek to expand our market share in existing and contiguous markets across our businesses by leveraging our distinctive brand and delivering a diverse suite of tailored, high-quality solutions through a consultative, relationship-based approach reinforced by superior customer service. We believe this will result in disciplined growth of low-cost deposits, loans with attractive risk-adjusted returns and a steady stream of fee income. Our relationship-based approach has enabled us to achieve disciplined organic growth over time, and we expect this trend to continue. We believe our support of our small business and non-profit customers in obtaining funding in April and May 2020 under the Paycheck Protection Program, also known as “PPP,” demonstrates both our commitment and capacity to meet our customers’ needs, even in the most challenging circumstances. The Small Business Administration, or “SBA,” approved all applications for PPP funding across the nation on a “first come, first served” basis. We believe that our experience as the largest SBA lender in New England made us effective in helping a large number of our customers avail themselves of the very attractive PPP terms. Through June 30, 2020, we originated approximately 8,100 PPP loans, representing $1.1 billion of aggregate PPP loans. The vast majority of our PPP borrowers are existing commercial and small business borrowers, non-profit customers, retail banking customers and clients of Eastern Wealth Management and Eastern Insurance Group LLC. Please refer to the section of this prospectus titled “Recent Developments” for additional information regarding our PPP loans as of June 30, 2020.
Pursue opportunistic acquisitions. We intend to prudently pursue opportunities to acquire banks in our existing and contiguous markets that create attractive financial returns. Our focus will primarily be on franchises that enhance our funding profile, product capabilities or geographic density, while maintaining an acceptable risk profile. We believe the vital need to make increasingly significant technological investments has greatly amplified the importance of scale in banking. In addition, we believe that the current economic recession will increase the rate of consolidation in the banking industry. We believe that after the offering we will be well-positioned as a consolidator in the banking market because of our financial strength, reputation and culture. In addition, we intend to continue to pursue opportunistic acquisitions of additional insurance agencies in existing and contiguous markets.
Leverage technology to enhance customer experience and drive operating efficiencies. We have made significant investments in our technology to ensure we can deliver high-quality, innovative products and services to our customers. For example, we have recently upgraded our Mobile Banking platform for both consumer and commercial customers. In addition, we have continued investing in our new commercial lending origination system and platform, and we intend to progressively improve our consumer lending origination platform as well. We are committed to
5
Table of Contents
regularly investing in technology and data analytics, as we are positioning our franchise for the future. We believe these investments will differentiate us with our target customers and provide a scalable platform, which will generate significant operating leverage as we grow over time.
Maintain and grow our experienced, diverse and customer focused employee base. We have an established corporate culture based on personal accountability, high ethical standards and a commitment to training and career development. We will look to opportunistically hire talented bankers and employees with a continued emphasis on recruiting highly motivated, diverse managers and employees who can establish and maintain long-term customer relationships that are key to our business, brand and culture.
Manage risk to navigate a range of economic environments, including the current Covid-19 pandemic recession. We believe that our conservative credit culture, strong capital and liquidity position and our deep client relationships are key to our long-term financial success. We believe that stable long-term growth and profitability are the result of building strong customer relationships one at a time while maintaining superior credit discipline. We supplement our conservative risk culture with a rigorous and continuous enterprise risk management program. The current Covid-19 pandemic recession is resulting in material uncertainty in the near- and medium-term future. In addition, a sustained period of low interest rates will put pressure on our net interest margin. We believe we are entering this period of stress from a position of strength, which allows us to maintain a strong balance sheet while still supporting our customers and communities in need.
Reasons for the Offering
Our strategic objective for many years has been to evolve over time into one of the leading banking institutions in our market by concentrating on achieving disciplined, profitable growth in our core business lines while maintaining an abiding commitment to our customers, colleagues and communities. Profitable growth provides us with the flexibility to pursue strategic acquisitions as opportunities arise and to make additional technological, risk management and talent investments.
We believe the additional capital provided by the offering will, when added to our existing well-capitalized balance sheet, give us a strong foundation that in the near-term will help us to remain resilient while the regional, national and global economies recover from the recession caused by Covid-19 pandemic and over the longer-term allow us to accelerate our growth—principally by:
Enhancing our capital and liquidity position to increase our resiliency in the short-term and to provide a foundation for long-term future growth. By substantially increasing our regulatory capital and liquidity, the offering will enhance our capacity to build and maintain credit reserves in the near term while maintaining the financial flexibility to support all of our stakeholders, including by continuing to work constructively with our borrowers adversely affected by the Covid-19 recession, offering payment deferrals, loan modifications and, where prudent, additional lines of credit to our business customers with proven track records. Over the longer-term, the substantial increase in our regulatory capital and liquidity will provide a foundation for us to renew our focus on pursuing profitable loan and deposit growth through disciplined organic growth in our core business lines consistent with our overarching goal of serving more people, businesses and communities for many more generations.
Enhancing our ability to make investments in new technologies to meet the ever-increasing customer demands for “ease of use” of banking and financial services. As we anticipate the competitive landscape that will emerge after our economy recovers from the negative impacts of the Covid-19 pandemic, we believe the most significant systemic challenge we will face is the accelerating pace of technological change driven by ubiquitous digital adoption by both consumer and commercial banking customers. We believe this trend has greatly amplified the importance of scale in banking, and the increasing benefit of scale exacerbates the challenge of competing with significantly larger banks and large information technology and e-commerce companies. The capital raised in the offering will allow us to increase our investments in new technologies to develop and implement an increasingly sophisticated array of banking and other financial services for retail, small business and commercial customers to meet the ever-increasing customer expectations for “ease of use” of banking and financial services and products.
6
Table of Contents
Better positioning us to pursue opportunistic strategic transactions within our existing and contiguous markets and through digital delivery channels. We believe the additional capital raised in the offering, coupled with our structure as a publicly-traded company, will make us a more attractive and competitive bidder for mergers and acquisitions of other financial institutions or business lines as opportunities arise. We will be able to structure business combinations using stock, cash or a combination of both. We believe that the current economic recession will increase the rate of consolidation in the banking industry. We have completed seven bank acquisitions or mergers since 1999, the most recent of which was our 2014 acquisition of New Hampshire-based Centrix Bank. We also expect that a portion of the proceeds of the offering will be used to fund acquisitions of independent insurance agencies by Eastern Insurance Group LLC. From 2004 through 2018, we expanded Eastern Insurance Group LLC by acquiring 31 independent insurance agencies for an aggregate price of $124.9 million. We expect to maintain a disciplined approach to strategic transactions, focusing on opportunities in or contiguous to our market that create value for our shareholders and that we believe will likely materially enhance the strength of our franchise, while maintaining an acceptable risk profile. We do not currently have any agreement or understanding regarding any specific transaction.
Expanding and retaining a talented and diverse workforce. By increasing our capital through the offering, we believe that we will be better positioned to expand and retain a talented and diverse workforce dedicated to providing superior service to our customers and to fostering a culture of compliance and accountability. In addition, we believe the offering will enhance our ability to attract and retain qualified officers and employees by allowing us to implement various stock benefit plans, including an employee stock ownership plan concurrently with the offering and one or more equity incentive plans after the offering. Through continued investments in human capital and effective technology, we can continue to advance our mission to do good things to help people prosper.
Supporting our local communities through an additional significant and immediate donation to the Eastern Bank Charitable Foundation. We intend to donate to the Eastern Bank Charitable Foundation, upon the completion of the offering, a number of shares of our authorized but previously unissued common stock that will represent 4% of the shares of Eastern Bankshares, Inc. common stock that will be outstanding immediately after that donation. The opportunity to have an outsized philanthropic impact on the Foundation and the community-orientated non-profit organizations that it supports is viewed by our Board and senior management as an important benefit of the offering. Eastern Bank formed the Eastern Bank Charitable Foundation in 1994, and to date, Eastern Bank has been the sole source of the Foundation’s funding. The Eastern Bank Charitable Foundation had total assets of approximately $111.8 million at March 31, 2020, and for the three-year period ended December 31, 2019, the Foundation’s annual charitable donations averaged approximately $7.6 million. Our stock donation to the Foundation upon completion of the offering will complement our historical charitable giving and allow the Foundation, and indirectly the communities that we serve, both now and in the future, to share in our long-term growth. Although we expect that our annual charitable contributions after the offering and excluding the stock donation will be a small percentage of our net income, we believe the impact of that reduction will be offset by our stock donation.
Enhancing our ability to positively impact local communities through expanded volunteerism and enhanced advocacy influence. We believe that with increased scale through both organic growth and opportunistic strategic acquisitions—coupled with our culture of supporting community volunteerism, where we already are a market leader—we will be able to have a broader and deeper positive impact on our local communities. We also expect that with increased scale, we will be able to have a more impactful “voice” on social justice issues. Eastern takes pride in its public advocacy regarding social justice issues that affect the communities we serve. In recent years, we have advocated in support of immigrants and their families, pay equality and the LGBTQ+ community.
Offering our depositors, employees, officers, directors, trustees and corporators an equity ownership interest in our future growth and profitability. We believe that offering stock to our depositors, employees, officers, directors, trustees and corporators will provide those constituencies with an economic interest in our future success, should they decide to invest. We believe that an ownership interest in Eastern will help to align the interests of our employees with our overall profitability, complementing our organizational focus on continuing to improve Eastern so that it remains competitive in our markets for generations to come.
7
Table of Contents
Terms of the Offering
We are offering between 129,625,000 and 175,375,000 shares of common stock in a subscription offering to eligible depositors of Eastern Bank, our tax-qualified employee benefit plans, and our employees, officers, trustees, directors and corporators, and, to the extent shares remain available, to the general public in a community offering. If necessary, we will also offer shares to the general public in a syndicated offering. The number of shares of common stock to be sold may be increased to up to 201,681,250 shares as a result of demand for the shares of common stock in the offering or changes in market conditions. Unless the number of shares of common stock to be offered is increased to more than 201,681,250 shares or decreased to fewer than 129,625,000 shares, or the subscription and community offerings are extended beyond [EXPIRATION DATE], subscribers will not have the opportunity to change or cancel their stock orders once submitted. If the subscription and community offerings are extended past [EXPIRATION DATE], all subscribers will be notified and given an opportunity to confirm, change or cancel their orders. If you do not respond to that notice, your order will be cancelled and we will promptly return your funds with interest at 0.02% per annum or cancel your deposit account withdrawal authorization. If the number of shares to be sold is increased to more than 201,681,250 shares or decreased to less than 129,625,000 shares, all subscribers’ stock orders will be canceled, all withdrawal authorizations will be canceled and funds delivered to us to purchase shares of common stock in the subscription and community offerings will be returned promptly with interest at 0.02% per annum. We will then resolicit subscribers, giving them an opportunity to place new orders for a period of time. No shares purchased in the subscription offering and community offering will be issued until the completion of any syndicated offering.
The purchase price of each share of common stock offered for sale in the offering is $10.00. All investors will pay the same purchase price per share, regardless of whether the shares are purchased in the subscription offering, the community offering or a syndicated offering. Investors will not be charged a commission to purchase shares of common stock in the offering. Our marketing agent in the subscription and community offerings, Keefe, Bruyette & Woods, Inc., will use its best efforts to assist us in selling shares of our common stock in the subscription and community offerings but is not obligated to purchase any shares of common stock in the subscription and community offerings.
How We Determined the Offering Range and the $10.00 Per Share Stock Price
The amount of common stock we are offering for sale is based on an independent appraisal of the estimated market value of Eastern Bankshares, Inc., assuming the offering has been completed. RP Financial, LC, our independent appraiser, has estimated that, as of May 21, 2020, this market value, including the shares to be issued to Eastern Bank Charitable Foundation, was $1.6 billion. Based on applicable regulations, this market value forms the midpoint of a valuation range with a minimum of $1.4 billion and a maximum of $1.8 billion. Based on this valuation range, and the $10.00 per share price, the number of shares of common stock being offered for sale by Eastern Bankshares, Inc. ranges from 129,625,000 shares to 175,375,000 shares. The $10.00 per share price was selected primarily because it is the price most commonly used in mutual-to-stock conversions of financial institutions. If demand for shares or market conditions warrant, the appraisal can be increased, without resoliciting subscribers, by up to 15%, which would result in an appraised value of up to $2.1 billion and an offering of up to 201,681,250 shares of common stock.
8
Table of Contents
The appraisal is based in part on Eastern Bankshares, Inc.’s financial condition and results of operations, the pro forma effect of the additional capital raised by the sale of shares of common stock in the offering, and an analysis of a peer group of eleven publicly traded bank holding companies and savings and loan holding companies that RP Financial, LC considers comparable to Eastern Bankshares, Inc. The appraisal peer group consists of the following companies, all of which are traded on the Nasdaq Stock Market or the New York Stock Exchange.
| Company Name |
Ticker Symbol |
Headquarters |
Total Assets (1) | |||||
| (in millions) | ||||||||
| Brookline Bancorp, Inc. |
BRKL | Boston, MA | $ | 8,462 | ||||
| Independent Bancorp, Inc. |
INDB | Rockland, MA | $ | 11,980 | ||||
| Meridian Bancorp, Inc. |
EBSB | Peabody, MA | $ | 6,349 | ||||
| Eagle Bancorp, Inc. |
EGBN | Bethesda, MD | $ | 9,992 | ||||
| Kearny Financial Corp. |
KRNY | Fairfield, NJ | $ | 6,774 | ||||
| Northwest Bancshares, Inc. |
NWBI | Warren, PA | $ | 10,681 | ||||
| OceanFirst Financial Corp. |
OCFC | Toms River, NJ | $ | 10,489 | ||||
| Provident Financial Services, Inc. |
PFS | Jersey City, NJ | $ | 10,085 | ||||
| S&T Bancorp, Inc. |
STBA | Indiana, PA | $ | 9,005 | ||||
| First Commonwealth Financial Corporation |
FCF | Indiana, PA | $ | 8,515 | ||||
| WSFS Financial Corporation |
WSFS | Wilmington, DE | $ | 12,279 | ||||
| (1) | Asset size for all companies is as of March 31, 2020 or the most recent date available. |
The following table presents a summary of selected pricing ratios for Eastern Bankshares, Inc. (on a pro forma basis assuming completion of the offering) as of and for the 12 months ended March 31, 2020, and for the peer group companies based on earnings and other information as of and for the 12 months ended March 31, 2020, with stock prices as of May 21, 2020, as reflected in the appraisal report. Compared to the average pricing of the peer group, our pro forma pricing ratios at the midpoint of the offering range indicated a discount of 31.55% on a price-to-book value basis, a discount of 41.88% on a price-to-tangible book value basis and a premium of 71.70% relative to the peer group’s average core price-to-earnings multiple.
| Eastern Bankshares, Inc. (on a pro forma basis, assuming completion of the offering) |
Price-to- earnings multiple (1) |
Price-to- book value ratio |
Price-to- tangible book value ratio |
|||||||||
| Adjusted maximum |
23.91x | 61.77 | % | 69.44 | % | |||||||
| Maximum |
20.14x | 57.57 | % | 65.32 | % | |||||||
| Midpoint |
17.05x | 53.39 | % | 61.12 | % | |||||||
| Minimum |
14.12x | 48.64 | % | 56.27 | % | |||||||
| Valuation of peer group companies, all of which are fully converted (on a historical basis) |
||||||||||||
| Averages |
9.93x | 78.00 | % | 105.16 | % | |||||||
| Medians |
8.20x | 73.88 | % | 104.34 | % | |||||||
| (1) | Price-to-earnings multiples calculated by RP Financial, LC in the independent appraisal are based on an estimate of “core” or recurring earnings. These ratios are different than those presented in “Pro Forma Data.” |
9
Table of Contents
The independent appraisal does not indicate trading market value. Do not assume or expect that our valuation as indicated in the appraisal means that after the offering the shares of our common stock will trade at or above the $10.00 per share purchase price. Furthermore, the pricing ratios presented in the appraisal were used by RP Financial, LC to estimate our pro forma appraised value for regulatory purposes and not to compare the relative value of shares of our common stock with the value of the capital stock of the peer group. The value of the capital stock of a particular company may be affected by a number of factors such as financial performance, asset size and market location.
For a more complete discussion of the amount of common stock we are offering for sale and the independent appraisal, please see the section of this prospectus titled “The Conversion and Offering—Stock Pricing and Number of Shares to be Issued.”
How We Intend to Use the Proceeds From the Offering
We intend to contribute 50% of the net proceeds from the offering to Eastern Bank’s capital. The remaining net proceeds from the offering will be used in part to fund a loan to the employee stock ownership plan to finance its purchase of shares in the offering (or possibly, after the offering, in open market purchases) and the balance will be retained by Eastern Bankshares, Inc.
Assuming we sell 152,500,000 shares of common stock in the offering at the midpoint of the offering range, and we have net proceeds of $1.5 billion, we intend to contribute $747.3 million to Eastern Bank as common equity, loan to our employee stock ownership plan $127.1 million to fund its purchase of shares of common stock and retain the remaining $620.2 million of the net proceeds at Eastern Bankshares, Inc.
Eastern Bankshares, Inc. may use the funds it retains for investment, to repurchase shares of common stock, to acquire other financial institutions or financial services companies, to pay cash dividends and for other general corporate purposes. Eastern Bank expects to use the proceeds it receives primarily to support increased lending, enhance existing, or support the development of new, products and services, enhance the development of our employees and to pursue strategic growth opportunities primarily by acquiring other banking and insurance agency businesses as opportunities arise. We do not currently have any agreement or understanding regarding any acquisition transaction.
Please see the section of this prospectus titled “How We Intend to Use the Proceeds from the Offering” for more information on the proposed use of the proceeds from the offering.
Persons Who May Order Shares of Common Stock in the Offering
We are offering the shares of common stock in a subscription offering in the following descending order of priority:
| (i) | To depositors with accounts at Eastern Bank with aggregate balances of at least $50 at the close of business on March 29, 2019. |
| (ii) | To depositors with accounts at Eastern Bank with aggregate balances of at least $50 at the close of business on March 31, 2020. |
| (iii) | To our tax-qualified employee benefit plans (including Eastern Bank’s employee stock ownership plan and Eastern Bank’s 401(k) plan which may subscribe for, in the aggregate, up to 10% of the shares of common stock sold in the offering). We expect our employee stock ownership plan to purchase 8% of the shares of our common stock outstanding immediately after the offering (including the shares we donate to the Eastern Bank Charitable Foundation). |
| (iv) | To employees, officers, directors, trustees and corporators of Eastern Bank, Eastern Bank Corporation or Eastern Insurance Group LLC who are not eligible in the first or second priority. |
10
Table of Contents
Shares of common stock not purchased in the subscription offering may be offered for sale to the general public in a community offering, with a preference given first to natural persons, and trusts of natural persons, residing in the following cities and towns:
Massachusetts
Abington, Acton, Acushnet, Amesbury, Andover, Arlington, Avon, Barnstable, Bedford, Belmont, Berkley, Beverly, Billerica, Boston, Bourne, Boxford, Braintree, Bridgewater, Brockton, Brookline, Burlington, Cambridge, Canton, Carlisle, Carver, Chelmsford, Chelsea, Cohasset, Danvers, Dedham, Dighton, Dover, Dracut, Dunstable, Duxbury, East Bridgewater, Easton, Essex, Everett, Fairhaven, Falmouth, Foxborough, Framingham, Freetown, Georgetown, Gloucester, Groton, Groveland, Halifax, Hamilton, Hanover, Hanson, Haverhill, Hingham, Holbrook, Hull, Ipswich, Kingston, Lakeville, Lawrence, Lexington, Lincoln, Littleton, Lowell, Lynn, Lynnfield, Malden, Manchester-by-the-Sea, Mansfield, Marblehead, Marion, Marshfield, Mashpee, Mattapoisett, Medford, Melrose, Merrimac, Methuen, Middleborough, Middleton, Milton, Nahant, Natick, Needham, Newbury, Newburyport, Newton, North Andover, North Reading, Norton, Norwell, Norwood, Peabody, Pembroke, Pepperell, Plymouth, Plympton, Quincy, Randolph, Raynham, Reading, Rehoboth, Revere, Rochester, Rockland, Rockport, Rowley, Salem, Salisbury, Sandwich, Saugus, Scituate, Sharon, Sherborn, Somerville, Stoneham, Stoughton, Swampscott, Taunton, Tewksbury, Topsfield, Tyngsborough, Wakefield, Walpole, Waltham, Wareham, Watertown, Wayland, Wellesley, Wenham, West Bridgewater, West Newbury, Westford, Weston, Westwood, Weymouth, Whitman, Wilmington, Winchester, Winthrop, Woburn and Yarmouth.
New Hampshire
Amherst, Atkinson, Auburn, Barrington, Bedford, Boscawen, Bow, Brentwood, Candia, Canterbury, Chester, Chichester, Concord, Danville, Derry, Dover, Durham, East Kingston, Epping, Exeter, Fremont, Goffstown, Hampstead, Hampton, Hampton Falls, Hollis, Hooksett, Hopkinton, Hudson, Kensington, Kingston, Lee, Litchfield, Londonderry, Loudon, Madbury, Manchester, Merrimack, Nashua, New Boston, New Castle, Newfields, Newington, Newmarket, Newton, North Hampton, Pelham, Pembroke, Plaistow, Portsmouth, Raymond, Rochester, Rollinsford, Rye, Salem, Sandown, Seabrook, Somersworth, South Hampton, Stratham, Webster, Warner and Windham.
The community offering may occur either concurrently with or after the subscription offering.
We also may offer for sale shares of common stock not purchased in the subscription offering and the community offering through a syndicated offering. J.P. Morgan Securities LLC and Keefe, Bruyette & Woods, Inc. will act as joint book-running managers for the syndicated offering, if any.
We have the right to accept or reject, in our sole discretion, orders received in the community offering or syndicated offering, and our interpretation of the terms and conditions of the Plan of Conversion will be final. Any determination to accept or reject stock orders in the community offering or syndicated offering will be based on the facts and circumstances available to management at the time of the determination.
If we receive orders for more shares than we are offering, we may not be able to fully or partially fill your order. A detailed description of the subscription offering, the community offering and the syndicated offering, as well as a discussion regarding allocation procedures, can be found in the section of this prospectus titled “The Conversion and Offering.”
Limits on How Much Common Stock You May Purchase
The minimum number of shares of common stock that may be purchased is 25 shares.
Generally, no individual with one or more qualifying accounts or individual exercising subscription rights through a single account held jointly may purchase more than 200,000 shares ($2,000,000) of common stock. If any of the
11
Table of Contents
following persons purchase shares of common stock, their purchases, in all categories of the offering, when combined with your purchases, cannot exceed 200,000 shares ($2,000,000) of common stock:
| • | most companies, trusts or other entities in which you are a senior officer, partner, trustee or have a substantial beneficial interest; or |
| • | your spouse or any relative of you or your spouse living in your house or who is a director, trustee, or officer of Eastern Bank Corporation, Eastern Bankshares, Inc. or Eastern Bank; or |
| • | other persons who may be your “associates” (as defined below) or persons acting in concert with you. |
Unless we determine otherwise, persons having the same address and persons exercising subscription rights through qualifying deposit accounts registered to the same address will be subject to the overall purchase limitation of 200,000 shares ($2,000,000).
The following relatives of directors, trustees and officers will be considered “associates” of these individuals regardless of whether they share a household with the director, trustee or officer: any child, stepchild, grandchild, parent, stepparent, grandparent, spouse, sibling, mother-in-law, father-in-law, son-in-law, daughter-in-law, brother-in-law or sister-in-law. This also includes adoptive relationships.
Subject to regulatory approval, we may increase or decrease the purchase limitations at any time. See the detailed description of the purchase limitations in the section of this prospectus titled “The Conversion and Offering—Additional Limitations on Common Stock Purchases.”
How You May Purchase Shares of Common Stock in the Subscription Offering and the Community Offering
In the subscription offering and community offering, you may pay for your shares only by:
| (i) | personal check, bank check or money order made payable directly to Eastern Bankshares, Inc.; or |
| (ii) | authorizing us to withdraw available funds from the types of Eastern Bank deposit account(s) designated on the stock order form. |
Eastern Bank is not permitted to lend funds to anyone to purchase shares of common stock in the offering. Additionally, you may not use a line of credit check from Eastern Bank or any type of third party check (such as a check payable to you and endorsed over to Eastern Bankshares, Inc.) to pay for shares of common stock. Please do not submit cash. You may not designate withdrawal from Eastern Bank’s accounts with check-writing privileges; instead, please submit a check. You may not authorize direct withdrawal from an individual retirement account, or IRA, held at Eastern Bank. See the section of this prospectus titled “—Using Individual Retirement Account Funds to Purchase Shares of Common Stock.”
You may subscribe for shares of common stock in the subscription and community offerings by delivering a signed and completed original stock order form, together with full payment payable to Eastern Bankshares, Inc. or authorization to withdraw funds from one or more of your deposit accounts at Eastern Bank, provided that the stock order form is received before 2:00 p.m., Eastern Time, on [SUBSCRIPTION DEADLINE], 2020, which is the end of the subscription offering period. You may submit your stock order form and payment by mail using the stock order reply envelope provided or by overnight delivery to the address indicated on the stock order form. You may also hand-deliver stock order forms to the following location: 195 Market Street, Lynn, MA 01901. Hand-delivered stock order forms will only be accepted at this location. We will not accept stock order forms at our banking offices. Please do not mail stock order forms to Eastern Bank’s offices.
Please see the section of this prospectus titled “The Conversion and Offering—Procedure for Purchasing Shares in Subscription and Community Offerings—Payment for Shares” for a complete description of how to purchase shares in the subscription and community offerings.
Using Individual Retirement Account Funds to Purchase Shares of Common Stock
You may be able to subscribe for shares of common stock using funds in your individual retirement account (“IRA”) or other retirement account. If you wish to use some or all of the funds in your IRA or other retirement
12
Table of Contents
account held at Eastern Bank, the applicable funds must be transferred to an IRA or other retirement account that can hold common stock and that is maintained by an independent custodian or trustee, such as a brokerage firm, before you place your stock order. If you do not have such an account, you will need to establish one. A one-time and/or annual administrative fee may be payable to the independent custodian or trustee. Because individual circumstances differ and the processing of retirement fund orders takes additional time, we recommend that you contact our Stock Information Center promptly, preferably at least two weeks before the [EXPIRATION DATE] offering deadline, for assistance with purchases using funds in your IRA or other retirement account held at Eastern Bank or elsewhere. Whether you may use such funds for the purchase of shares in the offering may depend on timing constraints and, possibly, limitations imposed by the institution where the funds are held.
Please see the sections of this prospectus titled “The Conversion and Offering—Procedure for Purchasing Shares in Subscription and Community Offerings—Payment for Shares” and “—Using Individual Retirement Account Funds” for a complete description of how to use IRA funds to purchase shares of common stock in the offering.
Market for Common Stock
We expect that our common stock will be listed for trading on the Nasdaq Global Select Market under the symbol “EBC.” J.P. Morgan Securities LLC and Keefe, Bruyette & Woods, Inc. have advised us that they intend to make a market in our common stock following the offering, but neither is under any obligation to do so.
Our Dividend Policy
Following completion of the offering, our Board of Directors will have the authority to declare dividends on our common stock, subject to our capital requirements, our financial condition and results of operations, tax considerations, statutory and regulatory limitations, and general economic conditions.
Eastern Bankshares, Inc. may not declare or pay a cash dividend on, or repurchase any of, its capital stock if the effect thereof would cause its net worth to be reduced below (i) the amount required for the Liquidation Account or (ii) the regulatory capital requirements of Eastern Bankshares, Inc. (to the extent applicable).
For more information regarding our proposed dividend policy, please see the section of this prospectus titled “Our Dividend Policy.”
Purchases by Directors and Executive Officers
We expect our directors and named executive officers, together with their associates, will subscribe for 1,407,500 shares of common stock in the offering, representing 1.1% of shares to be outstanding at the minimum of the offering range and 0.7% of shares to be sold in the offering at the maximum of the offering range. The purchase price paid by them will be the same $10.00 per share price paid by all other persons who purchase shares of common stock in the offering.
For more information on the proposed purchases of shares of common stock by our directors and executive officers, please see the section of this prospectus titled “Subscriptions by Directors and Executive Officers.”
Deadline for Orders of Shares of Common Stock in the Subscription and Community Offerings
The deadline for purchasing shares of common stock in the subscription and community offerings is 2:00 p.m., Eastern Time, on [SUBSCRIPTION DEADLINE], 2020, unless we extend this deadline. If you wish to purchase shares of common stock, a properly completed and signed original stock order form, together with full payment, must be received (not postmarked) by this time.
For a complete description of the deadline for purchasing shares in the offering, please see the section of this prospectus titled “The Conversion and Offering—Procedure for Purchasing Shares in Subscription and Community Offerings—Expiration Date.”
13
Table of Contents
You May Not Sell or Transfer Your Subscription Rights
Applicable regulations prohibit you from transferring your subscription rights. If you order shares of common stock in the subscription offering, you will be required to certify that you are purchasing the common stock for yourself and that you have no agreement or understanding to sell or transfer your subscription rights or the shares that you are purchasing. We intend to take legal action, including reporting persons to federal or state agencies, against anyone who we believe has sold or transferred his or her subscription rights. We will not accept your order if we have reason to believe you have sold or transferred your subscription rights. On the order form, you cannot add the names of others for joint stock registration who do not have subscription rights or who qualify only in a lower purchase priority than you do. Doing so may jeopardize your subscription rights. In addition, the stock order form requires that you list all deposit accounts, giving all names on each account and the account number at the applicable eligibility date. Failure to provide this information, or providing incomplete or incorrect information, may result in a loss of part or all of your share allocation if there is an oversubscription.
Delivery of Shares of Common Stock
All shares of common stock sold will be issued in book entry form. Stock certificates will not be issued. As soon as practicable following consummation of the offering, a statement reflecting ownership of shares of common stock issued in the subscription and community offerings will be mailed by our transfer agent to the persons entitled thereto at the registration address noted by them on their stock order form. We expect trading in the stock to begin on the day of completion of the offering or the next business day. The offering is expected to be completed as soon as practicable following satisfaction of the conditions described below in “—Conditions to Completion of the Offering.” Until a statement reflecting ownership of shares of common stock is available and delivered to purchasers, purchasers might not be able to sell the shares of common stock that they purchased, even though the common stock will have begun trading. Your ability to sell your shares of common stock before receiving your statement will depend on arrangements you may make with a brokerage firm.
Conditions to Completion of the Offering
We cannot complete the offering unless:
| • | We sell at least the minimum number of shares of common stock offered in the offering; |
| • | We receive approval from the Federal Reserve Board; and |
| • | We receive approval of the Massachusetts Commissioner of Banks to complete the offering. |
Steps We May Take if We Do Not Receive Orders for the Minimum Number of Shares
If we do not receive orders for at least 129,625,000 shares of common stock (not counting shares to be donated to the Eastern Bank Charitable Foundation), we may take several steps in order to sell the minimum number of shares of common stock in the offering range. Specifically, we may:
| (i) | increase the purchase and ownership limitations; and/or |
| (ii) | seek regulatory approval to extend the offering beyond [SUBSCRIPTION DEADLINE], 2020, so long as we resolicit subscribers who previously submitted subscriptions in the offering. |
If we extend the offering past [SUBSCRIPTION DEADLINE], 2020, all subscribers will be notified and given an opportunity to confirm, change or cancel their orders. If you do not respond to that notice, we will cancel your stock order and promptly return your funds with interest at 0.02% per annum for funds received in the subscription and community offering or cancel your deposit account withdrawal authorization. If one or more purchase limitations are increased, only those subscribers in the subscription offering who ordered the maximum amount and who indicated on their stock order form an interest in being resolicited will be given the opportunity to increase their subscriptions up to the then-applicable limit.
14
Table of Contents
Possible Change in the Offering Range
RP Financial, LC will update its appraisal before we complete the offering. If, as a result of demand for the shares or changes in market conditions or both, RP Financial, LC determines that our pro forma market value has increased, we may sell up to 201,681,250 shares in the offering without further notice to you. If our pro forma market value at that time is either below $1.4 billion or above $2.1 billion, then, after consulting with the Federal Reserve Board and the Massachusetts Commissioner of Banks, we may:
| • | terminate the offering and promptly return all funds (with interest paid on funds received in the subscription and community offerings); |
| • | set a new offering range; or |
| • | take such other actions as may be permitted by the Federal Reserve Board, the Massachusetts Commissioner of Banks and the Securities and Exchange Commission. |
If we set a new offering range, we will promptly return funds, with interest at 0.02% per annum for funds received for purchases in the subscription and community offerings, and cancel any authorization to withdraw funds from deposit accounts for the purchase of shares of common stock. We will then resolicit subscribers, allowing them time to place a new stock order.
Possible Termination of the Offering
We may terminate the offering at any time with regulatory approval. If we terminate the offering, we will promptly return your funds with interest at 0.02% per annum, and we will cancel deposit account withdrawal authorizations.
Delivery of Prospectus
To ensure that each person receives a prospectus at least 48 hours before the deadline for orders for common stock, we may not mail prospectuses any later than five days before such date or hand-deliver prospectuses later than two days before that date. Stock order forms may only be delivered if accompanied or preceded by a prospectus. We are not obligated to deliver a prospectus or stock order form by means other than U.S. mail.
We will make reasonable attempts to provide a prospectus and offering materials to holders of subscription rights. The subscription offering and all subscription rights will expire at 2:00 p.m., Eastern Time, on [EXPIRATION DATE], whether or not we have been able to locate each person entitled to subscription rights.
Our Donation of Shares of Common Stock to Eastern Bank Charitable Foundation
To further our commitment to our local community, and assuming we receive final approval from the Massachusetts Commissioner of Banks and the Federal Reserve Board, Eastern Bankshares, Inc. intends to donate to Eastern Bank Charitable Foundation a number of shares of our common stock equal to 4% of the total number of shares of common stock that will be outstanding immediately following the completion of the offering and our donation of shares to the Eastern Bank Charitable Foundation. At the minimum, midpoint, maximum and adjusted maximum of the offering range, we would donate to Eastern Bank Charitable Foundation 5,401,042, 6,354,167, 7,307,292 and 8,403,386 shares of common stock, respectively. As a result of the stock donation, we expect to record an after-tax expense of approximately $62.2 million during the quarter in which the offering is completed, assuming we sell 201,681,250 shares of common stock in the offering.
Eastern Bank Charitable Foundation is dedicated exclusively to supporting charitable and community-based organizations dedicated to social justice and otherwise serving in the communities in which we operate. The stock donation to Eastern Bank Charitable Foundation will:
| • | dilute the voting interests of purchasers of shares of our common stock in the offering; and |
| • | result in an expense, and a reduction in capital, during the quarter in which the donation is made, equal to the full amount of the donation to Eastern Bank Charitable Foundation, offset in part by a corresponding tax benefit. |
15
Table of Contents
The amount of common stock that we would offer for sale would be greater if Eastern Bankshares, Inc. was not donating shares to the Eastern Bank Charitable Foundation. For a further discussion of the financial impact of the stock donation to the Eastern Bank Charitable Foundation, including its effect on those who purchase shares in the offering, please see the sections of this prospectus titled “Risk Factors—Risks Related to the Offering—The donation to the Eastern Bank Charitable Foundation will dilute your ownership interest and adversely affect net income in 2020,” “Risk Factors—Risks Related to the Offering—Our donation to the Eastern Bank Charitable Foundation may not be tax deductible, which could reduce our profits,” “Comparison of Valuation and Pro Forma Information With and Without Stock Donation to Charitable Foundation,” and “Eastern Bank Charitable Foundation.”
Benefits to Management and Potential Dilution to Shareholders Resulting from the Offering
We expect our employee stock ownership plan, which is a tax-qualified retirement plan for the benefit of all eligible employees of Eastern Bank and Eastern Insurance Group LLC, to purchase up to 8% of the sum of the shares of common stock that are issued in the offering plus the number of shares we donate to the Eastern Bank Charitable Foundation upon completion of the offering, although the ultimate decision of whether and to what extent the employee stock ownership plan will purchase shares in the offering will be made by its trustee (initially a committee comprised of Eastern Bank executives) acting in its fiduciary capacity with respect to the employee stock ownership plan. In the event the amount purchased by the employee stock ownership plan in the offering does not equal such 8%, then if market conditions warrant, in the judgment of its trustees, the employee stock ownership plan may elect to purchase shares in the open market following the completion of the offering, subject to the approval of the Federal Reserve Board and the Massachusetts Commissioner of Banks.
We intend to implement one or more new stock-based benefit plans no earlier than six months after completion of the offering. Shareholder approval of these plans would be required. We have not determined whether we would adopt the plans within 12 months following the completion of the offering or more than 12 months following the completion of the offering. If we implement stock-based benefit plans within 12 months following the completion of the offering, the stock-based benefit plans would reserve a number of shares (i) up to 4% of the shares of common stock sold in the offering (including shares we donate to Eastern Bank Charitable Foundation) for awards of restricted stock to key employees and directors, at no cost to the recipients, and (ii) up to 10% of the shares of common stock sold in the offering (including shares we donate to Eastern Bank Charitable Foundation), for issuance pursuant to the exercise of stock options by key employees and directors. These percentage limitations are set forth in Federal Reserve Board regulations and Massachusetts regulations. If the stock-based benefit plan is adopted more than 12 months after the completion of the offering, it would not be subject to the percentage limitations set forth above. We have not yet determined the number of shares that would be reserved for issuance under these plans.
16
Table of Contents
The following table summarizes the number of shares of common stock and the aggregate dollar value of grants that are available under one or more stock-based benefit plans if such plans reserve for restricted stock awards and stock options, respectively, a number of shares of common stock equal to 4% and 10% of the shares sold in the offering and donated to Eastern Bank Charitable Foundation. The table shows the dilution to shareholders if all such shares are issued from authorized but unissued shares, instead of such shares being purchased in the open market. A portion of the stock grants shown in the table below may be made to non-management employees. The table also sets forth the number of shares of common stock to be acquired by the employee stock ownership plan for allocation to all qualifying employees.
| Number of Shares to be Granted or Purchased | Value of Grants (In Thousands) |
|||||||||||||||||||||||||||
| At Minimum of Offering Range |
At Adjusted Maximum of Offering Range |
As a Percentage of Common Stock to be Sold in the Offering and Contributed to the Foundation |
As a Percentage of Common Stock to be Outstanding |
Dilution Resulting From Issuance of Shares for Stock- Based Benefit Plans |
At Minimum of Offering Range |
At Adjusted Maximum of Offering Range |
||||||||||||||||||||||
| Employee stock ownership plan |
10,802,083 | 16,806,771 | 8.00 | % | 8.00 | % | 0.00 | % | $ | 108,021 | $ | 168,068 | ||||||||||||||||
| Restricted stock awards |
5,401,042 | 8,403,385 | 4.00 | % | 4.00 | % | 3.85 | % | 54,010 | 84,034 | ||||||||||||||||||
| Options granted under stock-based benefit plans |
13,502,604 | 21,008,464 | 10.00 | % | 10.00 | % | 9.09 | % | 34,162 | 53,151 | ||||||||||||||||||
|
|
|
|
|
|
|
|
|
|
|
|
|
|
|
|||||||||||||||
| 29,705,729 | 46,218,620 | 22.00 | % | 22.00 | % | 12.28 | % | $ | 196,193 | $ | 305,253 | |||||||||||||||||
|
|
|
|
|
|
|
|
|
|
|
|
|
|
|
|||||||||||||||
| (1) | The actual value of restricted stock awards will be determined based on their fair value as of the date grants are made. For purposes of this table, fair value for stock awards is assumed to be the same as the offering price of $10.00 per share. The fair value of stock options has been estimated at $2.53 per option using the Black-Scholes option pricing model with the following assumptions: a grant-date share price and option exercise price of $10.00; an expected option term of 10 years; no dividend yield; a risk-free rate of return of 0.70%; and expected volatility of 18.08%. The actual value of option grants will be determined by the grant-date fair value of the options, which will depend on a number of factors, including the valuation assumptions used and the option pricing model ultimately adopted. |
| (2) | No dilution is reflected for the employee stock ownership plan because such shares are assumed to be purchased in the offering. |
Tax Consequences
Eastern Bank has received an opinion of counsel, Nutter, McClennen & Fish, LLP, regarding the material U.S. federal income tax consequences of the offering. As a general matter, Eastern Bankshares, Inc. will not realize gain or loss for U.S. federal income tax purposes as a result of the offering and concurrent donation of stock to Eastern Bank Charitable Foundation.
Emerging Growth Company Status
We qualify as an “emerging growth company” under the Jumpstart Our Business Startups Act of 2012 (the “JOBS Act”). For as long as we are an emerging growth company, we may choose to take advantage of exemptions from various reporting requirements applicable to other public companies but not to emerging growth companies, including the following:
| • | a requirement to have only two years of audited financial statements and only two years of related management’s discussion and analysis; |
| • | an exemption from compliance with the auditor attestation requirement on the effectiveness of our internal control over financial reporting; |
| • | an exemption from compliance with any requirement that the Public Company Accounting Oversight Board may adopt regarding mandatory audit firm rotation or a supplement to the auditor’s report providing additional information about the audit and the financial statements; |
17
Table of Contents
| • | reduced disclosure about the company’s executive compensation arrangements; and |
| • | exemptions from the requirements to obtain a non-binding advisory vote on executive compensation or shareholder approval of any golden parachute arrangements. |
See the section of this prospectus titled “Risk Factors—Risks Related to the Offering—We are an emerging growth company, and because we elect to comply only with the reduced reporting and disclosure requirements applicable to emerging growth companies, our common stock may be less attractive to investors” and “Supervision and Regulation—Emerging Growth Company Status.”
The JOBS Act also provides that an emerging growth company does not need to comply with any new or revised financial accounting standards until such date that a private company is otherwise required to comply with such new or revised accounting standards. Pursuant to the JOBS Act, we have elected to take advantage of the benefits of this extended transition period for complying with new or revised accounting standards as required when they are adopted for private companies. As a result, our operating results and financial statements may not be comparable to the operating results and financial statements of other companies who have adopted the new or revised accounting standards.
We will cease to be an emerging growth company upon the earliest of: (1) the end of the fiscal year following the fifth anniversary of the offering; (2) the first fiscal year after our annual gross revenues are $1.07 billion or more; (3) the date on which we have, during the previous three-year period, issued more than $1.0 billion in non-convertible debt securities; and (4) as of December 31 in any fiscal year in which the market value of our common stock held by non-affiliates exceeded $700 million at the end of June 30 of that fiscal year. In light of the minimum offering expected under the appraisal, we expect that we will cease to be an emerging growth company as of December 31, 2021. Once we cease to be an emerging growth company, we will not be entitled to the exemptions provided in the JOBS Act discussed above.
How You Can Obtain Additional Information—Stock Information Center
Our banking personnel may not, by law, assist with investment-related questions about the offering. If you have any questions regarding the offering, please call our Stock Information Center. The telephone number is [(SSS) SSS-SSSS]. The Stock Information Center is open Monday through Friday between 10:00 a.m. and 4:00 p.m., Eastern Time. The Stock Information Center will be closed on bank holidays.
18
Table of Contents
We are subject to a number of risks potentially affecting our business, financial condition, results of operations and cash flows. As a company offering banking and other financial services, certain elements of risk are inherent in our transactions and operations and are present in the business decisions we make. We, therefore, encounter risk as part of the normal course of our business, and we design risk management processes to help manage these risks. Our success is dependent on our ability to identify, understand and manage the risks presented by our business activities so that we can appropriately balance revenue generation and profitability. These risks include, but are not limited to, credit risk, market risks, liquidity risks, operational risks, model risks, technology, regulatory and legal risks, and strategic and reputational risks. We discuss our principal risk management processes and, in appropriate places, related historical performance in the “Management’s Discussion and Analysis of Financial Condition and Results of Operations” section of this prospectus.
You should carefully consider the following risk factors that may affect our business, future operating results and financial condition, as well as the other information set forth in this prospectus, before making a decision to invest in our common stock. If any of the following risks actually occur, our business, financial condition or results of operations would likely be materially adversely affected. In such case, the trading price of our common stock would likely decline due to any of these risks, and you may lose all or part of your investment. The following risks are not the only risks we face. Additional risks that are not presently known or that we presently deem to be immaterial also could have a material adverse effect on our financial condition, results of operations and business.
Risks Related to Covid-19 Pandemic and Associated Economic Slowdown
On March 11, 2020, the World Health Organization declared the outbreak of a strain of novel coronavirus disease, Covid-19, a global pandemic. Our market area is concentrated in eastern Massachusetts. On a per capita basis, Massachusetts is ranked sixth among the states in the number of reported Covid-19 cases and fourth in the number of related deaths as of the date of this prospectus. This subsection summarizes a number of risks to our business, financial condition, results of operations and cash flows relating to the ongoing economic recession caused primarily by governmental and private sector actions to reduce the spread of Covid-19. In this prospectus, we sometimes refer to the ongoing recession as the “Covid-19 recession.”
Many of the risks related to the Covid-19 recession may have implications for Eastern Bank that are similar to those presented by risks described in further detail below in this subsection that are not specific to Covid-19, including “Our business may be adversely affected by conditions in the financial markets and by economic conditions generally,” “The geographic concentration of our loan portfolio and lending activities makes us vulnerable to a downturn in the local economy,” “Commercial loans, including those secured by commercial real estate, are generally riskier than other types of loans and constitute a significant portion of our loan and lease portfolio,” “Changes in management’s estimates and assumptions may have a material impact on our consolidated financial statements and our financial condition or operating results,” “Climate change, natural disasters, public health crises, geopolitical developments, acts of terrorism and other external events could harm our business,” “The financial weakness of other financial institutions could adversely affect us,” and “Our business strategy includes projected growth in our core businesses, and our financial condition and results of operations could be negatively affected if we fail to grow or fail to manage our growth effectively.”
The Covid-19 pandemic and governmental and private sector action in response to the Covid-19 pandemic are having a material adverse effect on the global, national and local economies, and on our business, financial condition, results of operations and cash flows, and it is premature to predict if or when economic activity will revert to the level that existed before the spread of Covid-19 in our region.
Governmental action ordering the closure of workplaces and facilities of non-essential businesses to workers, customers and the public has had a material adverse effect on the global, national and local economies.
Massachusetts Governor Charles D. Baker issued an emergency order requiring all businesses and organizations that do not provide “Covid-19 essential services” to close their workplaces and facilities to workers, customers and the public, beginning March 24, 2020. On April 21, 2020, Governor Baker extended the closure of all public and private schools through the end of the 2019-2020 school year, and the closure of all non-emergency child care programs with limited exception.
The closure in Massachusetts of many workplaces and facilities to workers, customers and the public resulted in an unprecedented increase in the number of unemployment claims in Massachusetts since mid-March 2020. For the
19
Table of Contents
sixteen-week period ended July 4, 2020, the number of Massachusetts residents who submitted initial unemployment claims averaged approximately 68,340 per week, compared to 7,449 claims in the week ended March 14, 2020. The greatest concentration of new claims occurred during the four-week period ended April 11, 2020, when an average of 143,334 claims were filed per week. The unemployment rate reported by the Department of Labor’s Bureau of Labor Statistics for Massachusetts for May 2020 was 17.4%. We believe the increase in unemployment claims is an indicator that we will experience a sharp increase during the next several months in delinquent consumer and small business loans.
We expect our local economy will largely track the national economy and will be influenced by global economic conditions. The Federal Reserve indicated on June 10, 2020 that it expects the unemployment rate in the United States to average between 9% and 10% during the last three months of 2020, compared to 3.5% in February, and that the level of economic activity in the United States in late 2020, as measured by gross domestic product (“GDP”), would be between 4% and 10% less than during the comparable period of 2019. An assessment of the impact of the Covid-19 pandemic on global economic activity was released by the Organization for Economic Cooperation and Development (“OECD”), also on June 10, 2020. The OECD presented what it characterized as two equally likely scenarios – one scenario in which a so-called “second wave” of the Covid-19 pandemic occurs in all economies towards the end of 2020 and an alternative scenario where the second wave is avoided. The OECD projected global GDP will decline by 7.6% in 2020 in the second wave scenario, as compared to a 6% decline in the other scenario. On June 24, 2020, the International Monetary Fund (IMF) released its latest World Economic Outlook (WEO). The IMF’s June 2020 WEO projects that the aggregate 2020 GDP for the countries in its advanced economies group will be 8% less than 2019, and the 2021 GDP for that group will be approximately 4% below the 2019 level.
The Covid-19 recession is having a material adverse effect on our business, financial condition, results of operations and cash flows, as discussed below.
It is premature to assess whether the Massachusetts plan to permit the gradual reopening of “brick-and-mortar premises” of businesses and organizations will create conditions likely lead to a rapid and meaningful increase in economic activity while avoiding a second wave of Covid-19 cases.
On May 18, 2020, Governor Baker announced a four-part phased plan to reopen the physical locations of businesses and organizations in Massachusetts. The stated goal is to methodically allow businesses, services and activities to resume, while avoiding a resurgence of Covid-19 that could overwhelm the Massachusetts healthcare system. According to the plan, each phase will last a minimum of three weeks (and could last longer) before moving to the next phase. The plan states that if public health data trends are negative, specific industries, regions, and/or the entire state may be required to revert to an earlier phase.
We anticipate that many workers will not be able to, or will choose not to, return full-time to the workplace unless they perceive that safe childcare or elementary school options are available. In a report the Massachusetts Commissioner of Elementary and Secondary Education released on June 25, 2020, the Commissioner prescribed various health and safety requirements for in-person learning in K-12 schools during the 2020-2021 school year and advised K-12 schools to plan for three scenarios: in-person learning with new safety requirements; a hybrid of in-person and remote learning; and remote learning. We are unable to predict when childcare and K-12 education will return to levels that existed prior to the outbreak of the Covid-19 pandemic.
We are unable to predict if or when economic activity will revert to the level that existed before the spread of Covid-19 in our region with respect to our commercial and small business borrowers that operate businesses such as hotels, inns, restaurants and retail stores that depend primarily upon customers patronizing their businesses in person. For example, although Massachusetts restaurants generally have been permitted to offer limited indoor dining since June 22, 2020, restaurants in the City of Boston that subscribe to the OpenTable reservation service reported a daily decline in reservations of 68.91%, on average, for the seven-day period ended July 19, 2020 as compared to the same period in 2019.
Customary means to collect nonperforming assets may be prohibited or impractical during the Covid-19 pandemic, and there is a risk that collateral securing a nonperforming asset may deteriorate if we choose not to, or are unable to, foreclose on collateral on a timely basis.
We suspended all collection of overdue payments, including residential property foreclosure sales, beginning in March 2020. Separately, governments have adopted or may adopt in the future regulations or promulgate executive orders that
20
Table of Contents
restrict or limit our ability to take certain actions with respect to delinquent borrowers that we would otherwise take in the ordinary course, such as customary collection and foreclosure procedures. Massachusetts, for example, enacted a law effective April 20, 2020 that imposes a moratorium on evictions and foreclosures during the Covid-19 emergency. The law prohibits landlords and lenders from initiating or completing evictions and foreclosures during the current state of emergency. The law also requires lenders to provide forbearance to mortgage borrowers who submit a request affirming that they have experienced a financial impact from Covid-19. Massachusetts law authorizes the governor to extend the expiration date of each moratorium in increments of not more than 90 days as long as the extended expiration date is no later than 45 days after the Covid-19 emergency declaration has been lifted. On July 21, 2020, Governor Baker extended the moratoria until October 17, 2020. There is a risk that the collateral securing a nonaccrual loan may deteriorate if we choose not to, or are unable to, foreclose on the collateral on a timely basis during the Covid-19 recession.
As a result of the dramatic decline in cash flow that many of our commercial and commercial real estate borrowers have experienced as a result of the Covid-19 recession, many of those borrowers have been and will likely continue to seek payment deferments on their indebtedness.
The effects of the Covid-19 recession in our market area have significantly reduced the cash flow for many of our commercial and commercial real estate borrowers. As a consequence, many of those borrowers have been seeking payment deferments on their indebtedness.
Consistent with the public encouragement provided generally by federal and state financial institution regulators after the spread of Covid-19 in the United States, Eastern Bank has attempted to work constructively with borrowers to negotiate loan modifications or forbearance arrangements that reduce or defer the monthly payments due to Eastern Bank. Generally, these modifications are for three to six months and allow customers to temporarily cease making either principal payments or both interest and principal payments. Through June 30, 2020, we had modified approximately $946 million of loans, of which approximately 56% were for full payment deferrals (both interest and principal) and 44% deferred only principal payments. Upon the expiration of the deferral period, borrowers will be required to resume making previously scheduled loan payments. Although we expect many of our customers will resume making timely loan payments after their deferral period ends, we anticipate that some will be not able to do so, and we will need to begin collection activities. As of the date of this prospectus, we are unable to reasonably estimate the aggregate amount of loans that will likely become delinquent after the respective deferral period. See the section of this prospectus titled “Recent Developments—Covid-19 Impact” for additional information regarding our loan modifications as of June 30, 2020. We anticipate that we will extend or adjust loan modifications on a case by case basis as circumstances warrant.
We expect a significant increase in credit costs in 2020 due to the Covid-19 recession.
Our loan loss provision for the six months ended June 30, 2020 was $37.2 million, as compared to our loan loss provision of $6.3 million for the year ended December 31, 2019. The increase in our provision was driven primarily by our perception of the economic distress being experienced by many of our borrowers due to the Covid-19 recession.
Beginning in late March, when we realized the impact of the pandemic and economic shut down would have an immediate impact on selected segments of our customers, we identified the following categories of borrowers likely to experience the most adverse effects of the Covid-19 recession. Since December 31, 2019 we have downgraded the risk ratings on $1.7 billion of loans across various industries and sectors. Included in the risk rating downgrades was a $512 million migration into the following categories: special mention ($464 million), substandard ($43 million) and doubtful ($5 million). Downgrades to the special mention category include the entire hotel portfolio, most of the restaurant portfolio, as well as some commercial loans in other industries including retail and construction contractors.
We expect that our nonperforming loans (“NPLs”) will increase significantly later in 2020 as loan modifications expire and the impact of current government stimulus programs wanes, and therefore we anticipate that our loan loss provision will be greater in remainder of the year ending December 31, 2020, as compared to comparable periods in 2019, when our provision was relatively low by historical standards due the positive economic conditions at that time.
Our loan loss allowance may be difficult to evaluate in comparison to our peers. As we are permitted to do as an emerging growth company, we have elected to postpone the adoption of Financial Accounting Standards Board Accounting Standards Update No. 2016–13 (“Measurement of Credit Losses on Financial Instruments”), commonly referred to as the “CECL model.” The new standard will be effective for us for reporting beginning as of December 31, 2021. We are adopting this standard later than our peers, and therefore, our loan loss allowance may be difficult to evaluate in comparison to many of our peers that are publicly traded.
21
Table of Contents
The Federal Open Market Committee’s reduction in the target range for the federal funds rate to between 0.0% and 0.25% in March 2020 to help mitigate the effects of the Covid-19 recession will likely have an adverse effect on our 2020 operating results.
Anticipating the Covid-19 recession, the Federal Open Market Committee of the Federal Reserve in March 2020 reduced the target range for the federal funds rate to between 0.0% and 0.25%, compared to the previous target of between 1.00% and 1.25%. The outlook for the remainder of 2020 is uncertain, and there is a possibility that the Federal Open Market Committee may keep interest rates low or even use negative interest rates if economic conditions warrant.
Changes in interest rates can have a material effect on many areas of our business, including our net interest and net interest margin. When interest rates on our interest-earning assets decline at a faster pace than interest rates on our interest-bearing liabilities, our net interest income is adversely affected. Our planning for 2020 assumes that the current interest rate environment will remain in effect through December 31, 2020; interest rates on our interest-earning assets will decline in 2020 at a faster pace than interest rates on our interest-bearing liabilities; and our net interest income for 2020 will likely be materially less than our net interest income for 2019.
We anticipate the Covid-19 recession will have other adverse effects on our operating results for the year ending December 31, 2020 and possibly beyond.
Other factors likely to have an adverse effect on our operating results include:
| • | reduced fees as we waive certain fees for our customers impacted by the Covid-19 pandemic, |
| • | possible constraints on liquidity and capital, due to supporting client activities or regulatory actions, |
| • | potential losses in our investment securities portfolio due to volatility in the financial markets, and |
| • | higher operating costs, increased cybersecurity risks and a potential loss of productivity while we work remotely and must address a higher level of loan modifications, distressed credit management and PPP loan originations. |
In addition, because both the Covid-19 pandemic and the associated recession are unprecedented, it may be challenging for management to make certain judgments and estimates that are material to our consolidated financial statements while the Covid-19 pandemic continues, given the inherently uncertain operating environment.
We may experience additional expense and reputational risk arising out of our origination of PPP loans if one or more companies, individuals or public officials allege that we acted unfairly in connection with PPP lending, including by choosing not to process certain PPP applications or in favoring our customers over other eligible PPP borrowers.
Through June 30, 2020, we originated approximately 8,100 loans to PPP borrowers, representing in the aggregate $1.1 billion of PPP loans. The vast majority of our PPP borrowers are existing commercial and small business borrowers, non-profit customers, retail banking customers and clients of Eastern Wealth Management and Eastern Insurance Group LLC. See the section of this prospectus titled “Recent Developments—Covid-19 Impact” for additional information regarding our PPP loans as of June 30, 2020.
As of the date of this prospectus, federal and state officials are investigating how participating PPP lenders process applications and whether certain PPP lenders may have inappropriately or unfairly prioritized certain customers to the detriment of other eligible borrowers. Similarly, there are pending lawsuits against other banks brought by eligible PPP borrowers alleging that various PPP lenders improperly prioritized existing customers when those lenders approved PPP loans. In addition, there are pending lawsuits against other banks alleging that various PPP lenders failed to pay required agency fees to third parties who allegedly assisted businesses with PPP loan applications. We are proud of our efforts to provide PPP funding to small businesses and non-profits in our community, but there can be no assurance that we will not be the target of government scrutiny or that private parties will not bring claims similar to those brought against other banks.
An important element of our business strategy is to pursue growth in our core businesses, and it may be challenging for us to grow our core business while the Covid-19 pandemic and associated recession continue or if the recovery from the Covid-19 recession is slow or unpredictable.
The Covid-19 pandemic and the associated recession are unprecedented. We are unable to predict if or when economic activity will revert to the level that existed before the spread of Covid-19 in our region. We also are unable to predict whether
22
Table of Contents
our existing and prospective customers will have confidence in assessing when the Covid-19 pandemic will likely abate and the likely pace of any economic recovery. It may be challenging for us to grow our core business while the Covid-19 pandemic continues or if the recovery from the Covid-19 recession is slow or unpredictable. If the continuing effects of the Covid-19 recession impede our ability to grow our core business, our return on equity may be less than our peer companies, and the market price of our stock may be adversely affected.
Risks Related to Our Business and Our Industry Generally
Changes in interest rates may have an adverse effect on our profitability.
Net interest income historically has been, and we anticipate that it will remain, a significant component of our total revenue. This is due to the fact that a high percentage of our assets and liabilities have been and will continue to be in the form of interest-bearing or interest-related instruments. Changes in interest rates can have a material effect on many areas of our business, including net interest income, deposit costs, and loan volume and delinquency. Interest rates are highly sensitive to many factors that are beyond our control, including general economic conditions and policies of various governmental and regulatory agencies and, in particular, the Federal Open Market Committee. Changes in monetary policy, including changes in interest rates, could influence not only the interest we receive on loans and securities and the amount of interest we pay on deposits and borrowings, but such changes could also affect our ability to originate loans and obtain deposits and the fair value of our financial assets and liabilities. If the interest rates on our interest-bearing liabilities increase at a faster pace than the interest rates on our interest earning assets, our net interest income may decline and, with it, a decline in our earnings may occur. Our net interest income and our earnings would be similarly affected if the interest rates on our interest earning assets declined at a faster pace than the interest rates on our interest-bearing liabilities. The Federal Open Market Committee twice reduced interest rates in March 2020 in response to the disruption of global economic activity due to actions taken to mitigate the spread of Covid-19. On March 3, 2020, the Federal Open Market Committee reduced the target range for the federal funds rate by 50 basis points, to 1.00% to 1.25%, and on March 15, 2020, the Federal Open Market Committee further reduced the target range for the federal funds rate to 0.00% to 0.25%.
The current interest rate changes may impact our ability to attract deposits and to generate attractive earnings through our investment portfolio and we are unable to control or predict with certainty changes in market interest rates. Global, national, regional and local economic conditions, the effects of a widespread outbreak of disease pandemics such as Covid-19, competitive pressures and the policies of regulatory authorities, including monetary policies of the Federal Reserve Board, affect interest income and interest expense. Although we have policies and procedures designed to manage the risks associated with changes in market interest rates, changes in interest rates still may have an adverse effect on our profitability.
If our ongoing assumptions regarding borrower or depositor behavior or overall economic conditions are significantly different than we anticipate, then our risk mitigation may be insufficient to protect against interest rate risk and our net income would be adversely affected.
If our allowance for loan losses is insufficient to cover actual loan losses, our earnings and capital could decrease.
At March 31, 2020, our allowance for loan losses was $109.1 million, or 1.20% of total loans. At December 31, 2019, our allowance for loan losses was $82.3 million, or 0.92% of total loans, compared to $80.7 million, or 0.91% of total loans, at December 31, 2018. We make various assumptions and judgments about the collectability of our loan portfolio, including the creditworthiness of our borrowers and the value of the real estate and other assets serving as collateral for many of our loans. In determining the amount of the allowance for loan losses, we review our loans, loss and delinquency experience, and commercial and commercial real estate peer data and we evaluate other factors including, among other things, current economic conditions. If our assumptions are incorrect, or if delinquencies or non-performing loans increase, our allowance for loan losses may not be sufficient to cover losses inherent in our loan portfolio, which would require additions to our allowance, which could materially decrease our net income.
In addition, our federal and state regulators, as an integral part of their examination process, periodically review the allowance for loan losses and may require us to increase the allowance for loan losses by recognizing additional provisions for loan losses charged to income, or to charge-off loans, which, net of any recoveries, would decrease the allowance for loan losses. Any such additional provisions for loan losses or charge-offs could have a material adverse effect on our financial condition and results of operations.
23
Table of Contents
The geographic concentration of our loan portfolio and lending activities makes us vulnerable to a downturn in the local economy.
We primarily serve individuals, businesses and municipalities located in eastern and central Massachusetts, including the greater Boston metropolitan area, southern New Hampshire, including its coastal region, and northern Rhode Island. At March 31, 2020, approximately $6.4 billion, or 71% of our total loans, was primarily secured by real estate in this market area. Therefore, our success is largely dependent on the economic conditions, including employment levels, population growth, income levels, savings trends and government policies, in this market area. Weaker economic conditions caused by recessions, unemployment, inflation, a decline in real estate values or other factors beyond our control may adversely affect the ability of our borrowers to service their debt obligations and could result in higher loan and lease losses and lower net income for us.
Although there is not a single employer or industry in our market area on which a significant number of our customers are dependent, a substantial portion of our loan portfolio is composed of loans secured by property located in the greater Boston metropolitan area. This makes us vulnerable to a downturn in the local economy and real estate markets. Decreases in local real estate values caused by economic conditions or other events could adversely affect the value of the property used as collateral for our loans, which could cause us to realize a loss in the event of a foreclosure.
A worsening of business and economic conditions generally or specifically in the principal markets in which we conduct business could have adverse effects on our business, including the following:
| • | A decrease in the demand for, or the availability of, loans and other products and services offered by us; |
| • | A decrease in the value of our loans held for sale or other assets secured by residential or commercial real estate; |
| • | An impairment of certain intangible assets, such as goodwill; |
| • | A decrease in interest income from variable rate loans due to declines in interest rates; and |
| • | An increase in the number of clients and counterparties who become delinquent, file for protection under bankruptcy laws or default on their loans or other obligations to us, which could result in a higher level of nonperforming assets, net charge-offs, provisions for loan losses, and valuation adjustments on loans held for sale. |
Moreover, a significant decline in general economic conditions, caused by inflation, recession, acts of terrorism, an outbreak of hostilities or other international or domestic calamities, unemployment, public health crises or other factors beyond our control could further impact these local economic conditions and could further negatively affect the financial results of our banking operations. In addition, deflationary pressures, while possibly lowering our operating costs, could have a significant negative effect on our borrowers, especially our business borrowers, and the values of underlying collateral securing loans, which could negatively affect our financial performance. In the event of severely adverse business and economic conditions generally or specifically in the principal markets in which we conduct business, there can be no assurance that the federal government and the Federal Reserve Board would intervene. If economic conditions worsen or volatility increases, our business, financial condition and results of operations could be materially adversely affected. For more information about our market area, please see the section of this prospectus titled “Business—Eastern Bank—Market Area.”
We are a community bank and our ability to manage reputational risk is critical to attracting and maintaining customers, investors and employees and to the success of our business, and the failure to do so may materially adversely affect our performance.
We are a community bank and our reputation is one of the most valuable components of our business. A key component of our business strategy is to rely on our reputation for customer service and knowledge of local markets to expand our presence by capturing new business opportunities from existing and prospective customers in our market area. As a community bank, we strive to conduct our business in a manner that enhances our reputation. This is done, in part, by recruiting, hiring and retaining employees who share our core values of being an integral part of the communities we serve, delivering superior service to our customers and caring about our customers and associates. If our reputation is negatively affected by the actions of our employees, by our inability to conduct our operations in a manner that is appealing to current or prospective customers, or by events beyond our control, our business and operating results may be adversely affected.
Threats to our reputation can come from many sources, including adverse sentiment about financial institutions generally, the perception of unethical practices, employee misconduct, failure to deliver minimum standards of service or
24
Table of Contents
quality, compliance deficiencies, cybersecurity breaches and questionable or fraudulent activities of our customers. We have policies and procedures in place to protect our reputation and promote ethical conduct, but these policies and procedures may not be fully effective. Negative publicity regarding our business, employees, or customers, with or without merit, may result in the loss of customers and employees, costly litigation and increased governmental regulation, all of which could adversely affect our operating results.
We face continuing and growing security risks to our information base, including the information we maintain relating to our customers.
We are subject to certain operational risks, including, but not limited to, data processing system failures and errors, inadequate or failed internal processes, customer or employee fraud and catastrophic failures resulting from terrorist acts or natural disasters. In the ordinary course of business, we rely on electronic communications and information systems to conduct our business and to store sensitive data, including financial information regarding customers. Our electronic communications and information systems infrastructure, as well as the systems infrastructures of the vendors we use to meet our data processing and communication needs, could be susceptible to cyber-attacks, such as denial of service attacks, hacking, terrorist activities or identity theft. Financial services institutions and companies engaged in data processing have reported breaches in the security of their websites or other systems, some of which have involved sophisticated and targeted attacks intended to obtain unauthorized access to confidential information, destroy data, disable or degrade service or sabotage systems, often through the introduction of computer viruses or malware, cyber-attacks and other means. Denial of service attacks have been launched against a number of large financial services institutions. Hacking and identity theft risks, in particular, could cause serious reputational harm. Cyber threats are rapidly evolving and we may not be able to anticipate or prevent all such attacks. Although to date we have not experienced any material losses relating to cyber-attacks or other information security breaches, there can be no assurance that we will not suffer such losses in the future. No matter how well designed or implemented our controls are, we will not be able to anticipate all security breaches of these types, and we may not be able to implement effective preventive measures against such security breaches in a timely manner. A failure or circumvention of our security systems could have a material adverse effect on our business operations and financial condition.
We regularly assess and test our security systems and disaster preparedness, including back-up systems, but the risks are substantially escalating. As a result, cybersecurity and the continued enhancement of our controls and processes to protect our systems, data and networks from attacks, unauthorized access or significant damage remain a priority. Accordingly, we may be required to expend additional resources to enhance our protective measures or to investigate and remediate any information security vulnerabilities or exposures. Any breach of our system security could result in disruption of our operations, unauthorized access to confidential customer information, significant regulatory costs, litigation exposure and other possible damages, loss or liability. Such costs or losses could exceed the amount of available insurance coverage, if any, and would adversely affect our earnings. Also, any failure to prevent a security breach or to quickly and effectively deal with such a breach could negatively impact customer confidence, damaging our reputation and undermining our ability to attract and keep customers.
We rely on third party vendors, which could expose Eastern Bank to additional cybersecurity risks.
Third party vendors provide key components of our business infrastructure, including certain data processing and information services. On Eastern Bank’s behalf, third parties may transmit confidential, propriety information. Although we require third party providers to maintain certain levels of information security, such providers may remain vulnerable to breaches, unauthorized access, misuse, computer viruses, or other malicious attacks that could ultimately compromise sensitive information. Although Eastern Bank may contractually limit liability in connection with attacks against third party providers, we remain exposed to the risk of loss associated with such vendors. In addition, a number of Eastern Bank’s vendors are large national entities with dominant market presence in their respective fields. Their services could prove difficult to replace in a timely manner if a failure or other service interruption were to occur. Failures of certain vendors to provide contracted services could adversely affect our ability to deliver products and services to customers and cause us to incur significant expenses.
Industry competition may adversely affect our degree of success.
Our profitability depends on our ability to compete successfully. We operate in a highly competitive industry that could become even more competitive as a result of legislative, regulatory and technological changes, as well as continued industry
25
Table of Contents
consolidation. This consolidation may produce larger, better-capitalized and more geographically diverse companies that are capable of offering a wider array of financial products and services at more competitive prices. For example, there have been a number of recently completed or announced mergers of financial institutions within our market areas. These mergers will, if completed, allow the merged financial institutions to benefit from cost savings and shared resources.
In our market areas, we face competition from other commercial banks, savings and loan associations, tax-exempt credit unions, financial technology companies (“fintechs”), internet banks, finance companies, mutual funds, insurance companies, brokerage and investment banking firms, mortgage companies and other financial intermediaries that offer similar services. Some of our non-bank competitors are not subject to the same extensive regulations we are and, therefore, may have greater flexibility in competing for business.
In addition, technology has lowered barriers to entry and made it possible for non-banks to offer products and services, such as loans and payment services, that traditionally were banking products, and made it possible for technology companies to compete with financial institutions in providing electronic, internet-based, and mobile phone-based financial solutions. Competition with non-banks, including technology companies, to provide financial products and services is intensifying. In particular, the activity of fintechs has grown significantly over recent years and is expected to continue to grow. Fintechs have and may continue to offer bank or bank-like products. For example, a number of fintechs have applied for commercial bank or industrial loan company charters or are actively seeking to acquire commercial banks or industrial loan companies. Recently, a fintech announced its proposed acquisition of a commercial bank in our market area. Additionally, the FDIC recently approved two federal deposit insurance applications by two proposed industrial loan companies, the first time the FDIC has done so since 2008. The federal and state bank regulatory agencies have demonstrated a willingness to charter non-traditional bank charter applicants, such as fintechs, which increases competition in the industry. In addition, other fintechs have partnered with existing banks to allow them to offer deposit products to their customers. Regulatory changes, such as the recently proposed revisions to the FDIC’s rules on brokered deposits intended to reflect recent technological changes and innovations, may also make it easier for fintechs to partner with banks and offer deposit products. In addition to fintechs, the large technology companies have begun to make efforts toward providing financial services directly to their customers and are expected to continue to explore new ways to do so. Many of these companies, including our competitors, have fewer regulatory constraints, and some have lower cost structures, in part due to lack of physical locations. Some of these companies also have greater resources to invest in technological improvements than we currently have.
Our ability to compete successfully depends on a number of additional factors, including customer convenience, quality of service, personal contacts, pricing and range of products. If we are unable to successfully compete for new customers and to retain our current customers, our business, financial condition or results of operations may be adversely affected, perhaps materially. In particular, if we experience an outflow of deposits as a result of our customers seeking investments with higher yields or greater financial stability, we may be forced to rely more heavily on borrowings and other sources of funding to operate our business and meet withdrawal demands, thereby adversely affecting our net interest margin and financial performance. In addition, we may not be able to effectively implement new technology-driven products and services or be successful in marketing these products and services to our customers. As a result, our ability to effectively compete to retain or acquire new business may be impaired, and our business, financial condition or results of operations may be adversely affected.
In addition to external competition, the financial services industry, including the banking sector, is continually undergoing rapid technological change with frequent introductions of new technology-driven products and services. In addition, new, unexpected technological changes could have a disruptive effect on the way banks offer products and services. We believe our success depends, to a great extent, on our ability to use technology to offer products and services that provide convenience to customers and to create additional efficiencies in our operations. However, we may not be able to, among other things, keep up with the rapid pace of technological changes, effectively implement new technology-driven products and services or be successful in marketing these products and services to our customers. As a result, our ability to compete effectively to attract or retain new business may be impaired, and our business, financial condition or results of operations may be adversely affected.
In addition, changes in the legal and regulatory framework under which we operate require us to update our information systems to ensure compliance. Our need to review and evaluate the impact of ongoing rule proposals, final rules and implementation guidance from regulators further complicates the development and implementation of new information systems for our business. Also, our regulators expect us to perform increased due diligence and ongoing monitoring of third party vendor relationships, thus increasing the scope of management involvement and decreasing the efficiency otherwise resulting from our relationships with third-party technology providers.
26
Table of Contents
We may not be able to successfully execute our strategic plan or achieve our performance targets.
An important goal of our strategic plan is expanding profitable loan and deposit market share through both organic growth and opportunistic strategic transactions. (For a more complete discussion of our strategic plan, please see the section of this prospectus titled “Business—Eastern Bank—Business Strategy.”) It is possible that one or more factors, including factors outside of our control, may hinder or prevent us from achieving our growth objectives. Our key assumptions include:
| • | that we will be able to attract and retain the requisite number of skilled and qualified personnel required to increase our loan origination volume, especially in our commercial banking portfolios. The marketplace for skilled personnel is competitive, which means hiring, training and retaining skilled personnel is costly and challenging and we may not be able to increase the number of our loan professionals sufficiently to achieve our loan origination targets successfully; |
| • | that we will be able to fund asset growth by growing deposits with our overall cost of funds at a rate consistent with our expectations; |
| • | that we will be able to successfully identify and purchase high-quality interest-earning assets that perform over time in accordance with our expectations; and |
| • | that there will be no material change in competitive dynamics, including as a result of our seeking to increase market share. As discussed above, we operate in a highly competitive industry and any change in our ability to retain deposits or attract new customers in line with our current expectations would adversely affect our ability to grow our revenue. |
If one or more of our assumptions prove incorrect, we may not be able to successfully execute our strategic plan, we may never achieve our indicative performance targets and any shortfall may be material.
Our business strategy includes projected growth in our core businesses, and our financial condition and results of operations could be negatively affected if we fail to grow or fail to manage our growth effectively.
We expect to continue to experience growth in the amount of our assets, the level of our deposits and the scale of our operations. Achieving our growth targets requires us to attract customers that currently bank at other financial institutions in our market, thereby increasing our share of the market. Our ability to successfully grow will depend on a variety of factors, including our customers’ ability to meet their obligations to us, our ability to attract and retain experienced bankers, the continued availability of desirable business opportunities, the competitive responses from other financial institutions in our market areas and our ability to manage our growth. Growth opportunities may not be available or we may not be able to manage our growth successfully. If we do not manage our growth effectively, our financial condition and operating results could be negatively affected.
We could fail to attract, retain or motivate highly skilled and qualified personnel, including our senior management, other key employees or members of our Board, which could impair our ability to successfully execute our strategic plan and otherwise adversely affect our business.
A cornerstone of our strategic plan involves retaining as well as hiring highly skilled and qualified personnel. Accordingly, our ability to implement our strategic plan and our future success depends on our ability to attract, retain and motivate highly skilled and qualified personnel, including our senior management and other key employees and directors. Until the Covid-19 recession, the marketplace for skilled personnel was becoming more competitive, which meant the cost of hiring, incentivizing and retaining skilled personnel was likely to increase. The rapid unemployment caused by Covid-19 has created additional uncertainty with respect to our current and future workforce. The failure to attract or retain, including as a result of an untimely death or illness of key personnel, or ability to replace a sufficient number of appropriately skilled and key personnel could place us at a significant competitive disadvantage and prevent us from successfully implementing our strategy, which could impair our ability to implement our strategic plan successfully, achieve our performance targets and otherwise have a material adverse effect on our business, financial condition and results of operations.
Limitations on the manner in which regulated financial institutions, such as us, can compensate their officers and employees, including those contained in pending rule proposals implementing requirements of Section 956 of the Dodd-Frank Act, may make it more difficult for such institutions to compete for talent with financial institutions and other companies not subject to these or similar limitations. If we are unable to compete effectively, our business, financial condition and results of operations could be adversely affected, perhaps materially.
27
Table of Contents
To the extent that we acquire other companies, our business may be negatively impacted by certain risks inherent with such acquisitions.
We have acquired and will continue to consider the acquisition of other financial services companies. To the extent that we acquire other companies in the future, our business may be negatively impacted by certain risks inherent with such acquisitions. Some of these risks include the following:
| • | The risk that the acquired business will not perform in accordance with management’s expectations; |
| • | The risk that difficulties will arise in connection with the integration of the operations of the acquired business with the operations of our businesses; |
| • | The risk that management will divert its attention from other aspects of our business; |
| • | The risk that we may lose key employees of the combined business; and |
| • | The risks associated with entering into geographic and product markets in which we have limited or no direct prior experience. |
The fair value of Eastern Bank’s investments could decline.
Most of Eastern Bank’s investment securities portfolio is designated as available-for-sale. Accordingly, unrealized gains and losses, net of tax, in the estimated fair value of the available-for-sale portfolio is recorded as other comprehensive income, a separate component of shareholders’ equity. The fair value of Eastern Bank’s investment portfolio may decline, causing a corresponding decline in shareholders’ equity. Management believes that several factors will affect the fair values of the investment portfolio, including, but not limited to, changes in interest rates or expectations of changes, the degree of volatility in the securities markets, inflation rates or expectations of inflation and the slope of the interest rate yield curve. These and other factors may impact specific categories of the portfolio differently and the effect any of these factors may have on any specific category of the portfolio cannot be predicted.
Many state and local governmental authorities have experienced deterioration of financial condition in recent years due to declining tax revenues, increased demand for services and various other factors. To the extent Eastern Bank has any municipal securities in its portfolio from issuers who are experiencing deterioration of financial condition or who may experience future deterioration of financial condition, the value of such securities may decline and could result in other-than-temporary impairment charges, which could have an adverse effect on Eastern Bank’s financial condition and results of operations. Additionally, a general, industry-wide decline in the fair value of municipal securities could significantly affect Eastern Bank’s financial condition and results of operations.
In addition to the potential decline in fair value due to volatility in the fair value of Eastern Bank’s investments, unrealized losses on investment securities result from changes in credit spreads and liquidity issues in the marketplace, along with changes in the credit profile of individual securities issuers. Under GAAP, we are required to review our investment portfolio periodically for the presence of other-than-temporary impairment of our securities, taking into consideration current market conditions, the extent and nature of changes in fair value, issuer rating changes and trends, volatility of earnings, current analysts’ evaluations, our ability and intent to hold investments until a recovery of fair value, as well as other factors. Adverse developments with respect to one or more of the foregoing factors may require us to deem particular securities to be other-than-temporarily impaired, with the credit-related portion of the reduction in the value recognized as a charge to our earnings. Subsequent valuations, in light of factors prevailing at that time, may result in significant changes in the values of these securities in future periods. Any of these factors could require us to recognize further impairments in the value of our securities portfolio, which may have an adverse effect on our results of operations in future periods.
Commercial loans, including those secured by commercial real estate, are generally riskier than other types of loans and constitute a significant portion of our loan and lease portfolio.
Our commercial loan and lease portfolio, including those secured by commercial real estate, comprised $6.4 billion, or 70% of our total loans at March 31, 2020. Commercial loans generally carry larger balances and involve a higher risk of nonpayment or late payment than residential mortgage loans. Most of the commercial loans are secured by borrower business assets such as accounts receivable, inventory, equipment and other fixed assets. Compared to real estate, these types of collateral are more difficult to monitor, harder to value, may depreciate more rapidly and may not be as readily saleable if repossessed. Repayment of commercial and industrial loans is largely dependent on the business and financial condition of
28
Table of Contents
borrowers. Business cash flows are dependent on the demand for the products and services offered by the borrower’s business. Such demand may be reduced when economic conditions are weak or when the products and services offered are viewed as less valuable than those offered by competitors. In addition, some of our commercial real estate loans are not fully amortizing and contain large balloon payments upon maturity. These balloon payments may require the borrower to either sell or refinance the underlying property in order to make the balloon payment, which may increase the risk of default or non-payment. In addition, as a result of Covid-19, we have put in place a loan modification program which has resulted in a number of commercial customers deferring their loans with us. Even with deferrals, some customers may be unable to repay their loans as agreed. Because of the risks associated with commercial loans, and especially as a result of the current economic downturn, we may experience higher rates of default than if the portfolio were more heavily weighted toward residential mortgage loans. Higher rates of default could have an adverse effect on our financial condition and results of operations. Further, if we foreclose on commercial collateral, our holding period for the collateral may be longer than for one- to four-family residential real estate loans because there are fewer potential purchasers of the collateral, which can result in substantial holding costs. In addition, vacancies, deferred maintenance, repairs and market stigma can result in prospective buyers expecting sale price concessions to offset their real or perceived economic losses for the time it takes them to return the property to profitability.
We are subject to environmental liability risk associated with lending activities.
A significant portion of our loan portfolio is secured by real estate and we could become subject to environmental liabilities with respect to one or more of these properties. At March 31, 2020, $6.7 billion, or 75% of our total loans, comprised of loans secured by real estate. During the ordinary course of business, we may foreclose on and take title to properties securing defaulted loans. In doing so, there is a risk that hazardous or toxic substances could be found on these properties. If so, we may be liable for remediation costs, as well as for personal injury and property damage, civil fines and criminal penalties regardless of when the hazardous conditions or toxic substances first affected the property. Environmental laws may require us to incur substantial expenses to address unknown liabilities and may materially reduce the affected property’s value or limit our ability to use or sell the affected property. In addition, future laws or more stringent interpretations or enforcement policies with respect to existing laws may increase our exposure to environmental liability, and we may not have adequate remedies against the prior owner or other responsible parties and could find it difficult or impossible to sell the affected properties. Although we have policies and procedures to perform an environmental review before initiating any foreclosure action on nonresidential real property, these reviews may not be sufficient to detect all potential environmental hazards. The remediation costs and any other financial liabilities associated with an environmental hazard could have a material adverse effect on our financial condition and results of operations.
Our business may be adversely affected by credit risks associated with residential property.
At March 31, 2020, one- to four-family residential real estate loans were $2.5 billion, or 27% of total loans. One- to four-family residential real estate loans include residential real estate mortgages, home equity loans and lines and investment real estate loans secured by one- to four-family residential properties. At March 31, 2020, $138 million of one- to four-family residential real estate loans were part of the commercial loan portfolio. One- to four-family residential mortgage lending, whether owner occupied or non-owner occupied, is generally sensitive to regional and local economic conditions that significantly impact the ability of borrowers to meet their loan payment obligations. As a result of Covid-19, some states, cities and towns, as well as Fannie Mae and Freddie Mac, have required banks to put in place real estate mortgage deferral programs. Our modification program includes real estate mortgages, home equity loans and lines. Deferrals alone may not be sufficient relief for real estate owners, who may default in greater numbers than anticipated. In addition, the risk of tenant rent strikes or inability to pay rent on time or at all has greatly increased with the sudden and sharp increase in the unemployment rate. Declines in real estate values could cause some of our residential mortgages to be inadequately collateralized, which would expose us to a greater risk of loss if we seek to recover on defaulted loans by selling the real estate collateral. Residential loans with combined higher loan-to-value ratios are more sensitive to declining property values than those with lower combined loan-to-value ratios and, therefore, may experience a higher incidence of default and severity of losses. In addition, if the borrowers sell their homes, they may be unable to repay their loans in full from the sale proceeds. For those home equity loans and lines of credit secured by a second mortgage, it is unlikely that we will be successful in recovering all or a portion of our loan proceeds in the event of default unless we are prepared to repay the first mortgage loan and such repayment and the costs associated with a foreclosure are justified by the value of the property. For these reasons, we may experience higher rates of delinquencies, default and losses on our home equity loans, which could have a material adverse effect on our financial condition and results of operations.
29
Table of Contents
A portion of our loan portfolio consists of loan participations, which may have a higher risk of loss than loans we originate because we are not the lead lender and we have limited control over credit monitoring.
We occasionally purchase loan participations. Although we underwrite these loan participations consistent with our general underwriting criteria, loan participations may have a higher risk of loss than loans we originate because we rely on the lead lender to disclose relevant financial information on a timely basis. Moreover, our decision regarding the classification of a loan participation and loan loss provisions associated with a loan participation is made in part based upon information provided by the lead lender. A lead lender also may not monitor a participation loan in the same manner as we would for loans that we originate. At March 31, 2020, we held loan participation interests in commercial and industrial, commercial real estate, commercial construction and business banking loans totaling $1.05 billion.
Hedging against interest rate exposure may adversely affect our earnings.
We employ techniques that limit, or “hedge,” the adverse effects of rising interest rates on our loan portfolios. We also engage in hedging strategies with respect to arrangements where our customers swap floating interest rate obligations for fixed interest rate obligations, or vice versa. Our hedging activity varies based on the level and volatility of interest rates and other changing market conditions. These techniques may include purchasing or selling futures contracts, purchasing put and call options on securities or securities underlying futures contracts, or entering into other mortgage-backed derivatives. There are, however, no perfect hedging strategies, and interest rate hedging may fail to protect us from loss. Moreover, hedging activities could result in losses if the event against which we hedge does not occur. Additionally, interest rate hedging could fail to protect us or adversely affect us because, among other things:
| • | Available interest rate hedging may not correspond directly with the interest rate risk for which protection is sought; |
| • | The duration of the hedge may not match the duration of the related liability; |
| • | The party owing money in the hedging transaction may default on its obligation to pay; |
| • | The credit quality of the party owing money on the hedge may be downgraded to such an extent that it impairs our ability to sell or assign our side of the hedging transaction; |
| • | The value of derivatives used for hedging may be adjusted from time to time in accordance with accounting rules to reflect changes in fair value; and/or |
| • | Downward adjustments, or “mark-to-market” losses, would reduce our stockholders’ equity. |
New lines of business or new products and services may subject us to additional risks.
From time to time, we may implement new lines of business or offer new products and services within existing lines of business. In addition, we will continue to make investments in research, development, and marketing for new products and services. There are substantial risks and uncertainties associated with these efforts, particularly in instances where the markets are not fully developed. In developing and marketing new lines of business and/or new products and services we may invest significant time and resources. Initial timetables for the development and introduction of new lines of business and/or new products or services may not be achieved, and price and profitability targets may not prove feasible. Furthermore, if customers do not perceive our new offerings as providing significant value, they may fail to accept our new products and services. External factors, such as compliance with regulations, competitive alternatives and shifting market preferences, may also impact the successful implementation of a new line of business or a new product or service. Furthermore, the burden on management and our information technology of introducing any new line of business and/or new product or service could have a significant impact on the effectiveness of our system of internal controls. Failure to successfully manage these risks in the development and implementation of new lines of business or new products or services could have a material adverse effect on our business, financial condition and results of operations.
We may be required to write down goodwill and other acquisition-related identifiable intangible assets.
When we acquire a business, a portion of the purchase price of the acquisition may be allocated to goodwill and other identifiable intangible assets. The excess of the purchase price over the fair value of the net identifiable tangible and intangible assets acquired determines the amount of the purchase price that is allocated to goodwill acquired. As of March 31, 2020, goodwill and other identifiable intangible assets were $377.0 million. Under current accounting guidance, if
30
Table of Contents
we determine that goodwill or intangible assets are impaired, we would be required to write down the value of these assets. We conduct an annual review to determine whether goodwill and other identifiable intangible assets are impaired. We conduct a quarterly review for indicators of impairment of goodwill and other identifiable intangible assets. Our management recently completed these reviews and concluded that no impairment charge was necessary for the quarter ended March 31, 2020. We cannot provide assurance whether we will be required to take an impairment charge in the future. Any impairment charge would have a negative effect on stockholders’ equity and financial results and may cause a decline in our stock price.
We may need to raise additional capital in the future, but that capital may not be available when it is needed or the cost of that capital may be very high.
We are required by our regulators to maintain adequate levels of capital to support our operations, which may result in our need to raise additional capital to support continued growth. Our ability to raise additional capital, if needed, will depend on conditions in the capital markets at that time, which are outside our control, and on our financial condition and performance. Accordingly, we may not be able to raise additional capital if needed on terms that are acceptable to us, or at all. If we cannot raise additional capital when needed, our operations could be materially impaired and our financial condition and liquidity could be materially and adversely affected. In addition, if we are unable to raise additional capital when required by the Massachusetts Commissioner of Banks, FDIC and/or the Federal Reserve Board, we may be subject to adverse regulatory action.
If we raise capital through the issuance of additional of common stock or other securities, it would dilute the ownership interests of existing shareholders and may dilute the per share value of our common stock. New investors may also have rights, preferences and privileges senior to our current shareholders.
We face significant legal risks, both from regulatory investigations and proceedings and from private actions brought against us.
From time to time we are named as a defendant or are otherwise involved in various legal proceedings, including class actions and other litigation or disputes with third parties. There is no assurance that litigation with private parties will not increase in the future. Actions against us may result in judgments, settlements, fines, penalties or other results adverse to us, which could materially adversely affect our business, financial condition or results of operations, or cause serious reputational harm to us. As a participant in the financial services industry, it is likely that we could continue to experience a high level of litigation related to our businesses and operations. There could be substantial cost and management diversion in such litigation and proceedings, and any adverse determination could have a materially adverse effect on our business, brand or image, or our financial condition and results of our operations.
Our businesses and operations are also subject to increasing regulatory oversight and scrutiny, which may lead to additional regulatory investigations or enforcement actions. These and other initiatives from federal and state officials may subject us to further judgments, settlements, fines or penalties, or cause us to be required to restructure our operations and activities, all of which could lead to reputational issues, or higher operational costs, thereby reducing our revenue.
The loss of deposits or a change in deposit mix could increase our cost of funding and our funding sources may prove insufficient to replace deposits at maturity and support our future growth.
Our deposits are a low cost and stable source of funding. We compete with banks and other financial institutions for deposits. Funding costs may increase if we lose deposits and are forced to replace them with more expensive sources of funding, if clients shift their deposits into higher cost products, or if we need to raise interest rates to avoid losing deposits. A reduction in our overall level of deposits would increase the extent to which we may need to rely in the future on other, more expensive sources for funding, including Federal Home Loan Bank advances, which would reduce our net income.
In order for Eastern Bank to maintain sufficient cash flow, we must maintain sufficient funds to respond to the needs of depositors and borrowers. As a part of our liquidity management, we use a number of funding sources in addition to core deposit growth and repayments and maturities of loans and investments. These additional sources consist primarily of Federal Home Loan Bank advances, proceeds from the sale of loans, federal funds purchased and brokered deposits. As we continue to grow, we are likely to become more dependent on these sources. Adverse operating results or changes in industry conditions could lead to difficulty or an inability in accessing these additional funding sources. Our financial flexibility will be severely constrained if we are unable to maintain our access to funding or if adequate financing is not available to
31
Table of Contents
accommodate future growth at acceptable interest rates. If we are required to rely more heavily on more expensive funding sources to support future growth, our revenues may not increase proportionately to cover our costs. In this case, our operating margins and results of operations would be adversely affected.
Deterioration in the performance or financial position of the Federal Home Loan Bank of Boston might restrict the Federal Home Loan Bank of Boston’s ability to meet the funding needs of its members, cause a suspension of its dividend and cause its stock to be determined to be impaired.
Significant components of Eastern Bank’s liquidity needs are met through its access to funding pursuant to its membership in the Federal Home Loan Bank of Boston. The Federal Home Loan Bank of Boston is a cooperative that provides services to its member banking institutions. The primary reason for joining the Federal Home Loan Bank of Boston is to obtain funding. The purchase of stock in the Federal Home Loan Bank of Boston is a requirement for a member to gain access to funding. Any deterioration in the Federal Home Loan Bank of Boston’s performance or financial condition may affect our ability to access funding and/or require us to deem the required investment in Federal Home Loan Bank of Boston stock to be impaired. If we are not able to access funding, we may not be able to meet our liquidity needs, which could have an adverse effect on the results of operations or financial condition. Similarly, if we deem all or part of our investment in Federal Home Loan Bank of Boston stock impaired, such action could have a material adverse effect on our results of operations or financial condition.
We may not be able to successfully implement future information technology system enhancements, which could adversely affect our business operations and profitability.
We invest significant resources in information technology system enhancements in order to provide functionality and security at an appropriate level. We may not be able to successfully implement and integrate future system enhancements, which could adversely impact the ability to provide timely and accurate financial information in compliance with legal and regulatory requirements, which could result in sanctions from regulatory authorities. Such sanctions could include fines and suspension of trading in our stock, among others. In addition, future system enhancements could have higher than expected costs and/or result in operating inefficiencies, which could increase the costs associated with the implementation as well as ongoing operations.
Failure to properly utilize system enhancements that are implemented in the future could result in impairment charges that adversely impact our financial condition and results of operations and could result in significant costs to remediate or replace the defective components. In addition, we may incur significant training, licensing, maintenance, consulting and amortization expenses during and after systems implementations, and any such costs may continue for an extended period of time.
We rely on other companies to provide key components of our business infrastructure.
Third party vendors provide key components of our business infrastructure such as internet connections, network access and core application processing. While we have selected these third party vendors carefully, we do not control their actions. Any problems caused by these third parties, including as a result of their not providing us their services for any reason or their performing their services poorly, could adversely affect our ability to deliver products and services to our customers or otherwise conduct our business efficiently and effectively. Replacing these third party vendors could also entail significant delay and expense.
Operational risks are inherent in our businesses.
Our enterprise risk management framework seeks to achieve an appropriate balance between risk and return, which is critical to optimizing stockholder value. We have established processes and procedures intended to identify, measure, monitor, report and analyze the types of risk to which we are subject, including credit, liquidity, operational, regulatory compliance and reputational. However, as with any risk management framework, there are inherent limitations to our risk management strategies as there may exist, or develop in the future, risks that we have not appropriately anticipated or identified. If our risk management framework proves ineffective, we could suffer unexpected losses and our business and results of operations could be materially adversely affected.
In addition to the necessity of maintaining our enterprise risk management framework, our operations depend on our ability to process a very large number of transactions efficiently and accurately while complying with applicable laws and
32
Table of Contents
regulations. Operational risk and losses can result from internal and external fraud; errors by employees or third parties; failure to document transactions properly or to obtain proper authorization; failure to comply with applicable regulatory requirements and conduct of business rules; equipment failures, including those caused by natural disasters or by electrical, telecommunications or other essential utility outages; business continuity and data security system failures, including those caused by computer viruses, cyber-attacks or unforeseen problems encountered while implementing major new computer systems or upgrades to existing systems; or the inadequacy or failure of systems and controls, including those of our suppliers or counterparties. Although we have implemented risk controls and loss mitigation actions, and substantial resources are devoted to developing efficient procedures, identifying and rectifying weaknesses in existing procedures and training staff, it is not possible to be certain that such actions have been or will be effective in controlling each of the operational risks we face. Any weakness in these systems or controls, or any violation or alleged violation of such laws or regulations, could result in increased regulatory supervision, enforcement actions and other disciplinary action, and have an adverse impact on our business, results of operations, reputation and ability to obtain future regulatory approvals, including those necessary to complete mergers or other acquisitions.
Changes in management’s estimates and assumptions may have a material impact on our consolidated financial statements and our financial condition or operating results.
In preparing our consolidated financial statements included in this prospectus, and those that will be included in periodic reports that we will file under the Securities Exchange Act of 1934, our management is required to make estimates and assumptions as of a specified date. These estimates and assumptions are based on management’s best estimates and experience as of that date and are subject to substantial risk and uncertainty. Materially different results may occur as circumstances change and additional information becomes known. Areas requiring significant estimates and assumptions by management include our valuation of our stock-based compensation plans and pension benefits, our determination of our income tax provision, our evaluation of the adequacy of our allowance for loan losses, our evaluation of our goodwill and other intangibles for impairment, our evaluation of our securities portfolio, our accounting for our derivative instruments, and our estimation of our fair value measurements. Please see the section of this prospectus titled “Management’s Discussion and Analysis of Financial Condition and Results of Operations—Critical Accounting Policies and Estimates” for more information.
Our internal controls, procedures and policies may fail or be circumvented.
Management regularly reviews and updates our internal controls and corporate governance policies and procedures. Any system of controls, however well-designed and operated, is based in part on certain assumptions and can provide only reasonable, not absolute, assurances that the objectives of the system are met. Our recent shift to a remote working model due to Covid-19 has required us to modify some of these controls, which are approved in advance by management and reviewed by the financial reporting internal controls manager and through internal audits. Similar to our other systems of controls, these new modifications can provide only reasonable assurances that the objectives of the system are being met. Any failure or circumvention of the controls and procedures or failure to comply with regulations related to controls and procedures could have a material adverse effect on our business, results of operations and financial condition.
Rising sea levels projected for the coastal regions of Massachusetts and New Hampshire could adversely affect our business.
We believe that progressively rising sea levels will be an area of risk over time for the coastal regions of Massachusetts and New Hampshire in our market, both as the frequency and severity of extreme weather events increase and as currently inhabited property and land parcels are exposed to episodic flooding and routinely higher tides. For example, according to a 2016 report sponsored in part by the City of Boston, sea levels in Boston, which rose approximately nine inches relative to land during the twentieth century, may rise another eight inches by 2030, and by 2050, the sea level in Boston may be as much as 1.5 feet higher than it was in 2000. The increase in the relative sea level in Boston is expected to result in higher coastal surges during storm events and, when considered with projected increases in precipitation intensities, an increase in stormwater flooding. These effects in Boston and similar conditions elsewhere in our market area may adversely affect the value of commercial and residential properties that secure some of our loans and may adversely affect economic develop in portions of our market area.
Societal responses to climate change could adversely affect our business and performance, including indirectly through impacts on our customers.
Concerns over the long-term impacts of climate change have led and will continue to lead to governmental efforts around the world to mitigate those impacts. Consumers and businesses also may change their behavior on their own as a
33
Table of Contents
result of these concerns. Eastern Bank and its customers will need to respond to new laws and regulations as well as consumer and business preferences resulting from climate change concerns. We and our customers may face cost increases, asset value reductions, operating process changes, and the like. The impact on our customers will likely vary depending on their specific attributes, including reliance on or role in carbon intensive activities. Among the impacts to Eastern Bank could be a drop in demand for our products and services, particularly in certain sectors. In addition, we could face reductions in creditworthiness on the part of some customers or in the value of assets securing loans. Our efforts to take these risks into account in making lending and other decisions, including by increasing our business with climate-friendly companies, may not be effective in protecting us from the negative impact of new laws and regulations or changes in consumer or business behavior.
We maintain a significant investment in projects that generate tax credits, which we may not be able to fully utilize, or, if utilized, may be subject to recapture or restructuring.
As part of its community reinvestment initiatives, Eastern Bank invests in qualified affordable housing projects and other tax credit investment projects. Eastern Bank receives low-income housing tax credits, investment tax credits, rehabilitation tax credits and other tax credits as a result of its investments in these limited partnership investments. At March 31, 2020, we maintained an investment of approximately $49.9 million in entities for which we receive allocations of tax credits, excluding investments of approximately $10.1 million in qualified zone academy bond investments, which we utilize to offset our income tax liability. We recorded the benefit of $1.4 million in credits for both the quarter ended March 31, 2020 and the quarter ended March 31, 2019. We intend to utilize all tax credits, as of March 31, 2020, to offset income tax liability. Substantially all of these tax credits are related to development projects that are subject to ongoing compliance requirements over certain periods of time to fully realize their value. If these projects are not operated in full compliance with the required terms, the tax credits could be subject to recapture or restructuring. Further, we may not be able to utilize any future tax credits. If we are unable to utilize our tax credits or, if our tax credits are subject to recapture or restructuring, it could have a material adverse effect on our business, financial condition and results of operations.
We depend on the accuracy and completeness of information about clients and counterparties.
In deciding whether to extend credit or enter into other transactions with customers and counterparties, we rely on information furnished by or on behalf of customers and counterparties, including financial statements and other financial information. We also may rely on representations of customers and counterparties as to the accuracy and completeness of that information and, with respect to financial statements, on reports of independent auditors. If any of such information is incorrect, then the creditworthiness of our customers and counterparties may be misrepresented, which would increase our credit risk and expose us to possible write-downs and losses.
We may not be able to successfully manage our intellectual property and may be subject to infringement claims.
We rely on a combination of owned and licensed trademarks, service marks, trade names, logos and other intellectual property rights. Third parties may challenge, invalidate, infringe or misappropriate our intellectual property, or such intellectual property may not be sufficient to provide us with competitive advantages, which could result in costly redesign efforts, discontinuance of certain services or other competitive harm. In addition, certain aspects of our business and our services rely on technologies licensed by third parties, and we may not be able to obtain or continue to obtain licenses and technologies from these third parties on reasonable terms or at all. The loss or diminution of our intellectual property protection or the inability to obtain third party intellectual property could harm our business and ability to compete.
We may also be subject to costly litigation in the event our services infringe upon or otherwise violate a third party’s proprietary rights. Third parties may have, or may eventually be granted, intellectual property rights, including trademarks, that could be infringed by our services or other aspects of our business. Third parties have made, and may make, claims of infringement against us with respect to our services or business. Any claim from third parties may result in a limitation on our ability to use the intellectual property subject to these claims. Even if we believe that intellectual property related claims are without merit, defending against such claims is time consuming and expensive and could result in the diversion of the time and attention of our management and employees. Claims of intellectual property infringement also might require us to redesign affected services, enter into costly settlement or license agreements, pay costly damage awards, or face a temporary or permanent injunction prohibiting us from marketing or selling certain of our services. Any intellectual property related dispute or litigation could have a material adverse effect on our business, financial condition and results of operations.
34
Table of Contents
Our business may be adversely affected by conditions in the financial markets and by economic conditions generally.
Weakness in the U.S. economy may adversely affect our business. Although the U.S. economy has been relatively strong in recent years, a deterioration of business and economic conditions could adversely affect the credit quality of our loans, results of operations and financial condition. Increases in loan delinquencies and default rates could adversely impact our loan charge-offs and provision for loan and lease losses. Deterioration or defaults made by issuers of the underlying collateral of our investment securities may cause additional credit-related other-than-temporary impairment charges to our income statement. Our ability to borrow from other financial institutions or to access the debt or equity capital markets on favorable terms or at all could be adversely affected by disruptions in the capital markets or other events, including actions by rating agencies and deteriorating investor expectations.
In addition to these specific effects, widespread adverse economic conditions that could affect us include:
| • | Reduced consumer spending; |
| • | Increased unemployment; |
| • | Lower wage income levels; |
| • | Declines in the market value of residential and commercial real estate; |
| • | Inflation or deflation; |
| • | Fluctuations in the value of the U.S. dollar; |
| • | Volatility in short-term and long-term interest rates (for more information regarding the potential effect of fluctuating interest rates, see “Changes in interest rates may have an adverse effect on our profitability.”); and |
| • | Higher bankruptcy filings. |
Climate change, natural disasters, public health crises, geopolitical developments, acts of terrorism and other external events could harm our business.
Natural disasters can disrupt our operations, result in damage to our properties, reduce or destroy the value of the collateral for our loans and negatively affect the economies in which we operate, which could have a material adverse effect on our results of operations and financial condition. A significant natural disaster, such as a hurricane, earthquake, fire or flood, could have a material adverse impact on our local market area and ability to conduct business, and our insurance coverage may be insufficient to compensate for losses that may occur. Public health crises, such as pandemics and epidemics, such as the global outbreak of the coronavirus, geopolitical crises, such as terrorism, war or the perception that hostilities may be imminent, political instability or other conflict, human error or other events outside of our control, could cause disruptions to our business or the United States economy as a whole, and our business and operating results could suffer. The occurrence of any such event could have a material adverse effect on our business, operations and financial condition.
Climate change may worsen the severity and impact of future hurricanes, earthquakes, fires, floods and other extreme weather-related events that could cause disruption to our business and operations. Chronic results of climate change such as shifting weather patterns could also cause disruption to our business and operations.
In addition, recent developments and reports relating to the coronavirus have coincided with heightened volatility in financial markets in the United States. If the coronavirus adversely affects the ability of our borrowers to satisfy their obligations, the demand for our loans or our business operations, or leads to a significant or prolonged impact on global markets or economic growth, our financial conditions and results of operations could be adversely affected.
Changes in accounting standards can be difficult to predict and can materially impact how we record and report our financial condition and results of operations.
Our accounting policies and methods are fundamental to how we record and report our financial condition and results of operations. From time to time, the Financial Accounting Standards Board changes the financial accounting and reporting principles that govern the preparation of our financial statements. These changes can be hard to anticipate and implement and can materially impact how we record and report our financial condition and results of operations. In some cases, we could be
35
Table of Contents
required to apply a new or revised standard retroactively, resulting in our restating prior period financial statements. Additionally, significant changes to accounting standards may require costly technology changes, additional training and personnel, and other expense that will negatively impact our operating results.
We may be required to increase our allowance for credit losses as a result of changes to an accounting standard.
In 2016, the Financial Accounting Standards Board (“FASB”) released a new standard for determining the amount of the allowance for credit losses. The new standard will be effective for us for reporting periods beginning December 31, 2021. We are adopting this standard later than our peers, and as a result, our loan loss allowance will be difficult to evaluate in comparison to our peers. The new credit loss model will be a significant change from the standard in place today, because it requires the allowance for loan losses to be calculated based on current expected credit losses (commonly referred to as the “CECL model”) rather than losses inherent in the portfolio as of a point in time. When adopted, the CECL model may increase our allowance for credit losses, which could materially affect our financial condition and results of operations. The extent of the increase and its impact to our financial condition is under evaluation but will ultimately depend upon the nature and characteristics of our portfolio at the adoption date and the macroeconomic conditions and forecasts at that date; therefore, the potential financial impact is currently unknown.
Changes to and replacement of the LIBOR Benchmark Interest Rate may adversely affect our business, financial condition, and results of operations.
We have certain loans and investment securities indexed to the London Interbank Offered Rate (“LIBOR”) to calculate the loan interest rate. We also enter into interest rate swap arrangements with customers that are indexed to LIBOR. In 2017, the United Kingdom’s Financial Conduct Authority (“FCA”), a regulator of financial services firms and financial markets in the United Kingdom, stated that it will plan for a phase out of regulatory oversight of LIBOR interest rate indices. The FCA has indicated that they will support the LIBOR indices through 2021 to allow for an orderly transition to alternative reference rates. However, this announcement indicates that the continuation of LIBOR on the current basis cannot and will not be guaranteed after 2021. Consequently, at this time, it is not possible to predict whether and to what extent banks will continue to provide submissions for the calculation of LIBOR. Similarly, it is not possible to predict whether LIBOR will continue to be viewed as an acceptable market benchmark, what rate or rates may become accepted alternatives to LIBOR, or what the effect of any such changes in views or alternatives may be on the markets for LIBOR-indexed financial instruments. In June 2017, the Alternative Reference Rates Committee (the “ARRC”) convened by the Federal Reserve Board and Federal Reserve Bank of New York announced the Secured Overnight Financing Rate (“SOFR”) as its recommended alternative to LIBOR for U.S. dollar obligations. However, because the SOFR is a broad U.S. Treasury repo financing rate that represents overnight secured funding transactions, it differs fundamentally from LIBOR.
Regulators, industry groups and certain committees (e.g., the ARRC) have published recommended fallback language for LIBOR-linked financial instruments, identified recommended alternatives for certain LIBOR rates (e.g., the SOFR as the recommended alternative to U.S. Dollar LIBOR), and proposed implementations of the recommended alternatives in floating rate instruments. However, at this time, it is not possible to predict whether these recommendations and proposals will be broadly accepted, whether they will continue to evolve and what the effect of their implementation may be on the markets for floating-rate financial instruments. The language in our LIBOR-based contracts and financial instruments has developed over time and may have various events that trigger when a successor rate to the designated rate would be selected. If a trigger is satisfied, contracts and financial instruments may give the calculation agent discretion over the substitute index or indices for the calculation of interest rates to be selected. The implementation of a substitute index or indices for the calculation of interest rates under our loan agreements with our borrowers may result in our incurring significant expenses in effecting the transition, may result in reduced loan balances if borrowers do not accept the substitute index or indices, and may result in disputes or litigation with customers over the appropriateness or comparability to LIBOR of the substitute index or indices, which could have an adverse effect on our results of operations. In addition, uncertainty as to the nature of such changes may adversely affect the market for or value of LIBOR-based loans, derivatives, investment securities and other financial obligations held by or due to Eastern Bank and could adversely impact our financial condition or results of operations.
The financial weakness of other financial institutions could adversely affect us.
Our ability to engage in routine funding transactions could be adversely affected by the actions and commercial financial weakness of other financial institutions. Financial services institutions are interconnected as a result of trading, clearing, counterparty and other relationships. We have exposure to many different counterparties, and we routinely execute
36
Table of Contents
transactions with counterparties in the financial industry, including brokers and dealers, other commercial banks, investment banks, mutual and hedge funds, and other financial institutions. As a result, defaults by, or even rumors or questions about, one or more financial services institutions, or the financial services industry generally, could lead to market-wide liquidity problems and losses or defaults by us or by other institutions and organizations. Many of these transactions expose us to credit risk in the event of default of our counterparty or client. In addition, our credit risk may be exacerbated when the collateral held by us cannot be liquidated or is liquidated at prices not sufficient to recover the full amount of the financial instrument exposure due to us. There is no assurance that any such losses would not materially and adversely affect our results of operations.
Market changes may adversely affect demand for our services and impact results of operations.
Channels for servicing our customers are evolving rapidly, with less reliance on traditional branch facilities, more use of online and mobile banking, and increased demand for universal bankers and other relationship managers who can service multiples product lines. We compete with larger providers who are rapidly evolving their service channels and escalating the costs of evolving the service process. We have a process for evaluating the profitability of our branch system and other office and operational facilities. The identification of unprofitable operations and facilities can lead to restructuring charges and introduce the risk of disruptions to revenues and customer relationships.
Changes in the equity markets could materially affect the level of assets under management and the demand for fee-based services.
Economic downturns could affect the volume of revenue from and demand for fee-based services. Revenue from Eastern Bank’s wealth management division depends in large part on the level of assets under management and administration. Market volatility and the potential to lead customers to liquidate investments, as well as lower asset values, can reduce the level of assets under management and administration and thereby decrease our investment management revenue.
Conditions in the insurance market could adversely affect our earnings.
Revenue from insurance fees and commissions could be adversely affected by fluctuating premiums in the insurance markets or other factors beyond our control. Other factors that affect insurance revenue are the profitability and growth of our clients, the renewal rate of the current insurance policies, continued development of new product and services as well as access to new markets. Our insurance revenues and profitability may also be adversely affected by new laws and regulatory developments impacting the healthcare and insurance markets.
Eastern Insurance Group LLC’s business model could become outdated as insurance carriers offer products directly to consumers.
Technological advances in the insurance market have increased the likelihood that insurance carriers would work directly with consumers to generate insurance policies. Since Eastern Insurance Group LLC acts solely as an insurance agent and does not originate insurance policies, this shift in business model could result in decreased revenue and could eventually result in the eradication of the insurance agent model altogether. As such, an increase in direct-to-consumer insurance products could result in decreased profitability for Eastern Insurance Group LLC.
Risks Related to Regulations
Monetary policies and regulations of the Federal Reserve Board could adversely affect our business, financial condition and results of operations.
In addition to being affected by general economic conditions, our earnings and growth are affected by the monetary and related policies of the Federal Reserve Board. An important function of the Federal Reserve Board is to regulate the money supply and credit conditions. Among the instruments used by the Federal Reserve Board to implement these objectives are open market purchases and sales of U.S. government securities, adjustments of the discount rate and changes in banks’ reserve requirements against bank deposits. These instruments are used in varying combinations to influence overall economic growth and the distribution of credit, bank loans, investments and deposits. Their use also affects interest rates charged on loans or paid on deposits.
37
Table of Contents
The monetary and related policies of the Federal Reserve Board have had a significant effect on the operating results of financial institutions in the past and are expected to continue to do so in the future. Changes in any of these policies are influenced by macroeconomic conditions and other factors that are beyond Eastern Bank’s control and the effects of such policies upon our business, financial condition and results of operations cannot be predicted.
Our business is highly regulated, which could limit or restrict our activities and impose financial requirements or limitations on the conduct of our business.
Eastern Bank is and Eastern Bankshares, Inc. will be subject to extensive regulation, supervision and examination by the Massachusetts Commissioner of Banks, the FDIC, the Federal Reserve Board and the Consumer Financial Protection Bureau. Federal and state laws and regulations govern numerous matters affecting us, including changes in the ownership or control of banks and bank holding companies, maintenance of adequate capital and the financial condition of a financial institution, permissible types, amounts and terms of extensions of credit and investments, permissible non-banking activities, the level of reserves against deposits and restrictions on stock repurchases and dividend payments. The FDIC and the Massachusetts Commissioner of Banks have the power to issue cease and desist orders to prevent or remedy unsafe or unsound practices or violations of law by banks subject to their regulation, and the Federal Reserve Board possesses similar powers with respect to bank holding companies and their subsidiary banks. These and other restrictions limit the manner in which we and Eastern Bank may conduct business and obtain financing.
Because our business is highly regulated, the laws, rules, regulations, and supervisory guidance and policies applicable to us are subject to regular modification and change. Changes to statutes, regulations, or regulatory policies, including changes in interpretation or implementation of statutes, regulations or policies, could affect us in substantial and unpredictable ways. Such changes could subject us to additional costs, limit the types of financial services and products we may offer, and/or increase the ability of non-banks to offer competing financial services and products, among other things. Failure to comply with laws, regulations, or policies could result in sanctions by regulatory agencies, civil money penalties, and/or reputation damage, which could have a material adverse effect on our business, financial condition, and results of operations. See the section of prospectus entitled “Supervision and Regulation” for a discussion of the regulations to which we are subject.
Regulatory authorities have extensive discretion in their supervisory and enforcement activities, including the imposition of restrictions on our operations, the classification of our assets and determination of the level of our allowance for loan losses. These regulations, along with the currently existing tax, accounting, securities, insurance, monetary laws, rules, standards, policies and interpretations control the methods by which financial institutions conduct business, implement strategic initiatives and tax compliance, and govern financial reporting and disclosures. Any change in such regulation and oversight, whether in the form of regulatory policy, regulations, legislation or supervisory action, may have a material impact on our operations. Further, changes in accounting standards can be both difficult to predict and involve judgment and discretion in their interpretation by us and our independent accounting firm. These changes could materially impact, potentially even retroactively, how we report our financial condition and results of our operations as could our interpretation of those changes.
We are subject to capital and liquidity standards that require banks and bank holding companies to maintain more and higher quality capital and greater liquidity than has historically been the case.
We became subject to new capital requirements in 2015. These new standards, which now apply and are fully phased-in as of January 1, 2019, force bank holding companies and their bank subsidiaries to maintain substantially higher levels of capital as a percentage of their assets, with a greater emphasis on common equity as opposed to other components of capital. The need to maintain more and higher quality capital, as well as greater liquidity, and generally increased regulatory scrutiny with respect to capital levels, may at some point limit our business activities, including lending, and our ability to expand. It could also result in our being required to take steps to increase our regulatory capital and may dilute shareholder value or limit our ability to pay dividends or otherwise return capital to our investors through stock repurchases.
We are subject to numerous laws designed to protect consumers, including the Community Reinvestment Act and fair lending laws, and failure to comply with these laws could lead to a wide variety of sanctions.
The Community Reinvestment Act, the Equal Credit Opportunity Act, the Fair Housing Act, and other fair lending laws and regulations impose community investment and nondiscriminatory lending requirements on financial institutions. The
38
Table of Contents
Consumer Financial Protection Bureau, the Department of Justice and other federal agencies are responsible for enforcing these laws and regulations. A successful regulatory challenge to an institution’s performance under the Community Reinvestment Act, the Equal Credit Opportunity Act, the Fair Housing Act or other fair lending laws and regulations could result in a wide variety of sanctions, including damages and civil money penalties, injunctive relief, restrictions on mergers and acquisitions, restrictions on expansion and restrictions on entering new business lines. Private parties may also have the ability to challenge an institution’s performance under fair lending laws in private class action litigation. Such actions could have a material adverse effect on our business, financial condition and results of operations.
On January 9, 2020, the FDIC and the Office of the Comptroller of the Currency published a Notice of Proposed Rulemaking that would substantially amend their respective Community Reinvestment Act regulations. The Federal Reserve Board did not join in the Community Reinvestment Act Notice of Proposed Rulemaking. It is unclear whether a final rule will be promulgated or how it will modify the current rules. It is also unclear whether the Massachusetts Commissioner of Banks will adopt corresponding changes to its Community Reinvestment Act regulations, which apply to all Massachusetts-chartered banks, including Eastern Bank.
We may incur fines, penalties and other negative consequences from regulatory violations, possibly even inadvertent or unintentional violations.
The financial services industry is subject to intense scrutiny from bank supervisors in the examination process and aggressive enforcement of federal and state regulations, particularly with respect to mortgage-related practices and other consumer compliance matters, and compliance with anti-money laundering, Bank Secrecy Act and Office of Foreign Assets Control regulations, and economic sanctions against certain foreign countries and nationals. Enforcement actions may be initiated for violations of laws and regulations and unsafe or unsound practices. We maintain systems and procedures designed to ensure that we comply with applicable laws and regulations; however, some legal/regulatory frameworks provide for the imposition of fines or penalties for noncompliance even though the noncompliance was inadvertent or unintentional and even though there were in place at the time systems and procedures designed to ensure compliance. Failure to comply with these and other regulations, and supervisory expectations related thereto, may result in fines, penalties, lawsuits, regulatory sanctions, reputation damage or restrictions on our business.
Non-compliance with the USA PATRIOT Act, Bank Secrecy Act or other laws and regulations could result in fines or sanctions.
The USA PATRIOT and Bank Secrecy Acts require financial institutions to develop programs to prevent financial institutions from being used for money laundering and terrorist activities. If such activities are detected, financial institutions are obligated to file suspicious activity reports with the U.S. Treasury’s Office of Financial Crimes Enforcement Network. These rules require financial institutions to establish procedures for identifying and verifying the identity of customers seeking to open new financial accounts. Failure to comply with these regulations could result in fines or sanctions, including restrictions on conducting acquisitions or establishing new branches. Although we have developed policies and procedures designed to assist in compliance with these laws and regulations, these policies and procedures may not be effective in preventing violations of these laws and regulations.
An increase in FDIC insurance assessments could significantly increase our expenses.
The Dodd-Frank Act eliminated the maximum Deposit Insurance Fund ratio of 1.5% of estimated deposits, and the FDIC has established a long-term ratio of 2.0%. On September 30, 2018, the Deposit Insurance Fund reserve ratio reached 1.36%, exceeding the statutorily required minimum reserve ratio of 1.35%. The FDIC has the authority to increase assessments in order to maintain the Deposit Insurance Fund ratio at particular levels. In addition, if our regulators issue downgraded ratings of Eastern Bank in connection with their examinations, the FDIC could impose significant additional fees and assessments on us.
Laws and regulations regarding privacy and data protection could have a material impact on our results of operations.
We currently are subject to state and federal rules regarding privacy and data protection, such as the Massachusetts data security law (Standards for The Protection of Personal Information of Residents of the Commonwealth). Our growth and expansion into a variety of new fields may potentially involve new U.S.-based regulatory issues/requirements, for example,
39
Table of Contents
the New York Department of Financial Services Cybersecurity Regulation or the California Consumer Privacy Act (“CCPA”). In addition, one or more members of the European Union may take the position that we are subject to the EU General Data Protection Regulation (“GDPR”) because some of our customers could or may become residents of EU states while maintaining account relationships with us. The potential costs of compliance with or imposed by new or existing laws and regulations and policies that are applicable to us may affect the use of our products and services and could have a material adverse impact on our results of operations.
Changes in tax laws and regulations and differences in interpretation of tax laws and regulations may adversely affect our financial statements and our operating results.
From time to time, local, state or federal tax authorities change tax laws and regulations, which may result in a decrease or increase to our deferred tax asset. Local, state or federal tax authorities may interpret laws and regulations differently than we do and challenge tax positions that we have taken on tax returns. This may result in differences in the treatment of revenues, deductions, credits and/or differences in the timing of these items. The differences in treatment may result in payment of additional taxes, interest, penalties or litigation costs that could have a material adverse effect on our operating results.
We may be unable to disclose some restrictions or limitations on our operations imposed by our regulators.
Bank regulatory agencies have the authority to take supervisory actions that restrict or limit a financial institution’s activities. In some instances, we are not permitted to publicly disclose these actions. In addition, as part of our regular examination process, our and our banking subsidiary’s respective regulators may advise us to operate under various restrictions as a prudential matter. Any such actions or restrictions, if and in whatever manner imposed, could adversely affect our costs and revenues. Moreover, efforts to comply with any such nonpublic supervisory actions or restrictions may require material investments in additional resources and systems, as well as a significant commitment of managerial time and attention. As a result, such supervisory actions or restrictions, if and in whatever manner imposed, could have a material adverse effect on our business and results of operations; and, in certain instances, we may not be able to publicly disclose these matters.
We could be required to act as a “source of strength” to our banking subsidiaries, which would have a material adverse effect on our business, financial condition and results of operations.
Federal Reserve Board policy historically required bank holding companies such as Eastern Bank Corporation and Eastern Bankshares, Inc. to act as a source of financial and managerial strength to their subsidiary banks. The Dodd-Frank Act codified this policy as a statutory requirement. This support may be required by the Federal Reserve Board at times when Eastern Bankshares, Inc. might otherwise determine not to provide it or when doing so might not otherwise be in the interests of the shareholders or creditors of Eastern Bankshares, Inc., and may include one or more of the following:
| • | Any extension of credit from Eastern Bankshares, Inc. to Eastern Bank or any other bank subsidiary that is included in the relevant bank’s capital would be subordinate in right of payment to depositors and certain other indebtedness of such subsidiary banks. |
| • | In the event of a bank holding company’s bankruptcy, any commitment that the bank holding company had been required to make to a federal bank regulatory agency to maintain the capital of a subsidiary bank will be assumed by the bankruptcy trustee and entitled to priority of payment. |
| • | In certain circumstances if we have two or more bank subsidiaries, one bank subsidiary could be assessed for losses incurred by another bank subsidiary. In addition, in the event of impairment of the capital stock of one of our banking subsidiaries, Eastern Bankshares, Inc., as our banking subsidiary’s shareholder, could be required to pay such deficiency. |
Risks Related to the Offering
The future price of the shares of common stock may be less than the $10.00 purchase price per share in the offering.
If you purchase shares of common stock in the offering, you may not be able to sell them later at or above the $10.00 purchase price in the offering. In many cases, shares of common stock issued by newly converted savings institutions or
40
Table of Contents
mutual holding companies have traded below the initial offering price. The aggregate purchase price of the shares of common stock sold in the offering will be based on an independent appraisal. The independent appraisal is not intended, and should not be construed, as a recommendation of any kind as to the advisability of purchasing shares of common stock. The independent appraisal is based on certain estimates, assumptions and projections, all of which are subject to material change from time to time. After the shares begin trading, the trading price of our common stock will be determined by the marketplace, and may be influenced by many factors, including prevailing interest rates, the overall performance of the economy, changes in federal tax laws, new federal and/or state laws and regulations, investor perceptions of Eastern Bankshares, Inc. and the outlook for the financial services industry in general. Price fluctuations in our common stock may be unrelated to our operating performance.
The market price and trading volume of our common stock may be volatile.
The market price of our common stock may be volatile. In addition, the trading volume in our common stock may fluctuate and cause significant price variations to occur. We cannot assure you that the market price of our common stock will not fluctuate or decline significantly in the future. Some of the factors that could negatively affect our share price or result in fluctuations in the price or trading volume of our common stock include:
| • | quarterly variations in our operating results or the quality of our assets; |
| • | operating results that vary from the expectations of management, securities analysts and investors; |
| • | changes in expectations as to our future financial performance; |
| • | announcements of innovations, new products, strategic developments, significant contracts, acquisitions and other material events by us or our competitors; |
| • | the operating and securities price performance of other companies that investors believe are comparable to us; |
| • | our future dividend practices; |
| • | future sales of our equity or equity-related securities; and |
| • | changes in global financial markets and global economies and general market conditions, such as interest rates, stock, commodity or real estate valuations or volatility. |
Our failure to effectively deploy the net proceeds of the offering may have an adverse effect on our financial performance.
We intend to contribute 50% of the net proceeds from the offering to Eastern Bank’s capital. The remaining net proceeds from the offering will be used in part to fund a loan to employee stock ownership plan to finance its purchase of shares in the offering (or possibly, after the offering, in open market purchases) and the balance will be retained by Eastern Bankshares, Inc. We may use the remaining net proceeds to invest in short-term investments and for general corporate purposes, including, subject to regulatory limitations, the repurchase shares of common stock and the payment of dividends. Eastern Bank may use the net proceeds it receives to fund new loans, expand its retail banking franchise by establishing or acquiring new branches or by acquiring other financial institutions or other financial services companies, or for other general corporate purposes. Except as noted in this prospectus, we have not allocated specific amounts of the net proceeds for any of these purposes, and we will have significant flexibility in determining the amount of the net proceeds we apply to different uses and when we apply or reinvest such proceeds. Also, certain of these uses, such as opening new branches or acquiring or merging with other financial institutions, may require the approval of the Massachusetts Commissioner of Banks, the FDIC or the Federal Reserve Board. We have not established a timetable for reinvesting the net proceeds, and we cannot predict how long we will require to reinvest the net proceeds. Our failure to utilize these funds effectively would reduce our profitability and may adversely affect the value of our common stock.
The donation to the Eastern Bank Charitable Foundation will dilute your ownership interest and adversely affect net income in 2020.
Upon approval from the Massachusetts Commissioner of Banks and the Federal Reserve Board, we intend to donate a number of shares of our common stock equal to 4.0% of the sum of the shares that will be outstanding immediately following the offering, including the number of shares to be issued to the Eastern Bank Charitable Foundation. At the minimum, midpoint, maximum and adjusted maximum of the offering range, we would donate to Eastern Bank Charitable Foundation
41
Table of Contents
5,401,042, 6,354,167, 7,307,292, and 8,403,386 shares of common stock, respectively. As a result of the donation, we expect to record an after-tax expense of approximately $62.2 million during the quarter and year in which the offering is completed, assuming we sell 201,681,250 shares of common stock in the offering. In addition, persons purchasing shares in the offering will have their ownership and voting interests in Eastern Bankshares, Inc. diluted by 4.0% due to the issuance of shares of common stock to the Eastern Bank Charitable Foundation.
Our donation to the Eastern Bank Charitable Foundation may not be tax deductible, which could reduce our profits.
We may not have sufficient profits to be able to fully use the tax deduction from our donation to the Eastern Bank Charitable Foundation. Pursuant to the Internal Revenue Code, an entity is permitted to deduct up to 10% of its taxable income (income before federal income taxes and charitable donations) in any one year for charitable donations. Any donation in excess of the 10% limit may be deducted for federal income tax purposes over each of the five years following the year in which the charitable donation is made. Accordingly, a charitable donation could, if necessary, be deducted over a six-year period. Assuming that in future years our taxable income before income tax expense is not materially less than our taxable income before income tax expense for 2019, we expect that over time we will be able to deduct for federal income tax purposes the full amount of the stock donation to the Eastern Bank Charitable Foundation.
Our return on equity may be low following the offering. This could negatively affect the trading price of our shares of common stock.
Net income divided by average stockholders’ equity, known as “return on equity,” is a ratio many investors use to compare the performance of financial institutions. Our return on equity may be low until we are able to leverage the additional capital we receive from the offering. Our return on equity will be negatively affected by added expenses associated with our employee stock ownership plan and the stock-based benefit plans we intend to adopt after the offering. Until we can increase our net interest income and non-interest income and leverage the capital raised in the offering, we expect our return on equity to be low, which may reduce the market price of our shares of common stock.
We are subject to environmental, social and governance risks that could adversely affect our reputation and the trading price of our common stock.
We are subject to a variety of environmental, social and governance risks that arise out of the set of concerns that together comprise what have become commonly known as “ESG matters.” Risks arising from ESG matters may adversely affect, among other things, our reputation and the trading price of our common stock.
As a financial institution with a diverse base of customers, vendors and suppliers, we may face potential negative publicity based on the identity of those we choose to do business with and the public’s (or certain segments of the public’s) view of those customers, vendors and suppliers. This negative publicity may be driven by adverse news coverage in traditional media and may also be spread through the use of social media platforms. If our relationships with our customers, vendors and suppliers were to become the subject of such negative publicity, our ability to attract and retain customers and employees may be negatively impacted and our stock price may also be impacted.
Additionally, investors have begun to consider how corporations are addressing ESG matters when making investment decisions. For example, certain investors are beginning to incorporate the business risks of climate change and the adequacy of companies’ responses to climate change and other ESG matters as part of their investment theses. These shifts in investing priorities may result in adverse effects on the trading price of our common stock if investors determine that we have not made sufficient progress on ESG matters.
Our stock-based benefit plans will increase our expenses and reduce our income.
We intend to adopt one or more new stock-based benefit plans after the conversion and the offering, subject to stockholder approval, which will increase our annual compensation and benefit expenses related to the stock options and stock awards granted to participants under the new stock-based benefit plans. The actual amount of these new stock-related compensation and benefit expenses will depend on the number of options and stock awards actually granted under the plans, the fair market value of our stock or options on the date of grant, the vesting period, and other factors which we cannot predict at this time. In the event we adopt stock-based benefit plans within 12 months following the conversion, the total
42
Table of Contents
shares of common stock reserved for issuance pursuant to awards of restricted stock and grants of options under such plans would be limited to 4% and 10%, respectively, of the total shares of our common stock sold in the offering. If we award restricted shares of common stock or grant options in excess of these amounts under stock-based benefit plans adopted more than 12 months after the completion of the conversion, our costs would increase further.
In addition, we will recognize compensation expense for our employee stock ownership plan when shares are committed to be released to participants’ accounts, and we will recognize compensation expense for restricted stock awards and stock options over the vesting period of awards made to recipients. We anticipate that in the first full year following the offering, our incremental compensation expense for shares purchased in the offering and for our new stock-based benefit plans will significantly increase our overall compensation expense as compared to 2019. For further discussion of our proposed stock-based plans, please refer to the section of this prospectus titled “Executive and Director Compensation—Benefits to be Considered Following Completion of the Offering.”
The implementation of stock-based benefit plans may dilute your ownership interest. Historically, stockholders have approved these stock-based benefit plans.
One or more new stock-based benefit plans that we adopt following the offering may be funded either through open market purchases or from the issuance of authorized but unissued shares of common stock. Our ability to repurchase shares of common stock to fund these plans will be subject to many factors, including applicable regulatory restrictions on stock repurchases, the availability of stock in the market, the trading price of the stock, our capital levels, alternative uses for our capital and our financial performance. Although our intention is to fund the new stock-based benefit plans through open market purchases, stockholders would experience a 12.28% dilution in ownership interest at the maximum of the offering range in the event newly issued shares of our common stock are used to fund stock options and shares of restricted common stock in amounts equal to 10% and 4%, respectively, of the shares sold in the offering. In the event we adopt the plans more than 12 months following the conversion, new stock-based benefit plans would not be subject to these limitations, and stockholders could experience greater dilution.
Although the implementation of new stock-based benefit plans would be subject to stockholder approval, historically, the overwhelming majority of stock-based benefit plans adopted by banks and their holding companies following mutual-to-stock conversions have been approved by stockholders.
We have not determined when we will adopt one or more new stock-based benefit plans. Stock-based benefit plans adopted more than 12 months following the completion of the conversion may exceed regulatory restrictions on the size of stock-based benefit plans adopted within 12 months, which would further increase our costs.
We currently expect that the number of shares available for grants of common stock and stock options will not exceed 4% and 10%, respectively, of the number of shares of common stock sold in the offering and issued to the Eastern Bank Charitable Foundation, regardless of when those plans are adopted. If, however, we adopt stock-based benefit plans more than 12 months following the completion of the offering, we would be permitted under applicable regulations to adopt equity plans under which we could grant shares of common stock or stock options exceeding 4% and 10%, respectively, of the number of shares of common stock sold in the offering and issued to the Eastern Bank Charitable Foundation. If we adopt stock-based benefit plans that provide for awards in excess of these amounts, our expenses associated with those plans would exceed the amounts estimated in the section of this prospectus titled “Pro Forma Data.” Stock-based benefit plans that provide for awards in excess of these amounts could also result in dilution to stockholders in excess of that described in the section of this prospectus titled “Executive and Director Compensation—Benefits to be Considered Following Completion of the Offering.” Although the implementation of stock-based benefit plans would be subject to shareholder approval, the timing of the implementation of such plans will be at the discretion of our Board of Directors.
Fulfilling our public company financial reporting and other regulatory obligations and transitioning to a public company will be expensive and time consuming and may strain our resources.
As a public company, we will be subject to the reporting requirements of the Exchange Act and will be required to implement specific corporate governance practices and adhere to a variety of reporting requirements under Sarbanes-Oxley and the related rules and regulations of the SEC, as well as the rules of Nasdaq. The Exchange Act will require us to file annual, quarterly and current reports with respect to our business and financial condition. Sarbanes-Oxley will require, among other things, that we maintain effective disclosure controls and procedures and integral control over financial reporting. Compliance with these
43
Table of Contents
requirements will place additional demands on our legal, accounting, finance and investor relations staff and on our accounting, financial and information systems and will increase our legal and accounting compliance costs as well as our compensation expense as we may be required to hire additional legal, accounting, tax, finance and investor relations staff. As a public company we may also need to enhance our investor relations and corporate communications functions and attract additional qualified board members. These additional efforts may strain our resources and divert management’s attention from other business concerns, which could have a material adverse effect on our business, financial condition or results of operations. We expect to incur additional incremental ongoing and one-time expenses in connection with our transition to a public company. For more information, see the section of this prospectus titled “Management’s Discussion and Analysis of Financial Condition and Results of Operations—Outlook and Trends”. The actual amount of the incremental expenses we will incur may be higher, perhaps significantly, from our current estimates for a variety of reasons, and include additional costs we may incur that we have not currently anticipated.
In accordance with Section 404 of Sarbanes-Oxley, our management will be required to conduct an annual assessment of the effectiveness of our internal control over financial reporting and include a report on these internal controls in the annual reports we will file with the SEC on Form 10-K. Our independent registered public accounting firm will not be required to formally attest to the effectiveness of our internal controls until the later of the year following the first annual report required to be filed with the SEC and the date on which we are no longer an “emerging growth company.” When required, this process will require significant documentation of our policies, procedures and systems, review of that documentation by our internal auditing and accounting staff and our outside independent registered public accounting firm, and testing of our internal control over financial reporting by our internal auditing and accounting staff and our outside independent registered public accounting firm. This process will involve considerable time and attention, may strain our internal resources, and will increase our operating costs. We may experience higher than anticipated operating expenses and outside auditor fees during the implementation of these changes and thereafter. If our independent registered public accounting firm is unable to express an opinion as to the effectiveness of our internal control over financial reporting, investors may lose confidence in the accuracy and completeness of our financial reports and the market price of our common stock could be negatively affected, and we could become subject to investigations by Nasdaq, the SEC or other regulatory authorities, which could require additional financial and management resources.
If we are not able to implement the requirements of Section 404 of Sarbanes-Oxley in a timely and capable manner, we may be subject to adverse regulatory consequences and there could be a negative reaction in the financial markets due to a loss of investor confidence in us and the reliability of our financial statements. This could have a material adverse effect on our business, financial condition or results of operations.
Due to Section 162(m) of the Internal Revenue Code, we may not be able to deduct all of the compensation of some executives, including executives of companies we may acquire in the future.
Section 162(m) of the Internal Revenue Code generally limits to $1 million annual deductions for compensation paid to “covered employees” of any “publicly held corporation.” A “publicly held corporation” includes any company that issues securities required to be registered under Section 12 of the Securities Exchange Act of 1934 or companies required to file reports under Section 15(d) of the Exchange Act, determined as of the last day of the company’s taxable year. We expect that Eastern will be deemed to be a publicly held corporation as of the last day of the taxable year in which this prospectus is filed and, as a consequence, Section 162(m) will limit the deductibility of compensation to our covered employees to $1 million beginning with the year ending December 31, 2020. Pursuant to proposed Treasury regulations issued on December 20, 2019 clarifying the changes made to Section 162(m) by the Tax Cuts and Jobs Act and the initial guidance provided by the IRS in Notice 2018-68 that was issued in August 2018, the definition of “covered employees” generally includes anyone who served as the principal executive officer (“PEO”) or principal financial officer (“PFO”) at any time during the taxable year; the three highest compensated executive officers (other than the PEO or PFO), determined under SEC rules; and any individual who was a covered employee, including of a “predecessor company,” at any point during a taxable year beginning on or after January 1, 2017, even after the employee terminates employment. We expect that in most if not all cases a publicly traded company that we might acquire in the future will be a “predecessor company.” Accordingly, we expect that the number of our covered employees will increase if Eastern acquires one or more publicly held corporations in the future.
As a result of the foregoing, under present law, we will likely not be able to deduct all of the compensation paid in 2020 and future years where Eastern qualifies as a “publicly held corporation.” Losing deductions under Section 162(m) could increase our income taxes and reduce our net income. A reduction in net income could negatively affect the price of Eastern Bankshares, Inc. stock.
44
Table of Contents
Various factors may make takeover attempts more difficult to achieve.
Certain provisions of our articles of organization and state and federal banking laws, including regulatory approval requirements, could make it more difficult for a third party to acquire control of Eastern Bankshares, Inc. without our Board of Directors’ approval. Under regulations applicable to the offering, for a period of three years following completion of the offering, no person may acquire beneficial ownership of more than 10% of our common stock without prior approval of the Federal Reserve Board and the Massachusetts Commissioner of Banks. If any person exceeds this 10% beneficial ownership threshold, shares in excess of 10% will not be counted as shares entitled to vote during the three-year period following completion of the offering. After that three-year period, the holder of shares in excess of the 10% threshold will be entitled to cast only one one-hundredth (1/100) of a vote per share for each share in excess of the 10% threshold. Under federal law, subject to certain exemptions, a person, entity or group must notify the Federal Reserve Board before acquiring control of a bank holding company. Acquisition of 10% or more of any class of voting stock of a bank holding company, including shares of our common stock, creates a rebuttable presumption that the acquirer “controls” the bank holding company. Also, a bank holding company must obtain the prior approval of the Federal Reserve Board before, among other things, acquiring direct or indirect ownership or control of more than 5% of any class of voting shares of any bank, including Eastern Bank, and certain non-bank companies.
There also are provisions in our articles of organization that may be used to delay or block a takeover attempt, including, among others, a provision that prohibits any person from casting a full vote for any shares of common stock exceeding the 10% threshold, as described above, as well as a classified Board of Directors with three-year staggered terms; the prohibition on removal of directors without cause; and the required approval of at least 80% of the voting power of the shares then-outstanding entitled to vote for business combination transactions with interested shareholders. Furthermore, shares of restricted stock and stock options that we may grant to employees and directors, stock ownership by our management and directors, employment agreements that we have entered into with our executive officers and other factors may make it more difficult for companies or persons to acquire control of Eastern Bankshares, Inc. without the consent of our Board of Directors. Taken as a whole, these statutory provisions and provisions in our articles of organization could result in our being less attractive to a potential acquirer and thus could adversely affect the market price of our common stock.
The articles of organization of Eastern Bankshares, Inc. provide that state and federal courts located in Massachusetts will be the exclusive forum for substantially all disputes between us and our shareholders, which could limit our shareholders’ ability to obtain a favorable judicial forum for disputes with us or our directors, officers or employees.
The articles of organization of Eastern Bankshares, Inc. provide that state and federal courts located in Massachusetts will be the exclusive forum for substantially all disputes between us and our shareholders, which could limit our shareholders’ ability to obtain a favorable judicial forum for disputes with us or our directors, officers or employees. The articles of organization of Eastern Bankshares, Inc. provide that, unless we consent in writing to the selection of an alternative forum, the Business Litigation Session of the Suffolk County Superior Court (the “BLS”) (1) is the sole and exclusive forum for any derivative action or proceeding brought on behalf of Eastern Bankshares, Inc., any action asserting a claim of breach of a fiduciary duty, any action asserting a claim arising pursuant to any provision of Massachusetts corporate law, or any action asserting a claim governed by the internal affairs doctrine, and (2) is a concurrent jurisdiction for any claim arising under the Securities Act of 1933 or the rules and regulations thereunder. The articles of organization also provide that the exclusive forum provision does not apply to any claim for which the federal courts have exclusive jurisdiction, including all suits brought to enforce any liability or duty created by the Exchange Act or the rules and regulations thereunder. The choice of forum provision may limit a shareholder’s ability to bring a claim in a judicial forum that the shareholder finds favorable for disputes with us or our directors and officers or other employees, which may discourage such lawsuits against us and our directors, officers and other employees. Alternatively, if a court were to find the choice of forum provision contained in our articles of organization to be inapplicable or unenforceable in an action, we may incur additional costs associated with resolving such action in other jurisdictions, which could adversely affect our business and financial condition.
The market price of our stock value may be negatively affected by applicable regulations that restrict stock repurchases by Eastern Bankshares, Inc.
Applicable regulations restrict us from repurchasing our shares of common stock during the first year following the offering unless extraordinary circumstances exist and limit us from repurchasing our shares of common stock during the first three years following the offering. Stock repurchases are a capital management tool that can enhance the value of a company’s stock, and our inability to repurchase our shares of common stock during the first year following the offering and
45
Table of Contents
limitations on our ability to repurchase our shares of common stock during the first three years following the offering may negatively affect our stock price.
You may not revoke your decision to purchase shares of Eastern Bankshares, Inc. common stock in the subscription or community offerings after you send us your order.
Funds submitted or withdrawals authorized in connection with the purchase of shares of common stock in the subscription and community offerings will be held by us until the completion or termination of the offering, including any extension of the expiration date and consummation of a syndicated offering. Because completion of the offering will be subject to regulatory approvals and an update of the independent appraisal prepared by RP Financial, LC, among other factors, there may be one or more delays in completing the offering. Orders submitted in the subscription and community offerings are irrevocable, and purchasers will have no access to their funds unless the offering is terminated, or extended beyond [EXTENSION DATE], or the number of shares to be sold in the offering is increased to more than 201,681,250 shares or decreased to fewer than 129,625,000 shares.
The distribution of subscription rights could have adverse income tax consequences.
If the subscription rights granted to certain current or former depositors of Eastern Bank are deemed to have an ascertainable value, receipt of such rights may be taxable in an amount equal to such value. Whether subscription rights are considered to have ascertainable value is an inherently factual determination. We have received a letter from RP Financial LC, our independent appraiser, which states its belief, without having undertaken any independent investigation of state or federal law or the position of the Internal Revenue Service, that as a factual matter the subscription rights will have no ascertainable market value; however, such letter is not binding on the Internal Revenue Service.
We are an emerging growth company, and because we elect to comply only with the reduced reporting and disclosure requirements applicable to emerging growth companies, our common stock may be less attractive to investors.
We are an emerging growth company, and, for as long as we continue to be an emerging growth company, we plan to take advantage of exemptions from various reporting requirements applicable to other public companies but not to emerging growth companies, including reduced disclosure obligations regarding executive compensation in our periodic reports and proxy statements, and exemptions from the requirements of holding a non-binding advisory vote on executive compensation and stockholder approval of any golden parachute payments not previously approved. Investors may find our common stock less attractive if we choose to rely on these exemptions.
As an emerging growth company, we also will not be subject to Section 404(b) of the Sarbanes-Oxley Act of 2002, which would require that our independent auditors review and attest to the effectiveness of our internal control over financial reporting. The JOBS Act also provides that an emerging growth company does not need to comply with any new or revised financial accounting standards until such date that a private company is otherwise required to comply with such new or revised accounting standards. Pursuant to the JOBS Act, we have elected to take advantage of the benefits of this extended transition period for complying with new or revised accounting standards as required when they are adopted for private companies. As a result, our operating results and financial statements may not be comparable to the operating results and financial statements of other companies who have adopted the new or revised accounting standards.
We will cease to be an emerging growth company upon the earliest of: (1) the end of the fiscal year following the fifth anniversary of the offering; (2) the first fiscal year after our annual gross revenues are $1.07 billion or more; (3) the date on which we have, during the previous three-year period, issued more than $1.0 billion in non-convertible debt securities; or (4) as of December 31 in any fiscal year in which the market value of our common stock held by non-affiliates exceeded $700 million at the end of June 30 of that fiscal year. In light of the minimum offering expected under the appraisal, we expect that we will cease to be an emerging growth company as of December 31, 2021. Once we cease to be an emerging growth company, we will not be entitled to the exemptions provided in the JOBS Act discussed above.
46
Table of Contents
There is no prior public market for our common stock, and one may not develop.
Prior to the offering, we have never issued capital stock and there has not been a public trading market for our common stock. We intend to apply to have our common stock listed for trading on Nasdaq under the symbol “EBC,” subject to completion of the offering and compliance with certain conditions. However, there can be no assurance that an active trading market will develop or be sustained after the offering. If an active trading market does not develop, you may have difficulty selling your shares of common stock at an attractive price, or at all. The market price of our common stock may decline below the initial offering price, and you may not be able to sell your common stock at or above the price you paid in the offering, or at all.
47
Table of Contents
SELECTED CONSOLIDATED FINANCIAL AND OTHER DATA
The following tables set forth historical selected consolidated financial and other data as of the dates and for the periods indicated. The following data is only a summary and should be read together with our consolidated financial statements and the related notes appearing elsewhere in this prospectus and the “Management’s Discussion and Analysis of Financial Condition and Results of Operations” section of this prospectus. The information as of and for the three months ended March 31, 2020 and 2019 was derived, in part, from our unaudited consolidated financial statements appearing elsewhere in this prospectus. The information as of and for the years ended December 31, 2019 and 2018 was derived, in part, from our audited consolidated financial statements appearing elsewhere in this prospectus. The information as of and for the years ended December 31, 2017, 2016 and 2015 was derived, in part, from our consolidated financial statements not appearing in this prospectus. Our historical results are not necessarily indicative of the results that may be expected in the future.
| As of March 31, | As of December 31, | |||||||||||||||||||||||
| 2020 | 2019 | 2018 | 2017 | 2016 | 2015 | |||||||||||||||||||
| (In thousands) | ||||||||||||||||||||||||
| Selected Financial Condition Data: |
||||||||||||||||||||||||
| Total assets |
$ | 12,343,754 | $ | 11,628,775 | $ | 11,378,287 | $ | 10,873,073 | $ | 9,801,109 | $ | 9,588,786 | ||||||||||||
| Cash and cash equivalents |
766,449 | 362,602 | 259,708 | 311,153 | 104,750 | 683,796 | ||||||||||||||||||
| Trading securities |
652 | 961 | 52,899 | 46,791 | 51,663 | 61,050 | ||||||||||||||||||
| Securities available for sale |
1,549,927 | 1,508,236 | 1,455,898 | 1,504,810 | 1,207,596 | 979,647 | ||||||||||||||||||
| Loans, net of allowance for loan losses and unamortized premiums, net of unearned discounts and deferred fees |
8,971,605 | 8,899,184 | 8,774,913 | 8,153,986 | 7,635,838 | 7,069,066 | ||||||||||||||||||
| Federal Home Loan Bank stock, at cost |
8,805 | 9,027 | 17,959 | 24,270 | 15,342 | 10,548 | ||||||||||||||||||
| Goodwill and other intangibles, net |
377,033 | 377,734 | 381,276 | 373,042 | 362,980 | 362,762 | ||||||||||||||||||
| Total liabilities |
10,681,020 | 10,028,622 | 9,945,146 | 9,542,559 | 8,546,182 | 8,383,772 | ||||||||||||||||||
| Total deposits |
10,309,011 | 9,551,392 | 9,399,493 | 8,815,452 | 8,188,950 | 8,133,730 | ||||||||||||||||||
| Total borrowings |
31,427 | 235,395 | 334,287 | 526,505 | 154,331 | 53,048 | ||||||||||||||||||
| Total equity |
1,662,734 | 1,600,153 | 1,433,141 | 1,330,514 | 1,254,927 | 1,205,014 | ||||||||||||||||||
| Nonperforming loans |
49,087 | 43,775 | 26,591 | 18,645 | 22,787 | 16,904 | ||||||||||||||||||
| Nonperforming assets |
49,127 | 43,775 | 26,626 | 18,680 | 37,274 | 31,529 | ||||||||||||||||||
| For the Three Months Ended March 31, |
For the Years Ended December 31, | |||||||||||||||||||||||||||
| 2020 | 2019 | 2019 | 2018 | 2017 | 2016 | 2015 | ||||||||||||||||||||||
| (In thousands) | ||||||||||||||||||||||||||||
| Selected Operating Data: |
||||||||||||||||||||||||||||
| Interest and dividend income |
$ | 106,159 | $ | 111,483 | $ | 445,017 | $ | 415,166 | $ | 345,406 | $ | 299,194 | $ | 280,796 | ||||||||||||||
| Interest expense |
6,013 | 8,811 | 33,753 | 25,122 | 6,892 | 5,620 | 5,819 | |||||||||||||||||||||
|
|
|
|
|
|
|
|
|
|
|
|
|
|
|
|||||||||||||||
| Net interest income |
100,146 | 102,672 | 411,264 | 390,044 | 338,514 | 293,574 | 274,977 | |||||||||||||||||||||
| Provision for loan losses |
28,600 | 3,000 | 6,300 | 15,100 | 5,800 | 7,900 | (325 | ) | ||||||||||||||||||||
|
|
|
|
|
|
|
|
|
|
|
|
|
|
|
|||||||||||||||
| Net interest income after provision for loan losses |
71,546 | 99,672 | 404,964 | 374,944 | 332,714 | 285,674 | 275,302 | |||||||||||||||||||||
| Noninterest income |
33,369 | 47,800 | 182,299 | 180,595 | 197,727 | 169,128 | 153,007 | |||||||||||||||||||||
| Noninterest expense |
(95,172 | ) | (104,829 | ) | (412,684 | ) | (397,928 | ) | (389,413 | ) | (367,643 | ) | (333,695 | ) | ||||||||||||||
|
|
|
|
|
|
|
|
|
|
|
|
|
|
|
|||||||||||||||
| Income before income taxes |
9,743 | 42,643 | 174,579 | 157,611 | 141,028 | 87,159 | 94,614 | |||||||||||||||||||||
| Provision for income taxes |
1,298 | 9,678 | 39,481 | 34,884 | 54,331 | 24,445 | 32,050 | |||||||||||||||||||||
|
|
|
|
|
|
|
|
|
|
|
|
|
|
|
|||||||||||||||
| Net income |
$ | 8,445 | $ | 32,965 | $ | 135,098 | $ | 122,727 | $ | 86,697 | $ | 62,714 | $ | 62,564 | ||||||||||||||
|
|
|
|
|
|
|
|
|
|
|
|
|
|
|
|||||||||||||||
48
Table of Contents
| As of or For the Three Months Ended March 31, |
As of or For the Years Ended December 31, | |||||||||||||||||||||||||||
| 2020 | 2019 | 2019 | 2018 | 2017 | 2016 | 2015 | ||||||||||||||||||||||
| Performance Ratios: |
||||||||||||||||||||||||||||
| Return on average assets (1)(6) |
0.29 | % | 1.18 | % | 1.18 | % | 1.10 | % | 0.83 | % | 0.63 | % | 0.65 | % | ||||||||||||||
| Return on average equity (2)(6) |
2.08 | % | 9.17 | % | 8.75 | % | 9.02 | % | 6.62 | % | 5.06 | % | 5.33 | % | ||||||||||||||
| Interest rate spread (FTE) (3)(6) |
3.64 | % | 3.82 | % | 3.74 | % | 3.68 | % | 3.59 | % | 3.28 | % | 3.13 | % | ||||||||||||||
| Net interest margin (FTE) (4)(6) |
3.80 | % | 4.05 | % | 3.96 | % | 3.84 | % | 3.65 | % | 3.33 | % | 3.17 | % | ||||||||||||||
| Noninterest expenses to average assets (6) |
3.25 | % | 3.77 | % | 3.62 | % | 3.57 | % | 3.75 | % | 3.71 | % | 3.45 | % | ||||||||||||||
| Efficiency ratio (5) |
71.28 | % | 69.67 | % | 69.53 | % | 69.73 | % | 72.62 | % | 79.46 | % | 77.97 | % | ||||||||||||||
| Average interest-earning assets to average interest-bearing liabilities |
169.37 | % | 165.51 | % | 167.46 | % | 167.29 | % | 174.98 | % | 174.87 | % | 165.52 | % | ||||||||||||||
| Capital Ratios: |
||||||||||||||||||||||||||||
| Average equity to average assets |
16.56 | % | 14.64 | % | 13.53 | % | 12.22 | % | 12.60 | % | 12.51 | % | 12.15 | % | ||||||||||||||
| Total capital to risk weighted assets |
13.57 | % | 12.68 | % | 13.56 | % | 12.41 | % | 12.04 | % | 11.63 | % | 11.69 | % | ||||||||||||||
| Tier 1 capital to risk weighted assets |
12.42 | % | 11.77 | % | 12.66 | % | 11.51 | % | 11.15 | % | 10.76 | % | 10.83 | % | ||||||||||||||
| Common equity tier 1 capital to risk weighted assets |
12.42 | % | 11.77 | % | 12.66 | % | 11.51 | % | 11.15 | % | 10.76 | % | 10.83 | % | ||||||||||||||
| Tier 1 capital to average assets |
11.28 | % | 10.71 | % | 11.47 | % | 10.39 | % | 9.85 | % | 9.87 | % | 9.56 | % | ||||||||||||||
| Asset Quality Ratios: |
||||||||||||||||||||||||||||
| Allowance for loan losses as a percentage of total loans |
1.20 | % | 0.92 | % | 0.92 | % | 0.91 | % | 0.90 | % | 0.91 | % | 0.92 | % | ||||||||||||||
| Allowance for loan losses as a percentage of nonperforming loans |
222.34 | % | 295.85 | % | 188.00 | % | 303.32 | % | 397.48 | % | 308.02 | % | 387.48 | % | ||||||||||||||
| Net charge-offs (recoveries) to average outstanding loans during the period (6) |
0.08 | % | 0.05 | % | 0.05 | % | 0.10 | % | 0.02 | % | 0.04 | % | (0.03 | )% | ||||||||||||||
| Nonperforming loans as a percentage of total loans |
0.54 | % | 0.31 | % | 0.49 | % | 0.30 | % | 0.23 | % | 0.30 | % | 0.24 | % | ||||||||||||||
| Nonperforming loans as a percentage of total assets |
0.40 | % | 0.25 | % | 0.38 | % | 0.23 | % | 0.17 | % | 0.23 | % | 0.18 | % | ||||||||||||||
| Total nonperforming assets as a percentage of total assets |
0.40 | % | 0.25 | % | 0.38 | % | 0.23 | % | 0.17 | % | 0.38 | % | 0.33 | % | ||||||||||||||
| (1) | Represents net income divided by average total assets. |
| (2) | Represents net income divided by average equity. |
| (3) | Represents the difference between average yield on average interest-earning assets and the average cost of interest-bearing liabilities for the periods on a fully tax-equivalent (FTE) basis. |
| (4) | Represents net interest income as a percentage of average interest-earning assets adjusted on a FTE basis. |
| (5) | Represents noninterest expenses divided by the sum of net interest income and noninterest income. |
| (6) | Ratios have been annualized. |
Presentation of regulatory measures, some of which follow regulatory definitions rather than GAAP, provides a meaningful base for comparability to other financial institutions. Such measures are used by the various banking regulators in reviewing the performance, stability, and capital adequacy of financial institutions they regulate. Although these regulatory measures are not GAAP terms, they are not considered “non-GAAP” under U.S. financial reporting rules as long as their presentation conforms to regulatory standards.
49
Table of Contents
The following tables set forth historical selected consolidated financial and other data as of the dates and for the periods indicated. The following data is only a summary and should be read together with our consolidated financial statements and the related notes appearing elsewhere in this prospectus and the “Management’s Discussion and Analysis of Financial Condition and Results of Operations” section of this prospectus. The information as of and for the six months ended June 30, 2020 and 2019 is unaudited and reflects all normal recurring adjustments that are, in the opinion of management, necessary for a fair presentation of the results for the interim periods presented. In addition, the information as of and for the six months ended June 30, 2020 represents the most current information available and are subject to change because our financial closing procedures for the quarter ended June 30, 2020 are not yet complete. Our actual results may differ materially from these estimates due to the completion of our financial closing procedures or final adjustments that may arise between now and the time the financial statements for our quarter ended June 30, 2020 are finalized. This data has been prepared by, and is the responsibility of, management. Our independent registered public accounting firm, Ernst & Young LLP, has not audited, reviewed or compiled this information. Accordingly, Ernst & Young LLP does not express an opinion or any other form of assurance with respect thereto. The information as of and for the year ended December 31, 2019 was derived, in part, from our audited consolidated financial statements appearing elsewhere in this prospectus. Our historical results are not necessarily indicative of the results that may be expected in the future.
| As of June 30, | As of December 31, | |||||||
| 2020 | 2019 | |||||||
| (In thousands) | ||||||||
| Selected Financial Condition Data: |
||||||||
| Total assets |
$ | 13,996,523 | $ | 11,628,775 | ||||
| Cash and cash equivalents |
1,432,561 | 362,602 | ||||||
| Trading securities |
— | 961 | ||||||
| Securities available for sale |
1,600,354 | 1,508,236 | ||||||
| Loans, net of allowance for loan losses and unamortized premiums, net of unearned discounts and deferred fees |
9,862,980 | 8,899,184 | ||||||
| Federal Home Loan Bank stock, at cost |
8,805 | 9,027 | ||||||
| Goodwill and other intangibles, net |
376,331 | 377,734 | ||||||
| Total liabilities |
12,302,893 | 10,028,622 | ||||||
| Total deposits |
11,846,765 | 9,551,392 | ||||||
| Total borrowings |
29,155 | 235,395 | ||||||
| Total equity |
1,693,630 | 1,600,153 | ||||||
| Nonperforming loans |
55,395 | 43,775 | ||||||
| Nonperforming assets |
55,435 | 43,775 | ||||||
| For the Six Months Ended June 30, |
||||||||
| 2020 | 2019 | |||||||
| (In thousands) | ||||||||
| Selected Operating Data: |
||||||||
| Interest and dividend income |
$ | 208,092 | $ | 224,321 | ||||
| Interest expense |
9,191 | 18,126 | ||||||
|
|
|
|
|
|||||
| Net interest income |
198,901 | 206,195 | ||||||
| Provision for loan losses |
37,200 | 4,500 | ||||||
|
|
|
|
|
|||||
| Net interest income after provision for loan losses |
161,701 | 201,695 | ||||||
| Noninterest income |
81,026 | 93,432 | ||||||
| Noninterest expense |
195,937 | 206,399 | ||||||
|
|
|
|
|
|||||
| Income before income taxes |
46,790 | 88,728 | ||||||
| Provision for income taxes |
8,495 | 20,710 | ||||||
|
|
|
|
|
|||||
| Net income |
$ | 38,295 | $ | 68,018 | ||||
|
|
|
|
|
|||||
50
Table of Contents
| As of or For the Six Months Ended June 30, |
||||||||
| 2020 | 2019 | |||||||
| Performance Ratios: |
||||||||
| Return on average assets (1)(6) |
0.61 | % | 1.21 | % | ||||
| Return on average equity (2)(6) |
4.64 | % | 9.20 | % | ||||
| Interest rate spread (FTE) (3)(6) |
3.38 | % | 3.80 | % | ||||
| Net interest margin (FTE) (4)(6) |
3.49 | % | 4.03 | % | ||||
| Noninterest expenses to average assets (6) |
3.11 | % | 3.68 | % | ||||
| Efficiency ratio (5) |
70.00 | % | 68.89 | % | ||||
| Average interest-earning assets to average interest-bearing liabilities |
172.86 | % | 165.60 | % | ||||
| Capital Ratios: |
||||||||
| Average equity to average assets |
13.09 | % | 13.16 | % | ||||
| Total capital to risk weighted assets |
[ | ]% | 12.79 | % | ||||
| Tier 1 capital to risk weighted assets |
[ | ]% | 11.89 | % | ||||
| Common equity tier 1 capital to risk weighted assets |
[ | ]% | 11.89 | % | ||||
| Tier 1 capital to average assets |
[ | ]% | 10.99 | % | ||||
| Asset Quality Ratios: |
||||||||
| Allowance for loan losses as a percentage of total loans |
1.17 | % | 0.92 | % | ||||
| Allowance for loan losses as a percentage of nonperforming loans |
210.55 | % | 251.34 | % | ||||
| Net charge-offs (recoveries) to average outstanding loans during the period (6) |
0.06 | % | 0.06 | % | ||||
| Nonperforming loans as a percentage of total loans |
0.56 | % | 0.36 | % | ||||
| Nonperforming loans as a percentage of total assets |
0.40 | % | 0.29 | % | ||||
| Total nonperforming assets as a percentage of total assets |
0.40 | % | 0.29 | % | ||||
| (1) | Represents net income divided by average total assets. |
| (2) | Represents net income divided by average equity. |
| (3) | Represents the difference between average yield on average interest-earning assets and the average cost of interest-bearing liabilities for the periods on a fully tax-equivalent (FTE) basis. |
| (4) | Represents net interest income as a percentage of average interest-earning assets adjusted on a FTE basis. |
| (5) | Represents noninterest expenses divided by the sum of net interest income and noninterest income. |
| (6) | Ratios have been annualized. |
Presentation of regulatory measures, some of which follow regulatory definitions rather than GAAP, provides a meaningful base for comparability to other financial institutions. Such measures are used by the various banking regulators in reviewing the performance, stability, and capital adequacy of financial institutions they regulate. Although these regulatory measures are not GAAP terms, they are not considered “non-GAAP” under U.S. financial reporting rules as long as their presentation conforms to regulatory standards.
Covid-19 Impact
The Covid-19 pandemic has had and continues to have an adverse effect on our business and the markets in which we operate. We expect the short- and long-term economic consequences of the Covid-19 pandemic to our customers will continue to be significant, and that the continuing health and safety concerns relating to the ongoing pandemic will change the way we conduct our business and interact with our customers. Consistent with our philosophy of seeking to be a source of economic strength to our communities, we have taken a broad range of steps to help our colleagues, our borrowers and our communities during the Covid-19 pandemic.
Our Colleagues. For our colleagues, we have enabled more than half of our employees to work remotely and we are providing premium pay for those colleagues who travel to our workplaces to serve in customer-facing positions or other positions that require them to work on-site. We have taken significant measures to ensure the health of our colleagues who must work in our branches, including promoting online and mobile banking and automatic teller machines/interactive teller machines transactions in an effort to limit in-branch transactions and limiting access to lobbies in branches with drive-through banking.
51
Table of Contents
Our Borrowers. In light of the Covid-19 pandemic, we have temporarily modified our practices with respect to collection of delinquent loans to assist our customers during this difficult economic time.
For our retail customers, we suspended all collection of overdue payments beginning March 16, 2020, including residential property foreclosure and related property sales.
| • | For our commercial and small business customers, starting in March 2020, we began modifying the terms of loans with customers impacted by the Covid-19 pandemic. These modifications are intended to provide customers with temporary relief. Generally, these modifications are for three to six months and allow customers to temporarily cease making either principal payments or both interest and principal payments. Through June 30, 2020, we had modified approximately $946.1 million of loans, of which approximately 56% were for full payment deferrals (both interest and principal) and 44% deferred only principal payments. From January 1, 2020 through June 30, 2020, we have modified $558.9 million of commercial real estate loans, including construction loans, $157.4 million of commercial and industrial loans, $106.9 million of business banking loans, $92.8 million of residential real estate loans and $30.1 million of consumer loans, including home equity loans. Payment of deferred interest is not required prior to the maturity of the loan. We believe these actions provide our customers with the best chance to meet their longer-term obligations and for us to work with those who will not be able to meet their obligations or default on their loans. Most of these deferrals will end in the third or fourth quarter of year ending December 31, 2020. We have not deferred our recognition of interest income with respect to loans subject to modifications. |
| • | Upon the expiration of the deferral period, borrowers will be required to resume making previously scheduled loan payments. Although we expect many of our customers will resume making timely loan payments after their deferral period ends, we anticipate that some will be not able to do so, and we will need to begin collection activities. As of the date of this prospectus, we are unable to reasonably estimate the aggregate amount of loans that will likely become delinquent after the respective deferral period. |
The following table shows certain data related to the impact of the Covid-19 pandemic on our commercial loans as of June 30, 2020:
| Loan Balance |
Loan Exposure |
Number of Borrowers |
Covid-19 Modification % (1) |
|||||||||||||
| (Dollars in thousands) | ||||||||||||||||
| Commercial and Industrial: Commercial and Business Banking |
||||||||||||||||
| Restaurants |
$ | 148,373 | $ | 156,747 | 420 | 60.6 | % | |||||||||
| Construction contractors |
105,127 | 281,435 | 1,036 | 11.0 | % | |||||||||||
| Non-essential retail |
41,859 | 101,736 | 436 | 2.6 | % | |||||||||||
| Entertainment and recreation |
34,368 | 49,664 | 158 | 31.1 | % | |||||||||||
| Educational and child care services |
16,219 | 50,948 | 196 | 5.3 | % | |||||||||||
| Private medical and dental offices |
16,299 | 34,602 | 294 | 20.2 | % | |||||||||||
| Water and air passenger transportation |
19,811 | 30,557 | 12 | 0.1 | % | |||||||||||
| Auto and other vehicle dealerships |
7,557 | 10,138 | 21 | — | % | |||||||||||
| Hotels |
377 | 527 | 12 | 32.3 | % | |||||||||||
| Commercial Real Estate: Commercial and Business Banking |
||||||||||||||||
| Retail |
437,267 | 458,839 | 298 | 26.7 | % | |||||||||||
| Hotels |
179,577 | 181,076 | 45 | 37.6 | % | |||||||||||
| Auto dealerships |
78,152 | 80,361 | 36 | 2.8 | % | |||||||||||
| Restaurants |
51,566 | 52,766 | 67 | 48.5 | % | |||||||||||
|
|
|
|
|
|
|
|
|
|||||||||
| $ | 1,136,552 | $ | 1,489,396 | 3,031 | 28.9 | % | ||||||||||
| (1) | The percentage of loans in each category that we modified primarily due to the effects on the borrower of the Covid-19 pandemic after March 24, 2020, which was the effective date of the Massachusetts emergency order requiring all businesses and organizations that did not provide “Covid-19 essential services” to close their workplaces and facilities to workers, customers and the public. |
| • | During the quarter ended June 30, 2020, we originated $1.1 billion of loans to approximately 8,100 borrowers under the Paycheck Protection Program (PPP) under the CARES Act. The vast majority of our PPP borrowers are existing commercial and small business borrowers, non-profit customers, retail banking customers and clients of Eastern Wealth Management and Eastern Insurance Group LLC. The PPP generally provides eligible employers |
52
Table of Contents
| with funds to pay payroll costs (including benefits), interest on mortgages, rent and utilities, and a PPP loan will generally be forgiven to the extent the loan proceeds are applied to eligible expenditures during a specified measurement period, subject to certain reductions based on decreases in the employer’s full-time equivalent employees or salary and wages during the measurement period. As amended on June 5, 2020, the CARES Act provides for a measurement period of 24 weeks (or, if earlier, through December 31, 2020), though for any PPP loan originated before June 5, 2020, the borrower may elect to use an eight-week measurement period. We anticipate that the vast majority of our PPP exposure will be forgiven late in the year ending December 31, 2020 or early in the year ending December 31, 2021. To the extent not forgiven, a PPP loan is intended to be 100% guaranteed by the SBA and will have a term of two years (or five years if the PPP loan is made after June 4, 2020) and carry an interest rate of 1%. Only $4.9 million of our PPP exposure at June 30, 2020 had a maturity of five years; all of our other PPP loans outstanding at June 30, 2020 have a two-year maturity. |
| • | We received approximately $35.8 million of PPP loan origination fees from the Small Business Administration. We also deferred certain origination costs, totaling $3.5 million, related to PPP loans. Both the loan fees and the deferred costs will be amortized through interest income over the life of the PPP loans. We are using an initial amortization period of 24 months, but the amortization period will be adjusted as PPP loans are forgiven or repaid. If, as we anticipate, a high percentage of our PPP loans will be forgiven or repaid in full late in the year ending December 31, 2020 or early in the year ending December 31, 2021, much of our interest income from the PPP origination fees (net of deferred costs) will be recognized late in the year ending December 31, 2020 or early in the year ending December 31, 2021. There have been multiple changes to PPP forgiveness terms, and there may be more changes before many our PPP borrowers decide their forgiveness strategies. Changes in borrower forgiveness strategies could delay our recognition of PPP fees. |
The following table shows certain data related to our PPP loans as of June 30, 2020:
| Loan Size |
Loan Balance |
Number of Loans |
Fees Collected |
|||||||||
| (Dollars in Thousands) | ||||||||||||
| $0 to $50 thousand |
$ | 95,528 | 4,987 | $ | 4,826 | |||||||
| $50 thousand to $150 thousand |
148,994 | 1,731 | 7,419 | |||||||||
| $150 thousand to $1 million |
410,872 | 1,176 | 15,374 | |||||||||
| $1 million to $2 million |
190,254 | 137 | 5,618 | |||||||||
| $2 million to $5 million |
176,277 | 59 | 1,744 | |||||||||
| Over $5 million |
78,256 | 13 | 785 | |||||||||
|
|
|
|
|
|
|
|||||||
| Total |
$ | 1,100,181 | 8,103 | $ | 35,766 | |||||||
Our Operating Results. The Covid-19 pandemic has had a significant impact on our operating results for the six months ended June 30, 2020, and we believe it will continue to have a significant impact for at least the remainder of the year ending December 31, 2020 and likely continuing into the year ending December 31, 2021.
| • | During March 2020, the Federal Reserve took multiple steps to lower interest rates and reduced the target range for the federal funds rate to between 0.0% and 0.25%, compared to the previous target of between 1.00% and 1.25%. These interest rate reductions, combined with the decline in longer term rates, will lower our net interest income over time from the levels we experienced in the year ended December 31, 2019. In the year ending December 31, 2020, the impact of the PPP loan income described above will partially offset the impact of lower rates in the year ending December 31, 2020, but compared to the year ended December 31, 2019, we expect lower net interest income and a lower net interest margin in the year ending December 31, 2021 and for the foreseeable future thereafter unless and until interest rates increase. |
| • | Our loan loss provision for the quarter ended June 30, 2020 was $8.6 million compared to $28.6 million for the quarter ended March 31, 2020. This reduction was due in part to the impact of loan modifications and PPP loans, described above, that provided liquidity to many borrowers. We experienced negative migrations in our loan risk ratings in the quarter ended June 30, 2020, although the extent of negative migrations was less than we experienced in the quarter ended March 31, 2020. Many of the traditional measures of credit risk such as delinquency trends and the amount of non-performing loans as a percentage of total loans are not as useful as they have been in the past due to the large number of modifications and PPP originations that have temporarily helped many borrowers. We expect our loan loss provision to be greater in remainder of the year ending December 31, 2020 as compared to comparable prior periods, as the positive impacts of the modifications and PPP loans wane. The economic |
53
Table of Contents
| uncertainties caused by the Covid-19 pandemic are significant, and the timing and pace of the economic recovery both locally and nationally will determine the severity and timing of our future loan losses. For more information, see the section of this prospectus titled “Risk Factors—Risks Related to Covid-19 Pandemic and Associated Economic Slowdown.” |
Our Communities. To continue providing critical banking services in underbanked innercity communities served by branches without drive-through banking capabilities, we have committed to remaining open in these communities to ensure our customers continue to have a place to bank. To further support our communities, the Eastern Bank Charitable Foundation has directed approximately $8 million through June 30, 2020 in charitable donations to help address food, shelter, small business and housing stability, particularly for vulnerable populations, as well as providing help to public health organizations fighting to contain the spread of Covid-19.
Financial Condition
Comparison of June 30, 2020 and December 31, 2019
Cash and cash equivalents
Total cash and cash equivalents increased by $1.0 billion, or 275.8%, to $1.4 billion at June 30, 2020 from $362.6 million at December 31, 2019. This increase resulted from very strong customer deposit growth, which exceeded our funding needs for new lending activities.
Securities
Our securities portfolio has grown year-to-date. Available for sale securities increased $92.0 million, or 6.1%, to $1.6 billion at June 30, 2020 from $1.5 billion at December 31, 2019. This increase is due to investment purchases, as well as an increase in unrealized gains during the six months ended June 30, 2020. The decrease in interest rates during the six months ended June 30, 2020 caused higher investment by our customers, which resulted in higher returns for certain investments and led to the increase in unrealized gains. Trading securities totaled $1.0 million at December 31, 2019, and all securities have matured as of June 30, 2020.
We did not have held-to-maturity investments at June 30, 2020 or December 31, 2019.
A portion of our securities portfolio continues to be tax-exempt. Investments in tax-exempt securities totaled $281.3 million at June 30, 2020, compared to $284.5 million at December 31, 2019.
Loans
The following table shows the composition of our loan portfolio, by category, as of the dates indicated:
Loan Portfolio Composition
| June 30, | December 31, | |||||||
| 2020 | 2019 | |||||||
| Amount | Amount | |||||||
| (In thousands) | ||||||||
| Commercial and industrial |
$ | 2,271,700 | $ | 1,642,184 | ||||
| Commercial real estate |
3,584,358 | 3,535,441 | ||||||
| Commercial construction |
282,246 | 273,774 | ||||||
| Business banking |
1,234,961 | 771,498 | ||||||
| Residential real estate |
1,400,855 | 1,428,630 | ||||||
| Consumer home equity |
905,484 | 933,088 | ||||||
| Other consumer |
334,734 | 402,431 | ||||||
|
|
|
|
|
|||||
| Total loans |
$ | 10,014,338 | $ | 8,987,046 | ||||
| Less: |
||||||||
| Allowance for Loan Losses |
(116,636 | ) | (82,297 | ) | ||||
| Unamortized premiums, net of unearned discounts and deferred fees |
(34,722 | ) | (5,565 | ) | ||||
|
|
|
|
|
|||||
| Total Loans Receivable, net |
$ | 9,862,980 | $ | 8,899,184 | ||||
|
|
|
|
|
|||||
54
Table of Contents
We believe that our commercial loan portfolio composition is relatively diversified in terms of industry sectors, property types and various lending specialties, and is concentrated in the New England geographical area, with 88.6% of our loans in Massachusetts and New Hampshire as of June 30, 2020.
Our loans increased $1.0 billion, or 11.1%, to $10.0 billion at June 30, 2020 from $9.0 billion at December 31, 2019. The increase as of June 30, 2020 was primarily due to $1.1 billion in Payroll Protection Program (“PPP”) loan originations, partially offset by a decrease in other consumer loans of $67.7 million.
| • | The increase in our commercial and industrial loans from December 31, 2019 to June 30, 2020 was primarily a result of the $633.2 million PPP loan originations during the six months ended June 30, 2020. |
| • | The increase in our business banking loans from December 31, 2019 to June 30, 2020 was primarily a result of $467.0 million in PPP originations during the six months ended June 30, 2020. |
The following table shows certain data related to our PPP loans as of June 30, 2020:
| Loans |
Balance | Number of Loans |
Delinquency % | Allowance for loan losses % |
||||||||||||
| (Dollars in Thousands) | ||||||||||||||||
| Business Banking |
$ | 466,966 | 7,100 | 0.0 | % | 0.0 | % | |||||||||
| Commercial and Industrial |
633,215 | 1,003 | 0.0 | % | 0.0 | % | ||||||||||
|
|
|
|
|
|||||||||||||
| Total |
$ | 1,100,181 | 8,103 | 0.0 | % | 0.0 | % | |||||||||
|
|
|
|
|
|||||||||||||
| • | The decrease in other consumer loans from December 31, 2019 to June 30, 2020 was primarily a result of a $62.6 million decrease in our auto portfolio during the six months ended June 30, 2020 due to our exit from our indirect auto lending business, which commenced during the year ended December 31, 2018. |
Asset quality. We continually monitor the asset quality of our loan portfolio utilizing portfolio scorecards and various credit quality indicators. Based on this process, loans meeting certain criteria are categorized as delinquent, impaired, or nonperforming and further assessed to determine if nonaccrual status is appropriate.
Special mention, substandard and doubtful loans totaled 8.9% and 2.6% of total commercial loans outstanding at June 30, 2020 and December 31, 2019, respectively. This increase was driven by an increase in the special mention category, due to the downgrading of our hotel and restaurant loan portfolios as a result of the Covid-19 pandemic.
The delinquency rate of our total loan portfolio increased to 0.84% at June 30, 2020 from 0.49% at December 31, 2019, primarily due to an increase in delinquencies in our (i) residential real estate portfolio, (ii) other consumer portfolio, (iii) consumer home equity portfolio and (iv) business banking portfolio, partially offset by a decrease in our commercial and industrial portfolio.
The following table provides details regarding our delinquency rates as of the dates indicated:
Loan Delinquency Rates
| Delinquency rate as of (1) | ||||||||
| Portfolio |
December 31, 2019 | June 30, 2020 | ||||||
| Commercial and industrial |
0.14 | % | 0.13 | % | ||||
| Commercial real estate |
0.09 | % | 0.09 | % | ||||
| Commercial construction |
— | 0.10 | % | |||||
| Business banking |
1.28 | % | 1.76 | % | ||||
| Residential real estate |
1.37 | % | 2.71 | % | ||||
| Consumer home equity |
0.49 | % | 1.09 | % | ||||
| Other consumer |
1.13 | % | 2.30 | % | ||||
|
|
|
|
|
|||||
| Total |
0.49 | % | 0.84 | % | ||||
| (1) | In the calculation of the delinquency rates as of June 30, 2020, the total amount of loans outstanding includes $1.1 billion of PPP loans. |
55
Table of Contents
The following table provides details regarding the age analysis of past due loans as of the dates indicated:
Age Analysis of Past Due Loans
| As of June 30, | As of December 31, | |||||||||||||||||||||||
| 2020 | 2019 | |||||||||||||||||||||||
| 30-59 Days Past Due |
60-89 Days Past Due |
90 Days or More Past Due |
30-59 Days Past Due |
60-89 Days Past Due |
90 Days or More Past Due |
|||||||||||||||||||
| (In thousands) | ||||||||||||||||||||||||
| Commercial and industrial |
$ | 681 | $ | 671 | $ | 1,508 | $ | 1,407 | $ | — | $ | 963 | ||||||||||||
| Commercial real estate |
— | 257 | 3,045 | 1,290 | 100 | 1,856 | ||||||||||||||||||
| Commercial construction |
— | — | 280 | — | — | — | ||||||||||||||||||
| Business banking |
4,541 | 4,160 | 13,021 | 3,031 | 763 | 6,095 | ||||||||||||||||||
| Residential real estate |
26,859 | 2,084 | 8,981 | 14,030 | 2,563 | 3,030 | ||||||||||||||||||
| Consumer home equity |
3,413 | 1,971 | 4,511 | 2,497 | 430 | 1,636 | ||||||||||||||||||
| Other consumer |
2,992 | 1,734 | 2,971 | 3,451 | 514 | 579 | ||||||||||||||||||
|
|
|
|
|
|
|
|
|
|
|
|
|
|||||||||||||
| Total |
$ | 38,486 | $ | 10,877 | $ | 34,317 | $ | 25,706 | $ | 4,370 | $ | 14,159 | ||||||||||||
|
|
|
|
|
|
|
|
|
|
|
|
|
|||||||||||||
Nonperforming assets (“NPAs”) are comprised of nonperforming loans (“NPLs”), other real estate owned (“OREO”) and nonperforming securities. NPLs consist of nonaccrual loans and loans that are more than 90 days past due but still accruing interest. OREO consists of real estate properties, which primarily serve as collateral to secure our loans, that we control due to foreclosure. These properties are recorded at the lower of cost or fair value less estimated costs to sell on the date we obtain control.
The following table sets forth information regarding NPAs held as of the dates indicated:
Nonperforming Assets
| As of June 30, | As of December 31, |
|||||||
| 2020 | 2019 | |||||||
| (In thousands) | ||||||||
| Non-accrual loans: |
||||||||
| Commercial |
$ | 31,273 | $ | 34,093 | ||||
| Residential |
11,693 | 5,598 | ||||||
| Consumer |
9,374 | 2,760 | ||||||
|
|
|
|
|
|||||
| Total non-accrual loans |
52,340 | 42,451 | ||||||
|
|
|
|
|
|||||
| Accruing loans past due 90 days or more: |
||||||||
| Commercial |
2,802 | 1,315 | ||||||
| Residential |
244 | — | ||||||
| Consumer |
9 | 9 | ||||||
|
|
|
|
|
|||||
| Total accruing loans past due 90 days or more |
3,055 | 1,324 | ||||||
| Total non-performing loans |
55,395 | 43,775 | ||||||
| Total other real estate owned |
40 | — | ||||||
|
|
|
|
|
|||||
| Other non-performing assets |
— | — | ||||||
|
|
|
|
|
|||||
| Total non-performing assets |
$ | 55,435 | $ | 43,775 | ||||
|
|
|
|
|
|||||
| Total accruing troubled debt restructured loans |
$ | 40,691 | $ | 48,623 | ||||
NPLs increased $11.6 million, or 26.5%, to $55.4 million at June 30, 2020 from $43.8 million at December 31, 2019. NPLs as a percentage of total loans increased to 0.56% at June 30, 2020 from 0.49% at December 31, 2019 as a result of an increase in NPLs in our business banking and residential real estate portfolios, partially offset by a decrease in our commercial and industrial portfolio due to a single, larger loan payoff and a reduction in the outstanding balance of a single, larger Asset Based Lending (“ABL”) credit.
56
Table of Contents
Non-accrual loans increased $9.8 million, or 23.1%, to $52.3 million at June 30, 2020 from $42.5 million at December 31, 2019, primarily due to $7.7 million increase in our business banking portfolio and $6.1 million increase in our residential real estate portfolio, partially offset by the paydowns of certain NPLs as discussed above.
The total amount of interest recorded on NPLs was $0.3 million for the six months ended June 30, 2020. The gross interest income that would have been recorded under the original terms of those loans if they had been performing amounted to $2.0 million for the six months ended June 30, 2020.
Troubled debt restructuring (“TDR”) loans modified during the six months ended June 30, 2020 were $6.7 million (post modification balance). There was one loan with a balance of $1.3 million modified during the preceding 12 months, which subsequently defaulted during the six months ended June 30, 2020. The increase in TDR loans was driven by $5.8 million in commercial loans and $0.9 million in consumer loans.
As of June 30, 2020 and December 31, 2019, the carrying amount of purchase credit impaired (“PCI”) loans was $12.4 million, $13.5 million, respectively.
The following table provides additional details related to our loan portfolio and the distribution of NPLs as of the dates indicated:
Distribution of Nonperforming Loans
| As of June 30, 2020 | ||||||||||||||||||||||||
| Outstanding | 90+ Days Due Still Accruing |
Non-accruing Loans |
Troubled Debt Restructured Loans, but Accruing |
NPLs | NPLs as a % of Outstanding |
|||||||||||||||||||
| (Dollars in thousands) | ||||||||||||||||||||||||
| Loans: |
||||||||||||||||||||||||
| Commercial |
$ | 7,373,265 | $ | 2,802 | $ | 31,273 | $ | 13,093 | $ | 34,075 | 0.46 | % | ||||||||||||
| Residential |
1,400,855 | 244 | 11,693 | 23,714 | 11,937 | 0.85 | % | |||||||||||||||||
| Consumer |
1,240,218 | 9 | 9,374 | 3,884 | 9,383 | 0.76 | % | |||||||||||||||||
|
|
|
|
|
|
|
|
|
|
|
|
|
|||||||||||||
| Total |
$ | 10,014,338 | $ | 3,055 | $ | 52,340 | $ | 40,691 | $ | 55,395 | 0.55 | % | ||||||||||||
|
|
|
|
|
|
|
|
|
|
|
|
|
|||||||||||||
| As of December 31, 2019 | ||||||||||||||||||||||||
| Outstanding | 90+ Days Due still Accruing |
Non-accruing Loans |
Troubled Debt Restructured Loans, but accruing |
NPLs | NPLs as a % of Outstanding |
|||||||||||||||||||
| (Dollars in thousands) | ||||||||||||||||||||||||
| Loans: |
||||||||||||||||||||||||
| Commercial |
$ | 6,222,897 | $ | 1,315 | $ | 34,093 | $ | 17,575 | $ | 35,408 | 0.57 | % | ||||||||||||
| Residential |
1,428,630 | — | 5,598 | 25,093 | 5,598 | 0.39 | % | |||||||||||||||||
| Consumer |
1,335,519 | 9 | 2,760 | 5,955 | 2,769 | 0.21 | % | |||||||||||||||||
|
|
|
|
|
|
|
|
|
|
|
|
|
|||||||||||||
| Total |
$ | 8,987,046 | $ | 1,324 | $ | 42,451 | $ | 48,623 | $ | 43,775 | 0.49 | % | ||||||||||||
|
|
|
|
|
|
|
|
|
|
|
|
|
|||||||||||||
In the normal course of business, we become aware of possible credit problems in which borrowers exhibit potential for the inability to comply with the contractual terms of their loans, but which currently do not yet meet the criteria for classification as NPLs. In response to the Covid-19 pandemic, we reviewed, and continue to review, all of our credit exposures in industries that were expected to experience significant problems due to the pandemic and resulting economic conditions. As part of that review, we downgraded our hotel loans, restaurant loans and other loans that we expected to have associated challenges in the current economic environment. These loans were neither delinquent nor on non-accrual status. At June 30, 2020 and December 31, 2019, our potential problem loans (including those resulting from the Covid-19 pandemic), or loans with potential weaknesses that were not included in the non-accrual loans or in the loans 90 days or more past due categories, totaled $660.6 million and $157.3 million, respectively.
57
Table of Contents
Allowance for loan losses. For the purpose of estimating the allowance for loan losses, we segregate the loan portfolio into the homogenous loan pools that possess unique risk characteristics such as loan purpose, repayment source, and collateral that are considered when determining the appropriate level of the allowance for loan losses for each category.
The allowance for loan losses increased by $34.3 million, or 41.7%, to $116.6 million, or 1.17% of total loans, at June 30, 2020 from $82.3 million, or 0.92% of total loans at December 31, 2019. The increase in the allowance for loan losses was primarily a result of our response to the Covid-19 pandemic and the related economic impact. During the six months ended June 30, 2020, we downgraded our risk ratings for most of our loans secured by hotels and restaurants, and any of our other commercial loans for which our customers are expecting to face financial difficulties due to the current economic environment, and the lower risk ratings resulted in higher levels of reserves for the allowance. In total, we downgraded the risk rating on $1.7 billion of commercial loans, of which $511.9 million were transferred into the special mention, or worse, risk rating category. This, along with other factors, resulted in a provision for loan loss of $37.2 million for the six months ended June 30, 2020.
The following table summarizes changes in the allowance for loan losses and other selected statistics for the periods presented:
Summary of Changes in the Allowance for Loan Losses
| As of June 30, | ||||||||
| 2020 | 2019 | |||||||
| (In thousands) | ||||||||
| Average total loans |
$ | 9,445,666 | $ | 8,916,224 | ||||
|
|
|
|
|
|||||
| Allowance for loan losses, beginning of period |
$ | 82,297 | $ | 80,655 | ||||
| Charged-off loans: |
||||||||
| Commercial and industrial |
27 | 272 | ||||||
| Commercial real estate |
24 | 169 | ||||||
| Commercial construction |
— | — | ||||||
| Business banking |
2,535 | 2,810 | ||||||
| Residential real estate |
— | 63 | ||||||
| Consumer home equity |
473 | 124 | ||||||
| Other consumer |
548 | 1,049 | ||||||
|
|
|
|
|
|||||
| Total charged-off loans |
3,607 | 4,487 | ||||||
|
|
|
|
|
|||||
| Recoveries on loans previously charged-off |
||||||||
| Commercial and industrial |
380 | 1,368 | ||||||
| Commercial real estate |
6 | 4 | ||||||
| Commercial construction |
— | — | ||||||
| Business banking |
154 | 320 | ||||||
| Residential real estate |
73 | 71 | ||||||
| Consumer home equity |
22 | 28 | ||||||
| Other consumer |
111 | 203 | ||||||
|
|
|
|
|
|||||
| Total recoveries |
746 | 1,994 | ||||||
|
|
|
|
|
|||||
| Net loans charged-off (recoveries) |
||||||||
| Commercial and industrial |
(353 | ) | (1,096 | ) | ||||
| Commercial real estate |
18 | 165 | ||||||
| Commercial construction |
— | — | ||||||
| Business banking |
2,381 | 2,490 | ||||||
| Residential real estate |
(73 | ) | (8 | ) | ||||
| Consumer home equity |
451 | 96 | ||||||
| Other consumer |
437 | 845 | ||||||
|
|
|
|
|
|||||
| Total net loans charged-off |
2,861 | 2,493 | ||||||
|
|
|
|
|
|||||
| Provision for loan losses |
37,200 | 4,500 | ||||||
|
|
|
|
|
|||||
| Total allowance for loan losses, end of period |
$ | 116,636 | $ | 82,662 | ||||
|
|
|
|
|
|||||
58
Table of Contents
The following table sets forth the allocation of the allowance for loan losses by loan categories listed in Loan portfolio composition as of the dates indicated:
Summary of Allocation of Allowance for Loan Losses
| As of June 30, | As of December 31, | |||||||||||||||||||||||
| 2020 | 2019 | |||||||||||||||||||||||
| Allowance for Loan Losses |
Percent of Allowance in Category to Total Allocated Allowance |
Percent of Loans in Category to Total Loans |
Allowance for Loan Losses |
Percent of Allowance in Category to Total Allocated Allowance |
Percent of Loans in Category to Total Loans |
|||||||||||||||||||
| (Dollars in thousands) | ||||||||||||||||||||||||
| Commercial and industrial(1) |
$ | 33,229 | 28.49 | % | 22.68 | % | $ | 20,919 | 25.42 | % | 18.27 | % | ||||||||||||
| Commercial real estate |
54,228 | 46.49 | % | 35.79 | % | 34,730 | 42.20 | % | 39.34 | % | ||||||||||||||
| Commercial construction |
4,816 | 4.13 | % | 2.82 | % | 3,424 | 4.16 | % | 3.05 | % | ||||||||||||||
| Business banking(1) |
9,805 | 8.41 | % | 12.33 | % | 8,260 | 10.04 | % | 8.58 | % | ||||||||||||||
| Residential real estate |
6,569 | 5.63 | % | 13.99 | % | 6,380 | 7.75 | % | 15.90 | % | ||||||||||||||
| Consumer home equity |
3,875 | 3.32 | % | 9.04 | % | 4,027 | 4.89 | % | 10.38 | % | ||||||||||||||
| Other consumer |
3,762 | 3.23 | % | 3.34 | % | 4,173 | 5.07 | % | 4.48 | % | ||||||||||||||
| Other |
352 | 0.30 | % | — | % | 384 | 0.47 | % | — | % | ||||||||||||||
|
|
|
|
|
|
|
|
|
|
|
|
|
|||||||||||||
| Total |
$ | 116,636 | 100.00 | % | 100.00 | % | $ | 82,297 | 100.00 | % | 100.00 | % | ||||||||||||
|
|
|
|
|
|
|
|
|
|
|
|
|
|||||||||||||
| (1) | PPP loans are included within this portfolio; however, no allowance for loan losses have been recorded on these loans due to the SBA guarantee of 100% of the loans. |
Federal Home Loan Bank stock
We held an investment in the FHLBB of $8.8 million and $9.0 million at June 30, 2020 and December 31, 2019, respectively.
Goodwill and other intangible assets
Goodwill and other intangible assets were $376.3 million and $377.7 million at June 30, 2020 and December 31, 2019, respectively. The decrease in goodwill and other intangibles assets was due to the amortization of definite-lived intangibles during the six months ended June 30, 2020. We did not record any impairment to our goodwill or other intangible assets at June 30, 2020. We will continue to assess our goodwill and other intangible assets to determine if impairments are necessary during the remainder of the year ending December 31, 2020 and beyond as it relates to the Covid-19 pandemic.
Deposits and other interest-bearing liabilities
The following table presents our deposits as of the dates presented:
Components of Deposits
| As of June 30, | As of December 31, |
|||||||||||
| 2020 | 2019 | |||||||||||
| Amount | % Change | Amount | ||||||||||
| (Dollars in thousands) | ||||||||||||
| Demand |
$ | 4,740,125 | 34.8 | % | $ | 3,517,447 | ||||||
| Interest checking |
2,385,912 | 31.5 | % | 1,814,327 | ||||||||
| Savings |
1,157,606 | 19.2 | % | 971,119 | ||||||||
| Money market investments |
3,254,202 | 11.5 | % | 2,919,360 | ||||||||
| Certificate of deposits |
308,920 | (6.1 | )% | 329,139 | ||||||||
|
|
|
|
|
|||||||||
| Total deposits |
$ | 11,846,765 | 24.0 | % | $ | 9,551,392 | ||||||
|
|
|
|
|
|||||||||
59
Table of Contents
Deposits increased by $2.3 billion, or 24.0%, to $11.9 billion at June 30, 2020 from $9.6 billion at December 31, 2019. This increase was primarily the result of an increase in interest checking deposits of $571.6 million and an increase of $1.2 billion in demand deposits. During the six months ended June 30, 2020, we experienced strong deposit flows from our customers. In addition, during the six months ended June 30, 2020, we transferred a product for our Financial Institutions customers from borrowings to deposits totaling $299.5 million.
The following table presents the classification of deposits on an average basis. We believe the presentation of average deposits provides a better understanding of the business mix and low cost structure of our deposit portfolio than the composition of deposits as of the respective year ends below, due to the overnight program of the Federal Reserve Bank of Boston described above.
Classification of Deposits on an Average Basis
| As of June 30, | As of December 31, | |||||||||||||||
| 2020 | 2019 | |||||||||||||||
| Average Amount |
Average Rate |
Average Amount |
Average Rate |
|||||||||||||
| (Dollars in thousands) | ||||||||||||||||
| Demand |
$ | 3,963,066 | 0.00 | % | $ | 3,369,375 | 0.00 | % | ||||||||
| Interest checking |
2,158,242 | 0.14 | % | 1,842,993 | 0.21 | % | ||||||||||
| Savings |
1,036,344 | 0.02 | % | 991,244 | 0.02 | % | ||||||||||
| Money market investments |
3,087,048 | 0.38 | % | 2,769,934 | 0.69 | % | ||||||||||
| Certificate of deposits |
320,277 | 0.69 | % | 392,035 | 1.02 | % | ||||||||||
|
|
|
|
|
|||||||||||||
| Total deposits |
$ | 10,564,977 | 0.16 | % | $ | 9,365,581 | 0.29 | % | ||||||||
|
|
|
|
|
|||||||||||||
Borrowings
Our total borrowings decreased by $206.2 million, or 87.6%, to $29.2 million at June 30, 2020 from $235.4 million at December 31, 2019. The decrease was primarily due to a reduction of federal funds purchased of $201.1 million. The reduction in our federal funds purchased was a result of the transfer of a product for our Financial Institution customers from borrowings to deposits.
Results of Operations
Comparison of the six months ended June 30, 2020 and 2019
Interest and Dividend Income
Interest and dividend income decreased by $16.2 million, or 7.2%, to $208.1 million during the six months ended June 30, 2020 from $224.3 million during the six months ended June 30, 2019. This decrease was a result of lower interest income on our loans as the yield on average interest-earning assets decreased 73 basis points during the six months ended June 30, 2020, partially offset by our recording of deferred fees related to our PPP loans. Our average interest-earning assets increased by $1.2 billion, or 11.1%, to $11.6 billion as of June 30, 2020 compared to $10.5 billion as of June 30, 2019. Our yields on loans and securities are generally presented on an FTE basis where the embedded tax benefit on loans or securities are calculated and added to the yield. This presentation allows for better comparability between institutions with different tax structures.
| • | Interest income on loans decreased by $15.1 million, or 7.4%, to $187.7 million during the six months ended June 30, 2020 from $202.8 million during the six months ended June 30, 2019. The decrease in interest income on our loans was primarily due to the decrease in the yield on average loans. The decrease in the average yield on our loans was primarily due to the downward adjustment of the interest rates on our existing adjustable-rate loans as a result of the lowering interest rate environment, whereas the average balance of loans increased due to continued efforts to expand our loan portfolio. The FTE yield on average loans decreased 58 basis points to 4.03% during the six months ended June 30, 2020. The average balance of our loans increased by $529.4 million, or 5.9%, to $9.4 billion as of June 30, 2020 compared to $8.9 billion as of June 30, 2019. |
| • | Interest income on securities decreased $1.1 million, or 5.1%, to $20.4 million for the six months ended June 30, 2020 compared to $21.5 million for the six months ended June 30, 2019. The decrease in interest income on |
60
Table of Contents
| securities was due to lower overall market rates. The FTE yield on average securities decreased 100 basis points to 2.0% during the six months ended June 30, 2019. The average balance of securities and other interest earning assets increased by $628.2 million, or 40.7%, to $2.2 billion as of June 30, 2020 compared to $1.5 billion as of June 30, 2019. |
| • | We received approximately $35.8 million of PPP loan origination fees from the SBA. We also deferred certain origination costs, totaling $3.5 million, related to our PPP loans. The loan fees and the deferred costs will be amortized through interest income over the life of the PPP loans, which is expected to be 24 months, but the amortization period will be adjusted as PPP loans are forgiven or repaid. During the six months ended June 30, 2020, we recorded $4.1 million in PPP loan fees, net in interest income. |
Interest Expense
Interest expense decreased $8.9 million, or 49.2%, to $9.2 million during the six months ended June 30, 2020 from $18.1 million during the six months ended June 30, 2019. The decrease in our interest expense was a result of decreased rates paid on deposits. The overall rates paid on average interest-bearing liabilities decreased 31 basis points to 0.27% during the six months ended June 30, 2020. Average interest-bearing liabilities increased $404.3 million, or 6.4%, to $6.7 billion as of six months ended June 30, 2020 compared to $6.3 billion as of six months ended June 30, 2019.
| • | Interest expense on our interest-bearing deposits decreased by $5.3 million, or 38.4%, to $8.5 million during the six months ended June 30, 2020 from $13.8 million during the six months ended June 30, 2019. The decrease in our interest expense on interest-bearing deposits was due to a decrease in the cost of deposits. The average balance of deposits increased due to our increasing core deposits to help fund loan growth, whereas the average cost of deposits decreased due to the interest rate decreases occurring in the six months ended June 30, 2020. The average cost of our interest-bearing deposits decreased 21 basis points to 0.26% during the six months ended June 30, 2020. The average balance of our interest-bearing deposits increased by $637.5 million, or 10.6%, to $6.6 billion as of June 30, 2020 compared to $6.0 billion as of June 30, 2019. |
| • | Interest expense on borrowed funds decreased by $3.6 million, or 83.7%, to $0.7 million during the six months ended June 30, 2020 from $4.3 million during the six months ended June 30, 2019. The decrease in interest expense on borrowed funds was primarily due to the average balance of the Federal Home Loan Bank advances decreasing by $143.8 million to $16.2 million during the six months ended June 30, 2020 compared to $160.0 million during the six months ended June 30, 2019. The average balance of borrowed funds decreased by $233.3 million, or 66.2%, to $119.2 million as of June 30, 2020 compared to $352.5 million as of June 30, 2019. |
Net Interest Income
Net interest income decreased by $7.3 million, or 3.5%, to $198.9 million during the six months ended June 30, 2020 from $206.2 million during the six months ended June 30, 2019. The decrease in net interest income was primarily a result of the decrease in interest and dividend income partially offset by the decrease in interest expense, both due to the decrease in interest rates during the six months ended June 30, 2020.
Net interest margin is determined by dividing FTE net interest income by average-earning assets. For purposes of the following discussion, income from tax-exempt loans and investment securities has been adjusted to an FTE basis, using a marginal tax rate of 21.7% for the six months ended June 30, 2020 and 21.8% for the six months ended June 30, 2019. Net interest margin decreased 54 basis points to 3.49% during the six months ended June 30, 2020.
61
Table of Contents
The following tables set forth average balance sheet items, annualized average yields and costs, and certain other information for the periods indicated. Interest income on tax-exempt loans and investment securities has been adjusted to an FTE basis using a marginal tax rate of 21.7% and 21.8% for the six months ended June 30, 2020 and 2019, respectively. All average balances are daily average balances. Non-accrual loans were included in the computation of average balances but have been reflected in the table as loans carrying a zero yield. The yields set forth below include the effect of deferred fees, discounts and premiums that are amortized or accreted to interest income or expense.
Average Balances, Interest Earned/Paid & Average Yields
| Six Months Ended June 30, | ||||||||||||||||||||||||
| 2020 | 2019 | |||||||||||||||||||||||
| Average Outstanding Balance |
Interest | Average Yield/ Cost (5) |
Average Outstanding Balance |
Interest | Average Yield/ Cost (5) |
|||||||||||||||||||
| (Dollars in thousands) | ||||||||||||||||||||||||
| Interest-earning assets: |
||||||||||||||||||||||||
| Loans (1) |
||||||||||||||||||||||||
| Residential |
$ | 1,423,161 | $ | 25,858 | 3.65 | % | $ | 1,435,561 | $ | 26,861 | 3.77 | % | ||||||||||||
| Commercial |
6,735,075 | 139,394 | 4.16 | % | 6,024,268 | 146,483 | 4.90 | % | ||||||||||||||||
| Consumer |
1,287,430 | 24,017 | 3.75 | % | 1,456,395 | 30,706 | 4.25 | % | ||||||||||||||||
|
|
|
|
|
|
|
|
|
|
|
|
|
|||||||||||||
| Total loans |
9,445,666 | 189,269 | 4.03 | % | 8,916,224 | 204,050 | 4.61 | % | ||||||||||||||||
| Investment securities |
1,478,156 | 20,768 | 2.83 | % | 1,460,262 | 21,956 | 3.03 | % | ||||||||||||||||
| Federal funds sold and other short-term investments |
694,386 | 801 | 0.23 | % | 84,044 | 965 | 2.32 | % | ||||||||||||||||
|
|
|
|
|
|
|
|
|
|
|
|
|
|||||||||||||
| Total interest-earning assets |
11,618,208 | 210,838 | 3.65 | % | 10,460,530 | 226,971 | 4.38 | % | ||||||||||||||||
|
|
|
|
|
|||||||||||||||||||||
| Non-interest-earning assets |
1,064,218 | 859,928 | ||||||||||||||||||||||
|
|
|
|
|
|||||||||||||||||||||
| Total assets |
$ | 12,682,426 | $ | 11,320,458 | ||||||||||||||||||||
|
|
|
|
|
|||||||||||||||||||||
| Interest-bearing liabilities: |
||||||||||||||||||||||||
| Deposits: |
||||||||||||||||||||||||
| Savings account |
$ | 1,036,344 | $ | 118 | 0.02 | % | $ | 1,008,737 | $ | 105 | 0.02 | % | ||||||||||||
| Interest checking account |
2,158,242 | 1,467 | 0.14 | % | 1,877,777 | 1,973 | 0.21 | % | ||||||||||||||||
| Money market investment |
3,087,048 | 5,832 | 0.38 | % | 2,634,820 | 9,287 | 0.71 | % | ||||||||||||||||
| Time account |
320,277 | 1,100 | 0.69 | % | 443,070 | 2,467 | 1.12 | % | ||||||||||||||||
|
|
|
|
|
|
|
|
|
|
|
|
|
|||||||||||||
| Total interest-bearing deposits |
6,601,911 | 8,517 | 0.26 | % | 5,964,404 | 13,832 | 0.47 | % | ||||||||||||||||
| Borrowings |
119,211 | 673 | 1.14 | % | 352,453 | 4,293 | 2.46 | % | ||||||||||||||||
|
|
|
|
|
|
|
|
|
|
|
|
|
|||||||||||||
| Total interest-bearing liabilities |
6,721,122 | 9,190 | 0.27 | % | 6,316,857 | 18,125 | 0.58 | % | ||||||||||||||||
|
|
|
|
|
|
|
|
|
|||||||||||||||||
| Demand accounts |
3,963,066 | 3,320,873 | ||||||||||||||||||||||
| Other noninterest-bearing liabilities |
337,679 | 192,521 | ||||||||||||||||||||||
|
|
|
|
|
|||||||||||||||||||||
| Total liabilities |
11,021,867 | 9,830,251 | ||||||||||||||||||||||
|
|
|
|
|
|||||||||||||||||||||
| Total net worth |
1,660,559 | 1,490,207 | ||||||||||||||||||||||
|
|
|
|
|
|||||||||||||||||||||
| Total liabilities and retained earnings |
12,682,426 | 11,320,458 | ||||||||||||||||||||||
|
|
|
|
|
|||||||||||||||||||||
| Net interest income - FTE |
$ | 201,648 | $ | 208,846 | ||||||||||||||||||||
|
|
|
|
|
|||||||||||||||||||||
| Net interest rate spread (2) |
3.38 | % | 3.80 | % | ||||||||||||||||||||
|
|
|
|
|
|||||||||||||||||||||
| Net interest-earning assets (3) |
$ | 4,897,086 | $ | 4,143,673 | ||||||||||||||||||||
|
|
|
|
|
|||||||||||||||||||||
| Net interest margin (4) |
3.49 | % | 4.03 | % | ||||||||||||||||||||
|
|
|
|
|
|||||||||||||||||||||
| Average interest-earning assets to interest-bearing liabilities |
172.86 | % | 165.6 | % | ||||||||||||||||||||
| (1) | Non-accrual loans are included in loans. |
| (2) | Net interest rate spread represents the difference between the weighted average yield on interest-earning assets and the weighted average cost of interest-bearing liabilities. |
62
Table of Contents
| (3) | Net interest-earning assets represent total interest-earning assets less total interest-bearing liabilities. |
| (4) | Net interest margin represents net interest income divided by average total interest-earning assets. |
| (5) | Rates have been annualized. |
Provision for Loan Losses
The provision for loan losses represents the charge to expense that is required to maintain an appropriate level of allowance for loan losses. The provision for loan losses increased by $32.7 million, or 726.7%, to $37.2 million for the six months ended June 30, 2020, compared to $4.5 million for the six months ended June 30, 2019. The increase in the provision was primarily due to the change in loan risk ratings to reflect the impact of the increased concerns about customers that are expecting to face financial difficulties due to the current economic environment resulting from the Covid-19 pandemic, primarily related to the downgrading of our hotel and restaurant loan portfolios. The increase in the provision also reflects the increased concern about the performance of the loan portfolio given the increase in the non-performing loans and delinquent loans during the quarter ended June 30, 2020.
Our periodic evaluation of the appropriate allowance for loan losses considers the risk characteristics of the loan portfolio, current economic conditions, and trends in loan delinquencies and charge-offs.
Noninterest Income
Noninterest income decreased by $12.4 million, or 13.3%, to $81.0 million for the six months ended June 30, 2020 from $93.4 million for the six months ended June 30, 2019. The decrease in noninterest income was primarily due to a $5.0 million decrease in income from investments held in rabbi trusts, a $4.8 million decrease in interest rate swap income, and a $2.7 million decrease in deposit service charges, net, partially offset by a $1.3 million increase in insurance commissions.
| • | Insurance commissions increased primarily as a result of an increase in our profit-sharing revenues and commissions. |
| • | Income (loss) from investments held in rabbi trust decreased primarily as a result of a less favorable mark-to-market adjustment during the six months ended June 30, 2020, compared to the six months ended June 30, 2019. |
| • | Swap income decreased primarily as a result of an unfavorable mark-to-market adjustment due to the current interest rate and economic environment. |
Noninterest Expense
Noninterest expense decreased by $10.5 million, or 5.1%, to $195.9 million during the six months ended June 30, 2020 from $206.4 million during the six months ended June 30, 2019. The decrease in noninterest expense in the six months ended June 30, 2020 was mainly due to a $4.7 million decrease in salaries and employee benefits, a $3.3 million decrease in charitable contributions and a $2.2 million decrease in net periodic benefit cost, excluding service cost, partially offset by a $1.0 million increase in professional services expense and $1.6 million increase in loan expenses.
| • | Salaries and employee benefits decreased primarily as a result of a favorable defined contribution supplemental executive retirement plan expense as a result of the less favorable mark-to-market adjustment on securities held in rabbi trust accounts, lower incentive expenses and deferrals of nonrefundable fees and costs associated with originating or acquiring loans (primarily due to the PPP loans), partially offset by higher commissions. |
| • | Other noninterest expense decreased primarily as a result of lower contributions to the Eastern Bank Charitable Foundation, as a result of lower taxable income for the six months ended June 30, 2020, compared to the six months ended June 30, 2019. |
| • | Net period benefit cost, excluding service cost, decreased primarily as a result of a reduction in the expected return on plan assets. |
| • | Professional services increased primarily as a result of higher legal costs related to (i) corporate-related matters, (ii) loan-related matters and (iii) our commercial banking strategy and development services. |
| • | Loan expenses increased primarily as a result of increased mortgage loan originations. |
63
Table of Contents
| • | As a result of this offering, our compensation, regulatory/compliance and other costs will increase. We expect to add personnel over the next two years and beyond in various areas including operations, finance, compliance, and commercial and residential lending. These additional positions will increase our noninterest expense in the year ending December 31, 2021. We also expect to issue awards under stock-based incentive plans, and therefore incur stock-based compensation costs, during the year ending December 31, 2021, which will increase our noninterest expense. As a result, we anticipate an increase in our noninterest expense of approximately $10.0 million to $12.0 million during the year ending December 31, 2021, which could increase even more significantly in the year ending December 31, 2022 and beyond. |
| • | As a result of this offering, we also expect to reduce the level of charitable donations, including those we make to the Eastern Bank Charitable Foundation, such that charitable donations represent a significantly smaller percentage of our earnings. |
| • | Due to the Covid-19 pandemic, we migrated much of our staff to working remotely beginning in March 2020. Except for branch personnel in our banking offices and insurance agency offices, the majority of our staff is working remotely. Through the date of this prospectus, our workforce has been productive working remotely, and we expect to see longer-term cost savings in real estate and related expenses as we accelerate the transformation of our business to a lower cost digital model. We expect our administrative staff will not begin to return to our offices to a significant extent until the fall of the year ending December 31, 2020 or early during the year ending December 31, 2021, and we do not expect the density of employees in our offices to approach 2019 levels until we have reason to believe that a vaccine, therapeutic or other factors have lessened the workplace health safety concerns. We also expect to enhance our work from home policies to encourage fewer employees in our administrative offices to work physically in an office on a full-time basis. |
Income Taxes
Income tax expense decreased by $12.2 million, or 58.9%, to $8.5 million in the six months ended June 30, 2020 from $20.7 million in the six months ended June 30, 2019. The decrease in income tax expense was due primarily to lower pre-tax income during the six months ended June 30, 2020 compared to the six months ended June 30, 2019, while investment tax credits and other favorable permanent differences have remained relatively constant.
Liquidity and Capital Resources
Liquidity. Liquidity describes our ability to meet the financial obligations that arise in the normal course of business. Liquidity is primarily needed to meet deposit withdrawals and anticipated loan fundings, as well as current and planned expenditures. We seek to maintain sources of liquidity that are deep and diversified and that may be used during the normal course of business as well as on a contingency basis.
Our primary sources of funds are deposits, principal and interest payments on loans and securities, and proceeds from calls, maturities and sales of securities. While maturities and scheduled amortization of loans and securities are predictable sources of funds, deposit flows and loan prepayments are greatly influenced by general interest rates, economic conditions, and competition. Our most liquid assets are cash and due from banks and securities classified as available-for-sale.
We participate in the Promontory Interfinancial Network, allowing us to provide access to multi-million dollar FDIC deposit insurance protection on deposits for consumers, businesses and public entities. We can elect to sell or repurchase this funding as reciprocal deposits from other Promontory network banks depending on our funding needs. At June 30, 2020, we had a total of $409.0 million of Promontory deposits which were sold to other Promontory network banks. These deposits could have been repurchased as reciprocal deposits and should be considered a source of liquidity.
Although customer deposits remain our preferred source of funds, maintaining back up sources of liquidity is part of our prudent liquidity risk management practices. We have the ability to borrow from the Federal Home Loan Bank of Boston. At June 30, 2020, we had $14.9 million in outstanding advances and the ability to borrow up to an additional $1.4 billion. We also have the ability to borrow from the Federal Reserve Bank of Boston through the Discount Window as well as the Paycheck Protection Program Liquidity Facility. At June 30, 2020, we had a $485.0 million collateralized line of credit from the Federal Reserve Bank of Boston Discount Window with no outstanding balance. Additionally, we had $1.1 billion in Paycheck Protection Program Loans that could have been pledged to the Paycheck Protection Program Liquidity Facility. We had a total of $620.0 million of discretionary lines of credit at June 30, 2020.
64
Table of Contents
Sources of Liquidity
| As of June 30, | ||||||||
| 2020 | ||||||||
| Outstanding | Additional Capacity |
|||||||
| Promontory Deposits |
$ | — | $ | 408,527 | ||||
| Federal Home Loan Bank |
14,922 | 1,424,505 | (1) | |||||
| Federal Reserve Bank of Boston |
— | 485,424 | (2) | |||||
| Federal Reserve Paycheck Protection Program Liquidity Facility |
— | 1,100,181 | ||||||
| Unsecured lines of credit |
— | 620,000 | ||||||
|
|
|
|
|
|||||
| $ | 14,922 | $ | 4,038,637 | |||||
|
|
|
|
|
|||||
| (1) | As of June 30, 2020, loans have been pledged to the Federal Home Loan Bank of Boston with a carrying value of $2.1 billion to secure additional borrowing capacity. |
| (2) | Loans with a carrying value of $0.9 billion at June 30, 2020 have been pledged to the Federal Reserve Bank of Boston resulting in this additional unused borrowing capacity. |
We believe that advanced preparation, early detection, and prompt responses can avoid, minimize, or shorten potential liquidity crises. Our Board of Directors and our Asset Liability Committee have put a Liquidity Contingency Plan in place to establish methods for assessing and monitoring risk levels, as well as potential responses during unanticipated stress events. As part of its risk management framework, we perform periodic liquidity stress testing to assess its need for liquid assets as well as backup sources of liquidity.
Capital Resources. We are subject to various regulatory capital requirements administered by the Massachusetts Commissioner of Banks, the FDIC and the Federal Reserve (with respect to our consolidated capital requirements). At June 30, 2020 and December 31, 2019, we exceeded all applicable regulatory capital requirements, and were considered “well capitalized” under regulatory guidelines.
The net offering proceeds will significantly increase our liquidity and capital resources. Over time, the initial level of liquidity will be reduced as net offering proceeds are used for general corporate purposes, including funding loans. Our financial condition and results of operations will be enhanced by the net offering proceeds, resulting in increased net interest-earning assets and net interest income. However, due to the increase in equity resulting from the net offering proceeds, as well as other factors associated with the offering, our return on equity will be lower immediately following the offering. See the section of this prospectus titled “Risk Factors—Risks Related to the Offering—Our return on equity may be low following the offering. This could negatively affect the trading price of our shares of common stock.”
65
Table of Contents
This prospectus contains forward-looking statements, which can be identified by the use of words such as “estimate,” “project,” “believe,” “intend,” “anticipate,” “plan,” “seek,” “expect” and words of similar meaning. These forward-looking statements include, but are not limited to: statements of our goals, intentions and expectations; statements regarding our business plans, prospects, growth and operating strategies; statements regarding the quality of our loan and investment portfolios; and estimates of our risks and future costs and benefits.
These forward-looking statements are based on current beliefs and expectations of our management and are inherently subject to significant business, economic and competitive uncertainties and contingencies, many of which are beyond our control. In addition, these forward-looking statements are subject to assumptions with respect to future business strategies and decisions that are subject to change.
The following factors, among others, could cause actual results to differ materially from the anticipated results or other expectations expressed in the forward-looking statements:
| • | conditions relating to the Covid-19 pandemic, including the severity and duration of the associated economic slowdown either nationally or in our market areas, that are worse than expected; |
| • | general economic conditions, either nationally or in our market areas, that are worse than expected; |
| • | changes in the level and direction of loan delinquencies and charge-offs and changes in estimates of the adequacy of the allowance for loan losses; |
| • | our ability to access cost-effective funding; |
| • | fluctuations in real estate values and both residential and commercial real estate market conditions; |
| • | demand for loans and deposits in our market area; |
| • | our ability to continue to implement our business strategies; |
| • | competition among depository and other financial institutions; |
| • | inflation and changes in the interest rate environment that reduce our margins and yields, reduce the fair value of financial instruments or reduce the origination levels in our lending business, or increase the level of defaults, losses and prepayments on loans we have made and make whether held in portfolio or sold in the secondary markets; |
| • | adverse changes in the securities markets; |
| • | changes in laws or government regulations or policies affecting financial institutions, including changes in regulatory fees and capital requirements; |
| • | our ability to manage market risk, credit risk and operational risk in the current economic conditions; |
| • | our ability to enter new markets successfully and capitalize on growth opportunities; |
| • | our ability to successfully integrate any assets, liabilities, customers, systems and management personnel we may acquire into our operations and our ability to realize related revenue synergies and cost savings within expected time frames and any goodwill charges related thereto; |
| • | changes in consumer spending, borrowing and savings habits; |
| • | changes in accounting policies and practices, as may be adopted by the bank regulatory agencies, the Financial Accounting Standards Board, the Securities and Exchange Commission or the Public Company Accounting Oversight Board; |
| • | our ability to retain key employees; |
| • | our compensation expense associated with equity allocated or awarded to our employees; and |
| • | changes in the financial condition, results of operations or future prospects of issuers of securities that we own. |
Because of these and other uncertainties, our actual future results may be materially different from the results indicated by these forward-looking statements. Please see the section of this prospectus titled “Risk Factors” beginning on page 19.
66
Table of Contents
HOW WE INTEND TO USE THE PROCEEDS FROM THE OFFERING
Although we cannot determine what the actual net proceeds from the sale of the shares of common stock in the offering will be until the offering is completed, we anticipate that the net proceeds will be between $1.3 billion and $1.8 billion, or $2.0 billion if the offering range is increased by 15%.
We intend to distribute the net proceeds as follows:
| Based Upon the Sale at $10.00 Per Share of | ||||||||||||||||||||||||||||||||
| 129,625,000 Shares at Minimum of Offering Range |
152,500,000 Shares at Midpoint of Offering Range |
175,375,000 Shares at Maximum of Offering Range |
201,681,250 Shares at Adjusted Maximum of Offering Range |
|||||||||||||||||||||||||||||
| (Dollars in thousands) |
Amount | Percent of Net Proceeds |
Amount | Percent of Net Proceeds |
Amount | Percent of Net Proceeds |
Amount | Percent of Net Proceeds |
||||||||||||||||||||||||
| Offering proceeds |
$ | 1,296,250 | $ | 1,525,000 | $ | 1,753,750 | $ | 2,016,813 | ||||||||||||||||||||||||
| Less: offering expenses |
(33,942 | ) | (37,926 | ) | (41,910 | ) | (46,492 | ) | ||||||||||||||||||||||||
|
|
|
|
|
|
|
|
|
|
|
|
|
|
|
|
|
|||||||||||||||||
| Net offering proceeds |
1,262,308 | 100.0 | % | 1,487,074 | 100.0 | % | 1,711,840 | 100.0 | % | 1,970,321 | 100.0 | % | ||||||||||||||||||||
| Less: |
||||||||||||||||||||||||||||||||
| Proceeds contributed to Eastern Bank |
631,154 | 50.0 | % | 743,537 | 50.0 | % | 855,920 | 50.0 | % | 985,161 | 50.0 | % | ||||||||||||||||||||
| Proceeds used for loan to employee stock ownership plan |
108,021 | 8.6 | % | 127,083 | 8.5 | % | 146,146 | 8.5 | % | 168,068 | 8.5 | % | ||||||||||||||||||||
|
|
|
|
|
|
|
|
|
|
|
|
|
|
|
|
|
|||||||||||||||||
| Proceeds retained by Eastern Bankshares, Inc. |
$ | 523,133 | 41.4 | % | $ | 616,454 | 41.5 | % | $ | 709,774 | 41.5 | % | $ | 817,092 | 41.5 | % | ||||||||||||||||
|
|
|
|
|
|
|
|
|
|
|
|
|
|
|
|
|
|||||||||||||||||
Payments for shares of common stock made through withdrawals from existing deposit accounts will not result in the receipt of new funds for investment but will result in a reduction of Eastern Bank’s deposits. The net proceeds may vary because total expenses relating to the offering may be more or less than our estimates. For example, our expenses would increase if fewer shares were sold in the subscription and community offerings and more in the syndicated offering than we have assumed.
Eastern Bankshares, Inc. may use the proceeds it retains from the offering:
| • | to invest in securities; |
| • | to repurchase shares of our common stock, including repurchases to fund stock-based benefit plans; |
| • | to finance the potential acquisition of financial institutions or financial services companies, although we do not currently have any agreements or understandings regarding any specific acquisition transaction; |
| • | to pay cash dividends to shareholders; and |
| • | for other general corporate purposes. |
See the section of this prospectus titled “Our Dividend Policy” for a discussion of our expected dividend policy following the completion of the offering. Under current federal regulations, we may not repurchase shares of our common stock during the first year following the completion of the offering, except when extraordinary circumstances exist and with prior regulatory approval, or except to fund management recognition plans (which would require notification to the Federal Reserve Board) or tax qualified employee stock benefit plans. In addition, under Massachusetts regulations, we may not repurchase shares of our common stock during the first three years following the completion of the offering except to fund tax-qualified or nontax-qualified employee stock benefit plans, or except in amounts not greater than 5% of our outstanding shares of common stock where compelling and valid business reasons are established to the satisfaction of the Massachusetts Commissioner of Banks.
Eastern Bank expects that it will primarily use the net proceeds it receives from the offering:
| • | to fund new loans; |
67
Table of Contents
| • | to enhance existing products and services and to support the development of new products and services; |
| • | to support and enhance the development of our employees; |
| • | to pursue strategic growth opportunities primarily by acquiring other banking and insurance agency businesses as opportunities arise, although we do not currently have any understandings or agreements to acquire a financial institution or other entity; |
| • | to invest in securities; and |
| • | for other general corporate purposes. |
We have not determined specific amounts of the net proceeds that would be used for the purposes described above. The use of the proceeds outlined above may change based on many factors, including, but not limited to, changes in interest rates, equity markets, laws and regulations affecting the financial services industry, the attractiveness of potential acquisitions to expand our operations, and overall market conditions. The use of the proceeds may also change depending on our ability to receive regulatory approval to acquire other financial institutions. We expect our return on equity to be low until we are able to effectively deploy the additional capital raised in the offering. See the section of this prospectus titled “Risk Factors—Risks Related to the Offering—Our failure to effectively deploy the net proceeds may have an adverse effect on our financial performance.”
68
Table of Contents
Following completion of the offering, our Board of Directors will have the authority to declare dividends on our common stock, subject to our capital requirements, our financial condition and results of operations, tax considerations, statutory and regulatory limitations, and general economic conditions. The payment and amount of any dividend payments will depend upon a number of factors. We cannot assure you that we will pay dividends in the future, or that any such dividends will not be reduced or eliminated in the future.
Eastern Bankshares, Inc. will not be permitted to pay dividends on its common stock if its shareholders’ equity would be reduced below the amount of the liquidation account established by Eastern Bankshares, Inc. in connection with the offering. The source of dividends will depend on the net proceeds retained by Eastern Bankshares, Inc. and earnings thereon, and dividends from Eastern Bank. In addition, Eastern Bankshares, Inc. will be subject to state law limitations and federal bank regulatory policy on the payment of dividends. Massachusetts law prohibits distributions to shareholders if, after giving effect to the distribution, the corporation would not be able to pay its debts as they become due in the usual course of business or the corporation’s total assets would be less than the sum of its total liabilities plus the amount that would be needed, if the corporation were to be dissolved at the time of the distribution, to satisfy the preferential rights upon dissolution of shareholders whose preferential rights are superior to those receiving the distribution. Eastern Bankshares, Inc. shall not declare or pay a cash dividend on, or repurchase any of, its capital stock if the effect thereof would cause its net worth to be reduced below (i) the amount required for the Liquidation Account or (ii) the regulatory capital requirements of Eastern Bankshares, Inc. (to the extent applicable).
After the completion of the offering, Eastern Bank will not be permitted to make a capital distribution if, after making such distribution, it would be undercapitalized. Eastern Bank must file an application with the Federal Deposit Insurance Corporation for approval of a capital distribution if the total capital distributions for the applicable calendar year exceed the sum of Eastern Bank’s net income for that year to date plus its retained net income for the preceding two years, or Eastern Bank would not be at least adequately capitalized following the distribution.
In addition, Massachusetts banking law and Federal Deposit Insurance Corporation regulations impose limitations on capital distributions by savings institutions. See the section of this prospectus titled “Supervision and Regulation—Massachusetts Banking Laws and Supervision—Dividends.”
Any payment of dividends by Eastern Bank to Eastern Bankshares, Inc. that would be deemed to be drawn from Eastern Bank’s bad debt reserves established prior to 1988, if any, would require a payment of taxes at the then-current tax rate by Eastern Bank on the amount of earnings deemed to be removed from the pre-1988 bad debt reserves for such distribution. Eastern Bank does not intend to make any distribution that would create such a federal tax liability. For further information concerning additional federal law and regulations regarding the ability of Eastern Bank to make capital distributions, including the payment of dividends to Eastern Bankshares, Inc., see the sections of this prospectus titled “Taxation—Federal Taxation” and “Supervision and Regulation—Massachusetts Banking Laws and Supervision—Dividends.”
We will file a consolidated federal tax return with Eastern Bank. Accordingly, it is anticipated that any cash distributions made by us to our shareholders would be treated as cash dividends and not as a non-taxable return of capital for federal tax purposes to the extent of our current or accumulated earnings and profits as determined for U.S. federal income tax purposes.
Additionally, during the three-year period following the offering, we will not be permitted to make any capital distribution to shareholders that would be treated by recipients as a tax-free return of capital for U.S. federal income tax purposes.
69
Table of Contents
We have never issued capital stock and there is no established market for our shares of common stock. We expect that our shares of common stock will be listed for trading on Nasdaq under the symbol “EBC,” subject to completion of the offering and compliance with certain conditions, including the presence of at least three registered and active market makers. J.P. Morgan Securities LLC and Keefe, Bruyette & Woods, Inc. have advised us that they intend to make a market in shares of our common stock following the offering, but they are under no obligation to do so or to continue to do so once it begins. While we will attempt before completion of the offering to obtain commitments from at least two other broker-dealers to make a market in shares of our common stock, there can be no assurance that we will be successful in obtaining such commitments.
The development and maintenance of a public market, having the desirable characteristics of depth, liquidity and orderliness, depends on the existence of willing buyers and sellers, the presence of which is not within our control or that of any market maker. The number of active buyers and sellers of shares of our common stock at any particular time may be limited, which may have an adverse effect on the price at which shares of our common stock can be sold. There can be no assurance that persons purchasing the shares of common stock will be able to sell their shares at or above the $10.00 offering purchase price per share. You should have a long-term investment intent if you purchase shares of our common stock and you should recognize that there may be a limited trading market in the shares of common stock.
70
Table of Contents
HISTORICAL AND PRO FORMA REGULATORY CAPITAL COMPLIANCE
At March 31, 2020, Eastern Bank Corporation exceeded all of the applicable regulatory capital requirements and was considered “well-capitalized.” The table below sets forth the historical consolidated equity capital and regulatory capital of Eastern Bank Corporation at March 31, 2020, and the pro forma consolidated equity capital and regulatory capital of Eastern Bank Corporation, after giving effect to the sale of shares of common stock at $10.00 per share.
Presentation of regulatory measures, some of which follow regulatory definitions rather than GAAP, provides a meaningful base for comparability to other financial institutions. Such measures are used by the various banking regulators in reviewing the performance, stability, and capital adequacy of financial institutions they regulate. Although these regulatory measures are not GAAP terms, they are not considered “non-GAAP” under U.S. financial reporting rules as long as their presentation conforms to regulatory standards.
| Eastern Bank Corporation Actual as of March 31, 2020 |
Eastern Bankshares, Inc. Pro Forma at March 31, 2020, Based Upon the Sale in the Offering of |
|||||||||||||||||||||||||||||||||||||||
| 129,625,000 Shares | 152,500,000 Shares | 175,375,000 Shares | 201,681,250 Shares(1) | |||||||||||||||||||||||||||||||||||||
| (Dollars in thousands) |
Amount | Percent of Assets(2) |
Amount | Percent of Assets(2) |
Amount | Percent of Assets(2) |
Amount | Percent of Assets(2) |
Amount | Percent of Assets(2) |
||||||||||||||||||||||||||||||
| Equity |
$ | 1,662,734 | 13.47 | % | $ | 2,777,054 | 20.63 | % | $ | 2,975,704 | 21.79 | % | $ | 3,174,354 | 22.91 | % | $ | 3,402,802 | 24.16 | % | ||||||||||||||||||||
|
|
|
|
|
|
|
|
|
|
|
|
|
|
|
|
|
|
|
|
|
|||||||||||||||||||||
| Tier 1 leverage capital |
$ | 1,282,205 | 11.28 | % | $ | 2,396,525 | 19.20 | % | $ | 2,595,175 | 20.47 | % | $ | 2,793,825 | 21.69 | % | $ | 3,022,273 | 23.06 | % | ||||||||||||||||||||
| Tier 1 leverage capital requirement |
568,391 | 5.00 | % | 624,107 | 5.00 | % | 634,039 | 5.00 | % | 643,972 | 5.00 | % | 655,394 | 5.00 | % | |||||||||||||||||||||||||
|
|
|
|
|
|
|
|
|
|
|
|
|
|
|
|
|
|
|
|
|
|||||||||||||||||||||
| Excess |
$ | 713,814 | 6.28 | % | $ | 1,772,418 | 14.20 | % | $ | 1,961,136 | 15.47 | % | $ | 2,149,853 | 16.69 | % | $ | 2,366,879 | 18.06 | % | ||||||||||||||||||||
|
|
|
|
|
|
|
|
|
|
|
|
|
|
|
|
|
|
|
|
|
|||||||||||||||||||||
| Tier 1 risk-based capital(3) |
$ | 1,282,205 | 12.42 | % | $ | 2,396,525 | 22.73 | % | $ | 2,595,175 | 24.52 | % | $ | 2,793,825 | 26.30 | % | $ | 3,022,273 | 28.32 | % | ||||||||||||||||||||
| Tier 1 risk-based requirement |
825,771 | 8.00 | % | 843,600 | 8.00 | % | 846,779 | 8.00 | % | 849,957 | 8.00 | % | 853,612 | 8.00 | % | |||||||||||||||||||||||||
|
|
|
|
|
|
|
|
|
|
|
|
|
|
|
|
|
|
|
|
|
|||||||||||||||||||||
| Excess |
$ | 456,434 | 4.42 | % | $ | 1,552,925 | 14.73 | % | $ | 1,748,396 | 16.52 | % | $ | 1,943,868 | 18.30 | % | $ | 2,168,661 | 20.32 | % | ||||||||||||||||||||
|
|
|
|
|
|
|
|
|
|
|
|
|
|
|
|
|
|
|
|
|
|||||||||||||||||||||
| Total risk-based capital(3) |
$ | 1,400,389 | 13.57 | % | $ | 2,514,709 | 23.85 | % | $ | 2,713,359 | 25.63 | % | $ | 2,912,009 | 27.41 | % | $ | 3,140,457 | 29.43 | % | ||||||||||||||||||||
| Total risk-based requirement |
1,032,214 | 10.00 | % | 1,054,500 | 10.00 | % | 1,058,473 | 10.00 | % | 1,062,446 | 10.00 | % | 1,067,015 | 10.00 | % | |||||||||||||||||||||||||
|
|
|
|
|
|
|
|
|
|
|
|
|
|
|
|
|
|
|
|
|
|||||||||||||||||||||
| Excess |
$ | 368,175 | 3.57 | % | $ | 1,460,209 | 13.85 | % | $ | 1,654,886 | 15.63 | % | $ | 1,849,563 | 17.41 | % | $ | 2,073,442 | 19.43 | % | ||||||||||||||||||||
|
|
|
|
|
|
|
|
|
|
|
|
|
|
|
|
|
|
|
|
|
|||||||||||||||||||||
| Common equity Tier 1 risk-based capital |
$ | 1,282,205 | 12.42 | % | $ | 2,396,525 | 22.73 | % | $ | 2,595,175 | 24.52 | % | $ | 2,793,825 | 26.30 | % | $ | 3,022,273 | 28.32 | % | ||||||||||||||||||||
| Common equity Tier 1 risk-based requirement |
670,939 | 6.50 | % | 685,425 | 6.50 | % | 688,008 | 6.50 | % | 690,590 | 6.50 | % | 693,560 | 6.50 | % | |||||||||||||||||||||||||
|
|
|
|
|
|
|
|
|
|
|
|
|
|
|
|
|
|
|
|
|
|||||||||||||||||||||
| Excess |
$ | 611,266 | 5.92 | % | $ | 1,711,100 | 16.23 | % | $ | 1,907,167 | 18.02 | % | $ | 2,103,235 | 19.80 | % | $ | 2,328,713 | 21.82 | % | ||||||||||||||||||||
|
|
|
|
|
|
|
|
|
|
|
|
|
|
|
|
|
|
|
|
|
|||||||||||||||||||||
| (1) | As adjusted to give effect to an increase in the number of shares, which increase could occur due to a 15% increase in the offering range to reflect demand for shares or changes in market conditions following the commencement of the offering. |
| (2) | Equity and Tier 1 leverage capital levels are shown as a percentage of total average assets. Risk-based capital levels are shown as a percentage of risk-weighted assets. |
| (3) | Pro forma amounts and percentages assume net proceeds are invested in assets that carry a 20% risk weighting. |
71
Table of Contents
The following table presents the historical consolidated capitalization of Eastern Bank Corporation at March 31, 2020 and the pro forma consolidated capitalization of Eastern Bankshares, Inc. after giving effect to the offering based upon the assumptions set forth in the “Pro Forma Data” section of this prospectus. See the section of this prospectus titled “How We Intend to Use the Proceeds from the Offering.”
| Eastern Bank Corporation Historical Capitalization at March 31, 2020 |
Pro Forma Consolidated Capitalization at March 31, 2020 of Eastern Bankshares, Inc. Based Upon the Sale for $10.00 Per Share of |
|||||||||||||||||||
| (Dollars in thousands) |
129,625,000 Shares |
152,500,000 Shares |
175,375,000 Shares |
201,681,250 Shares(1) |
||||||||||||||||
| Deposits(2) |
$ | 10,309,011 | $ | 10,309,011 | $ | 10,309,011 | $ | 10,309,011 | $ | 10,309,011 | ||||||||||
| Borrowings |
31,427 | 31,427 | 31,427 | 31,427 | 31,427 | |||||||||||||||
|
|
|
|
|
|
|
|
|
|
|
|||||||||||
| Total deposits and borrowings |
$ | 10,340,438 | $ | 10,340,438 | $ | 10,340,438 | $ | 10,340,438 | $ | 10,340,438 | ||||||||||
|
|
|
|
|
|
|
|
|
|
|
|||||||||||
| Stockholders’ equity: |
||||||||||||||||||||
| Preferred stock, no par value per share; 10,000,000 shares authorized; none to be issued |
$ | — | $ | — | $ | — | $ | — | $ | — | ||||||||||
| Common stock, $0.01 par value per share; 1,000,000,000 shares authorized; shares to be issued as reflected(3) |
— | 1,350 | 1,589 | 1,827 | 2,101 | |||||||||||||||
| Additional paid-in capital |
— | 1,314,968 | 1,549,027 | 1,783,086 | 2,052,254 | |||||||||||||||
| Retained earnings |
1,651,314 | 1,651,314 | 1,651,314 | 1,651,314 | 1,651,314 | |||||||||||||||
| Accumulated other comprehensive loss, net of tax |
11,420 | 11,420 | 11,420 | 11,420 | 11,420 | |||||||||||||||
| Net impact of foundation |
||||||||||||||||||||
| Expense of stock donation to foundation(4) |
— | (54,010 | ) | (63,542 | ) | (73,073 | ) | (84,034 | ) | |||||||||||
| Tax benefit of donation to foundation(5) |
— | 14,043 | 16,521 | 18,999 | 21,849 | |||||||||||||||
| Less: |
||||||||||||||||||||
| Common stock acquired by employee stock ownership plan(6) |
— | (108,021 | ) | (127,083 | ) | (146,146 | ) | (168,068 | ) | |||||||||||
| Common stock acquired by stock-based benefit plans(7) |
— | (54,010 | ) | (63,542 | ) | (73,073 | ) | (84,034 | ) | |||||||||||
|
|
|
|
|
|
|
|
|
|
|
|||||||||||
| Total stockholders’ equity |
$ | 1,662,734 | 2,777,054 | 2,975,704 | 3,174,354 | 3,402,802 | ||||||||||||||
|
|
|
|
|
|
|
|
|
|
|
|||||||||||
| Pro Forma Shares Outstanding |
||||||||||||||||||||
| Total shares outstanding |
135,026,042 | 158,854,167 | 182,682,292 | 210,084,636 | ||||||||||||||||
| Shares issued to foundation |
5,401,042 | 6,354,167 | 7,307,292 | 8,403,386 | ||||||||||||||||
| Shares offered for sale |
129,625,000 | 152,500,000 | 175,375,000 | 201,681,250 | ||||||||||||||||
| Total stockholder’s equity as a percent of pro forma total assets |
13.47 | % | 20.63 | % | 21.79 | % | 22.91 | % | 24.16 | % | ||||||||||
| (1) | As adjusted to give effect to an increase of 15% in the number of shares sold in the offering range to reflect demand for the shares or changes in market conditions following the commencement of the offering. |
| (2) | Does not reflect withdrawals from deposit accounts for the purchase of shares of common stock in the offering. These withdrawals would reduce pro forma deposits and assets by the amount of the withdrawals. |
| (3) | No effect has been given to the issuance of additional shares of common stock pursuant to the exercise of options under one or more stock-based benefit plans. If the plans are implemented within the first year after the closing of the offering, an amount up to 10% of the outstanding shares of common stock of Eastern Bankshares, Inc. at the completion of the offering will be reserved for issuance upon the exercise of options under the plans. See the section of this prospectus titled “Management—Benefits to be Considered Following Completion of Offering.” |
| (4) | Expense of stock contributed to the Foundation equal to the total shares issued to the Foundation at the offering price of $10.00 per share. |
72
Table of Contents
| (5) | The pro forma consolidated capitalization assumes that we will realize 100% of the income tax benefit as a result of our contribution to the Foundation based on a 26.0% combined federal and state tax rate. |
| (6) | Assumes that 8.0% of total shares sold in the offering and issued to the Foundation will be acquired by the employee stock ownership plan financed by a loan from Eastern Bankshares, Inc. The loan will be repaid principally from Eastern Bank’s contributions to the employee stock ownership plan. Since Eastern Bankshares, Inc. will finance the employee stock ownership plan debt, this debt will be eliminated through consolidation and no liability will be reflected on Eastern Bankshares, Inc.’s consolidated balance sheet. Accordingly, the number of shares of common stock acquired by the employee stock ownership plan is shown in this table as a reduction of total stockholders’ equity. |
| (7) | Assumes a number of shares of common stock equal to 4% of total shares of common stock sold in the offering and issued to the Foundation will be purchased for grant by one or more stock-based benefit plans. The funds to be used by such plans to purchase the shares will be provided by Eastern Bankshares, Inc. The dollar amount of common stock to be purchased is based on the $10.00 per share subscription price in the offering and represents unearned compensation. This amount does not reflect possible increases or decreases in the value of common stock relative to the subscription price in the offering. Eastern Bankshares, Inc. will accrue compensation expense to reflect the vesting of shares pursuant to such stock-based benefit plans and will credit capital in an amount equal to the charge to noninterest expense. Implementation of such plans will require shareholder approval. |
73
Table of Contents
The following table summarizes historical data of Eastern Bank Corporation and pro forma data of Eastern Bankshares, Inc. as of and for the three months ended March 31, 2020 and as of and for the year ended December 31, 2019. This information is based on assumptions set forth below and in the table, and should not be used as a basis for projections of market value of the shares of common stock following the offering.
The net proceeds in the table are based upon the following assumptions:
| (i) | 80% of the shares of common stock will be sold in the subscription and community offerings; |
| (ii) | 20% of the shares of common stock will be sold in the syndicated offering; |
| (iii) | our employee stock ownership plan will purchase 8% of the shares of common stock sold in the offering (or possibly, after the offering, in open market purchases) and donated to the Eastern Bank Charitable Foundation with a loan from Eastern Bankshares, Inc. The loan will be repaid in substantially equal payments of principal and interest (at the prime rate of interest, calculated as of the date of the origination of the loan) over a period of 30 years. Interest income that we earn on the loan will offset the interest paid by Eastern Bank; |
| (iv) | no fee will be paid to Keefe, Bruyette & Woods, Inc., J.P. Morgan Securities LLC, and other broker-dealers with respect to shares of common stock purchased by our tax-qualified and non-qualified employee stock benefit plans, or stock purchased by our officers, directors, trustees, corporators and employees, and their immediate families; and |
| (v) | we will pay Keefe, Bruyette & Woods, Inc. and J.P. Morgan Securities LLC, collectively, a fee equal to 1.0% of the aggregate dollar amount of common stock sold in the subscription and community offerings (net of insider purchases and shares purchased by our tax-qualified and non-qualified employee stock benefit plans); |
| (vi) | we will pay J.P. Morgan Securities LLC, Keefe, Bruyette & Woods, Inc., and other broker-dealers participating in the syndicated offering, collectively, a fee equal to 5.5% of the aggregate dollar amount of common stock sold in the syndicated offering; and |
| (vii) | total expenses of the offering, other than fees and commissions to be paid to Keefe, Bruyette & Woods, Inc., J.P. Morgan Securities LLC and other broker-dealers, will be $10.6 million. |
We calculated pro forma consolidated net income for the three months ended March 31, 2020, and the year ended December 31, 2019 as if the estimated net proceeds had been invested at the beginning of the period at an assumed interest rate of 0.37% (0.27% after-tax). This rate represents the yield on the five-year U.S. Treasury Note at March 31, 2020, which, in light of current market interest rates, we consider to more accurately reflect the pro forma reinvestment rate than the arithmetic average of the weighted-average yield earned on our interest-earning assets and the weighted-average rate paid on our interest-bearing liabilities, which is the reinvestment rate generally required by applicable regulations.
We further believe that the reinvestment rate is factually supportable because:
| • | the yield on the U.S Treasury Note can be readily determined or estimated from third-party sources; and |
| • | we believe that U.S. Treasury securities are not subject to credit losses due to a U.S. Government guarantee of payment of principal and interest. |
We calculated historical and pro forma per share amounts by dividing historical and pro forma amounts of consolidated net income and shareholders’ equity by the indicated number of shares of common stock. For purposes of pro forma earnings per share calculations, we adjusted these figures to give effect to the shares of common stock purchased by the employee stock ownership plan. We computed per share amounts as if the shares of common stock were outstanding at the beginning of the year, but we did not adjust per share historical or pro forma shareholders’ equity to reflect the earnings on the estimated net proceeds.
The pro forma table gives effect to the implementation of one or more stock-based benefit plans. Subject to the receipt of shareholder approval, we have assumed that stock-based benefit plans will acquire for restricted stock awards a number of shares of common stock equal to 4.0% of the shares of common stock sold in the offering and issued to the Foundation at the same price for which they were sold in the offering. We assume that awards of common stock granted under such plans vest over a five-year period.
74
Table of Contents
We have also assumed that options will be granted under stock-based benefit plans to acquire shares of common stock equal to 10.0% of the shares of common stock sold in the offering and issued to the Foundation. In preparing the table below, we assumed that shareholder approval was obtained, that the exercise price of the stock options and the market price of the stock at the date of grant were $10.00 per share and that the stock options had a term of ten years and vested over five years. We applied the Black-Scholes option pricing model to estimate a grant-date fair value of $2.53 for each option. In addition to the terms of the options described above, the Black-Scholes option pricing model assumed an estimated volatility rate of 18.08% for the shares of common stock, no dividend yield, an expected option term of 10 years and a risk-free rate of return of 0.70%.
We may grant options and award shares of common stock under one or more stock-based benefit plans in excess of 10.0% and 4.0%, respectively, of the shares of common stock sold in the offering and issued to the Foundation and that vest sooner than over a five-year period if the stock-based benefit plans are adopted more than one year following the offering.
As discussed under “How We Intend to Use the Proceeds from the Offering,” we intend to contribute 50% of the net proceeds from the offering to Eastern Bank, and we will retain the remainder of the net proceeds from the offering. We will use a portion of the proceeds we retain for the purpose of funding a loan to the employee stock ownership plan and retain the rest of the proceeds for future use.
The pro forma table does not give effect to:
| • | withdrawals from deposit accounts to purchase shares of common stock in the offering; |
| • | our results of operations after the offering; |
| • | changes in the market price of the shares of common stock after the offering. |
The following pro forma information may not be representative of the financial effects of the offering at the dates on which the offering actually occurs, and should not be taken as indicative of future results of operations. Pro forma consolidated shareholders’ equity represents the difference between the stated amounts of our pro forma assets and pro forma liabilities. The pro forma shareholders’ equity is not intended to represent the fair market value of the shares of common stock and may be different than the amounts that would be available for distribution to shareholders if we liquidated. Moreover, pro forma shareholders’ equity per share does not give effect to the liquidation accounts to be established in the offering or, in the unlikely event of a liquidation of Eastern Bank, to the tax effect of the recapture of the bad debt reserve.
| As of or for the three months ended March 31, 2020 Based Upon the Sale at $10.00 Per Share of |
||||||||||||||||
| (Dollars in thousands, except per share data) |
129,625,000 Shares at Minimum of Offering Range |
152,500,000 Shares at Midpoint of Offering Range |
175,375,000 Shares at Maximum of Offering Range |
201,681,250 Shares at Adjusted Maximum of Offering Range (1) |
||||||||||||
| Gross proceeds of offering |
$ | 1,296,250 | $ | 1,525,000 | $ | 1,753,750 | $ | 2,016,813 | ||||||||
| Plus: Market value of shares donated to the Foundation |
54,010 | 63,542 | 73,073 | 84,034 | ||||||||||||
|
|
|
|
|
|
|
|
|
|||||||||
| Pro forma market capitalization |
$ | 1,350,260 | $ | 1,588,542 | $ | 1,826,823 | $ | 2,100,846 | ||||||||
| Gross proceeds of the offering |
1,296,250 | 1,525,000 | 1,753,750 | 2,016,813 | ||||||||||||
| Expenses |
(33,942 | ) | (37,926 | ) | (41,910 | ) | (46,492 | ) | ||||||||
|
|
|
|
|
|
|
|
|
|||||||||
| Estimated net proceeds |
$ | 1,262,308 | $ | 1,487,074 | $ | 1,711,840 | $ | 1,970,321 | ||||||||
| Common stock acquired by employee stock ownership plan |
(108,021 | ) | (127,083 | ) | (146,146 | ) | (168,068 | ) | ||||||||
| Common stock granted for restricted stock awards |
(54,010 | ) | (63,542 | ) | (73,073 | ) | (84,034 | ) | ||||||||
|
|
|
|
|
|
|
|
|
|||||||||
| Net investable proceeds |
$ | 1,100,277 | $ | 1,296,449 | $ | 1,492,621 | $ | 1,718,219 | ||||||||
|
|
|
|
|
|
|
|
|
|||||||||
| For the three months ended March 31, 2020 |
||||||||||||||||
| Consolidated net income |
||||||||||||||||
| Historical net income |
$ | 8,445 | $ | 8,445 | $ | 8,445 | $ | 8,445 | ||||||||
| Pro forma income on net investable proceeds |
753 | 888 | 1,022 | 1,176 | ||||||||||||
| Employee stock ownership plan (2) |
(666 | ) | (784 | ) | (901 | ) | (1,037 | ) | ||||||||
| Shares granted under restricted stock awards (3) |
(1,999 | ) | (2,351 | ) | (2,704 | ) | (3,109 | ) | ||||||||
| Options granted under stock-based benefit plans (4) |
(1,597 | ) | (1,879 | ) | (2,161 | ) | (2,485 | ) | ||||||||
|
|
|
|
|
|
|
|
|
|||||||||
| Pro forma net income(5) |
$ | 4,937 | $ | 4,319 | $ | 3,701 | $ | 2,991 | ||||||||
|
|
|
|
|
|
|
|
|
|||||||||
75
Table of Contents
| As of or for the three months ended March 31, 2020 Based Upon the Sale at $10.00 Per Share of |
||||||||||||||||
| (Dollars in thousands, except per share data) |
129,625,000 Shares at Minimum of Offering Range |
152,500,000 Shares at Midpoint of Offering Range |
175,375,000 Shares at Maximum of Offering Range |
201,681,250 Shares at Adjusted Maximum of Offering Range (1) |
||||||||||||
| Earnings per share |
||||||||||||||||
| Historical net income |
$ | 0.07 | $ | 0.06 | $ | 0.05 | $ | 0.04 | ||||||||
| Pro forma income on net investable proceeds |
0.01 | 0.01 | 0.01 | 0.01 | ||||||||||||
| Employee stock ownership plan (2) |
(0.01 | ) | (0.01 | ) | (0.01 | ) | (0.01 | ) | ||||||||
| Shares granted under restricted stock awards (3) |
(0.02 | ) | (0.02 | ) | (0.02 | ) | (0.02 | ) | ||||||||
| Options granted under stock-based benefit plans (4) |
(0.01 | ) | (0.01 | ) | (0.01 | ) | (0.01 | ) | ||||||||
|
|
|
|
|
|
|
|
|
|||||||||
| Pro forma net income per share(5) |
$ | 0.04 | $ | 0.03 | $ | 0.02 | $ | 0.01 | ||||||||
|
|
|
|
|
|
|
|
|
|||||||||
| Offering price as a multiple of pro forma net income per share, annualized |
62.50x | 83.33x | 125.00x | 250.00x | ||||||||||||
| Number of shares used in net income per share calculations |
124,313,976 | 146,251,736 | 168,189,497 | 193,417,922 | ||||||||||||
| At March 31, 2020 |
||||||||||||||||
| Stockholders’ equity: |
||||||||||||||||
| Historical stockholders’ equity |
$ | 1,662,734 | $ | 1,662,734 | $ | 1,662,734 | $ | 1,662,734 | ||||||||
| Estimated net proceeds |
1,262,308 | 1,487,074 | 1,711,840 | 1,970,321 | ||||||||||||
| Market value of shares donated to Foundation |
54,010 | 63,542 | 73,073 | 84,034 | ||||||||||||
| Expense of donation of stock to Foundation |
(54,010 | ) | (63,542 | ) | (73,073 | ) | (84,034 | ) | ||||||||
| Tax benefit of donation to Foundation |
14,043 | 16,521 | 18,999 | 21,849 | ||||||||||||
| Common Stock acquired by employee stock ownership plan (2) |
(108,021 | ) | (127,083 | ) | (146,146 | ) | (168,068 | ) | ||||||||
| Common stock granted under restricted stock awards (3) |
(54,010 | ) | (63,542 | ) | (73,073 | ) | (84,034 | ) | ||||||||
|
|
|
|
|
|
|
|
|
|||||||||
| Pro forma stockholders’ equity |
2,777,054 | 2,975,704 | 3,174,354 | 3,402,802 | ||||||||||||
| Intangible assets |
(377,033 | ) | (377,033 | ) | (377,033 | ) | (377,033 | ) | ||||||||
|
|
|
|
|
|
|
|
|
|||||||||
| Pro forma tangible stockholders’ equity |
$ | 2,400,021 | $ | 2,598,671 | $ | 2,797,321 | $ | 3,025,769 | ||||||||
|
|
|
|
|
|
|
|
|
|||||||||
| Stockholders’ equity per share |
||||||||||||||||
| Historical |
$ | 12.31 | $ | 10.47 | $ | 9.10 | $ | 7.91 | ||||||||
| Estimated net proceeds |
9.35 | 9.36 | 9.37 | 9.38 | ||||||||||||
| Market value of shares donated to Foundation |
0.40 | 0.40 | 0.40 | 0.40 | ||||||||||||
| Expense of donation of stock to Foundation |
(0.40 | ) | (0.40 | ) | (0.40 | ) | (0.40 | ) | ||||||||
| Tax benefit of donation to Foundation |
0.10 | 0.10 | 0.10 | 0.10 | ||||||||||||
| Common Stock acquired by employee stock ownership plan (2) |
(0.80 | ) | (0.80 | ) | (0.80 | ) | (0.80 | ) | ||||||||
| Common stock granted under restricted stock awards (3) |
(0.40 | ) | (0.40 | ) | (0.40 | ) | (0.40 | ) | ||||||||
|
|
|
|
|
|
|
|
|
|||||||||
| Pro forma stockholders’ equity per share |
20.56 | 18.73 | 17.37 | 16.19 | ||||||||||||
| Intangible assets |
(2.79 | ) | (2.37 | ) | (2.06 | ) | (1.79 | ) | ||||||||
|
|
|
|
|
|
|
|
|
|||||||||
| Pro forma tangible stockholders’ equity per share |
$ | 17.77 | $ | 16.36 | $ | 15.31 | $ | 14.40 | ||||||||
|
|
|
|
|
|
|
|
|
|||||||||
| Offering price as a percentage of pro forma stockholders’ equity per share |
48.64 | % | 53.39 | % | 57.57 | % | 61.77 | % | ||||||||
| Offering price as a percentage of pro forma tangible stockholders’ equity per share |
56.27 | % | 61.12 | % | 65.32 | % | 69.44 | % | ||||||||
| Number of shares outstanding for pro forma equity per share calculations |
135,026,042 | 158,854,167 | 182,682,292 | 210,084,636 | ||||||||||||
76
Table of Contents
| At or For the Year Ended December 31, 2019 Based Upon the Sale at $10.00 Per Share of |
||||||||||||||||
| (Dollars in thousands, except per share data) |
129,625,000 Shares at Minimum of Offering Range |
152,500,000 Shares at Minimum of Offering Range |
175,375,000 Shares at Minimum of Offering Range |
201,681,250 Shares at Adjusted Maximum of Offering Range (1) |
||||||||||||
| Gross proceeds |
$ | 1,296,250 | $ | 1,525,000 | $ | 1,753,750 | $ | 2,016,813 | ||||||||
| Plus: Market value of shares donated to the Foundation |
54,010 | 63,542 | 73,073 | 84,034 | ||||||||||||
|
|
|
|
|
|
|
|
|
|||||||||
| Pro forma market capitalization |
$ | 1,350,260 | $ | 1,588,542 | $ | 1,826,823 | $ | 2,100,846 | ||||||||
| Gross proceeds of the offering |
1,296,250 | 1,525,000 | 1,753,750 | 2,016,813 | ||||||||||||
| Expenses |
33,942 | 37,926 | 41,910 | 46,492 | ||||||||||||
|
|
|
|
|
|
|
|
|
|||||||||
| Estimated net proceeds |
1,262,308 | 1,487,074 | 1,711,840 | 1,970,321 | ||||||||||||
| Common stock acquired by employee stock ownership plan |
(108,021 | ) | (127,083 | ) | (146,146 | ) | (168,068 | ) | ||||||||
| Common stock granted for restricted stock awards |
(54,010 | ) | (63,542 | ) | (73,073 | ) | (84,034 | ) | ||||||||
|
|
|
|
|
|
|
|
|
|||||||||
| Net investable proceeds |
$ | 1,100,277 | $ | 1,296,449 | $ | 1,492,621 | $ | 1,718,219 | ||||||||
|
|
|
|
|
|
|
|
|
|||||||||
| For the year ended December 31, 2019 |
||||||||||||||||
| Consolidated net income |
||||||||||||||||
| Historical net income |
$ | 135,098 | $ | 135,098 | $ | 135,098 | $ | 135,098 | ||||||||
| Pro forma income on net investable proceeds |
3,013 | 3,550 | 4,087 | 4,704 | ||||||||||||
| Employee stock ownership plan (2) |
(2,665 | ) | (3,135 | ) | (3,605 | ) | (4,146 | ) | ||||||||
| Shares granted under restricted stock awards (3) |
(7,994 | ) | (9,404 | ) | (10,815 | ) | (12,437 | ) | ||||||||
| Options granted under stock-based benefit plans (4) |
(6,388 | ) | (7,516 | ) | (8,643 | ) | (9,939 | ) | ||||||||
|
|
|
|
|
|
|
|
|
|||||||||
| Pro forma net income(5) |
$ | 121,064 | $ | 118,593 | $ | 116,122 | $ | 113,280 | ||||||||
|
|
|
|
|
|
|
|
|
|||||||||
| Earnings per share |
||||||||||||||||
| Historical net income |
$ | 1.08 | $ | 0.92 | $ | 0.80 | $ | 0.70 | ||||||||
| Pro forma income on net investable proceeds |
0.02 | 0.02 | 0.02 | 0.02 | ||||||||||||
| Employee stock ownership plan |
(0.02 | ) | (0.02 | ) | (0.02 | ) | (0.02 | ) | ||||||||
| Shares granted under restricted stock awards |
(0.06 | ) | (0.06 | ) | (0.06 | ) | (0.06 | ) | ||||||||
| Options granted under stock-based benefit plans |
(0.05 | ) | (0.05 | ) | (0.05 | ) | (0.05 | ) | ||||||||
|
|
|
|
|
|
|
|
|
|||||||||
| Pro forma net income per share(5) |
$ | 0.97 | $ | 0.81 | $ | 0.69 | $ | 0.59 | ||||||||
|
|
|
|
|
|
|
|
|
|||||||||
| Offering price as a multiple of pro forma earnings per share |
10.31x | 12.35x | 14.49x | 16.95x | ||||||||||||
| Number of shares used in earnings per share calculations |
124,584,028 | 146,569,445 | 168,554,861 | 193,838,091 | ||||||||||||
| At December 31, 2019 |
||||||||||||||||
| Stockholders’ equity |
||||||||||||||||
| Historical stockholders’ equity |
$ | 1,600,153 | $ | 1,600,153 | $ | 1,600,153 | $ | 1,600,153 | ||||||||
| Estimated net proceeds |
1,262,308 | 1,487,074 | 1,711,840 | 1,970,321 | ||||||||||||
| Market value of shares donated to Foundation |
54,010 | 63,542 | 73,073 | 84,034 | ||||||||||||
| Expense of donation of stock to Foundation |
(54,010 | ) | (63,542 | ) | (73,073 | ) | (84,034 | ) | ||||||||
| Tax benefit of donation to Foundation |
14,043 | 16,521 | 18,999 | 21,849 | ||||||||||||
| Common stock acquired by employee stock ownership plan (2) |
(108,021 | ) | (127,083 | ) | (146,146 | ) | (168,068 | ) | ||||||||
| Common stock granted under restricted stock awards (3) |
(54,010 | ) | (63,542 | ) | (73,073 | ) | (84,034 | ) | ||||||||
|
|
|
|
|
|
|
|
|
|||||||||
| Pro forma stockholders’ equity |
2,714,473 | 2,913,123 | 3,111,773 | 3,340,221 | ||||||||||||
| Intangible assets |
(377,734 | ) | (377,734 | ) | (377,734 | ) | (377,734 | ) | ||||||||
|
|
|
|
|
|
|
|
|
|||||||||
| Pro forma tangible stockholders’ equity |
$ | 2,336,739 | $ | 2,535,389 | $ | 2,734,039 | $ | 2,962,487 | ||||||||
|
|
|
|
|
|
|
|
|
|||||||||
77
Table of Contents
| At or For the Year Ended December 31, 2019 Based Upon the Sale at $10.00 Per Share of |
||||||||||||||||
| (Dollars in thousands, except per share data) |
129,625,000 Shares at Minimum of Offering Range |
152,500,000 Shares at Minimum of Offering Range |
175,375,000 Shares at Minimum of Offering Range |
201,681,250 Shares at Adjusted Maximum of Offering Range (1) |
||||||||||||
| Stockholders’ equity per share |
||||||||||||||||
| Historical |
$ | 11.85 | $ | 10.07 | $ | 8.76 | $ | 7.62 | ||||||||
| Estimated net proceeds |
9.35 | 9.36 | 9.37 | 9.38 | ||||||||||||
| Market value of shares donated to Foundation |
0.40 | 0.40 | 0.40 | 0.40 | ||||||||||||
| Expense of donation of stock to Foundation |
(0.40 | ) | (0.40 | ) | (0.40 | ) | (0.40 | ) | ||||||||
| Tax benefit of donation to Foundation |
0.10 | 0.10 | 0.10 | 0.10 | ||||||||||||
| Common stock acquired by employee stock ownership plan (2) |
(0.80 | ) | (0.80 | ) | (0.80 | ) | (0.80 | ) | ||||||||
| Common stock granted under restricted stock awards (3) |
(0.40 | ) | (0.40 | ) | (0.40 | ) | (0.40 | ) | ||||||||
|
|
|
|
|
|
|
|
|
|||||||||
| Pro forma stockholders’ equity per share |
$ | 20.10 | $ | 18.33 | $ | 17.03 | $ | 15.90 | ||||||||
| Intangible assets |
(2.80 | ) | (2.38 | ) | (2.07 | ) | (1.80 | ) | ||||||||
|
|
|
|
|
|
|
|
|
|||||||||
| Pro forma tangible stockholders’ equity per share |
$ | 17.30 | $ | 15.95 | $ | 14.96 | $ | 14.10 | ||||||||
|
|
|
|
|
|
|
|
|
|||||||||
| Offering price as a percentage of pro forma stockholders’ equity per share |
49.75 | % | 54.56 | % | 58.72 | % | 62.89 | % | ||||||||
| Offering price as a percentage of pro forma tangible stockholders’ equity per share |
|
57.80 |
% |
|
62.70 |
% |
|
66.84 |
% |
|
70.92 |
% | ||||
| Number of shares outstanding for pro forma equity per share calculations |
135,026,042 | 158,854,167 | 182,682,292 | 210,084,636 | ||||||||||||
| (1) | As adjusted to give effect to an increase of 15% in the number of shares sold in the offering range to reflect demand for the shares or changes in market conditions following the commencement of the offering. |
| (2) | Assumes that 8.0% of the shares of common stock sold in the offering and issued to the Foundation will be purchased by the employee stock ownership plan. For purposes of this table, the funds used to acquire these shares are assumed to have been borrowed by the employee stock ownership plan from Eastern Bankshares, Inc. Eastern Bank intends to make annual contributions to the employee stock ownership plan in an amount at least equal to the required principal and interest payments on the debt. Eastern Bank’s total annual payments on the employee stock ownership plan debt are based upon 30 equal annual installments of principal and interest. Financial Accounting Standards Board Accounting Standards Codification (“ASC”) 718-40, “Compensation—Stock Compensation—Employee Stock Ownership Plans” (“ASC 718-40”) requires that an employer record compensation expense in an amount equal to the fair value of the shares released each year for allocation to employee accounts. The pro forma adjustments assume that the employee stock ownership plan shares are allocated in equal annual installments based on the number of loan repayment installments assumed to be paid by Eastern Bank, the fair value of the common stock remains equal to the subscription price and the employee stock ownership plan expense reflects an effective combined federal and state tax rate of 26.0%. The unallocated employee stock ownership plan shares are reflected as a reduction of stockholders’ equity. No reinvestment is assumed on proceeds contributed to fund the employee stock ownership plan. The pro forma net income further assumes that 90,017, 105,903, 121,788 and 140,056 shares were committed to be released during the three months ended March 31, 2020 at the minimum, midpoint, maximum, and adjusted maximum of the offering range, respectively, that 360,069, 423,611, 487,153 and 560,226 shares were committed to be released during the year ended December 31, 2019 at the minimum, midpoint, maximum, and adjusted maximum of the offering range, respectively, and according to ASC 718-40, only the employee stock ownership plan shares committed to be released during the period were considered outstanding for purposes of earnings per share calculations. |
| (3) | Assumes that one or more stock-based benefit plans purchase an aggregate number of shares of common stock equal to 4.0% of the shares of common stock sold in the offering and issued to the Foundation. Stockholder approval of the plans and purchases by the plans may not occur earlier than six months after the completion of the offering. The shares may be acquired directly from Eastern Bankshares, Inc. or through open market purchases. Shares in the stock-based benefit plans are assumed to vest over a period of five years. The funds to be used to purchase the shares will be provided by Eastern Bankshares, Inc. The table assumes that (i) the stock-based benefit plans acquire the shares through open market |
78
Table of Contents
| purchases at $10.00 per share, (ii) 5.0% of the amount contributed to the plans is amortized as an expense during the three months ended March 31, 2020, (iii) 20.0% of the amount contributed to the plans is amortized as an expense during the year ended December 31, 2019, and (iv) the plans’ expense reflects an effective combined federal and state tax rate of 26.0%. The issuance of authorized but unissued shares of common stock to fund these awards would dilute stockholders’ ownership and voting interests by approximately 3.85%. |
| (4) | Assumes that options are granted under one or more stock-based benefit plans to acquire an aggregate number of shares of common stock equal to 10.0% of the shares of common stock sold in the offering and issued to the Foundation. In calculating the pro forma effect of the stock-based benefit plans, it is assumed that the exercise price of the stock options and the trading price of the common stock at the date of grant were $10.00 per share, the estimated grant-date fair value determined using the Black-Scholes option pricing model was $2.53 for each option, the aggregate grant-date fair value of the stock options was amortized to expense on a straight-line basis over a five-year vesting period of the options, and that 25% of the amortization expense (or the assumed portion relating to options granted to directors) resulted in a tax benefit using an effective combined federal and state tax rate of 26.0%. The actual expense will be determined by the grant-date fair value of the options, which will depend on a number of factors, including the valuation assumptions used and the option pricing model ultimately adopted. Under the above assumptions, the implementation of the stock-based benefit plans will result in no additional shares under the treasury stock method for purposes of calculating net income per share. There can be no assurance that the actual exercise price of the stock options will be equal to the $10.00 price per share. If a portion of the shares used to satisfy the exercise of options comes from authorized but unissued shares, our net income per share and stockholders’ equity per share would decrease. The issuance of authorized but unissued shares of common stock pursuant to the exercise of options under such plan would dilute stockholders’ ownership and voting interests by approximately 9.09%. |
| (5) | Earnings per share computations are determined by taking the number of shares assumed to be sold in the offering and shares contributed to the Foundation and, according to ASC 718-40, subtracting the employee stock ownership plan shares which have not been committed for release during the period, see Note 2 above. The number of shares of common stock actually sold and the corresponding number of outstanding shares may be more or less than the assumed amounts |
79
Table of Contents
COMPARISON OF VALUATION AND PRO FORMA INFORMATION WITH AND WITHOUT THE STOCK DONATION TO THE CHARITABLE FOUNDATION
As reflected in the table below, without the donation to Eastern Bank Charitable Foundation, RP Financial, LC. estimates that our pro forma valuation would be greater and, as a result, a greater number of shares of common stock would be issued in the offering. At the minimum, midpoint, maximum and adjusted maximum of the valuation range, our pro forma valuation is $1.35 billion, $1.6 billion, $1.8 billion and $2.1 billion with the Eastern Bank Charitable Foundation, as compared to $1.4 billion, $1.7 billion, $1.9 billion and $2.2 billion, respectively, without the Eastern Bank Charitable Foundation.
For comparative purposes only, set forth below are certain pricing ratios and financial data and ratios at and for the three-month period ended March 31, 2020 at the minimum, midpoint, maximum and adjusted maximum of the offering range, assuming the offering was completed at the beginning of the year, with and without the Eastern Bank Charitable Foundation.
| Minimum of Offering Range |
Midpoint of Offering Range |
Maximum of Offering Range |
Adjusted Maximum of Offering Range |
|||||||||||||||||||||||||||||
| (Dollars in thousands, except per |
With Foundation |
Without Foundation |
With Foundation |
Without Foundation |
With Foundation |
Without Foundation |
With Foundation |
Without Foundation |
||||||||||||||||||||||||
| Estimated offering amount |
$ | 1,296,250 | $ | 1,402,500 | $ | 1,525,000 | $ | 1,650,000 | $ | 1,753,750 | $ | 1,897,500 | $ | 2,016,813 | $ | 2,182,125 | ||||||||||||||||
| Pro forma market capitalization |
1,350,260 | 1,402,500 | 1,588,542 | 1,650,000 | 1,826,823 | 1,897,500 | 2,100,846 | 2,182,125 | ||||||||||||||||||||||||
| Total assets |
13,458,074 | 13,542,073 | 13,656,724 | 13,755,546 | 13,855,374 | 13,969,020 | 14,083,822 | 14,214,515 | ||||||||||||||||||||||||
| Total liabilities |
10,681,020 | 10,681,020 | 10,681,020 | 10,681,020 | 10,681,020 | 10,681,020 | 10,681,020 | 10,681,020 | ||||||||||||||||||||||||
| Pro forma stockholders’ equity |
2,777,054 | 2,861,053 | 2,975,704 | 3,074,526 | 3,174,354 | 3,288,000 | 3,402,802 | 3,533,495 | ||||||||||||||||||||||||
| Pro forma net income |
4,937 | 4,839 | 4,319 | 4,204 | 3,701 | 3,569 | 2,991 | 2,839 | ||||||||||||||||||||||||
| Pro forma stockholders’ equity per share |
$ | 20.56 | $ | 20.40 | $ | 18.73 | $ | 18.64 | $ | 17.37 | $ | 17.33 | $ | 16.19 | $ | 16.19 | ||||||||||||||||
| Pro forma earnings per share |
$ | 0.04 | $ | 0.04 | $ | 0.03 | $ | 0.03 | $ | 0.02 | $ | 0.02 | $ | 0.01 | $ | 0.01 | ||||||||||||||||
| Pro forma pricing ratios |
||||||||||||||||||||||||||||||||
| Offering price as a percentage of pro forma stockholders’ equity per share |
48.64 | % | 49.02 | % | 53.39 | % | 53.65 | % | 57.57 | % | 57.70 | % | 61.77 | % | 61.77 | % | ||||||||||||||||
| Offering price as a percentage of pro forma tangible stockholders’ equity per share |
56.27 | % | 56.47 | % | 61.12 | % | 61.16 | % | 65.32 | % | 65.19 | % | 69.44 | % | 69.16 | % | ||||||||||||||||
| Offering price to annualized pro forma earnings per share |
62.50x | 62.50x | 83.33x | 83.33x | 125.00x | 125.00x | 250.00x | 250.00x | ||||||||||||||||||||||||
| Pro forma financial ratios |
||||||||||||||||||||||||||||||||
| Return on assets, annualized |
0.15 | % | 0.14 | % | 0.13 | % | 0.12 | % | 0.11 | % | 0.10 | % | 0.08 | % | 0.08 | % | ||||||||||||||||
| Return on equity, annualized |
0.71 | % | 0.68 | % | 0.58 | % | 0.55 | % | 0.47 | % | 0.43 | % | 0.35 | % | 0.32 | % | ||||||||||||||||
| Equity to assets |
20.63 | % | 21.13 | % | 21.79 | % | 22.35 | % | 22.91 | % | 23.54 | % | 24.16 | % | 24.86 | % | ||||||||||||||||
| Total shares issued |
135,026,042 | 140,250,000 | 158,854,167 | 165,000,000 | 182,682,292 | 189,750,000 | 210,084,636 | 218,212,500 | ||||||||||||||||||||||||
| Minimum of Offering Range |
Minimum of Offering Range |
Midpoint of Offering Range |
Midpoint of Offering Range |
Maximum of Offering Range |
Maximum of Offering Range |
Adjusted Maximum of Offering Range |
Adjusted Maximum of Offering Range |
|||||||||||||||||||||||||
| Before tax expense of contribution to Foundation |
$ | (54,010 | ) | $ | — | $ | (63,542 | ) | $ | — | $ | (73,073 | ) | $ | — | $ | (84,034 | ) | $ | — | ||||||||||||
| After-tax expense of contribution to Foundation |
(39,967 | ) | — | (47,021 | ) | — | (54,074 | ) | — | (62,185 | ) | — | ||||||||||||||||||||
| Pro forma net income |
4,937 | 4,839 | 4,319 | 4,204 | 3,701 | 3,569 | 2,991 | 2,839 | ||||||||||||||||||||||||
| Pro forma net income per share |
$ | 0.04 | $ | 0.04 | $ | 0.03 | $ | 0.03 | $ | 0.02 | $ | 0.02 | $ | 0.01 | $ | 0.01 | ||||||||||||||||
| Pro forma tax benefit |
14,043 | — | 16,521 | — | 18,999 | — | 21,849 | — | ||||||||||||||||||||||||
| Offering price to pro forma net income per share |
62.50x | 62.50x | 83.33x | 83.33x | 125.00x | 125.00x | 250.00x | 250.00x | ||||||||||||||||||||||||
| Pro forma return on assets |
0.15 | % | 0.14 | % | 0.13 | % | 0.12 | % | 0.11 | % | 0.10 | % | 0.08 | % | 0.08 | % | ||||||||||||||||
| Pro forma return on equity |
0.71 | % | 0.68 | % | 0.58 | % | 0.55 | % | 0.47 | % | 0.43 | % | 0.35 | % | 0.32 | % | ||||||||||||||||
80
Table of Contents
MANAGEMENT’S DISCUSSION AND ANALYSIS OF FINANCIAL CONDITION AND RESULTS OF OPERATIONS
The following discussion should be read in conjunction with the consolidated financial statements and notes thereto appearing elsewhere in this prospectus. In addition to historical data, this discussion contains forward-looking statements about our business, results of operations, cash flows, financial condition and prospects based on current expectations that involve risks, uncertainties and assumptions. See the section of this prospectus titled “Forward-Looking Statements” appearing elsewhere in this prospectus. Our actual results may differ materially from those in this discussion as a result of various factors, including, but not limited to, those discussed under “Risk Factors” and “Recent Developments” appearing elsewhere in this prospectus.
Overview
We are a Massachusetts-chartered bank that has served the banking needs of our customers since 1818. Our business philosophy is to operate as a diversified financial services enterprise providing a broad array of banking and other financial services primarily to retail, commercial and small business customers. We had total assets of $12.3 billion and $11.6 billion at March 31, 2020 and December 31, 2019, respectively. We are subject to comprehensive regulation and examination by the Massachusetts Commissioner of Banks, the Federal Deposit Insurance Corporation (“FDIC”), the Federal Reserve Board and the Consumer Financial Protection Bureau.
We manage our business under two business segments: our banking business, which contributed $113.0 million, or 81.0%, of our total income (interest and dividend income and noninterest income) for the three months ended March 31, 2020 and contributed $534.9 million, or 85.2%, of our total income for the year ended December 31, 2019, and our insurance agency business, which contributed $26.5 million, or 19.0%, of our total income for the three months ended March 31, 2020 and $92.7 million, or 14.8%, of our total income for the year ended December 31, 2019. Our banking business consists of a full range of banking, lending (commercial, residential and consumer), savings and small business offerings, including our wealth management and trust operations that we conduct through our Eastern Wealth Management division.
Banking Business
Our banking business offers a range of commercial, retail, wealth management and banking services, and consists primarily of attracting deposits from the general public, including municipalities, and investing those deposits, together with borrowings and funds generated from operations, to originate loans in a variety of sectors and to invest in securities. The financial condition and results of operations of our banking business depend primarily on (i) us attracting and retaining low cost, stable deposits, (ii) us using those deposits to originate and acquire loans and earn net interest income and (iii) our operating expenses incurred.
Lending Activities
We use funds obtained from deposits, as well as funds obtained from the Federal Home Loan Bank (“FHLB”) of Boston (“FHLBB”) advances and Federal funds, primarily to originate loans and to invest in securities. Our lending focuses on the following categories of loans:
Commercial Lending
| • | Commercial and industrial: Loans in this category consist of revolving and term loans extended to businesses and corporate enterprises for the purpose of financing working capital, equipment purchases and acquisitions. As of March 31, 2020 and December 31, 2019, we had total commercial and industrial loans of $1.8 billion and $1.6 billion, representing 19.5% and 18.3%, respectively, of our total loans. The primary risk associated with commercial and industrial loans is the ability of borrowers to achieve business results consistent with those projected at origination. Our primary focus for commercial and industrial loans is middle-market companies located in the markets we serve. In addition, we participate in the syndicated loan market and the Shared National Credit Program (“SNC Program”). As of March 31, 2020 and December 31, 2019, our SNC Program portfolio totaled $491.2 million and $419.0 million, or 27.7% and 25.5%, respectively, of our commercial and industrial portfolio, and 41.0% and 47.0%, respectively, of our SNC Program portfolio were loans to borrowers headquartered in our primary lending market. Our commercial and industrial portfolio also includes our Asset Based Lending Portfolio (“ABL Portfolio”). As of March 31, 2020 and December 31, 2019, our ABL Portfolio totaled $168.5 million and $163.0 million, or 9.5% and 9.9%, respectively, of our commercial and industrial portfolio. |
| • | Commercial real estate: Loans in this category include mortgage loans on commercial real estate, both investment and owner occupied. As of March 31, 2020 and December 31, 2019, we had total commercial real estate loans of $3.5 billion, representing 38.8% and 39.3%, respectively, of our total loans. Property types |
81
Table of Contents
| financed include office, industrial, multi-family, affordable housing, retail, hotel and other types of properties. Collateral values are established by independent third-party appraisals and evaluations. The primary repayment sources include operating income generated by the real estate, permanent debt refinancing and/or the sale of the real estate. |
| • | Commercial construction: Loans in this category include construction project financing and are comprised of commercial real estate, business banking and residential loans for the purpose of constructing and developing real estate. Substantially all of our commercial construction portfolio is in commercial real estate. As of March 31, 2020 and December 31, 2019, we had total commercial construction loans of $293.1 million and $273.7 million, representing 3.2% and 3.0%, respectively, of our total loans. |
| • | Business banking: Loans in this category are comprised of loans to small businesses with exposures of under $1 million and small investment real estate projects with exposures of under $3 million, and are separate and distinct from our commercial and industrial and commercial real estate portfolios described above due to the size of the loans. As of March 31, 2020 and December 31, 2019, we had total business banking loans of $779.9 million and $771.5 million, respectively, representing 8.6% of our total loans for each period. In this category, commercial and industrial loans and commercial real estate loans totaled $232.0 million and $547.9 million, respectively, as of March 31, 2020, and $229.0 million and $542.0 million, respectively, as of December 31, 2019. Business banking originations include traditionally underwritten loans as well as partially automated scored loans. Our proprietary decision matrix, which includes a number of quantitative factors including, but not limited to, a guarantor’s credit score, industry risk, and time in business, is used when determining whether to make business banking loans. We also engage in Small Business Association (“SBA”) lending. SBA guarantees reduce our risk of loss when default occurs and are considered a credit enhancement to the loan structure. |
Residential Lending
| • | Residential real estate: Loans in this category consist of mortgage loans on residential real estate. As of both March 31, 2020 and December 31, 2019, we had total residential loans of $1.4 billion, representing 15.6% and 15.9%, respectively, of our total loans. Underwriting considerations include, among others, income sources and their reliability, willingness to repay as evidenced by credit repayment history, financial resources including cash reserves and the value of the collateral. We maintain policy standards for minimum credit score and cash reserves and maximum loan to value consistent with a “prime” portfolio. Collateral consists of mortgage liens on residential dwellings. We do not originate or purchase sub-prime or other high-risk loans. Residential loans are originated either for sale to investors or retained in our loan portfolio. Decisions about whether to sell or retain residential loans are made based on the interest rate characteristics, pricing for loans in the secondary mortgage market, competitive factors and our capital needs. During the three months ended March 31, 2020 and year ended December 31, 2019, residential real estate mortgage originations were $60.8 million and $443.0 million, respectively, of which $49.7 million and $209.0 million, respectively, were sold on the secondary markets. We generally do not continue to service residential loans that we sell in the secondary market. |
Consumer Lending
| • | Consumer home equity: Loans in this category consist of home equity lines of credit and home equity loans. As of March 31, 2020 and December 31, 2019, we had total consumer home equity loans of $929.6 million and $933.1 million, representing 10.2% and 10.4%, respectively, of our total loans. Home equity lines of credit are granted for ten years with monthly interest-only repayment requirements. Home equity lines of credit can be converted to term loans that are fully amortized. Underwriting considerations are materially consistent with those utilized in residential real estate. Collateral consists of a senior or subordinate lien on owner-occupied residential property. |
| • | Other consumer: Loans in this category consist of unsecured personal lines of credit, overdraft protection, automobile and aircraft loans, and other personal loans. As of March 31, 2020 and December 31, 2019, we had total other consumer loans of $369.7 million and $402.4 million, representing 4.1% and 4.5%, respectively, of our total loans. Our policy and underwriting in this category include the following factors, among others, income sources and reliability, credit histories, term of repayment and collateral value, as applicable. Included in this category are $210.5 million and $243.9 million of automobile loans, respectively, at March 31, 2020 and December 31, 2019. During the year ended December 31, 2018, we discontinued the origination of indirect automobile loans for liquidity purposes and we anticipate this portfolio to runoff over the next several years. |
82
Table of Contents
Other Banking Products and Services
In addition to our lending activities, which are the core part of our banking business, we offer other banking products and services primarily related to (i) other commercial banking products, (ii) other consumer deposit products and (iii) wealth management services.
Other Commercial Banking Products
| • | We offer a variety of deposit products, treasury management, electronic banking, interest rate protection and foreign exchange products to our customers. Deposit products include checking products, both interest-bearing and non interest-bearing, as well as money market deposits, savings deposits and certificates of deposits. Our treasury management products include a variety of cash management and payment products. Our interest rate protection and foreign exchange products include interest rate swaps and currency related transactions. As of March 31, 2020 and December 31, 2019, our total commercial deposits were $3.7 billion and $3.2 billion, respectively, and our commercial non-interest income during the three months ended March 31, 2020 and year ended December 31, 2019 were $4.9 million and $29.8 million, respectively. As of March 31, 2020, there were no Federal funds provided to us by financial institution customers. During the month of March 2020, Federal funds provided to us by our financial institution customers were transferred to noninterest bearing deposits and totaled $253.3 million. As of December 31, 2019, Federal funds provided to us by our financial institution customers were $201.1 million. |
Other Consumer Deposit Products
| • | We offer a wide variety of deposit products and services to our consumer customers. We service these customers through our 89 branches located in eastern Massachusetts and New Hampshire, through our call center in our facility in Lynn, MA and through our online and mobile banking applications. |
Wealth Management Services
| • | Through our Eastern Wealth Management division, we provide a wide range of trust services, including (i) managing customer investments, (ii) serving as custodian for customer assets and (iii) providing other fiduciary services, including serving as the trustee and personal representative of estates. As of March 31, 2020 and December 31, 2019, we held $2.4 billion and $2.7 billion, respectively, of assets in a fiduciary, custodial or agency capacity for customers, which are not our assets and therefore not included on the consolidated balance sheets included in this prospectus. For the three months ended March 31, 2020 and the year ended December 31, 2019, we had noninterest income of $5.1 million and $19.7 million, respectively, from providing these services. |
Insurance Agency Business
Our insurance agency business consists of insurance-related activities such as acting as an independent agent in offering commercial, personal and employee benefits insurance products to individual and commercial clients through our wholly owned agency, Eastern Insurance Group LLC. Our insurance products include commercial property and liability, workers compensation, life, accident and health and automobile insurance. We also offer a wide range of employee benefits products and services, including professional advice related to health care cost management, employee engagement and retirement and executive services. As an agency business, we do not assume any underwriting or insurance risk. The commissions we earn on the sale of these insurance products and services is the most significant portion of our noninterest income, representing $27.5 million and $90.6 million, or 82.3% and 49.7%, respectively, of our noninterest income during the three months ended March 31, 2020 and year ended December 31, 2019. Our insurance business operates through 22 non-branch offices located primarily in eastern Massachusetts and had 411 full-time equivalent employees as of March 31, 2020.
83
Table of Contents
Business Segments
The following table presents certain financial information for our business segments:
| As of and for the three months ended March 31, | ||||||||||||||||||||||||||||||||
| 2020 | 2019 | |||||||||||||||||||||||||||||||
| Banking | Insurance | Eliminations | Consolidated | Banking | Insurance | Eliminations | Consolidated | |||||||||||||||||||||||||
| (in thousands) | ||||||||||||||||||||||||||||||||
| Net income |
$ | 1,163 | $ | 6,369 | $ | 913 | $ | 8,445 | $ | 27,985 | $ | 4,072 | $ | 908 | $ | 32,965 | ||||||||||||||||
| Total assets |
$ | 12,221,799 | $ | 182,564 | $ | (60,609 | ) | $ | 12,343,754 | $ | 11,221,425 | $ | 154,448 | $ | (44,895 | ) | $ | 11,330,978 | ||||||||||||||
| Total liabilities |
$ | 10,696,509 | $ | 45,120 | $ | (60,609 | ) | $ | 10,681,020 | $ | 9,851,901 | $ | 28,874 | $ | (44,895 | ) | $ | 9,835,880 | ||||||||||||||
| As of and for the year ended December 31, | ||||||||||||||||||||||||||||||||
| 2019 | 2018 | |||||||||||||||||||||||||||||||
| Banking | Insurance Agency |
Other/ Eliminations |
Consolidated | Banking | Insurance Agency |
Other/ Eliminations |
Consolidated | |||||||||||||||||||||||||
|
|
|
|
|
|
|
|
|
|
|
|
|
|||||||||||||||||||||
| (In thousands) | ||||||||||||||||||||||||||||||||
| Net income |
$ | 121,939 | $ | 9,723 | $ | 3,436 | $ | 135,098 | $ | 105,271 | $ | 14,810 | $ | 2,646 | $ | 122,727 | ||||||||||||||||
| Total assets |
$ | 11,515,117 | $ | 165,965 | $ | (52,307 | ) | $ | 11,628,775 | $ | 11,265,752 | $ | 152,832 | $ | (40,297 | ) | $ | 11,378,287 | ||||||||||||||
| Total liabilities |
$ | 10,046,189 | $ | 34,740 | $ | (52,307 | ) | $ | 10,028,622 | $ | 9,954,112 | $ | 31,331 | $ | (40,297 | ) | $ | 9,945,146 | ||||||||||||||
Impact of Covid-19 Pandemic
The Covid-19 pandemic has already had a significant impact on our operating results, and we believe it will continue to have an impact for at least the remainder of the year ending December 31, 2020. We expect the short- and long-term economic consequences of Covid-19 to our customers to be significant, and that the continuing health safety concerns relating to the ongoing pandemic will change the way we conduct our business and interact with our customers. See the section of this prospectus titled “Recent Developments—Covid-19 Impact” for additional information regarding the impact the Covid-19 pandemic has had on our business.
Non-GAAP Measures
We present non-GAAP measures, which are used to evaluate our performance and exclude the effects of certain transactions, non-cash items and GAAP adjustments that we believe are unrelated to our core business and not necessarily indicative of our current performance or financial position. Management believes excluding these items facilitates greater visibility into our core businesses and underlying trends that may, to some extent, be obscured by inclusion of such items.
There are items that impact our results that we believe are unrelated to our core business. Therefore, we present net operating earnings, noninterest income on an operating basis, noninterest expense on an operating basis, total operating income and the efficiency ratio on an operating basis, each of which excludes the impact of the items that we do not believe are related to our core business as we believe excluding these items provides greater visibility into our core business and underlying trends. Items we do not consider to be core to our business include (i) income and expenses from investments held in rabbi trusts, (ii) gains and losses on sales of securities available for sale, net, (iii) gains and losses on the sale of other assets, (iv) rabbi trust employee benefit and (v) merger and acquisition expenses.
We also present tangible equity, tangible assets and tangible equity to tangible assets ratios, each of which excludes the impact of goodwill and other intangible assets, as we believe these measures provide the ability to further assess our performance, identify trends in our core business and provide a comparison of our capital adequacy to other companies. We have included information on these tangible ratios because management believes that investors may find it useful to have access to the same analytical tools used by management to assess performance and identify trends.
Our non-GAAP measures should not be considered as an alternative to GAAP net income, an indication of our cash flows from operating activities, a measure of our liquidity or an indication of funds available for our cash needs. An item which we consider to be noncore and exclude when computing these non-GAAP measures can be of substantial importance to our results for any particular period. In addition, our methodology for calculating non-GAAP measures may differ from the methodologies employed by other companies to calculate the same or similar performance measures and, accordingly, our reported non-GAAP measures may not be comparable to the same or similar performance measures reported by other companies.
84
Table of Contents
The following table summarizes the impact of noncore items recorded for the time periods indicated below and reconciles them to the most directly comparable GAAP measure.
| Three months ended March 31, | Year ended December 31, | |||||||||||||||
| 2020 | 2019 | 2019 | 2018 | |||||||||||||
| (In thousands) |
||||||||||||||||
| Net income (GAAP) |
$ | 8,445 | $ | 32,965 | $ | 135,098 | $ | 122,727 | ||||||||
|
|
|
|
|
|
|
|
|
|||||||||
| Non-GAAP adjustments: |
||||||||||||||||
| Noninterest income components: |
||||||||||||||||
| (Income) losses from investments held in rabbi trusts |
6,743 | (4,147 | ) | (9,866 | ) | 1,542 | ||||||||||
| Gains on sales of securities available for sale, net |
(122 | ) | (50 | ) | (2,016 | ) | (50 | ) | ||||||||
| (Gains) losses on sale of other assets |
(29 | ) | (29 | ) | 15 | (1,989 | ) | |||||||||
| Noninterest expense components: |
||||||||||||||||
| Rabbi trust employee benefit expenses (income) |
(3,479 | ) | 1,946 | 4,604 | (847 | ) | ||||||||||
| Merger and acquisition expenses |
— | — | — | 244 | ||||||||||||
|
|
|
|
|
|
|
|
|
|||||||||
| Total impact of Non-GAAP adjustments: |
3,113 | (2,280 | ) | (7,263 | ) | (1,100 | ) | |||||||||
|
|
|
|
|
|
|
|
|
|||||||||
| Net tax (expense) benefit associated with Non-GAAP adjustment (1) |
(894 | ) | 626 | 1,861 | 169 | |||||||||||
|
|
|
|
|
|
|
|
|
|||||||||
| Non-GAAP adjustments, net of tax |
$ | 2,219 | $ | (1,654 | ) | $ | (5,402 | ) | $ | (931 | ) | |||||
|
|
|
|
|
|
|
|
|
|||||||||
| Net operating earnings (Non-GAAP) |
$ | 10,664 | $ | 31,311 | $ | 129,696 | $ | 121,796 | ||||||||
|
|
|
|
|
|
|
|
|
|||||||||
| (1) | The net tax (expense) benefit associated with these items is determined by assessing whether each item is included or excluded from net taxable income and applying our combined statutory tax rate only to those items included in net taxable income. |
85
Table of Contents
The following table summarizes the impact of noncore items with respect to our total income, noninterest income, noninterest expense and the efficiency ratio, which reconciles to the most directly comparable respective GAAP measure, for the periods indicated:
| Three months ended March 31, |
Year ended December 31, | |||||||||||||||||||||||||||
| 2020 | 2019 | 2019 | 2018 | 2017 | 2016 | 2015 | ||||||||||||||||||||||
| (Dollars in thousands) |
||||||||||||||||||||||||||||
| Net interest income (GAAP) |
$ | 100,146 | $ | 102,672 | $ | 411,264 | $ | 390,044 | $ | 338,514 | $ | 293,574 | $ | 274,977 | ||||||||||||||
| Add: |
||||||||||||||||||||||||||||
| Tax-equivalent adjustment (non-GAAP) |
1,368 | 1,380 | 5,254 | 5,695 | 10,607 | 8,271 | 6,597 | |||||||||||||||||||||
|
|
|
|
|
|
|
|
|
|
|
|
|
|
|
|||||||||||||||
| Net interest income (non-GAAP) |
101,514 | 104,052 | 416,518 | 395,739 | 349,121 | 301,845 | 281,574 | |||||||||||||||||||||
| Noninterest income (GAAP) |
33,369 | 47,800 | 182,299 | 180,595 | 197,727 | 169,128 | 153,007 | |||||||||||||||||||||
| Less: |
||||||||||||||||||||||||||||
| Income (losses) from investments held in rabbi trusts |
(6,743 | ) | 4,147 | 9,866 | (1,542 | ) | 6,587 | 2,161 | 698 | |||||||||||||||||||
| Gains (losses) on sales of securities available for sale, net |
122 | 50 | 2,016 | 50 | 11,356 | 261 | (62 | ) | ||||||||||||||||||||
| Gains (losses) on sale of other assets |
29 | 29 | (15 | ) | 1,989 | 6,075 | 2,698 | 2,014 | ||||||||||||||||||||
|
|
|
|
|
|
|
|
|
|
|
|
|
|
|
|||||||||||||||
| Noninterest income on an operating basis (non-GAAP) |
39,961 | 43,574 | 170,432 | 180,098 | 173,709 | 164,008 | 150,357 | |||||||||||||||||||||
|
|
|
|
|
|
|
|
|
|
|
|
|
|
|
|||||||||||||||
| Noninterest expense (GAAP) |
$ | 95,172 | $ | 104,829 | $ | 412,684 | $ | 397,928 | $ | 389,413 | $ | 367,643 | $ | 333,695 | ||||||||||||||
| Plus: |
||||||||||||||||||||||||||||
| Rabbi trust benefit expenses (income) |
3,479 | (1,946 | ) | 4,604 | (847 | ) | 2,888 | 965 | 432 | |||||||||||||||||||
| Merger and acquisition expenses |
— | — | — | 244 | 149 | 149 | 167 | |||||||||||||||||||||
|
|
|
|
|
|
|
|
|
|
|
|
|
|
|
|||||||||||||||
| Noninterest expense on an operating basis (non-GAAP) |
$ | 98,651 | $ | 102,833 | $ | 417,288 | $ | 397,325 | $ | 392,450 | $ | 368,757 | $ | 334,294 | ||||||||||||||
|
|
|
|
|
|
|
|
|
|
|
|
|
|
|
|||||||||||||||
| Total income (GAAP) |
$ | 133,515 | $ | 150,472 | $ | 593,563 | $ | 570,639 | $ | 536,241 | $ | 462,702 | $ | 427,984 | ||||||||||||||
|
|
|
|
|
|
|
|
|
|
|
|
|
|
|
|||||||||||||||
| Total operating income (non-GAAP) |
$ | 141,475 | $ | 147,626 | $ | 586,950 | $ | 575,837 | $ | 522,830 | $ | 465,853 | $ | 431,931 | ||||||||||||||
|
|
|
|
|
|
|
|
|
|
|
|
|
|
|
|||||||||||||||
| Ratios |
||||||||||||||||||||||||||||
| Efficiency ratio (GAAP) |
71.28 | % | 69.67 | % | 69.53 | % | 69.73 | % | 72.62 | % | 79.46 | % | 77.97 | % | ||||||||||||||
| Efficiency ratio on an operating basis (non-GAAP) |
69.73 | % | 69.69 | % | 71.09 | % | 69.00 | % | 75.06 | % | 79.16 | % | 77.40 | % | ||||||||||||||
86
Table of Contents
The following table summarizes the calculation of our tangible equity, tangible assets and tangible equity to tangible assets ratio, which reconciles to the most directly comparable respective GAAP measure, as of the dates indicated:
| As of March 31, | As of December 31, | |||||||||||||||||||||||
| 2020 | 2019 | 2018 | 2017 | 2016 | 2015 | |||||||||||||||||||
| (Dollars in thousands) |
||||||||||||||||||||||||
| Tangible equity |
||||||||||||||||||||||||
| Total equity |
$ | 1,662,734 | $ | 1,600,153 | $ | 1,433,141 | $ | 1,330,514 | $ | 1,254,927 | $ | 1,205,014 | ||||||||||||
| Less: Goodwill and other intangibles |
377,033 | 377,734 | 381,276 | 373,042 | 362,980 | 362,762 | ||||||||||||||||||
|
|
|
|
|
|
|
|
|
|
|
|
|
|||||||||||||
| Tangible equity (Non-GAAP) |
1,285,701 | $ | 1,222,419 | $ | 1,051,865 | $ | 957,472 | $ | 891,947 | $ | 842,252 | |||||||||||||
|
|
|
|
|
|
|
|
|
|
|
|
|
|||||||||||||
| Tangible assets |
||||||||||||||||||||||||
| Total assets (GAAP) |
12,343,754 | 11,628,775 | 11,378,287 | 10,873,073 | 9,801,109 | 9,588,786 | ||||||||||||||||||
| Less: Goodwill and other intangibles |
377,033 | 377,734 | 381,276 | 373,042 | 362,980 | 362,762 | ||||||||||||||||||
|
|
|
|
|
|
|
|
|
|
|
|
|
|||||||||||||
| Tangible assets (Non-GAAP) |
$ | 11,966,721 | $ | 11,251,041 | $ | 10,997,011 | $ | 10,500,031 | $ | 9,438,129 | $ | 9,226,024 | ||||||||||||
|
|
|
|
|
|
|
|
|
|
|
|
|
|||||||||||||
| Equity to assets ratio (GAAP) |
13.5 | % | 13.8 | % | 12.6 | % | 12.2 | % | 12.8 | % | 12.6 | % | ||||||||||||
| Tangible equity to tangible assets ratio (Non-GAAP) |
10.7 | % | 10.9 | % | 9.6 | % | 9.1 | % | 9.5 | % | 9.1 | % | ||||||||||||
Financial Position
Summary of Financial Position
| Change | ||||||||||||||||||||||||||||
| As of March 31, | As of December 31, | March 31, 2020 vs. December 31, 2019 |
December 31, 2019 vs. December 31, 2018 |
|||||||||||||||||||||||||
| 2020 | 2019 | 2018 | Amount ($) |
Percentage (%) |
Amount ($) |
Percentage (%) |
||||||||||||||||||||||
| (Dollars in thousands) |
||||||||||||||||||||||||||||
| Cash and cash equivalents |
$ | 766,449 | $ | 362,602 | $ | 259,708 | $ | 403,847 | 111.4 | % | $ | 102,894 | 39.6 | % | ||||||||||||||
| Securities available for sale |
1,549,927 | 1,508,236 | 1,455,898 | 41,691 | 2.8 | % | 52,338 | 3.6 | % | |||||||||||||||||||
| Loans, net of allowance for credit losses |
8,971,605 | 8,899,184 | 8,774,913 | 72,421 | 0.8 | % | 124,271 | 1.4 | % | |||||||||||||||||||
| Federal Home Loan Bank Stock |
8,805 | 9,027 | 17,959 | (222 | ) | (2.5 | )% | (8,932 | ) | (49.7 | )% | |||||||||||||||||
| Goodwill and Other intangible assets |
377,033 | 377,734 | 381,276 | (701 | ) | (0.2 | )% | (3,542 | ) | (0.9 | )% | |||||||||||||||||
| Deposits |
10,309,011 | 9,551,392 | 9,399,493 | 757,619 | 7.9 | % | 151,899 | 1.6 | % | |||||||||||||||||||
| Borrowed funds |
31,427 | 235,395 | 334,287 | (203,968 | ) | (86.6 | )% | (98,892 | ) | (29.6 | )% | |||||||||||||||||
Cash and cash equivalents
Total cash and cash equivalents increased by $403.8 million, or 111.4%, to $766.4 million at March 31, 2020 from $362.6 million at December 31, 2019. This increase resulted primarily from customer deposit growth, which exceeded our funding needs for new lending activities.
Total cash and cash equivalents increased by $102.9 million, or 39.6%, to $362.6 million at December 31, 2019 from $259.7 million at December 31, 2018. This increase resulted from deposit growth and capital generation, which exceeded our funding needs for new lending activities.
Securities
Our current investment policy authorizes us to invest in various types of investment securities and liquid assets, including U.S. Treasury obligations, securities of government-sponsored enterprises, mortgage-backed securities,
87
Table of Contents
collateralized mortgage obligations, corporate notes, asset-backed securities and municipal securities. We do not engage in any investment hedging activities or trading activities, nor do we purchase any high-risk investment products. We typically invest in the following types of securities:
U.S. Government securities: We maintain these investments, to the extent appropriate, for liquidity purposes, at zero risk weighting for capital purposes and as collateral for interest rate derivative positions. At March 31, 2020 and December 31, 2019, U.S. Government securities consisted solely of U.S. Treasury securities.
Mortgage-backed securities: We invest in mortgage-backed securities insured or guaranteed by Freddie Mac or Fannie Mae. We have not purchased any privately-issued mortgage-backed securities. We invest in mortgage-backed securities to achieve a positive interest rate spread with minimal administrative expense, and to lower our credit risk as a result of the guarantees provided by Freddie Mac or Fannie Mae.
Investments in mortgage-backed securities involve a risk that actual payments will be greater or less than the prepayment rate estimated at the time of purchase, which may require adjustments to the amortization of any premium or acceleration of any discount relating to such interests, thereby affecting the net yield on our securities. We periodically review current prepayment speeds to determine whether prepayment estimates require modification that could cause amortization or accretion adjustments. There is also reinvestment risk associated with the cash flows from such securities. In addition, the market value of such securities may be adversely affected by changes in interest rates.
State and municipal securities: We invest in fixed rate investment grade bonds issued primarily by municipalities in our local communities within Massachusetts and the Commonwealth of Massachusetts. The market value of these securities may be affected by call options, long dated maturities, general market liquidity and credit factors.
The Risk Management Committee of our Board of Directors is responsible for approving and overseeing our investment policy, which it reviews at least annually. This policy dictates that investment decisions be made based on the safety of the investment, liquidity requirements, potential returns and market risk considerations. We anticipate that the size of our investment portfolio will increase as a result of this offering, but that the risk profile of our portfolio characteristics will remain consistent subsequent to this offering.
Accounting guidance requires that debt and equity securities, at the time of purchase, are designated as held to maturity, available for sale, or trading, depending on our ability and intent for the respective security.
The following table shows the fair value of our securities by investment category as of the dates indicated:
Securities Portfolio Composition
| As of March 31, | As of December 31, | |||||||||||||||
| 2020 | 2019 | 2018 | 2017 | |||||||||||||
| (In thousands) |
||||||||||||||||
| Available for sale securities: |
||||||||||||||||
| Government-sponsored residential mortgage-backed securities |
$ | 1,203,489 | $ | 1,167,968 | $ | 1,136,137 | $ | 1,167,444 | ||||||||
| U.S. Treasury securities |
61,235 | 50,420 | — | — | ||||||||||||
| State and municipal bonds and obligations |
278,954 | 283,538 | 313,716 | 331,380 | ||||||||||||
| Other |
6,249 | 6,310 | 6,045 | 5,986 | ||||||||||||
| Trading Securities: |
||||||||||||||||
| Municipal bonds and obligations |
652 | 961 | 52,899 | 46,791 | ||||||||||||
|
|
|
|
|
|
|
|
|
|||||||||
| Total |
$ | 1,550,579 | $ | 1,509,197 | $ | 1,508,797 | $ | 1,551,601 | ||||||||
|
|
|
|
|
|
|
|
|
|||||||||
Our securities portfolio has remained relatively consistent. Available for sale securities increased $41.7 million, or 2.8%, to $1.55 billion at March 31, 2020 from $1.51 billion at December 31, 2019. Trading securities decreased $0.3 million, or 32.2%, to $0.7 million at March 31, 2020 from $1.0 million at December 31, 2019.
Available for sale securities increased $52.3 million, or 3.6%, to $1.51 billion at December 31, 2019 from $1.46 billion at December 21, 2018, and trading securities decreased $51.9 million, or 98.2%, to $1.0 million at December 31, 2019 from
88
Table of Contents
$52.9 million at December 31, 2018. We did not have held-to-maturity investments at December 31, 2019 or 2018. Our strategy is to continue to invest in high quality intermediate term securities which are easily sold, while achieving a reasonable rate of return.
A portion of our securities portfolio continues to be tax-exempt. Investments in tax-exempt securities totaled $279.6 million at March 31, 2020 compared to $284.4 million and $366.6 million, respectively, at December 31, 2019 and 2018.
Our available for sale securities are carried at fair value and are categorized within the fair value hierarchy based on the observability of model inputs. Securities which require inputs that are both significant to the fair value measurement and unobservable are classified as level 3 within the fair value hierarchy. As of both March 31, 2020 and December 31, 2019, we had $6.3 million of securities categorized as level 3 within the fair value hierarchy. As of December 31, 2018, we had $6.0 million of securities categorized as level 3 within the fair value hierarchy.
Maturities of our securities portfolio are based on the final contractual payment dates, and do not reflect the effect of scheduled principal repayments, prepayments, or early redemptions that may occur.
The following tables show contractual maturities of our available for sale securities and weighted average yields at and for the periods ended March 31, 2020 and December 31, 2019. Weighted average yields in the table below have been calculated based on the amortized cost of the security:
Securities Portfolio, Amounts Maturing
| Securities Maturing as of and for the three months ended March 31, 2020 |
||||||||||||||||||||
| Within One Year |
After One Year But Within Five Years |
After Five Years But Within Ten Years |
After Ten Years |
Total | ||||||||||||||||
| (Dollars in thousands) | ||||||||||||||||||||
| Available for sale securities: |
||||||||||||||||||||
| Government-sponsored residential mortgage-backed securities |
$ | — | $ | 20,855 | $ | 179,157 | $ | 1,003,477 | $ | 1,203,489 | ||||||||||
| U.S. Treasury securities |
51,069 | 10,166 | — | — | 61,235 | |||||||||||||||
| State and municipal bonds and obligations |
380 | 14,126 | 73,531 | 190,917 | 278,954 | |||||||||||||||
| Other |
6,249 | — | — | — | 6,249 | |||||||||||||||
| Trading securities: |
||||||||||||||||||||
| Municipal bonds and obligations |
652 | — | — | — | 652 | |||||||||||||||
|
|
|
|
|
|
|
|
|
|
|
|||||||||||
| Total |
$ | 58,350 | $ | 45,147 | $ | 252,688 | $ | 1,194,394 | $ | 1,550,579 | ||||||||||
|
|
|
|
|
|
|
|
|
|
|
|||||||||||
| Weighted-average yield |
2.50 | % | 2.58 | % | 2.81 | % | 2.71 | % | 2.71 | % | ||||||||||
| Securities Maturing as of and for the year ended December 31, 2019 | ||||||||||||||||||||
| Within One Year |
After One Year But Within Five Years |
After Five Years But Within Ten Years |
After Ten Years |
Total | ||||||||||||||||
| (Dollars in thousands) | ||||||||||||||||||||
| Available for sale securities: |
||||||||||||||||||||
| Government-sponsored residential mortgage-backed securities |
$ | — | $ | 8,464 | $ | 203,706 | $ | 955,798 | $ | 1,167,968 | ||||||||||
| U.S. Treasury securities |
40 | 50,380 | — | — | 50,420 | |||||||||||||||
| State and municipal bonds and obligations |
381 | 9,109 | 79,504 | 194,544 | 283,538 | |||||||||||||||
| Other |
6,310 | — | — | — | 6,310 | |||||||||||||||
| Trading Securities: |
||||||||||||||||||||
| Municipal bonds and obligations |
961 | — | — | — | 961 | |||||||||||||||
|
|
|
|
|
|
|
|
|
|
|
|||||||||||
| Total |
$ | 7,692 | $ | 67,953 | $ | 283,210 | $ | 1,150,342 | $ | 1,509,197 | ||||||||||
|
|
|
|
|
|
|
|
|
|
|
|||||||||||
| Weighted-average yield |
5.44 | % | 2.38 | % | 2.95 | % | 2.92 | % | 2.90 | % | ||||||||||
89
Table of Contents
The yield on tax-exempt obligations of states and political subdivisions has been adjusted to a fully taxable equivalent basis (“FTE”) by adjusting tax-exempt income upward by an amount equivalent to the prevailing federal income taxes that would have been paid if the income had been fully taxable.
Net unrealized gains on available-for-sale securities as of March 31, 2020 and December 31, 2019 totaled $61.7 million and $28.0 million, respectively. Net unrealized losses on available-for-sale securities as of December 31, 2018 totaled $24.8 million.
Loans
We consider our loans to be relatively diversified by borrower and industry. Our loans increased $100.1 million, or 1.1%, to $9.1 billion at March 31, 2020 from $9.0 billion at December 31, 2019, which was an increase of $131.0 million, or 1.5%, from $8.9 billion at December 21, 2018. The increase as of March 31, 2020 was primarily due to an increase in commercial and industrial loans of $128.9 million and an increase commercial construction loans of $19.4 million, partially offset by a decrease in other consumer loans of $32.8 million.
| • | The increase in our commercial and industrial loans from December 31, 2019 to March 31, 2020 was primarily a result of the increase in the utilization rate of commitments in our SNC portfolio. |
| • | The increase in our commercial construction loans from December 31, 2019 to March 31, 2020 was primarily a result of the increase in the utilization rate of existing construction commitments. |
| • | The decrease in other consumer loans from December 31, 2019 to March 31, 2020 was primarily a result of a decrease of $33.4 million in our automobile loans. We exited indirect automobile lending in 2018 in order to improve our liquidity position and minimize our number of lower yielding loans. |
The increase in loans receivable for the year ended December 31, 2019 was primarily due to a $324.3 million increase in commercial real estate loans and an increase in business banking loans of $30.6 million, partially offset by a decrease in other consumer loans of $149.4 million.
| • | The increase in commercial real estate loans was primarily a result of $240.0 million of organic growth in investment real estate, primarily in mixed use retail/office and retail/multi-family. |
| • | The increase in business banking loans was primarily a result of organic growth of $32.5 million in our portfolio of loans secured by investment real estate projects, partially offset by a decline of $20.0 million in the segment of our business banking loan portfolio consisting of partially automated scored loans. |
| • | The decrease in other consumer loans was primarily a result of a decrease of $172.1 million in automobile loans as a result of exiting indirect automobile lending in 2018 to improve our liquidity position and to reduce lower yielding loans, partially offset by an increase in unsecured consumer lending of $30.0 million as a result of our new, streamlined mobile loan product, which we believe provides a better interface for our customers. |
90
Table of Contents
The following table shows the composition of our loan portfolio, by category, as of the dates indicated:
Loan Portfolio Composition
| March 31, | December 31 | |||||||||||||||||||||||
| 2020 | 2019 | 2018 | 2017 | 2016 | 2015 | |||||||||||||||||||
| Amount | Amount | Amount | Amount | Amount | Amount | |||||||||||||||||||
| (In thousands) |
||||||||||||||||||||||||
| Commercial and industrial |
$ | 1,771,122 | $ | 1,642,184 | $ | 1,658,765 | $ | 1,395,597 | $ | 1,268,980 | $ | 1,125,247 | ||||||||||||
| Commercial real estate |
3,523,721 | 3,535,441 | 3,211,118 | 2,830,496 | 2,757,539 | 2,452,814 | ||||||||||||||||||
| Commercial construction |
293,135 | 273,774 | 313,209 | 400,971 | 257,207 | 299,298 | ||||||||||||||||||
| Business banking |
779,916 | 771,498 | 740,938 | 761,229 | 728,616 | 609,595 | ||||||||||||||||||
| Residential real estate |
1,420,003 | 1,428,630 | 1,430,764 | 1,290,461 | 1,153,255 | 1,036,710 | ||||||||||||||||||
| Consumer home equity |
929,554 | 933,088 | 949,410 | 931,496 | 892,241 | 850,677 | ||||||||||||||||||
| Other consumer |
369,652 | 402,431 | 551,799 | 616,791 | 647,293 | 757,127 | ||||||||||||||||||
|
|
|
|
|
|
|
|
|
|
|
|
|
|||||||||||||
| Total loans |
$ | 9,087,103 | $ | 8,987,046 | $ | 8,856,003 | $ | 8,227,041 | $ | 7,705,131 | $ | 7,131,468 | ||||||||||||
| Less: |
||||||||||||||||||||||||
| Allowance for Loan Losses |
(109,138) | (82,297) | (80,655) | (74,111) | (70,188) | (65,500) | ||||||||||||||||||
| Unamortized premiums, net of unearned discounts and deferred fees |
(6,360) | (5,565) | (435) | 1,056 | 895 | 3,098 | ||||||||||||||||||
|
|
|
|
|
|
|
|
|
|
|
|
|
|||||||||||||
| Total Loans Receivable, net |
$ | 8,971,605 | $ | 8,899,184 | $ | 8,774,913 | $ | 8,153,986 | $ | 7,635,838 | $ | 7,069,066 | ||||||||||||
|
|
|
|
|
|
|
|
|
|
|
|
|
|||||||||||||
Our commercial loan portfolio increased to $6.4 billion, or 70.1%, of total loans as of March 31, 2020, from $4.5 billion, or 63.0% of total loans as of December 31, 2015. Our commercial loan concentration has increased due to us exiting indirect auto lending (our auto portfolio was $210.5 million as of March 31, 2020, compared to $655 million as of December 31, 2015) and is consistent with our other strategic decisions to increase our focus on our commercial business. We believe that our commercial loan portfolio composition is relatively diversified in terms of industry sectors, property types and various lending specialties, and is concentrated in the New England geographical area, with 86.7% of our loans in Massachusetts and New Hampshire as of March 31, 2020.
As of March 31, 2020, concentrations in our commercial loan portfolio were as follows:
| Commercial and Industrial | ||||||||
| Balance | % | |||||||
|
(Dollars in thousands) |
||||||||
| Wholesale trade |
$ | 209,052 | 11.8 | % | ||||
| Finance and insurance |
213,204 | 12.0 | % | |||||
| Real estate and rental and leasing |
178,668 | 10.1 | % | |||||
| Administrative and support and waste management and remediation services |
160,585 | 9.1 | % | |||||
| Manufacturing |
189,042 | 10.7 | % | |||||
| Other industries |
820,571 | 46.3 | % | |||||
|
|
|
|||||||
| Total portfolio |
$ | 1,771,122 | ||||||
|
|
|
|||||||
91
Table of Contents
| Commercial Real Estate | ||||||||
| Balance | % | |||||||
|
(Dollars in thousands) |
||||||||
| Multi-family |
$ | 671,375 | 19.0 | % | ||||
| Retail |
467,911 | 13.3 | % | |||||
| Office |
435,721 | 12.4 | % | |||||
| Industrial/Warehouse |
384,671 | 10.9 | % | |||||
| Mixed use - retail/office |
328,368 | 9.3 | % | |||||
| Other risk segmentations |
1,235,675 | 35.1 | % | |||||
|
|
|
|||||||
| Total portfolio |
$ | 3,523,721 | ||||||
|
|
|
|||||||
| Commercial Construction | ||||||||
| Balance | % | |||||||
|
(Dollars in thousands) |
||||||||
| Multi-Family |
$ | 84,512 | 28.8 | % | ||||
| Affordable housing |
39,360 | 13.4 | % | |||||
| For sale housing |
29,772 | 10.2 | % | |||||
| Mixed use - retail/multi-family |
29,687 | 10.1 | % | |||||
| Office |
20,574 | 7.0 | % | |||||
| Other risk segmentations |
89,230 | 30.4 | % | |||||
|
|
|
|||||||
| Total portfolio |
$ | 293,135 | ||||||
|
|
|
|||||||
The maturity distribution of our loan portfolio is one factor in our evaluation of the risk characteristics of our loan portfolio. The following table shows the maturity distribution of our loans as of December 31, 2019:
Scheduled Contractual Loan Maturity
| One Year or Less |
One to Five Years |
After Five Years |
||||||||||
| (In thousands) | ||||||||||||
| Commercial and industrial |
$ | 370,619 | $ | 829,690 | $ | 441,875 | ||||||
| Commercial real estate |
195,213 | 1,015,518 | 2,324,711 | |||||||||
| Commercial construction |
50,110 | 106,296 | 117,368 | |||||||||
| Business banking |
87,770 | 253,550 | 430,179 | |||||||||
| Residential real estate |
656 | 5,171 | 1,422,802 | |||||||||
| Consumer home equity |
2,572 | 21,413 | 909,103 | |||||||||
| Other consumer |
30,441 | 287,121 | 84,868 | |||||||||
|
|
|
|
|
|
|
|||||||
| Total loans |
$ | 737,381 | $ | 2,518,759 | $ | 5,730,906 | ||||||
|
|
|
|
|
|
|
|||||||
92
Table of Contents
The interest rate risk to our loan portfolio is an important element in the management of net interest margin. We attempt to manage the relationship between the interest rate sensitivity of our assets and liabilities to produce an effective interest differential that is not significantly impacted by changes in the level of interest rates. The following table shows the interest rate risk of our loans, net of allowance for credit losses and unamortized premiums, due one year after December 31, 2019:
Loan Interest Rate Risk
| Due After December 31, 2020 | ||||||||||||
| Fixed | Adjustable | Total | ||||||||||
| (In thousands) | ||||||||||||
| Commercial and industrial |
$ | 388,622 | $ | 882,943 | $ | 1,271,565 | ||||||
| Commercial real estate |
654,310 | 2,686,063 | 3,340,373 | |||||||||
| Commercial construction |
51,392 | 172,146 | 223,538 | |||||||||
| Business banking |
194,736 | 488,992 | 683,728 | |||||||||
| Residential real estate |
890,682 | 537,293 | 1,427,975 | |||||||||
| Consumer home equity |
247,477 | 683,039 | 930,516 | |||||||||
| Other consumer |
365,838 | 6,152 | 371,990 | |||||||||
|
|
|
|
|
|
|
|||||||
| Total loans |
$ | 2,793,057 | $ | 5,456,628 | $ | 8,249,685 | ||||||
|
|
|
|
|
|
|
|||||||
Asset quality. We continually monitor the asset quality of our loan portfolio utilizing portfolio scorecards and various credit quality indicators. Based on this process, loans meeting certain criteria are categorized as delinquent, impaired, or nonperforming and further assessed to determine if nonaccrual status is appropriate.
For the commercial portfolio, which includes our commercial and industrial, commercial real estate and commercial construction loans, a 12-point commercial risk-rating system is utilized, which assigns a risk-grade to each borrower based on a number of quantitative and qualitative factors associated with a commercial loan transaction. Key factors include industry and market conditions, position within the industry, earnings trends, operating cash flow, asset/liability values, debt capacity, guarantor strength, management and controls, financial reporting, collateral and other considerations. The risk rating categories are as follows: unrated (0), pass (1-6W), special mention (7), substandard (8), doubtful (9) and loss (10). Refer to Note 4 to the consolidated financial statements appearing elsewhere in this prospectus for further details on our risk rating methodologies.
Over the past five years, the asset quality of our commercial loan portfolio remained strong. Special mention, substandard and doubtful loans totaled 8.8% and 2.6% of total commercial loans outstanding at March 31, 2020 and December 31, 2019, respectively. This increase was driven by an increase in the special mention category, due to the downgrading of our hotel and restaurant loan portfolios as a result of the Covid-19 pandemic.
Our philosophy toward managing our loan portfolios is predicated upon careful monitoring, which stresses early detection and response to delinquent and default situations. We seek to make arrangements to resolve any delinquent or default situation over the shortest possible time frame.
The delinquency rate of our total loan portfolio increased to 0.54% at March 31, 2020 from 0.50% at December 31, 2019, primarily due to an increase in delinquencies in our (i) business banking, (ii) commercial construction, (iii) other consumer and (iv) consumer home equity portfolios, partially offset by decrease in our (i) commercial and industrial and (ii) commercial real estate categories.
93
Table of Contents
The following table provides details regarding the age analysis of past due loans as of the dates indicated:
Age Analysis of Past Due Loans
| As of March 31, | As of December 31, | |||||||||||||||||||||||||||||||||||
| 2020 | 2019 | 2018 | ||||||||||||||||||||||||||||||||||
| 30-59 Days Past Due |
60-89 Days Past Due |
90 Days or More Past Due |
30-59 Days Past Due |
60-89 Days Past Due |
90 Days or More Past Due |
30-59 Days Past Due |
60-89 Days Past Due |
90 Days or More Past Due |
||||||||||||||||||||||||||||
| (In thousands) | ||||||||||||||||||||||||||||||||||||
| Commercial and industrial |
$ | 1,178 | $ | 522 | $ | 392 | $ | 1,407 | $ | — | $ | 963 | $ | 296 | $ | 526 | $ | 2,326 | ||||||||||||||||||
| Commercial real estate |
497 | 1,264 | 1,558 | 1,290 | 100 | 1,856 | 2,547 | — | 2,069 | |||||||||||||||||||||||||||
| Commercial construction |
1,886 | — | — | — | — | — | — | — | — | |||||||||||||||||||||||||||
| Business banking |
6,759 | 1,514 | 5,482 | 3,031 | 763 | 6,095 | 3,328 | 885 | 5,114 | |||||||||||||||||||||||||||
| Residential real estate |
12,747 | 3,692 | 2,848 | 14,030 | 2,563 | 3,030 | 16,003 | 3,493 | 3,109 | |||||||||||||||||||||||||||
| Consumer home equity |
3,148 | 710 | 1,492 | 2,497 | 430 | 1,636 | 3,449 | 811 | 2,392 | |||||||||||||||||||||||||||
| Other Consumer |
3,775 | 546 | 676 | 3,451 | 514 | 579 | 3,435 | 460 | 437 | |||||||||||||||||||||||||||
|
|
|
|
|
|
|
|
|
|
|
|
|
|
|
|
|
|
|
|||||||||||||||||||
| Total |
$ | 29,990 | $ | 8,248 | $ | 12,448 | $ | 25,706 | $ | 4,370 | $ | 14,159 | $ | 29,058 | $ | 6,175 | $ | 15,447 | ||||||||||||||||||
|
|
|
|
|
|
|
|
|
|
|
|
|
|
|
|
|
|
|
|||||||||||||||||||
As a general rule, loans more than 90 days past due with respect to principal or interest are classified as nonaccrual loans. However, based on our assessment of collateral and/or payment prospects, certain loans that are more than 90 days past due may be kept on an accruing status. Income accruals are suspended on all nonaccrual loans and all previously accrued and uncollected interest is reversed against current income. A loan is expected to remain on nonaccrual status until it becomes current with respect to principal and interest, the loan is liquidated, or the loan is determined to be uncollectible and is charged-off against the allowance for loan losses.
Nonperforming assets (“NPAs”) are comprised of nonperforming loans (“NPLs”), other real estate owned (“OREO”) and nonperforming securities. NPLs consist of nonaccrual loans and loans that are more than 90 days past due but still accruing interest. OREO consists of real estate properties, which primarily serve as collateral to secure our loans, that we control due to foreclosure. These properties are recorded at the lower of cost or fair value less estimated costs to sell on the date we obtain control.
94
Table of Contents
The following table sets forth information regarding NPAs held as of the dates indicated:
Nonperforming Assets
| As of March 31, | As of December 31, | |||||||||||||||||||||||
| 2020 | 2019 | 2018 | 2017 | 2016 | 2015 | |||||||||||||||||||
| (Dollars in thousands) | ||||||||||||||||||||||||
| Non-accrual loans: |
||||||||||||||||||||||||
| Commercial |
$ | 38,054 | $ | 34,093 | $ | 17,599 | $ | 10,273 | $ | 13,056 | $ | 8,016 | ||||||||||||
| Residential |
5,594 | 5,598 | 5,535 | 6,680 | 6,512 | 5,666 | ||||||||||||||||||
| Consumer |
4,085 | 2,760 | 3,038 | 1,212 | 722 | 789 | ||||||||||||||||||
|
|
|
|
|
|
|
|
|
|
|
|
|
|||||||||||||
| Total non-accrual loans |
47,733 | 42,451 | 26,172 | 18,165 | 20,290 | 14,471 | ||||||||||||||||||
|
|
|
|
|
|
|
|
|
|
|
|
|
|||||||||||||
| Accruing loans past due 90 days or more: |
||||||||||||||||||||||||
| Commercial |
1,345 | 1,315 | 410 | 471 | 1,978 | 2,258 | ||||||||||||||||||
| Residential |
— | — | — | 510 | 132 | |||||||||||||||||||
| Consumer |
9 | 9 | 9 | 9 | 9 | 43 | ||||||||||||||||||
|
|
|
|
|
|
|
|
|
|
|
|
|
|||||||||||||
| Total accruing loans past due 90 days or more |
1,354 | 1,324 | 419 | 480 | 2,497 | 2,433 | ||||||||||||||||||
|
|
|
|
|
|
|
|
|
|
|
|
|
|||||||||||||
| Total non-performing loans |
49,087 | 43,775 | 26,591 | 18,645 | 22,787 | 16,904 | ||||||||||||||||||
| Total other real estate owned |
40 | — | 35 | 35 | 653 | 772 | ||||||||||||||||||
|
|
|
|
|
|
|
|
|
|
|
|
|
|||||||||||||
| Other non-performing assets |
— | — | — | — | 13,834 | 13,853 | ||||||||||||||||||
|
|
|
|
|
|
|
|
|
|
|
|
|
|||||||||||||
| Total non-performing assets |
$ | 49,127 | $ | 43,775 | $ | 26,626 | $ | 18,680 | $ | 37,274 | $ | 31,529 | ||||||||||||
|
|
|
|
|
|
|
|
|
|
|
|
|
|||||||||||||
| Total accruing troubled debt restructured loans |
$ | 41,880 | $ | 48,623 | $ | 41,465 | $ | 46,448 | $ | 43,687 | $ | 40,491 | ||||||||||||
| Total non-performing loans to total loans |
0.54 | % | 0.49 | % | 0.30 | % | 0.23 | % | 0.30 | % | 0.24 | % | ||||||||||||
| Total non-performing assets to total assets |
0.40 | % | 0.38 | % | 0.23 | % | 0.17 | % | 0.38 | % | 0.33 | % | ||||||||||||
NPLs increased $5.3 million, or 12.1%, to $49.1 million at March 31, 2020 from $43.8 million at December 31, 2019, which was an increase of $17.2 million, or 64.7%, from $26.6 million at December 31, 2018. NPLs as a percentage of total loans increased to 0.5% at March 31, 2020 and December 31, 2019 from 0.3% at December 31, 2018 as a result of an increase in NPLs in our commercial and industrial loan category, driven largely by a participation, through our ABL portfolio, in a SNC Program portfolio that had a balance of $16.3 million as of March 31, 2020.
Non-accrual loans increased $5.2 million, or 12.2%, to $47.7 million at March 31, 2020 from $42.5 million at December 31, 2019, which was an increase of $16.3 million, or 62.2%, from $26.2 million at December 31, 2018, primarily due to a SNC Program portfolio participation discussed above.
The total amount of interest recorded on NPLs was $0.1 million for the three months ended March 31, 2020. The gross interest income that would have been recorded under the original terms of those loans if they had been performing amounted to $0.9 million for the three months ended March 31, 2020.
The total amount of interest recorded on NPLs was $1.0 million for the year ended December 31, 2019. The gross interest income that would have been recorded under the original terms of those loans if they had been performing amounted to $3.1 million for the year ended December 31, 2019.
In the course of resolving NPLs, we may choose to restructure the contractual terms of certain loans. We attempt to work-out alternative payment schedules with the borrowers in order to avoid foreclosure actions. We review any loans that are modified to identify whether a troubled debt restructuring (“TDR”) has occurred. TDRs involve situations in which, for economic or legal reasons related to the borrower’s financial difficulties, we grant a concession to the borrower that it would not otherwise consider.
All TDR loans are considered impaired and therefore are subject to a specific review for impairment loss. The impairment analysis discounts the present value of the anticipated cash flows by the loan’s contractual rate of interest in effect prior to the loan’s modification or the fair value of collateral if the loan is collateral dependent. The amount of
95
Table of Contents
impairment loss, if any, is recorded as a specific reserve to each individual loan in the allowance for loan losses. Commercial loans (commercial and industrial, commercial real estate, commercial construction, and business banking) and residential loans that have been classified as TDRs and which subsequently default are reviewed to determine if the loan should be deemed collateral dependent.
TDR loans modified during the three months ended March 31, 2020 were $0.7 million (post modification balance). Total TDR of $5.9 million were considered subsequently defaulted at March 31, 2020. The increase in TDR loans was driven by $0.4 million in consumer home equity loans and $0.2 million in other consumer loans.
TDR loans modified during the year ended December 31, 2019 and 2018 were $30.8 million (post modification balance) and $10.2 million, respectively. Total TDRs of $21.9 million and $0.3 million were considered subsequently defaulted at December 31, 2019 and 2018, respectively. The increase in TDR loans was mostly in our commercial portfolio ($12.4 million in commercial and industrial, $3.3 million in commercial real estate and $3.2 million in business banking).
It is our policy to have any restructured loans, which are on nonaccrual status prior to being modified, remain on nonaccrual status for approximately six months subsequent to being modified before we consider its return to accrual status. If the restructured loan is on accrual status prior to being modified, we review it to determine if the modified loan should remain on accrual status.
Purchase credit impaired (“PCI”) loans are loans we acquired that have shown evidence of deterioration of credit quality since origination and, therefore, it was deemed unlikely that all contractually required payments would be collected upon the acquisition date. We consider factors such as payment history, collateral values and accrual status when determining whether there was evidence of deterioration at the acquisition date. The carrying value and prospective income recognition of PCI loans are predicated on future cash flows expected to be collected. As of March 31, 2020 and December 31, 2019 and 2018, the carrying amount of PCI loans was $12.8 million, $13.5 million and $16.9 million, respectively.
The following table provides additional details related to our loan portfolio and the distribution of NPLs as of the dates indicated:
Distribution of Nonperforming Loans
| As of March 31, 2020 | ||||||||||||||||||||||||
| Outstanding | 90+ Days Due Still Accruing |
Non-accruing Loans |
Troubled Debt Restructured Loans, but Accruing |
NPLs | NPLs as a % of Outstanding |
|||||||||||||||||||
| (Dollars in thousands) | ||||||||||||||||||||||||
| Loans: |
||||||||||||||||||||||||
| Commercial |
$ | 6,367,894 | $ | 1,345 | $ | 38,054 | $ | 12,681 | $ | 39,399 | 0.62 | % | ||||||||||||
| Residential |
1,420,003 | — | 5,594 | 24,897 | 5,594 | 0.39 | % | |||||||||||||||||
| Consumer |
1,299,206 | 9 | 4,085 | 4,302 | 4,094 | 0.32 | % | |||||||||||||||||
|
|
|
|
|
|
|
|
|
|
|
|
|
|||||||||||||
| Total |
$ | 9,087,103 | $ | 1,354 | $ | 47,733 | $ | 41,880 | $ | 49,087 | 0.54 | % | ||||||||||||
|
|
|
|
|
|
|
|
|
|
|
|
|
|||||||||||||
| As of December 31, 2019 | ||||||||||||||||||||||||
| Outstanding | 90+ Days Due still Accruing |
Non-accruing Loans |
Troubled Debt Restructured Loans, but accruing |
NPLs | NPLs as a % of Outstanding |
|||||||||||||||||||
| (Dollars in thousands) | ||||||||||||||||||||||||
| Loans: |
||||||||||||||||||||||||
| Commercial |
$ | 6,222,897 | $ | 1,315 | $ | 34,093 | $ | 17,575 | $ | 35,408 | 0.57 | % | ||||||||||||
| Residential |
1,428,630 | — | 5,598 | 25,093 | 5,598 | 0.39 | % | |||||||||||||||||
| Consumer |
1,335,519 | 9 | 2,760 | 5,955 | 2,769 | 0.21 | % | |||||||||||||||||
|
|
|
|
|
|
|
|
|
|
|
|
|
|||||||||||||
| Total |
$ | 8,987,046 | $ | 1,324 | $ | 42,451 | $ | 48,623 | $ | 43,775 | 0.49 | % | ||||||||||||
|
|
|
|
|
|
|
|
|
|
|
|
|
|||||||||||||
In the normal course of business, we become aware of possible credit problems in which borrowers exhibit potential for the inability to comply with the contractual terms of their loans, but which currently do not yet meet the criteria for
96
Table of Contents
classification as NPLs. In response to the Covid-19 pandemic, we reviewed all of our credit exposures in industries that were expected to experience significant problems due to the pandemic and resulting economic contraction. As part of that review, we downgraded our hotel loans, restaurant loans and other loans that we expected to have associated challenges in the current economic environment. These loans were neither delinquent nor on non-accrual status. At March 31, 2020 and December 31, 2019, our potential problem loans (including these Covid-19-related loans), or loans with potential weaknesses that were not included in the non-accrual loans or in the loans 90 days or more past due categories, totaled $551.7 million and $157.3 million, respectively.
Allowance for loan losses. For the purpose of estimating the allowance for loan losses, we segregate the loan portfolio into the homogenous loan pools that possess unique risk characteristics such as loan purpose, repayment source, and collateral that are considered when determining the appropriate level of the allowance for loan losses for each category.
While we use available information to recognize losses on loans, future additions or subtractions to/from the allowance for loan losses may be necessary based on changes in NPLs, changes in economic conditions, or other reasons. Additionally, various regulatory agencies, as an integral part of our examination process, periodically assess the adequacy of the allowance for loan losses to assess whether the allowance for loan losses was determined in accordance with GAAP and applicable guidance.
We perform an evaluation of our allowance for loan losses on a regular basis (at least quarterly), and establish the allowance for loan losses based upon an evaluation of our loan categories, as each possess unique risk characteristics that are considered when determining the appropriate level of allowance for loan losses, including:
| • | estimated future loss in all impaired loans in each category; |
| • | known increases in concentrations within each category; |
| • | certain higher risk classes of loans, or pledged collateral; |
| • | historical loan loss experience within each category; |
| • | results of any independent review and evaluation of the category’s credit quality; |
| • | trends in volume, maturity and composition of each category; |
| • | volume and trends in delinquencies and non-accruals; |
| • | national and local economic conditions and downturns in specific local industries; |
| • | corporate goals and objectives; |
| • | expertise of our lending staff; |
| • | lending policy and practices; and |
| • | current and forecasted banking industry conditions, as well as regulatory environment. |
Loans are periodically evaluated using changes in asset quality, historical losses, and other loss allocation factors, which form our basis for estimating incurred losses. For risk rated loans, our risk-rating system takes into consideration a number of quantitative and qualitative factors, such as the borrower’s financial capacity, cash flow, liquidity, leverage, adequacy of collateral, tangible net worth, management team, industry, sales and supplier concentration, credit history, additional support and the impact of outside factors on repayment ability. Homogenous populations of loans, which are not risk rated loans, are analyzed by loan category, taking into account delinquency ratios and historical loss experience.
The allowance for loan losses is allocated to loan categories using both a formula-based approach and an analysis of certain individual loans for impairment. We use a methodology to systematically estimate the amount of credit loss incurred in the loan portfolio. Under our current methodology, the allowance for loan losses contains specific, general and other components.
The specific component consists of reserves for impaired loans (defined as those where we determine it is probable we will not collect all payments when due, typically classified as either doubtful or substandard). All commercial, residential and consumer loan portfolios are periodically reviewed to identify the loans with deteriorating performance. The reports used to identify those loans include, but are not limited to, delinquency reports, risk rating migration (for risk rated loans), asset
97
Table of Contents
quality reports, watch loan list and other credit risk management reports. When a loan is determined to be impaired, the measurement will be based on the present value of expected future cash flows, except for collateral-dependent loans, where the impairment is based on the fair value of the collateral.
The general loss reserves methodology, which is applied to categories of loans with similar characteristics, covers all non-impaired loans and is based on our portfolio’s segment historical loss experience adjusted for qualitative factors. The general loss reserve methodology considers multiple qualitative factors that may impact the loss experience during the incurred loss horizon period, including internal infrastructure factors, external macroeconomic factors, internal credit quality factors and external industry data, tailored to the specific loan category.
Refer to Note 4 to the consolidated financial statements appearing elsewhere in this prospectus for further details on our risk rating methodology.
The allowance for loan losses increased by $26.8 million, or 32.6%, to $109.1 million, or 1.20% of total loans, at March 31, 2020 from $82.3 million, or 0.92% of total loans at December 31, 2019. The increase in the allowance for loan losses was primarily a result of our response to the Covid-19-related economic impact. During the three months ended, March 31, 2020, we downgraded our risk ratings for all loans secured by hotels and restaurants, and any of our other commercial loans for which our customers are expecting to face financial difficulties due to the current economic environment. The lower risk ratings require higher levels of reserves for the allowance. In total, we downgraded the risk rating on $1.6 billion of loans. This, along with other factors, resulted in a provision for loan loss of $28.6 million for the three months ended March 31, 2020.
The allowance for loan losses increased by $1.6 million, or 2.0%, to $82.3 million, or 0.92% of total loans, at December 31, 2019 from $80.7 million, or 0.91% of total loans, at December 31, 2018. The ratio of allowance for loan losses to NPLs increased from 188% at December 31, 2019 to 222% at March 31, 2020 due to an increase in reserves driven by the impact of current economic environment on risk rating mix of the commercial portfolio, with highest level of downgrades in hospitality and restaurant industries. The ratio of allowance for loan losses to NPLs has decreased from 303% at December 31, 2018 to 188% at December 31, 2019 due to previously mentioned increase in NPL, driven by one large credit.
98
Table of Contents
The following table summarizes changes in the allowance for loan losses and other selected statistics for the periods presented:
Summary of Changes in the Allowance for Loan Losses
| As of March 31, | As of December 31, | |||||||||||||||||||||||||||
| 2020 | 2019 | 2019 | 2018 | 2017 | 2016 | 2015 | ||||||||||||||||||||||
| (Dollars in thousands) |
||||||||||||||||||||||||||||
| Average total loans |
$ | 9,016,223 | $ | 8,874,285 | $ | 8,948,947 | $ | 8,566,149 | $ | 7,968,358 | $ | 7,397,564 | $ | 6,950,760 | ||||||||||||||
|
|
|
|
|
|
|
|
|
|
|
|
|
|
|
|||||||||||||||
| Allowance for loan losses, beginning of period |
$ | 82,297 | $ | 80,655 | $ | 80,655 | $ | 74,111 | $ | 70,188 | $ | 65,500 | $ | 64,083 | ||||||||||||||
| Charged-off loans: |
||||||||||||||||||||||||||||
| Commercial and industrial |
— | — | 1,123 | 3,646 | 1,104 | 1,859 | 75 | |||||||||||||||||||||
| Commercial real estate |
— | — | — | 49 | — | 368 | — | |||||||||||||||||||||
| Commercial construction |
— | — | — | — | — | — | — | |||||||||||||||||||||
| Business banking |
1,337 | 1,439 | 5,974 | 6,345 | 5,414 | 1,547 | 1,489 | |||||||||||||||||||||
| Residential real estate |
— | 17 | 66 | 27 | 207 | 206 | 939 | |||||||||||||||||||||
| Consumer home equity |
473 | — | 205 | 285 | 21 | 202 | 250 | |||||||||||||||||||||
| Other consumer |
533 | 468 | 2,131 | 2,109 | 2,234 | 1,709 | 1,986 | |||||||||||||||||||||
|
|
|
|
|
|
|
|
|
|
|
|
|
|
|
|||||||||||||||
| Total charged-off loans |
2,343 | 1,924 | 9,499 | 12,461 | 8,980 | 5,891 | 4,739 | |||||||||||||||||||||
|
|
|
|
|
|
|
|
|
|
|
|
|
|
|
|||||||||||||||
| Recoveries on loans previously charged-off |
||||||||||||||||||||||||||||
| Commercial and industrial |
322 | 460 | 3,748 | 2,753 | 5,593 | 1,470 | 514 | |||||||||||||||||||||
| Commercial real estate |
1 | 2 | 12 | 132 | 147 | — | 4,058 | |||||||||||||||||||||
| Commercial construction |
— | — | — | — | 21 | — | 444 | |||||||||||||||||||||
| Business banking |
127 | 127 | 604 | 375 | 614 | 244 | 275 | |||||||||||||||||||||
| Residential real estate |
60 | 59 | 105 | 152 | 164 | 274 | 395 | |||||||||||||||||||||
| Consumer home equity |
14 | 8 | 52 | 61 | 37 | 104 | 97 | |||||||||||||||||||||
| Other consumer |
60 | 106 | 320 | 432 | 527 | 587 | 698 | |||||||||||||||||||||
|
|
|
|
|
|
|
|
|
|
|
|
|
|
|
|||||||||||||||
| Total recoveries |
584 | 762 | 4,841 | 3,905 | 7,103 | 2,679 | 6,481 | |||||||||||||||||||||
|
|
|
|
|
|
|
|
|
|
|
|
|
|
|
|||||||||||||||
| Net loans charged-off (recoveries) |
||||||||||||||||||||||||||||
| Commercial and industrial |
(322 | ) | (460 | ) | (2,625 | ) | 893 | (4,489 | ) | 389 | (439 | ) | ||||||||||||||||
| Commercial real estate |
(1 | ) | (2 | ) | (12 | ) | (83 | ) | (147 | ) | 368 | (4,058 | ) | |||||||||||||||
| Commercial construction |
— | — | — | — | (21 | ) | — | (444 | ) | |||||||||||||||||||
| Business banking |
1,210 | 1,312 | 5,370 | 5,970 | 4,800 | 1,303 | 1,214 | |||||||||||||||||||||
| Residential real estate |
(60 | ) | (42 | ) | (39 | ) | (125 | ) | 43 | (68 | ) | 544 | ||||||||||||||||
| Consumer home equity |
459 | (8 | ) | 153 | 224 | (16 | ) | 98 | 153 | |||||||||||||||||||
| Other consumer |
473 | 362 | 1,811 | 1,677 | 1,707 | 1,122 | 1,288 | |||||||||||||||||||||
|
|
|
|
|
|
|
|
|
|
|
|
|
|
|
|||||||||||||||
| Total net loans charged-off |
1,759 | 1,162 | 4,658 | 8,556 | 1,877 | 3,212 | (1,742 | ) | ||||||||||||||||||||
|
|
|
|
|
|
|
|
|
|
|
|
|
|
|
|||||||||||||||
| Provision for loan losses |
28,600 | 3,000 | 6,300 | 15,100 | 5,800 | 7,900 | (325 | ) | ||||||||||||||||||||
|
|
|
|
|
|
|
|
|
|
|
|
|
|
|
|||||||||||||||
| Total allowance for loan losses, end of period |
$ | 109,138 | $ | 82,493 | $ | 82,297 | $ | 80,655 | $ | 74,111 | $ | 70,188 | $ | 65,500 | ||||||||||||||
|
|
|
|
|
|
|
|
|
|
|
|
|
|
|
|||||||||||||||
| Net charge-offs to average total loans outstanding during this period |
0.02 | % | 0.01 | % | 0.05 | % | 0.10 | % | 0.02 | % | 0.04 | % | (0.03 | )% | ||||||||||||||
| Allowance for loan losses as a percent of total loans |
1.20 | % | 0.92 | % | 0.92 | % | 0.91 | % | 0.90 | % | 0.91 | % | 0.92 | % | ||||||||||||||
| Allowance for loan losses as a percent of nonperforming loans |
222.34 | % | 295.85 | % | 188.00 | % | 303.32 | % | 397.48 | % | 308.02 | % | 387.48 | % | ||||||||||||||
99
Table of Contents
The following table sets forth the allocation of the allowance for loan losses by loan categories listed in Loan portfolio composition as of the dates indicated:
Summary of Allocation of Allowance for Loan Losses
| As of March 31, | As of December 31, | |||||||||||||||||||||||
| 2020 | 2019 | |||||||||||||||||||||||
| Allowance for Loan Losses |
Percent of Allowance in Category to Total Allocated Allowance |
Percent of Loans in Category to Total Loans |
Allowance for Loan Losses |
Percent of Allowance in Category to Total Allocated Allowance |
Percent of Loans in Category to Total Loans |
|||||||||||||||||||
| (Dollars in thousands) |
||||||||||||||||||||||||
| Commercial and industrial |
$ | 30,531 | 27.97 | % | 19.49 | % | $ | 20,919 | 25.42 | % | 18.27 | % | ||||||||||||
| Commercial real estate |
49,227 | 45.10 | % | 38.78 | % | 34,730 | 42.20 | % | 39.34 | % | ||||||||||||||
| Commercial construction |
4,712 | 4.32 | % | 3.23 | % | 3,424 | 4.16 | % | 3.05 | % | ||||||||||||||
| Business banking |
10,181 | 9.33 | % | 8.58 | % | 8,260 | 10.04 | % | 8.58 | % | ||||||||||||||
| Residential real estate |
6,228 | 5.71 | % | 15.63 | % | 6,380 | 7.75 | % | 15.90 | % | ||||||||||||||
| Consumer home equity |
3,913 | 3.59 | % | 10.23 | % | 4,027 | 4.89 | % | 10.38 | % | ||||||||||||||
| Other consumer |
4,019 | 3.68 | % | 4.07 | % | 4,173 | 5.07 | % | 4.48 | % | ||||||||||||||
| Unallocated |
327 | 0.30 | % | — | % | 384 | 0.47 | % | — | % | ||||||||||||||
|
|
|
|
|
|
|
|
|
|
|
|
|
|||||||||||||
| Total |
$ | 109,138 | 100.00 | % | 100.00 | % | $ | 82,297 | 100.00 | % | 100.00 | % | ||||||||||||
|
|
|
|
|
|
|
|
|
|
|
|
|
|||||||||||||
| As of December 31, | ||||||||||||||||||||||||
| 2018 | 2017 | |||||||||||||||||||||||
| Allowance for Loan Losses |
Percent of Allowance in Category to Total Allocated Allowance |
Percent of Loans in Category to Total Loans |
Allowance for Loan Losses |
Percent of Allowance in Category to Total Allocated Allowance |
Percent of Loans in Category to Total Loans |
|||||||||||||||||||
| (Dollars in thousands) |
||||||||||||||||||||||||
| Commercial and industrial |
$ | 19,321 | 23.96 | % | 18.73 | % | $ | 14,892 | 20.09 | % | 16.96 | % | ||||||||||||
| Commercial real estate |
32,400 | 40.17 | % | 36.26 | % | 30,807 | 41.57 | % | 34.40 | % | ||||||||||||||
| Commercial construction |
4,606 | 5.71 | % | 3.53 | % | 5,588 | 7.54 | % | 4.87 | % | ||||||||||||||
| Business banking |
$ | 8,167 | 10.13 | % | 8.37 | % | 6,497 | 8.77 | % | 9.25 | % | |||||||||||||
| Residential real estate |
7,059 | 8.75 | % | 16.16 | % | 6,954 | 9.38 | % | 15.69 | % | ||||||||||||||
| Consumer home equity |
4,113 | 5.10 | % | 10.72 | % | 4,040 | 5.45 | % | 11.32 | % | ||||||||||||||
| Other consumer |
4,600 | 5.70 | % | 6.23 | % | 4,751 | 6.41 | % | 7.50 | % | ||||||||||||||
| Other |
389 | 0.48 | % | — | % | 582 | 0.79 | % | — | % | ||||||||||||||
|
|
|
|
|
|
|
|
|
|
|
|
|
|||||||||||||
| Total |
$ | 80,655 | 100.00 | % | 100.00 | % | $ | 74,111 | 100.00 | % | 100.00 | % | ||||||||||||
|
|
|
|
|
|
|
|
|
|
|
|
|
|||||||||||||
| As of December 31, | ||||||||||||||||||||||||
| 2016 | 2015 | |||||||||||||||||||||||
| Allowance for Loan Losses |
Percent of Allowance in Category to Total Allocated Allowance |
Percent of Loans in Category to Total Loans |
Allowance for Loan Losses |
Percent of Allowance in Category to Total Allocated Allowance |
Percent of Loans in Category to Total Loans |
|||||||||||||||||||
| (Dollars in thousands) |
||||||||||||||||||||||||
| Commercial and Industrial |
$ | 13,419 | 19.12 | % | 16.47 | % | $ | 12,634 | 19.29 | % | 15.78 | % | ||||||||||||
| Commercial Real Estate |
30,551 | 43.53 | % | 35.79 | % | 27,714 | 42.31 | % | 34.39 | % | ||||||||||||||
| Commercial Construction |
3,051 | 4.35 | % | 3.34 | % | 3,216 | 4.91 | % | 4.20 | % | ||||||||||||||
| Business Banking |
6,368 | 9.07 | % | 9.46 | % | 5,686 | 8.68 | % | 8.55 | % | ||||||||||||||
| Residential Real Estate |
7,555 | 10.77 | % | 14.97 | % | 6,731 | 10.27 | % | 14.54 | % | ||||||||||||||
| Home Equity |
4,037 | 5.75 | % | 11.58 | % | 3,846 | 5.87 | % | 11.93 | % | ||||||||||||||
| Other consumer |
4,788 | 6.82 | % | 8.40 | % | 5,085 | 7.76 | % | 10.62 | % | ||||||||||||||
| Other |
419 | 0.60 | % | — | % | 588 | 0.90 | % | — | % | ||||||||||||||
|
|
|
|
|
|
|
|
|
|
|
|
|
|||||||||||||
| Total |
$ | 70,188 | 100.00 | % | 100.00 | % | $ | 65,500 | 100.00 | % | 100.00 | % | ||||||||||||
|
|
|
|
|
|
|
|
|
|
|
|
|
|||||||||||||
100
Table of Contents
To determine if a loan should be charged-off, all possible sources of repayment are analyzed. Possible sources of repayment include the potential for future cash flows, liquidation of the collateral and the strength of co-makers or guarantors. When available information confirms that specific loans or portions thereof are uncollectible, these amounts are promptly charged-off against the allowance for loan losses and any recoveries of such previously charged-off amounts are credited to the allowance for loan losses.
Regardless of whether a loan is unsecured or collateralized, we charge off the amount of any confirmed loan loss in the period when the loans, or portions of loans, are deemed uncollectible. For troubled, collateral-dependent loans, loss-confirming events may include an appraisal or other valuation that reflects a shortfall between the value of the collateral and the carrying value of the loan or receivable, or a deficiency balance following the sale of the collateral.
For additional information regarding our allowance for loan losses, see Note 4 to the consolidated financial statements appearing elsewhere in this prospectus.
Federal Home Loan Bank stock
The FHLBB is a cooperative that provides services to its member banking institutions. The primary reason for our membership in the FHLBB is to gain access to a reliable source of wholesale funding and as a tool to manage interest rate risk. The purchase of stock in the FHLB is a requirement for a member to gain access to funding. We purchase and/or are subject to redemption of FHLBB stock proportional to the volume of funding received and view the holdings as a necessary long-term investment for the purpose of balance sheet liquidity and not for investment return.
We held an investment in the FHLBB of $8.8 million, $9.0 million and $18.0 million at March 31, 2020 and December 31, 2019 and 2018, respectively. The decrease in 2019 compared to 2018 was as a result of the redemption of stock due to lower levels of FHLBB advances in 2019.
Goodwill and other intangible assets
Goodwill and other intangible assets were $377.0 million, $377.7 million and $381.3 million at March 31, 2020, December 31, 2019 and 2018, respectively. The decrease in goodwill and other intangibles assets was due to the amortization of definite-lived intangibles during the three months ended March 31, 2020 and the year ended December 31, 2019.
Deposits and other interest-bearing liabilities
Deposits originating within the markets we serve continue to be our primary source of funding our earning assets. We have been able to compete effectively for deposits in our primary market areas. The distribution and market share of deposits by type of deposit and by type of depositor are important considerations in our assessment of the stability of our fund sources and our access to additional funds. Furthermore, we shift the mix and maturity of the deposits depending on economic conditions and loan and investment policies in an attempt, within set policies, to minimize cost and maximize net interest margin. We do not, and in recent years have not, obtained deposit funding through brokered deposits.
The following table presents our deposits as of the dates presented:
Components of Deposits
| As of March 31, | As of December 31, | |||||||||||||||||||||||||||
| 2020 | 2019 | 2018 | 2017 | |||||||||||||||||||||||||
| Amount | % Change | Amount | % Change | Amount | % Change | Amount | ||||||||||||||||||||||
| (Dollars in thousands) |
||||||||||||||||||||||||||||
| Demand |
$ | 3,646,052 | 3.66 | % | $ | 3,517,447 | 2.11 | % | $ | 3,444,804 | (0.46) | % | $ | 3,460,597 | ||||||||||||||
| Interest checking |
2,318,609 | 27.79 | % | 1,814,327 | (4.48) | % | 1,899,336 | 8.36 | % | 1,752,837 | ||||||||||||||||||
| Savings |
1,002,709 | 3.25 | % | 971,119 | (2.85) | % | 999,649 | (3.28) | % | 1,033,520 | ||||||||||||||||||
| Money market investments |
3,016,932 | 3.34 | % | 2,919,360 | 13.12 | % | 2,580,756 | 17.71 | % | 2,192,504 | ||||||||||||||||||
| Certificate of deposits |
324,709 | (1.35) | % | 329,139 | (30.70) | % | 474,948 | 26.32 | % | 375,994 | ||||||||||||||||||
|
|
|
|
|
|
|
|
|
|||||||||||||||||||||
| Total deposits |
$ | 10,309,011 | 7.93 | % | $ | 9,551,392 | 1.62 | % | $ | 9,399,493 | 6.63 | % | $ | 8,815,452 | ||||||||||||||
|
|
|
|
|
|
|
|
|
|||||||||||||||||||||
101
Table of Contents
Deposits increased by $757.6 million, or 7.9%, to $10.3 billion at March 31, 2020 from $9.6 billion at December 31, 2019. This increase was primarily the result of an increase in interest checking deposits of $504.3 million and an increase of $128.6 million in demand deposits. During the three months ended March 31, 2020, we experienced strong deposit flows from customers, transferred $253.3 million of a product for our Financial Institutions customers from borrowings to deposits and repurchased an additional $235.5 million of reciprocal deposits from the Promontory Interfinancial Network. Deposits increased $151.9 million, or 1.6%, to $9.6 billion at December 31, 2019 from $9.4 billion at December 31, 2018. The increase in deposits at December 31, 2019 was primarily a result of the increase in money market investments of $338.6 million and the increase in demand deposits of $72.6 million, partially offset by a $145.8 million decrease in certificates of deposit, a $85.0 million decrease in interest checking and a $28.5 million decrease in savings deposits.
The following table presents the classification of deposits on an average basis. We believe the presentation of average deposits provides a better understanding of the business mix and low cost structure of our deposit portfolio than the composition of deposits as of the respective year ends below, due to the overnight program of the Federal Reserve Bank of Boston described above.
Classification of Deposits on an Average Basis
| As of March 31, | As of December 31, | |||||||||||||||||||||||||||||||
| 2020 | 2019 | 2018 | 2017 | |||||||||||||||||||||||||||||
| Average Amount |
Average Rate |
Average Amount |
Average Rate |
Average Amount |
Average Rate |
Average Amount |
Average Rate |
|||||||||||||||||||||||||
| (Dollars in thousands) |
||||||||||||||||||||||||||||||||
| Demand |
$ | 3,477,377 | 0.00 | % | $ | 3,369,375 | 0.00 | % | $ | 3,416,422 | 0.00 | % | $ | 3,421,257 | 0.00 | % | ||||||||||||||||
| Interest checking |
1,902,128 | 0.17 | % | 1,842,993 | 0.21 | % | 1,821,854 | 0.18 | % | 1,602,995 | 0.06 | % | ||||||||||||||||||||
| Savings |
976,881 | 0.02 | % | 991,244 | 0.02 | % | 1,048,289 | 0.02 | % | 1,021,419 | 0.02 | % | ||||||||||||||||||||
| Money market investments |
2,981,427 | 0.53 | % | 2,769,934 | 0.69 | % | 2,422,531 | 0.41 | % | 2,261,096 | 0.09 | % | ||||||||||||||||||||
| Certificate of deposits |
327,144 | 0.78 | % | 392,035 | 1.02 | % | 452,885 | 0.85 | % | 377,276 | 0.25 | % | ||||||||||||||||||||
|
|
|
|
|
|
|
|
|
|||||||||||||||||||||||||
| Total deposits |
$ | 9,664,957 | 0.23 | % | $ | 9,365,581 | 0.29 | % | $ | 9,161,981 | 0.19 | % | $ | 8,684,043 | 0.05 | % | ||||||||||||||||
|
|
|
|
|
|
|
|
|
|||||||||||||||||||||||||
Other time deposits of $100,000 and greater, including certificates of deposits of $100,000 and greater, as of the dates indicated had maturities as follows:
Maturities of Time Certificates of Deposits $100,000 and Over
| As of March 31, 2020 |
As of December 31, 2019 |
|||||||
| Maturing in |
Amount | Amount | ||||||
| (In thousands) | ||||||||
| Three months or less |
$ | 69,864 | $ | 58,958 | ||||
| Over three months through six months |
43,850 | 43,008 | ||||||
| Over six months through 12 months |
29,134 | 44,643 | ||||||
| Over 12 months |
12,751 | 11,029 | ||||||
|
|
|
|
|
|||||
| Total |
$ | 155,599 | $ | 157,638 | ||||
|
|
|
|
|
|||||
Borrowings
Our borrowings consist of both short-term and long-term borrowings and provide us with one of our sources of funding. Maintaining available borrowing capacity provides us with a contingent source of liquidity.
Our total borrowings decreased by $369.7 million, or 92.2%, to $31.4 million at March 31, 2020 from $401.1 million at March 31, 2019. The decrease was primarily due to a reduction of federal funds purchased of $171.2 million and a reduction in FHLBB advances of $195.6 million. The reduction in our federal funds purchased was a result of the transfer of a product for our Financial Institution customers from borrowings to deposits. Our total borrowings decreased by $98.9 million, or
102
Table of Contents
29.6%, to $235.4 million at December 31, 2019 from $334.3 million at December 31, 2018. The decrease was primarily due to a reduction in FHLBB advances of $118.3 million, partially offset by an increase of $32.3 million in federal funds purchased during 2019.
The following table sets forth information concerning balances on our borrowings as of the dates and for the periods indicated:
Borrowings by Category
| As of March 31, | As of December 31, | |||||||||||||||||||||||
| 2020 | 2019 | % Change | 2019 | 2018 | % Change | |||||||||||||||||||
| (Dollars in thousands) |
||||||||||||||||||||||||
| Federal funds purchased |
$ | — | $ | 171,152 | (100.0 | )% | $ | 201,082 | $ | 168,776 | 19.1 | % | ||||||||||||
| Federal Home Loan Bank advances |
15,070 | 210,654 | (92.8 | )% | 18,964 | 137,286 | (86.2 | )% | ||||||||||||||||
| Escrow deposits of borrowers |
16,357 | 15,876 | 3.0 | % | 15,349 | 14,875 | 3.2 | % | ||||||||||||||||
| Interest rate swap collateral funds |
— | 3,420 | (100.0 | )% | — | 13,350 | (100.0 | )% | ||||||||||||||||
|
|
|
|
|
|
|
|
|
|
|
|
|
|||||||||||||
| Total |
$ | 31,427 | $ | 401,102 | (92.2 | )% | $ | 235,395 | $ | 334,287 | (29.6 | )% | ||||||||||||
|
|
|
|
|
|
|
|
|
|
|
|
|
|||||||||||||
Interest rate swap collateral funds decreased in the year ended December 31, 2019 as our financial institution counterparties were not required to post collateral to us for our over-the-counter interest rate swaps, due to the low level of market interest rates during the year ended December 31, 2019. Refer to Note 8 to the consolidated financial statements appearing elsewhere in this prospectus for further details on our borrowings.
Results of Operations
Summary of Results of Operations
| Three months Ended March 31, | Year ended December 31, | |||||||||||||||||||||||||||||||
| Change | Change | |||||||||||||||||||||||||||||||
| 2020 | 2019 | Amount ($) | Percentage (%) | 2019 | 2018 | Amount ($) | Percentage (%) | |||||||||||||||||||||||||
| (Dollars in thousands) |
||||||||||||||||||||||||||||||||
| Interest and dividend income |
$ | 106,159 | $ | 111,483 | $ | (5,324 | ) | (4.8 | )% | $ | 445,017 | $ | 415,166 | $ | 29,851 | 7.2 | % | |||||||||||||||
| Interest expense |
6,013 | 8,811 | (2,798 | ) | (31.8 | )% | 33,753 | 25,122 | 8,631 | 34.4 | % | |||||||||||||||||||||
| Net interest income |
100,146 | 102,672 | (2,526 | ) | (2.5 | )% | 411,264 | 390,044 | 21,220 | 5.4 | % | |||||||||||||||||||||
| Provision for loan losses |
28,600 | 3,000 | 25,600 | 853.3 | % | 6,300 | 15,100 | (8,800 | ) | (58.3 | )% | |||||||||||||||||||||
| Noninterest income |
33,369 | 47,800 | (14,431 | ) | (30.2 | )% | 182,299 | 180,595 | 1,704 | 0.9 | % | |||||||||||||||||||||
| Noninterest expense |
95,172 | 104,829 | (9,657 | ) | (9.2 | )% | 412,684 | 397,928 | 14,756 | 3.7 | % | |||||||||||||||||||||
| Income taxes |
1,298 | 9,678 | (8,380 | ) | (86.6 | )% | 39,481 | 34,884 | 4,597 | 13.2 | % | |||||||||||||||||||||
| Net income |
8,445 | 32,965 | (24,520 | ) | (74.4 | )% | 135,098 | 122,727 | 12,371 | 10.1 | % | |||||||||||||||||||||
Comparison of the three months ended March 31, 2020 and 2019
Interest and Dividend Income
Interest and dividend income decreased by $5.3 million, or 4.8%, to $106.2 million during the three months ended March 31, 2020 from $111.5 million during the three months ended March 31, 2019. This decrease was a result of lower interest income on our loans as the yield on average interest-earning assets decreased 37 basis points during the three months ended March 31, 2020. Our average interest-earning assets increased by $327.9 million, or 3.1%, to $10.8 billion as of March 31, 2020 compared to $10.4 billion as of March 31, 2019. Our yields on loans and securities are generally presented on an FTE basis where the embedded tax benefit on loans or securities are calculated and added to the yield. This presentation allows for better comparability between institutions with different tax structures.
| • | Interest income on loans decreased by $5.1 million, or 5.1%, to $95.5 million during the three months ended March 31, 2020 from $100.6 million during the three months ended March 31, 2019. The decrease in interest income on our loans |
103
Table of Contents
| was primarily due to the decrease in the yield on average loans. The decrease in the average yield on our loans was primarily due to the downward adjustment of the interest rates on our existing adjustable-rate loans as a result of the lowering interest rate environment, whereas the average balance of loans increased due to continued efforts to expand our loan portfolio. The FTE yield on average loans decreased 32 basis points to 4.3% during the three months ended March 31, 2020. The average balance of our loans increased by $141.9 million, or 1.6%, to $9.0 billion as of March 31, 2020 compared to $8.9 billion as of March 31, 2019. |
| • | Interest income on securities decreased $0.3 million, or 2.8%, to $10.6 million for the three months ended March 31, 2020 compared to $10.9 million for the three months ended March 31, 2019. The decrease in interest income on securities was due to lower overall market rates. The FTE yield on average securities decreased 25 basis points to 3.0% during the first quarter ended March 31, 2019. The average balance of securities and other interest earning assets increased by $186.0 million, or 11.6%, to $1.7 billion as of March 31, 2020 compared to $1.6 billion as of March 31, 2019. |
Interest Expense
Interest expense decreased $2.8 million, or 31.8%, to $6.0 million during the three months ended March 31, 2020 from $8.8 million on March 31, 2019. The decrease in our interest expense was a result of decreased rates paid on deposits. The overall rates paid on average interest-bearing liabilities decreased 19 basis points to 0.4% during the three months ended March 31, 2020. Average interest-bearing liabilities remained flat at $6.4 billion as of three months ended March 31, 2020 compared to $6.3 billion as of March 31, 2019.
| • | Interest expense on our interest-bearing deposits decreased by $1.1 million, or 17.0%, to $5.4 million during the three months ended March 31, 2020 from $6.5 million during the three months ended March 31, 2019. The decrease in our interest expense on interest-bearing deposits was due to a decrease in the cost of deposits. The average balance of deposits increased due to our increasing core deposits to help fund loan growth, whereas the average cost of deposits decreased due to the interest rate decreases occurring in the three months ended March 31, 2020. The average cost of our interest-bearing deposits decreased 10 basis points to 0.4% during the three months ended March 31, 2020. The average balance of our interest-bearing deposits increased by $255.5 million, or 4.3%, to $6.2 billion as of March 31, 2020 compared to $5.9 billion as of March 31, 2019. |
| • | Interest expense on borrowed funds decreased by $1.7 million, or 73.9%, to $0.6 million during the three months ended March 31, 2020 from $2.3 million during the three months ended March 31, 2019. The decrease in interest expense on borrowed funds was primarily due to the average balance of the Federal Home Loan Bank advances decreasing by $163.3 million to $17.5 million during the three months ended March 31, 2020 compared to $180.8 million during the three months ended March 31, 2019. The average balance of borrowed funds decreased by $205.7 million, or 55.7%, to $163.5 million as of March 31, 2020 compared to $369.2 million as of March 31, 2019. |
Net Interest Income
Net interest income decreased by $2.6 million, or 2.5%, to $100.1 million during the three months ended March 31, 2020 from $102.7 million during the three months ended March 31, 2019. The decrease in net interest income was primarily a result of the decrease in interest and dividend income partially offset by the decrease in interest expense.
Net interest margin is determined by dividing FTE net interest income by average-earning assets. For purposes of the following discussion, income from tax-exempt loans and investment securities has been adjusted to an FTE basis, using a marginal tax rate of 21.8% for the three months ended March 31, 2020 and 21.8% for the three months ended March 31, 2019. Net interest margin decreased 25 basis points to 3.80% during the three months ended March 31, 2020.
Comparison of the years ended December 31, 2019 and 2018
Interest and Dividend Income
Interest and dividend income increased by $29.9 million, or 7.2%, to $445.0 million during the year ended December 31, 2019 from $415.2 million during the year ended December 31, 2018. This increase was a result of an increase in interest income on our loans as the yield on average interest-earning assets increased 19 basis points during the year ended December 31, 2019. Our average interest-earning assets increased by $231.4 million, or 2.2%, to $10.5 billion as of
104
Table of Contents
December 31, 2019 compared to $10.3 billion as of December 31, 2018. Our yields on loans and securities are generally presented on an FTE basis where the embedded tax benefit on loans or securities are calculated and added to the yield. This presentation allows for better comparability between institutions with different tax structures.
| • | Interest income on loans increased by $33.0 million, or 8.9%, to $402.1 million during the year ended December 31, 2019 from $369.1 million during the year ended December 31, 2018. The increase in interest income on loans was primarily due to the increase in the yield on average loans and the average balance of loans. The increase in the average yield on loans was primarily due to the upward adjustment of the interest rates on our existing adjustable-rate loans as a result of the rising interest rate environment, whereas the average balance of loans increased due to continued efforts to expand our loan portfolio. The FTE yield on average loans increased 18 basis points to 4.5% during the year ended December 31, 2019. The average balance of loans increased by $382.8 million, or 4.5%, to $8.9 billion as of December 31, 2019 compared to $8.6 billion as of December 31, 2018. |
| • | Interest income on securities decreased $3.1 million, or 6.7%, to $42.9 million during the year ended December 31, 2019 from $46.0 million during the year ended December 31, 2018. The decrease in interest income on securities was due to a decrease in the average balance of securities, which was slightly offset by an increase in the yield on average securities. The increase in the yield on average securities resulted from increased market rates of interest on short-term investments. The FTE yield on average securities increased 4 basis points to 3.0% during the year ended December 31, 2019. The average balance of securities and other interest earning assets decreased by $151.4 million, or 8.7%, to $1.6 billion as of December 31, 2019 compared to $1.7 billion as of December 31, 2018. |
Interest Expense
Interest expense increased $8.6 million, or 34.4%, to $33.8 million during the year ended December 31, 2019 from $25.1 million December 31, 2018. The increase in interest expense was a result of the increased average balance and rates paid on deposits. The overall rates paid on average interest-bearing liabilities increased 13 basis points to 0.5% during the year ended December 31, 2019. Average interest-bearing liabilities increased by $131.7 million, or 2.1%, to $6.3 billion as of December 31, 2019 compared to $6.2 billion as of December 31, 2018.
| • | Interest expense on interest-bearing deposits increased by $9.9 million, or 57.0%, to $27.3 million during the year ended December 31, 2019 from $17.4 million during the year ended December 31, 2018. The increase in interest expense on interest-bearing deposits was due to an increase in the average balance and cost of deposits. The average balance of deposits increased due to our increasing core deposits to help fund loan growth, whereas the average cost of deposits increased due to the higher levels of competition from other financial service providers operating in our market. The average cost of interest-bearing deposits increased 16 basis points to 0.5% during the year ended December 31, 2019. The average balance of interest-bearing deposits increased by $250.6 million, or 4.4%, to $6.0 billion as of December 31, 2019 compared to $5.7 billion as of December 31, 2018. |
| • | Interest expense on borrowed funds decreased by $1.3 million, or 16.6%, to $6.5 million during the year ended December 31, 2019 from $7.7 million during the year ended December 31, 2018. The decrease in interest expense on borrowed funds was primarily due to the average balance of the Federal Home Loan Bank advances decreasing by $117.5 million to a balance of $94.2 million during the year ended December 31, 2019 compared to $211.7 million during the year ended December 31, 2018. This amount was partially offset by the average cost of Federal Home Loan Bank advances increasing 72 basis points to 2.6% during the year ended December 31, 2019. The average balance of borrowed funds decreased by $118.9 million, or 29.0%, to $291.4 million as of December 31, 2019 compared to $410.3 million as of December 31, 2018. |
Net Interest Income
Net interest income increased by $21.2 million, or 5.4%, to $411.3 million during the year ended December 31, 2019 from $390.0 million during the year ended December 31, 2018. The increase in net interest income was primarily a result of the increase in interest and dividend income partially offset by the increase in interest expense.
Net interest margin is determined by dividing FTE net interest income by average-earning assets. For purposes of the following discussion, income from tax-exempt loans and investment securities has been adjusted to an FTE basis, using a marginal tax rate of 21.8% for the year ended December 31, 2019 and 21.7% for the year ended December 31, 2018. Net interest margin increased 12 basis points to 3.96% during the year ended December 31, 2019.
105
Table of Contents
The following tables set forth average balance sheet items, annualized average yields and costs, and certain other information for the periods indicated. Interest income on tax-exempt loans and investment securities has been adjusted to an FTE basis using a marginal tax rate of 21.8% and 21.8% for the three months ended March 31, 2020 and 2019, respectively, and 21.8%, 21.7%, and 35.3% for the years ended December 31, 2019, 2018 and 2017, respectively. All average balances are daily average balances. Non-accrual loans were included in the computation of average balances but have been reflected in the table as loans carrying a zero yield. The yields set forth below include the effect of deferred fees, discounts and premiums that are amortized or accreted to interest income or expense.
Average Balances, Interest Earned/Paid & Average Yields
| Three Months Ended March 31, | ||||||||||||||||||||||||
| 2020 | 2019 | |||||||||||||||||||||||
| Average Outstanding Balance |
Interest | Average Yield/ Cost (7) |
Average Outstanding Balance |
Interest | Average Yield/ Cost (7) |
|||||||||||||||||||
| (Dollars in thousands) | ||||||||||||||||||||||||
| Interest-earning assets: |
||||||||||||||||||||||||
| Loans (1) |
||||||||||||||||||||||||
| Residential |
$ | 1,429,994 | $ | 13,303 | 3.74 | % | $ | 1,432,364 | $ | 13,422 | 3.80 | % | ||||||||||||
| Commercial (2) |
6,275,057 | 69,615 | 4.46 | % | 5,966,791 | 72,419 | 4.92 | % | ||||||||||||||||
| Consumer |
1,311,172 | 13,407 | 4.11 | % | 1,475,130 | 15,357 | 4.22 | % | ||||||||||||||||
|
|
|
|
|
|
|
|
|
|
|
|
|
|||||||||||||
| Total loans |
9,016,223 | 96,325 | 4.30 | % | 8,874,285 | 101,198 | 4.62 | % | ||||||||||||||||
| Investment securities (2) |
1,500,413 | 10,685 | 2.86 | % | 1,492,616 | 11,312 | 3.07 | % | ||||||||||||||||
| Federal funds sold and other short-term investments |
240,440 | 517 | 0.86 | % | 62,319 | 353 | 2.30 | % | ||||||||||||||||
|
|
|
|
|
|
|
|
|
|
|
|
|
|||||||||||||
| Total interest-earning assets |
10,757,076 | 107,527 | 4.02 | % | 10,429,220 | 112,863 | 4.39 | % | ||||||||||||||||
|
|
|
|
|
|||||||||||||||||||||
| Non-interest-earning assets |
1,022,216 | 860,592 | ||||||||||||||||||||||
|
|
|
|
|
|||||||||||||||||||||
| Total assets |
$ | 11,779,292 | $ | 11,289,812 | ||||||||||||||||||||
|
|
|
|
|
|||||||||||||||||||||
| Interest-bearing liabilities: |
||||||||||||||||||||||||
| Deposits: |
||||||||||||||||||||||||
| Savings account |
$ | 976,881 | $ | 54 | 0.02 | % | $ | 1,014,321 | $ | 53 | 0.02 | % | ||||||||||||
| Interest checking account (3) |
1,902,128 | 819 | 0.17 | % | 1,858,361 | 898 | 0.20 | % | ||||||||||||||||
| Money market investment (3) |
2,981,427 | 3,904 | 0.53 | % | 2,598,682 | 4,290 | 0.67 | % | ||||||||||||||||
| Time account |
327,144 | 638 | 0.78 | % | 460,744 | 1,279 | 1.13 | % | ||||||||||||||||
|
|
|
|
|
|
|
|
|
|
|
|
|
|||||||||||||
| Total interest-bearing deposits |
6,187,580 | 5,415 | 0.35 | % | 5,932,108 | 6,520 | 0.45 | % | ||||||||||||||||
| Borrowings |
163,463 | 599 | 1.47 | % | 369,186 | 2,292 | 2.52 | % | ||||||||||||||||
|
|
|
|
|
|
|
|
|
|
|
|
|
|||||||||||||
| Total interest-bearing liabilities |
6,351,043 | 6,014 | 0.38 | % | 6,301,294 | 8,812 | 0.57 | % | ||||||||||||||||
| Demand accounts (3) |
3,477,377 | 3,335,453 | ||||||||||||||||||||||
| Other noninterest-bearing liabilities |
318,656 | 195,362 | ||||||||||||||||||||||
|
|
|
|
|
|||||||||||||||||||||
| Total liabilities |
10,147,076 | 9,832,109 | ||||||||||||||||||||||
| Total net worth |
1,632,216 | 1,457,703 | ||||||||||||||||||||||
|
|
|
|
|
|||||||||||||||||||||
| Total liabilities and retained earnings |
$ | 11,779,292 | $ | 11,289,812 | ||||||||||||||||||||
|
|
|
|
|
|||||||||||||||||||||
| Net interest income - FTE |
$ | 101,513 | $ | 104,051 | ||||||||||||||||||||
|
|
|
|
|
|||||||||||||||||||||
| Net interest rate spread (4) |
3.64 | % | 3.82 | % | ||||||||||||||||||||
|
|
|
|
|
|||||||||||||||||||||
| Net interest-earning assets (5) |
$ | 4,406,033 | $ | 4,127,926 | ||||||||||||||||||||
|
|
|
|
|
|||||||||||||||||||||
| Net interest margin - FTE (6) |
3.80 | % | 4.05 | % | ||||||||||||||||||||
|
|
|
|
|
|||||||||||||||||||||
| Average interest-earning assets to interest-bearing liabilities |
169.37 | % | 165.51 | % | ||||||||||||||||||||
| (1) | Non-accrual loans are included in loans. |
| (2) | FTE adjustments to commercial loan and investment security income were $0.8 and $0.6 million, respectively. |
| (3) | Balances shown for interest checking accounts, money market investments, and demand accounts do not reflect the impacts of certain sweep programs designed to manage reserve requirements at the Federal Reserve Bank of Boston. |
| (4) | Net interest rate spread represents the difference between the weighted average yield on interest-earning assets and the weighted average cost of interest-bearing liabilities. |
| (5) | Net interest-earning assets represent total interest-earning assets less total interest-bearing liabilities. |
| (6) | Net interest margin represents net interest income divided by average total interest-earning assets. |
| (7) | Rates have been annualized. |
106
Table of Contents
| Year Ended December 31, | ||||||||||||||||||||||||||||||||||||
| 2019 | 2018 | 2017 | ||||||||||||||||||||||||||||||||||
| Average Outstanding Balance |
Interest | Average Yield / Cost (5) |
Average Outstanding Balance |
Interest | Average Yield / Cost (5) |
Average Outstanding Balance |
Interest | Average Yield / Cost (5) |
||||||||||||||||||||||||||||
| (Dollars in thousands) | ||||||||||||||||||||||||||||||||||||
| Interest-earning assets: |
||||||||||||||||||||||||||||||||||||
| Loans (1) |
||||||||||||||||||||||||||||||||||||
| Residential |
$ | 1,439,845 | $ | 53,736 | 3.73 | % | $ | 1,358,387 | $ | 49,840 | 3.67 | % | $ | 1,221,924 | $ | 43,968 | 3.60 | % | ||||||||||||||||||
| Commercial |
6,089,410 | 291,055 | 4.78 | % | 5,653,675 | 262,234 | 4.64 | % | 5,203,327 | 213,078 | 4.10 | % | ||||||||||||||||||||||||
| Consumer |
1,419,692 | 60,009 | 4.23 | % | 1,554,087 | 59,669 | 3.84 | % | 1,543,107 | 52,629 | 3.41 | % | ||||||||||||||||||||||||
|
|
|
|
|
|
|
|
|
|
|
|
|
|||||||||||||||||||||||||
| Total loans |
8,948,947 | 404,800 | 4.52 | % | 8,566,149 | 371,743 | 4.34 | % | 7,968,358 | 309,675 | 3.89 | % | ||||||||||||||||||||||||
| Investment securities |
1,435,719 | 42,494 | 2.96 | % | 1,539,901 | 45,707 | 2.97 | % | 1,353,286 | 43,538 | 3.22 | % | ||||||||||||||||||||||||
| Federal funds sold and other short-term investments |
144,856 | 2,977 | 2.06 | % | 192,112 | 3,412 | 1.78 | % | 244,900 | 2,800 | 1.14 | % | ||||||||||||||||||||||||
|
|
|
|
|
|
|
|
|
|
|
|
|
|||||||||||||||||||||||||
| Total interest-earning assets |
10,529,522 | 450,271 | 4.28 | % | 10,298,162 | 420,862 | 4.09 | % | 9,566,544 | 356,013 | 3.72 | % | ||||||||||||||||||||||||
|
|
|
|
|
|
|
|||||||||||||||||||||||||||||||
| Non-interest-earning assets |
874,588 | 839,208 | 825,252 | |||||||||||||||||||||||||||||||||
|
|
|
|
|
|
|
|||||||||||||||||||||||||||||||
| Total assets |
$ | 11,404,110 | $ | 11,137,370 | $ | 10,391,796 | ||||||||||||||||||||||||||||||
|
|
|
|
|
|
|
|||||||||||||||||||||||||||||||
| Interest-bearing liabilities: |
||||||||||||||||||||||||||||||||||||
| Deposits: |
||||||||||||||||||||||||||||||||||||
| Interest checking |
$ | 1,842,993 | $ | 3,947 | 0.21 | % | $ | 1,821,854 | $ | 3,325 | 0.18 | % | $ | 1,602,995 | $ | 1,011 | 0.06 | % | ||||||||||||||||||
| Savings |
991,244 | 210 | 0.02 | % | 1,048,289 | 229 | 0.02 | % | 1,021,419 | 240 | 0.02 | % | ||||||||||||||||||||||||
| Money market investments |
2,769,934 | 19,150 | 0.69 | % | 2,422,531 | 9,988 | 0.41 | % | 2,261,096 | 2,023 | 0.09 | % | ||||||||||||||||||||||||
| Certificate of deposits |
392,035 | 3,994 | 1.02 | % | 452,885 | 3,843 | 0.85 | % | 377,276 | 962 | 0.25 | % | ||||||||||||||||||||||||
|
|
|
|
|
|
|
|
|
|
|
|
|
|
|
|
|
|||||||||||||||||||||
| Total interest-bearing deposits |
5,996,206 | 27,301 | 0.46 | % | 5,745,559 | 17,385 | 0.30 | % | 5,262,786 | 4,236 | 0.08 | % | ||||||||||||||||||||||||
| Borrowings |
291,413 | 6,452 | 2.21 | % | 410,312 | 7,737 | 1.89 | % | 204,294 | 2,656 | 1.30 | % | ||||||||||||||||||||||||
|
|
|
|
|
|
|
|
|
|
|
|
|
|
|
|
|
|||||||||||||||||||||
| Total interest-bearing liabilities |
6,287,619 | 33,753 | 0.54 | % | 6,155,871 | 25,122 | 0.41 | % | 5,467,080 | 6,892 | 0.13 | % | ||||||||||||||||||||||||
| Non-interest-bearing liabilities |
3,573,300 | 3,620,937 | 3,615,296 | |||||||||||||||||||||||||||||||||
|
|
|
|
|
|
|
|||||||||||||||||||||||||||||||
| Total liabilities |
9,860,919 | 9,776,808 | 9,082,376 | |||||||||||||||||||||||||||||||||
| Total net worth |
1,543,191 | 1,360,562 | 1,309,420 | |||||||||||||||||||||||||||||||||
|
|
|
|
|
|
|
|||||||||||||||||||||||||||||||
| Total liabilities and net worth |
$ | 11,404,110 | $ | 11,137,370 | $ | 10,391,796 | ||||||||||||||||||||||||||||||
|
|
|
|
|
|
|
|||||||||||||||||||||||||||||||
| Net interest income - FTE |
$ | 416,518 | $ | 395,740 | $ | 349,121 | ||||||||||||||||||||||||||||||
|
|
|
|
|
|
|
|||||||||||||||||||||||||||||||
| Net interest rate spread (2) |
3.74 | % | 3.68 | % | 3.59 | % | ||||||||||||||||||||||||||||||
|
|
|
|
|
|
|
|||||||||||||||||||||||||||||||
| Net interest-earning assets (3) |
$ | 4,241,903 | $ | 4,142,291 | $ | 4,099,464 | ||||||||||||||||||||||||||||||
|
|
|
|
|
|
|
|||||||||||||||||||||||||||||||
| Net interest margin - FTE (4) |
3.96 | % | 3.84 | % | 3.65 | % | ||||||||||||||||||||||||||||||
|
|
|
|
|
|
|
|||||||||||||||||||||||||||||||
| Average interest-earning assets to interest-bearing liabilities |
167.46 | % | 167.29 | % | 174.98 | % | ||||||||||||||||||||||||||||||
| (1) | Non-accrual loans are included in loans. |
| (2) | Net interest rate spread represents the difference between the weighted average yield on interest-earning assets and the weighted average cost of interest-bearing liabilities. |
| (3) | Net interest-earning assets represent total interest-earning assets less total interest-bearing liabilities. |
| (4) | Net interest margin represents net interest income divided by average total interest-earning assets. |
| (5) | Rates have been annualized. |
The following table presents, on a tax equivalent basis, the effects of changing rates and volumes on our net interest income for the periods indicated. The rate column shows the effects attributable to changes in rate (changes in rate multiplied by prior volume). The volume column shows the effects attributable to changes in volume (changes in volume multiplied by
107
Table of Contents
prior rate). The total column represents the sum of the prior columns. For purposes of this table, changes attributable to both rate and volume, which cannot be segregated, have been allocated proportionately based on the changes due to rate and the changes due to volume.
Rate Volume Analysis
| Three Months Ended March 31, 2020 vs. 2019 |
Year Ended December 31 2019 vs. 2018 |
Year Ended December 31 2018 vs. 2017 |
||||||||||||||||||||||||||||||||||
| Increase (Decrease) Due to |
Total Increase (Decrease) |
Increase (Decrease) Due to |
Total Increase (Decrease) |
Increase (Decrease) Due to |
Total Increase (Decrease) |
|||||||||||||||||||||||||||||||
| Rate | Volume | Rate | Volume | Rate | Volume | |||||||||||||||||||||||||||||||
| (Dollars in thousands) | ||||||||||||||||||||||||||||||||||||
| Interest-earning assets: |
||||||||||||||||||||||||||||||||||||
| Loans: |
||||||||||||||||||||||||||||||||||||
| Residential |
$ | (107 | ) | $ | (12 | ) | $ | (119 | ) | $ | 835 | $ | 3,061 | $ | 3,896 | $ | 871 | $ | 5,001 | $ | 5,872 | |||||||||||||||
| Commercial |
(21,354 | ) | 18,550 | (2,804 | ) | 8,109 | 20,712 | 28,821 | 29,663 | 19,493 | 49,156 | |||||||||||||||||||||||||
| Consumer |
(369 | ) | (1,581 | ) | (1,950 | ) | 5,758 | (5,418 | ) | 340 | 6,664 | 376 | 7,040 | |||||||||||||||||||||||
|
|
|
|
|
|
|
|
|
|
|
|
|
|
|
|
|
|
|
|||||||||||||||||||
| Total loans |
(21,830 | ) | 16,957 | (4,873 | ) | 14,702 | 18,355 | 33,057 | 37,198 | 24,870 | 62,068 | |||||||||||||||||||||||||
| Investment securities |
(1,027 | ) | 400 | (627 | ) | (152 | ) | (3,061 | ) | (3,213 | ) | (3,548 | ) | 5,717 | 2,169 | |||||||||||||||||||||
| Federal funds sold and other short-term investments |
(1,436 | ) | 1,600 | 164 | 487 | (922 | ) | (435 | ) | 1,312 | (700 | ) | 612 | |||||||||||||||||||||||
|
|
|
|
|
|
|
|
|
|
|
|
|
|
|
|
|
|
|
|||||||||||||||||||
| Total interest-earning assets |
(24,293 | ) | 18,957 | (5,336 | ) | 15,037 | 14,372 | 29,409 | 34,962 | 29,887 | 64,849 | |||||||||||||||||||||||||
|
|
|
|
|
|
|
|
|
|
|
|
|
|
|
|
|
|
|
|||||||||||||||||||
| Interest-bearing liabilities: |
||||||||||||||||||||||||||||||||||||
| Deposits: |
||||||||||||||||||||||||||||||||||||
| Savings |
10 | (9 | ) | 1 | — | (18 | ) | (18 | ) | — | (12 | ) | (12 | ) | ||||||||||||||||||||||
| Interest checking |
(208 | ) | 129 | (79 | ) | 582 | 40 | 622 | 2,166 | 148 | 2,314 | |||||||||||||||||||||||||
| Money market investments |
(3,260 | ) | 2,874 | (386 | ) | 7,572 | 1,590 | 9,162 | 7,808 | 157 | 7,965 | |||||||||||||||||||||||||
| Certificates of deposit |
(328 | ) | (313 | ) | (641 | ) | 709 | (558 | ) | 151 | 2,659 | 222 | 2,881 | |||||||||||||||||||||||
|
|
|
|
|
|
|
|
|
|
|
|
|
|
|
|
|
|
|
|||||||||||||||||||
| Total interest-bearing deposits |
(3,786 | ) | 2,681 | (1,105 | ) | 8,863 | 1,054 | 9,917 | 12,633 | 515 | 13,148 | |||||||||||||||||||||||||
| Borrowings |
(722 | ) | (971 | ) | (1,693 | ) | 1,184 | (2,469 | ) | (1,285 | ) | 1,577 | 3,504 | 5,081 | ||||||||||||||||||||||
|
|
|
|
|
|
|
|
|
|
|
|
|
|
|
|
|
|
|
|||||||||||||||||||
| Total interest-bearing liabilities |
(4,508 | ) | 1,710 | (2,798 | ) | 10,047 | (1,415 | ) | 8,632 | 14,210 | 4,019 | 18,229 | ||||||||||||||||||||||||
|
|
|
|
|
|
|
|
|
|
|
|
|
|
|
|
|
|
|
|||||||||||||||||||
| Change in net interest income |
$ | (19,785 | ) | $ | 17,247 | $ | (2,538 | ) | $ | 4,990 | $ | 15,787 | $ | 20,777 | $ | 20,752 | $ | 25,868 | $ | 46,620 | ||||||||||||||||
|
|
|
|
|
|
|
|
|
|
|
|
|
|
|
|
|
|
|
|||||||||||||||||||
Provision for Loan Losses
The provision for loan losses represents the charge to expense that is required to maintain an appropriate level of allowance for loan losses. The provision for loan losses increased by $25.6 million, or 853.3%, to $28.6 million for the three-months ended March 31, 2020 compared to $3.0 million for the three months ended March 31, 2019. The increase in the provision was due to the change in loan risk ratings to reflect the impact of the increased concerns about customers that are expecting to face financial difficulties due to the current economic environment. The provision for loan losses decreased by $8.8 million, or 58.3%, to $6.3 million for the year ended December 31, 2019 compared to $15.1 million for the year ended December 31, 2018. The decrease in the provision was primarily due to our assessment of the loss inherent in our loan portfolio, the slowing of loan growth for the year ended December 31, 2019 compared to the year ended December 31, 2018, the decrease in net charge-offs, partially offset by an increase in the level of NPAs. Our allowance for loan losses was $82.3 million, or 0.9% of loans outstanding, as of December 31, 2019, as compared to $80.7 million, or 0.9% of loans outstanding, at December 31, 2018. Net charge-offs for the years ended December 31, 2019 and 2018 totaled $4.7 million and $8.6 million, respectively. NPAs increased to $43.8 million, or 0.4%, of total assets, as of December 31, 2019, as compared to $26.6 million, or 0.2%, of total assets, as of December 31, 2018.
Our periodic evaluation of the appropriate allowance for loan losses considers the risk characteristics of the loan portfolio, current economic conditions, and trends in loan delinquencies and charge-offs.
108
Table of Contents
Noninterest Income
The following table sets forth information regarding noninterest income for the periods shown:
Noninterest Income
| Three Months Ended March 31, | Year Ended December 31 | |||||||||||||||||||||||||||||||
| Change | Change | |||||||||||||||||||||||||||||||
| 2020 | 2019 | Amount | % | 2019 | 2018 | Amount | % | |||||||||||||||||||||||||
| (Dollars in thousands) | ||||||||||||||||||||||||||||||||
| Noninterest Income: |
||||||||||||||||||||||||||||||||
| Insurance commissions |
$ | 27,477 | $ | 24,762 | 2,715 | 11.0 | % | $ | 90,587 | $ | 91,885 | $ | (1,298) | (1.4) | % | |||||||||||||||||
| Service charges on deposit accounts |
6,098 | 6,404 | (306) | (4.8) | % | 27,043 | 26,897 | 146 | 0.5 | % | ||||||||||||||||||||||
| Trust and investment advisory fees |
5,095 | 4,628 | 467 | 10.1 | % | 19,653 | 19,128 | 525 | 2.7 | % | ||||||||||||||||||||||
| Debit card processing fees |
2,470 | 2,410 | 60 | 2.5 | % | 10,452 | 16,162 | (5,710) | (35.3) | % | ||||||||||||||||||||||
| Interest rate swap (loss) income |
(6,009) | 340 | (6,349) | (1,867.4) | % | 4,362 | 5,012 | (650) | (13.0) | % | ||||||||||||||||||||||
| (Loss) income from investments held in rabbi trusts |
(6,743) | 4,147 | (10,890) | 262.6 | % | 9,866 | (1,542) | 11,408 | 739.8 | % | ||||||||||||||||||||||
| Trading securities (losses) gains, net |
(2) | 1,142 | (1,144) | (100.2) | % | 1,297 | 2,156 | (859) | (39.8) | % | ||||||||||||||||||||||
| Net gain on sales of mortgage loans held for sale |
93 | 50 | 43 | 86.0 | % | 795 | 397 | 398 | 100.3 | % | ||||||||||||||||||||||
| Gains on sales of securities available for sale, net |
122 | 50 | 72 | 144.0 | % | 2,016 | 50 | 1,966 | 3,932.0 | % | ||||||||||||||||||||||
| Other |
4,768 | 3,867 | 901 | 23.3 | % | 16,228 | 20,450 | (4,222) | (20.6) | % | ||||||||||||||||||||||
|
|
|
|
|
|
|
|
|
|
|
|
|
|||||||||||||||||||||
| Total noninterest income |
$ | 33,369 | $ | 47,800 | $ | (14,431) | (30.2) | % | $ | 182,299 | $ | 180,595 | $ | 1,704 | 0.9 | % | ||||||||||||||||
|
|
|
|
|
|
|
|
|
|
|
|
|
|||||||||||||||||||||
Comparison of the three months ended March 31, 2020 and 2019
Noninterest income decreased by $14.4 million, or 30.1%, to $33.4 million for the three months ended March 31, 2020 from $47.8 million for the three months ended March 31, 2019. The decrease in noninterest income was primarily due to a $10.9 million decrease in income from investments held in rabbi trusts, a $6.3 million decrease in interest swap income, and a $1.1 million decrease in gains on trading securities, net, partially offset by a $2.7 million increase in insurance commissions.
| • | Insurance commissions increased primarily as a result of an increase in our combined negotiated commission and profit sharing income of $2.4 million, in addition to an increase in our recurring commissions of $0.3 million due to organic growth. |
| • | Income (loss) from investments held in rabbi trust decreased primarily as a result of an unfavorable mark-to-market adjustment resulting from a decline in equity security valuations during the three months ended March 31, 2020 due to the current economic environment as a result of Covid-19. |
| • | Swap income decreased primarily as a result of an unfavorable mark-to-market adjustment due to the current economic environment as a result of the weighted average current rate paid decreasing to 0.7% during the three months ended March 31, 2020 from 1.7% during the year ended December 31, 2019. |
Comparison of the years ended December 31, 2019 and 2018
Noninterest income increased by $1.7 million, or 0.9%, to $182.3 million for the year ended December 31, 2019 from $180.6 million for the year ended December 31, 2018. The increase in noninterest income in year ended December 31, 2019 was primarily due to $11.4 million increase in income from investments held in rabbi trusts, $2.0 million increase in gains on sales of securities available for sale, net, partially offset by a decrease of $5.7 million in debit card processing fees, a decrease of $2.0 million in gains on sale of other assets, a decrease of $1.3 million in insurance commissions and a decrease of $0.9 million in gains on trading securities, net.
| • | Insurance commissions decreased primarily as a result of a decrease in our combined profit sharing and negotiated commission income of $3.5 million, partially offset by an increase in our recurring commissions due to organic growth. |
109
Table of Contents
| • | Debit card processing fees decreased primarily as a result of the full-year impact of the Durbin amendment of the Dodd-Frank Wall Street Reform and Consumer Protection Act of 2010 (“Dodd-Frank Act”) which mandated debit interchange price restrictions. The Durbin amendment became effective for us beginning in the third quarter of the year ended December 31, 2018. |
| • | Income (loss) from investments held in rabbi trust increased primarily as a result of appreciation of our assets held in connection with our executive retirement benefits. |
| • | Gains on trading securities, net, decreased primarily as a result of us exiting our capital markets business and other one-time non-recurring gains recorded for the year ended December 31, 2018. |
| • | Gains on sales of securities available for sale, net, increased primarily as a result of our normal portfolio management activities. |
| • | (Losses) gains on sale of other assets decreased primarily as a result of the sale of certain insurance group businesses and a nonrecurring gain on the sale of securities. |
Noninterest Expense
The following table sets forth information regarding noninterest expense for the periods shown:
Noninterest Expense
| Three Months Ended March 31, | Year Ended December 31 | |||||||||||||||||||||||||||||||
| Change | Change | |||||||||||||||||||||||||||||||
| 2020 | 2019 | Amount | % | 2019 | 2018 | Amount | % | |||||||||||||||||||||||||
| (Dollars in thousands) | ||||||||||||||||||||||||||||||||
| Salaries and employee benefits |
$ | 61,589 | $ | 67,306 | (5,717 | ) | (8.5 | )% | $ | 252,238 | $ | 239,349 | $ | 12,889 | 5.4 | % | ||||||||||||||||
| Office occupancy and equipment |
8,689 | 8,799 | (110 | ) | (1.3 | )% | 36,458 | 35,480 | 978 | 2.8 | % | |||||||||||||||||||||
| Data processing |
10,004 | 10,676 | (672 | ) | (6.3 | )% | 45,939 | 45,260 | 679 | 1.5 | % | |||||||||||||||||||||
| Professional services |
3,689 | 3,138 | 551 | 17.6 | % | 15,958 | 14,812 | 1,146 | 7.7 | % | ||||||||||||||||||||||
| Charitable donations |
1,187 | 3,648 | (2,461 | ) | (67.5 | )% | 12,905 | 13,251 | (346 | ) | (2.6 | )% | ||||||||||||||||||||
| Marketing |
2,468 | 1,723 | 745 | 43.2 | % | 9,619 | 11,100 | (1,481 | ) | (13.3 | )% | |||||||||||||||||||||
| FDIC insurance |
906 | 873 | 33 | 3.8 | % | 1,878 | 4,180 | (2,302 | ) | (55.1 | )% | |||||||||||||||||||||
| Amortization of intangible assets |
702 | 887 | (185 | ) | (20.9 | )% | 3,542 | 3,891 | (349 | ) | (9.0 | )% | ||||||||||||||||||||
| Net periodic benefit cost, excluding service cost |
(2,442 | ) | (1,334 | ) | (1,108 | ) | 83.1 | % | (5,335 | ) | (6,498 | ) | 1,163 | (17.9 | )% | |||||||||||||||||
| Other |
8,380 | 9,113 | (733 | ) | (8.0 | )% | 39,482 | 37,103 | 2,379 | 6.4 | % | |||||||||||||||||||||
|
|
|
|
|
|
|
|
|
|
|
|
|
|||||||||||||||||||||
| Total noninterest expense |
$ | 95,172 | $ | 104,829 | $ | (9,657 | ) | (9.2 | )% | $ | 412,684 | $ | 397,928 | $ | 14,756 | 3.7 | % | |||||||||||||||
|
|
|
|
|
|
|
|
|
|
|
|
|
|||||||||||||||||||||
Comparison of the three months ended March 31, 2020 and 2019
Noninterest expense decreased by $9.6 million, or 9.2%, to $95.2 million during the three months ended March 31, 2020 from $104.8 million during the three months ended March 31, 2019. The decrease in noninterest expense in the three months ended March 31, 2020 was mainly due to a $5.7 million decrease in salaries and employee benefits, a $2.5 million decrease in charitable contributions and a $1.1 million decrease in net periodic benefit cost, partially offset by a $0.6 million increase in professional services expense.
| • | Salaries and employee benefits decreased primarily as a result of a favorable defined contribution supplemental executive retirement plan expense as a result of the unfavorable mark-to-market adjustment on securities held in rabbi trust accounts, lower incentive expenses and deferrals of nonrefundable fees and costs associated with originating or acquiring loans and initial direct costs of leases, partially offset by higher commissions. |
| • | Other noninterest expense decreased primarily as a result of lower contributions to the Eastern Bank Charitable Foundation, as a result of lower taxable income for the three months ended March 31, 2020 compared to the three months ended March 31, 2019. |
110
Table of Contents
| • | Net period benefit cost, excluding service cost, decreased primarily as a result of a reduction in the expected return on plan assets. |
| • | Professional services increased primarily as a result of higher legal costs related to (i) corporate-related matters, (ii) loan-related matters and (iii) our commercial banking strategy and development services. |
| • | Marketing costs increased primarily as a result of increased marketing costs on advertising production, digital channel development and customer incentives. |
Comparison of the years ended December 31, 2019 and 2018
Noninterest expense increased $14.8 million, or 3.7%, to $412.7 million during the year ended December 31, 2019 from $397.9 million during the year ended December 31, 2018. The increase in noninterest expense in the year ended December 31, 2019 was mainly due to a $12.9 million increase in salaries and employee benefits, a $2.4 million increase in other noninterest expense, and a $1.1 million increase in professional services, partially offset by a decrease of $2.3 million in FDIC insurance and a decrease of $1.5 million in marketing costs.
| • | Salaries and employee benefits increased primarily as a result of annual merit increases and higher incentive and supplemental retirement expenses in the year ended December 31, 2019. |
| • | Other noninterest expense increased primarily as a result of higher training costs and litigation expenses. |
| • | Professional services increased primarily as a result of the digital banking system assessments and commercial banking strategy and development services. |
| • | FDIC insurance decreased primarily as a result of receiving an insurance credit from the FDIC as the FDIC’s Deposit Insurance Fund exceeded the required reserve ratio which allowed previous credits to be applied to insurance assessments. |
| • | Marketing costs decreased primarily as a result of us spending less on marketing costs, including television, radio and special events. |
| • | Net period benefit cost, excluding service cost, decreased primarily as a result of a reduction in the expected return on plan assets. |
For further information, see the sections of this prospectus titled “Summary—Benefits to Management and Potential Dilution to Shareholders Resulting from the Offering;” “Risk Factors—Risks Related to the Offering—Our stock-based benefit plans will increase our expenses and reduce our income;” and “Management—Benefits to be Considered Following Completion of the Offering.”
Income Taxes
We recognize the tax effect of all income and expense transactions in each year’s consolidated statements of income, regardless of the year in which the transactions are reported for income tax purposes. The following table sets forth information regarding our tax provision and applicable tax rates for the periods indicated:
Tax Provision and Applicable Tax Rates
| As of March 31, | As of December 31, | |||||||||||||||||||
| 2020 | 2019 | 2019 | 2018 | 2017 | ||||||||||||||||
| (Dollars in thousands) | ||||||||||||||||||||
| Combined federal and state income tax provisions |
$ | 1,298 | $ | 9,678 | $ | 39,481 | $ | 34,884 | $ | 54,331 | ||||||||||
| Effective income tax rates |
13.3 | % | 22.7 | % | 22.6 | % | 22.1 | % | 38.5 | % | ||||||||||
| Blended statutory rate |
28.1 | % | 28.1 | % | 28.1 | % | 28.1 | % | 40.9 | % | ||||||||||
111
Table of Contents
Income tax expense decreased by $8.4 million, or 86.6%, to $1.3 million in the three months ended March 31, 2020 from $9.7 million in the three months ended March 31, 2019. The decrease in income tax expense was due primarily to lower pre-tax income during the three months ended March 31, 2020 compared to the three months ended March 31, 2019, while investment tax credits and other favorable permanent differences have remained relatively constant. Income tax expense increased by $4.6 million, or 13.2%, to $39.5 million in the year ended December 31, 2019 from $34.9 million in the year ended December 31, 2018. The increase in income tax expense was due primarily to a $17.0 million increase in pre-tax income, an increase in state income tax and an increase in amortization of qualified low-income housing investments, partially offset by higher tax credits in the year ended December 31, 2019.
We invest in qualified affordable housing projects, which are real estate limited partnerships that acquire, develop, own and operate low and moderate-income housing developments, and solar investments. As a limited partner in these operating partnerships, we will receive tax credits and tax deductions for losses incurred by the underlying properties. The investments are accounted for using the proportional amortization method and will be amortized over various periods through 2037, which represents the period that the tax credits and other tax benefits will be utilized. The total committed investment in these partnerships is $58.4 million, of which $40.4 million has been funded. We recognized a net tax benefit of approximately $6.0 million for the year ended December 31, 2019 and anticipate additional net tax benefits of $45.6 million over the remaining life of the investments from the combination of tax credits and operating losses.
For additional information related to our income taxes, refer to Note 9 and Note 10 to the consolidated financial statements appearing elsewhere in this prospectus.
Financial Position and Results of Operations of our Business Segments
| As of and for the three months Ended March 31, | ||||||||||||||||||||||||||||||||
| 2020 | 2019 | |||||||||||||||||||||||||||||||
| Banking | Insurance Agency |
Eliminations | Consolidated | Banking | Insurance Agency |
Eliminations | Consolidated | |||||||||||||||||||||||||
| (dollars in thousands) | ||||||||||||||||||||||||||||||||
| Interest and dividend income |
$ | 106,159 | $ | — | $ | — | $ | 106,159 | $ | 111,483 | $ | — | $ | — | $ | 111,483 | ||||||||||||||||
| Interest expense |
$ | 6,013 | $ | — | $ | — | $ | 6,013 | $ | 8,811 | $ | — | $ | — | $ | 8,811 | ||||||||||||||||
| Net interest income |
$ | 100,146 | $ | — | $ | — | $ | 100,146 | $ | 102,672 | $ | — | $ | — | $ | 102,672 | ||||||||||||||||
| Total noninterest income |
$ | 6,868 | $ | 26,523 | $ | (22 | ) | $ | 33,369 | $ | 22,262 | $ | 25,559 | $ | (21 | ) | $ | 47,800 | ||||||||||||||
| Total noninterest expense |
$ | 78,465 | $ | 17,642 | $ | (935 | ) | $ | 95,172 | $ | 85,890 | $ | 19,868 | $ | (929 | ) | $ | 104,829 | ||||||||||||||
| Net income |
$ | 1,163 | $ | 6,369 | $ | 913 | $ | 8,445 | $ | 27,985 | $ | 4,072 | $ | 908 | $ | 32,965 | ||||||||||||||||
| Total loans, net of allowance for credit losses |
$ | 8,971,605 | $ | — | $ | — | $ | 8,971,605 | $ | 8,838,748 | $ | — | $ | — | $ | 8,838,748 | ||||||||||||||||
| Total assets |
$ | 12,221,799 | $ | 182,564 | $ | (60,609 | ) | $ | 12,343,754 | $ | 11,221,425 | $ | 154,448 | $ | (44,895 | ) | $ | 11,330,978 | ||||||||||||||
| Total deposits |
$ | 10,369,620 | $ | — | $ | (60,609 | ) | $ | 10,309,011 | $ | 9,297,513 | $ | — | $ | (44,895 | ) | $ | 9,252,618 | ||||||||||||||
| Total liabilities |
$ | 10,696,509 | $ | 45,120 | $ | (60,609 | ) | $ | 10,681,020 | $ | 9,851,901 | $ | 28,874 | $ | (44,895 | ) | $ | 9,835,880 | ||||||||||||||
| As of and for the year ended December 31, | ||||||||||||||||||||||||||||||||
| 2019 | 2018 | |||||||||||||||||||||||||||||||
| Banking | Insurance Agency |
Other/ Eliminations |
Consolidated | Banking | Insurance Agency |
Other/ Eliminations |
Consolidated | |||||||||||||||||||||||||
| (dollars in thousands) | ||||||||||||||||||||||||||||||||
| Interest and dividend income |
$ | 445,017 | $ | — | $ | — | $ | 445,017 | $ | 415,166 | $ | — | $ | — | $ | 415,166 | ||||||||||||||||
| Interest expense |
$ | 33,753 | $ | — | $ | — | $ | 33,753 | $ | 25,122 | $ | — | $ | — | $ | 25,122 | ||||||||||||||||
| Net interest income |
$ | 411,264 | $ | — | $ | — | $ | 411,264 | $ | 390,044 | $ | — | $ | — | $ | 390,044 | ||||||||||||||||
| Total noninterest income |
$ | 89,840 | $ | 92,705 | $ | (246 | ) | $ | 182,299 | $ | 86,596 | $ | 94,233 | $ | (234 | ) | $ | 180,595 | ||||||||||||||
| Total noninterest expense |
$ | 337,323 | $ | 79,043 | $ | (3,682 | ) | $ | 412,684 | $ | 326,956 | $ | 73,852 | $ | (2,880 | ) | $ | 397,928 | ||||||||||||||
| Net income |
$ | 121,939 | $ | 9,723 | $ | 3,436 | $ | 135,098 | $ | 105,271 | $ | 14,810 | $ | 2,646 | $ | 122,727 | ||||||||||||||||
| Total loans, net of allowance for credit losses |
$ | 8,899,184 | $ | — | $ | — | $ | 8,899,184 | $ | 8,774,913 | $ | — | $ | — | $ | 8,774,913 | ||||||||||||||||
| Total assets |
$ | 11,515,117 | $ | 165,965 | $ | (52,307 | ) | $ | 11,628,775 | $ | 11,265,752 | $ | 152,832 | $ | (40,297 | ) | $ | 11,378,287 | ||||||||||||||
| Total deposits |
$ | 9,603,699 | $ | — | $ | (52,307 | ) | $ | 9,551,392 | $ | 9,439,790 | $ | — | $ | (40,297 | ) | $ | 9,399,493 | ||||||||||||||
| Total liabilities |
$ | 10,046,189 | $ | 34,740 | $ | (52,307 | ) | $ | 10,028,622 | $ | 9,954,112 | $ | 31,331 | $ | (40,297 | ) | $ | 9,945,146 | ||||||||||||||
112
Table of Contents
Comparison of the three months ended March 31, 2020 and 2019
Banking Segment
| • | Average interest-earning assets grew $327.9 million, or 3.1%, to $10.8 billion as of March 31, 2020 from $10.4 billion as of March 31, 2019, with average total loans, our largest category of average interest-earning assets, growing $141.9 million, or 1.6%, to $9.0 billion as of March 31, 2020 from $8.9 billion as of March 31, 2019. |
| • | Average interest-bearing liabilities grew $49.7 million, or 0.8%, to $6.4 billion as of March 31, 2020 from $6.3 billion as of March 31, 2019, with average total deposits, our largest category of average interest-bearing liabilities, growing $255.5 million, or 4.3%, to $6.2 billion as of March 31, 2020 from $5.9 billion as of March 31, 2019. |
| • | Assets under management in our wealth management business decreased $27.0 million, or 1.1%, to $2.35 billion as of March 31, 2020 from $2.38 billion as of March 31, 2019. Our income related to our asset management business, which we record as noninterest income, increased $0.5 million, or 10.9%, to $5.1 million for the three months ended March 31, 2020 compared to $4.6 million for the three months ended March 31, 2019. The increase was due to the fees we earned during the three months ended March 31, 2020, prior to the decrease in equity performance due to the effects of the Covid-19 pandemic. |
Insurance Agency Segment
| • | Noninterest income related to our insurance agency business increased by $0.9 million, or 3.5 %, to $26.5 million during the three months ended March 31, 2020 from $25.6 million during the three months ended March 31, 2019. The increase was driven primarily by an increase in our combined negotiated commission and profit sharing income of $2.4 million, in addition to an increase in our recurring commissions of $0.3 million due to organic growth, partially offset by a $1.7 million decrease in income from investments held in rabbi trusts. |
Comparison of the years ended December 31, 2019 and 2018
Banking Segment
| • | Average interest-earning assets grew $231.4 million, or 2.2%, to $10.5 billion as of December 31, 2019 from $10.3 billion as of December 31, 2018, with average total loans, our largest category of average interest-earning assets, growing $382.8 million, or 4.5%, to $8.9 billion as of December 31, 2019 from $8.6 billion as of December 31, 2018. |
| • | Average interest-bearing liabilities grew $131.8 million, or 2.1%, to $6.3 billion as of December 31, 2019 from $6.2 billion as of December 31, 2018, with average total deposits, our largest category of average interest-bearing liabilities, growing $250.7 million, or 4.4%, to $6.0 billion as of December 31, 2019 from $5.7 billion as of December 31, 2018. |
| • | Assets under management in our wealth management business increased $436.0 million, or 19.7%, to $2.7 billion as of December 31, 2019 from $2.2 billion as of December 31, 2018. As a result, our income related our asset management business, which we record as noninterest income, increased $0.5 million, or 2.7%, to $19.7 million for the year ended December 31, 2019 compared to $19.1 million as of December 31, 2018. |
Insurance Agency Segment
| • | Noninterest income related to our insurance agency business decreased by $1.5 million, or 1.6%, to $92.7 million during the year ended December 31, 2019 from $94.2 million during the year ended December 31, 2018. The decrease was driven primarily by a decrease in our combined profit sharing and negotiated commission income of $3.5 million, a gain on sale of one of our insurance agency businesses of $1.4 million during the year ended December 31, 2018 that did not recur during the year ended December 31, 2019 and a reduction in our proceeds received from a life insurance policy during the year ended December 31, 2018 that did not recur during the year ended December 31, 2019, partially offset by an increase in our rabbi trust security income of $1.9 million during the year ended December 31, 2019 and an increase in our recurring commissions due to organic growth. |
113
Table of Contents
| • | Expenses related to our insurance agency business increased $5.1 million, or 6.9%, to $79.0 million during the year ended December 31, 2019 from $73.9 million during the year ended December 31, 2018, due to increases in salaries and wages, executive retirement benefit costs and technology costs, partially offset by decreases in our brokerage fees and amortization of intangible assets. |
Critical Accounting Policies and Estimates
Our discussion and analysis of our financial condition and results of operations is based upon our consolidated financial statements, which have been prepared in accordance with GAAP. The preparation of these financial statements requires us to make estimates, judgments and assumptions that affect the reported amounts of assets and liabilities and the disclosure of contingent assets and liabilities at the date of the financial statements and the reported amounts of income and expenses during the reporting periods. On an ongoing basis, we evaluate our estimates and assumptions. Our actual results could differ from these estimates.
While our significant accounting policies are described in more detail in Note 1 to our consolidated financial statements appearing elsewhere in this prospectus, we believe that the following accounting policies are those most critical to the judgments and estimates used in the preparation of our financial statements.
Allowance for Loan Losses. The allowance for credit losses is the amount estimated by us as necessary to absorb loan losses incurred in the loan portfolio that are probable and reasonably estimable at the balance sheet date. The amount of the allowance is based on significant judgments and estimates, and the ultimate losses may vary from such estimates as more information becomes available or conditions change. The methodology for determining the allowance for credit losses is considered a critical accounting policy due to the high degree of judgement involved in determining the risk characteristics of the loan portfolio, subjectivity of assumptions used and the potential for changes in the economic environment that could result in changes to the amount of the recorded allowance for loan losses. Additionally, various regulatory agencies, as an integral part of the regulatory examination process, periodically assess the appropriateness of the allowance for loan losses and may require us to increase the provision for loan losses or recognize further loan charge-offs, in accordance with GAAP.
The allowance for credit losses is evaluated at least quarterly. While we use current information in establishing the allowance for losses, future adjustments to the allowance may be necessary if economic conditions or conditions relative to borrowers differ substantially from the assumptions used in making the evaluation. We use a methodology to systematically estimate the amount of credit loss incurred in the portfolio. Commercial real estate, commercial construction, commercial and industrial, and business banking loans are evaluated using a loan rating system, historical losses and other factors which form the basis for estimating incurred losses. Portfolios of more homogeneous populations of loans, including residential mortgages and consumer loans, are analyzed as groups using delinquency ratios, historical loss experience and charge-offs.
The allowance consists of specific and general components. The specific component relates to loans that are deemed to be impaired. For impaired loans, an allowance is established when the discounted cash flows (or collateral value or observable market price) of the loan is lower than the carrying value of the loan. The general component covers non-impaired, non-classified loans and is based on historical loss experience adjusted for qualitative factors.
Income Taxes. We account for income taxes by establishing deferred tax assets and liabilities for the temporary differences between the accounting basis and the tax basis of our assets and liabilities at enacted tax rates. We make significant judgments regarding the amount and timing of recognition of deferred tax assets and liabilities. This requires subjective projections of future taxable income resulting from interest on loans and securities, as well as noninterest income. A valuation allowance is established if it is considered more likely than not that all or a portion of the deferred tax assets will not be realized. Interest and penalties paid on the underpayment of income taxes are classified as income tax expense.
We periodically evaluate the potential uncertainty of our tax positions as to whether it is more likely than not its position would be upheld upon examination by the appropriate taxing authority. The tax position is measured at the largest amount of benefit that is greater than 50% likely of being realized upon settlement.
Goodwill and Other Intangibles. We evaluate goodwill for impairment at least annually, or more often if warranted, using a quantitative impairment approach. The quantitative impairment testing compares book value to fair value of the reporting unit. If book value exceeds fair value, an impairment is charged to earnings and allocated to the appropriate reporting unit.
114
Table of Contents
We evaluate other intangible assets, all of which are definite-lived, for impairment whenever there is an indication of impairment, however, useful lives are evaluated annually. We amortize other intangible assets over their respective estimated useful lives.
Securities. Debt securities are classified at the time of purchase as either “trading,” “available for sale,” or “held to maturity.” Equity securities are measured at fair value with changes in the fair value recognized through net income.
We evaluate impaired securities for other-than-temporary impairment (“OTTI”) at least on a quarterly basis, and more frequently when economic or market concerns warrant such evaluation. Consideration is given to the length of time and the extent to which the fair value has been less than cost, current market conditions, the financial condition and near-term prospects of the issuer, performance of collateral underlying the securities, the ratings of the individual securities, the interest rate environment, our intent to sell the security or whether it is more likely than not that we will be required to sell the debt security before its anticipated recovery, as well as other qualitative factors. The term other-than-temporary impairment is not intended to indicate that the decline is permanent. It indicates that the prospects for near-term recovery are not necessarily favorable or that there is a lack of evidence to support fair values greater than or equal to the carrying value of the investment.
If a decline in fair value below the amortized cost basis of an investment is judged to be other than temporary, the investment is written down to fair value. The portion of the impairment related to credit losses is included in net income, and the portion of the impairment related to other factors is included in other comprehensive income. Gains and losses on sales of securities are recognized at the time of sale on the specific-identification basis.
Pension Plans. We provide pension benefits to our employees through membership in the Savings Banks Employees’ Retirement Association (“SBERA”). The plan is a noncontributory, defined benefit plan. Benefits became fully vested after three years of eligible service for individuals employed on or before October 31, 1989. Individuals employed subsequent to October 31, 1989 become fully vested after five years of eligible service. Our annual contribution to the defined benefit plan is based upon standards established by the Pension Protection Act. The contribution is based on an actuarial method intended to provide not only for benefits attributable to service to date, but also for those expected to be earned in the future.
Plan assets are invested in various investment funds and held at fair value which is generally determined based on observable market prices. Pension liability is determined based on the actuarial cost method factoring in assumptions such as salary increases, expected retirement date, mortality rate and employee turnover. The projected benefit obligation is determined based on the present value of the projected benefit distributions at an assumed discount rate (which is the rate at which the projected benefit obligation could be effectively settled as of the measurement date). The discount rate is determined using the spot rate approach whereby the individual spot rates on the Financial Times and Stock Exchange (“FTSE”) above-median yield curve are applied to each corresponding year’s projected cash flow used to measure the respective plan’s service cost and interest cost. Periodic pension cost (or income) includes service costs, interest costs based on the assumed discount rate, the expected return on plan assets based on an actuarially derived market-related value and amortization of actuarial gains and losses. Net period benefit cost excluding service cost is included as a separate line item in noninterest expense in the consolidated statements of income. Service cost is included in salaries and employee benefits in the consolidated statements of income. The overfunded or underfunded status of the plans is recorded as an asset or liability on the consolidated balance sheets, with changes in that status recognized through other comprehensive income, net of related taxes. Funded status represents the difference between the projected benefit obligation of the plan and the market value of the plan’s assets.
Derivative Financial Instruments. Derivative instruments are carried at fair value in our financial statements. The accounting for a derivative instrument is determined by whether it has been designated and qualifies as part of a hedging relationship, and further, by the type of hedging relationship. Our derivative instruments that qualify for hedge accounting are classified as cash flow hedges (i.e., hedging the exposure to variability in expected future cash flows associated with a recognized asset or liability, or a forecasted transaction). Our derivative instruments not designated as hedging instruments include interest rate swaps, foreign exchange contracts offered to commercial customers to assist them in meeting their financing and investing objectives for their risk management purposes, and risk participation agreements entered into as financial guarantees of performance on customer-related interest rate swap derivatives. The interest rate and foreign exchange risks associated with customer interest rate swaps and foreign exchange contracts are mitigated by entering into similar derivatives having offsetting terms with correspondent bank counterparties.
Fair Value Measurements. Fair Value is defined as the price that would be received to sell an asset or paid to transfer a liability in an orderly transaction between market participants at the measurement date. We estimate the fair value of a
115
Table of Contents
financial instrument and any related asset impairment using a variety of valuation methods. Where financial instruments are actively traded and have quoted market prices, quoted market prices as of the measurement date are used for fair value. When the financial instruments are not actively traded, other observable market inputs, such as quoted prices of securities with similar characteristics, quoted prices in markets that are not active or other inputs that are observable or can be corroborated by observable market data, may be used, if available, to determine fair value. When observable market prices do not exist, we estimate fair value. These estimates are subjective in nature and imprecision in estimating these factors can impact the amount of revenue or loss recorded. To the extent that valuation is based on models or inputs that are less observable or unobservable in the market, the determination of fair value requires more judgment. Accordingly, the degree of judgment we exercise in determining fair value is greatest for instruments categorized in Level 3.
Recent Accounting Pronouncements
In June 2016, the FASB issued ASU 2016-13, Financial Instruments – Credit Losses (Topic 326): Measurement of Credit Losses on Financial Instruments (“ASU 2016-13”). ASU 2016-13 significantly changes how entities will measure credit losses for most financial assets and certain other instruments that are not measured at fair value through net income. ASU 2016-13 replaces the existing incurred loss guidance and requires immediate recognition of expected credit losses for financial assets carried at amortized cost, including trade and other receivables, loans and commitments, held-to-maturity debt securities and other financial assets, held at the reporting date to be measured based on historical experience, current conditions and reasonable and supportable forecasts. ASU 2016-13 also amends existing impairment guidance for available-for-sale securities, and credit losses will be recorded as an allowance versus a write-down of the amortized cost basis of the security and will allow for a reversal of impairment loss when the credit of the issuer improves. ASU 2016-13 requires a cumulative effect of the initial application to be recognized in retained earnings at the date of initial application.
We anticipate adopting ASU 2016-13 during the year ending December 31, 2021 and are currently assessing the impact of ASU 2016-13 on our consolidated financial statements. To date, we have been assessing the key differences and gaps between our current allowance methodologies and model with those we are considering to use upon adoption. This has included assessing the adequacy of our existing loss data, developing models for default and loss estimates, and finalizing our vendor selection.
For additional recent accounting pronouncements, refer to Note 1 to the consolidated financial statements appearing elsewhere in this prospectus for a description of recent accounting pronouncements that may affect our financial position or results of operations.
Off-Balance Sheet Arrangements
We are a party to financial instruments with off-balance sheet risk in the normal course of business to meet the financing needs of our customers. The financial instruments include commitments to originate loans, unused lines of credit, unadvanced portions of construction loans and standby letters of credit, which involve elements of credit and interest rate risk in excess of the amount recognized in the consolidated balance sheets. Our exposure to credit loss is represented by the contractual amount of the instruments. We use the same credit policies in making commitments as we do for on-balance sheet instruments.
At March 31, 2020, we had $3.6 billion of commitments to originate loans, comprised of $2.1 billion of commitments under commercial loans and lines of credit (including $306.6 million of unadvanced portions of construction loans), $1.2 billion of commitments under home equity loans and lines of credit, $210.1 million in overdraft coverage commitments, and $58.1 million of unfunded commitments related to residential real estate loans and $17.8 million in other consumer loans and lines of credit. In addition, at March 31, 2020, we had $56.5 million in standby letters of credit outstanding. Finally, we had $114.7 million in forward commitments to sell loans. Refer to Note 13 to the consolidated financial statements appearing elsewhere in this prospectus for further detail on our commitments.
Management of Market Risk
General. Market risk is the sensitivity of income to changes in interest rates, foreign exchange rates, commodity prices and other market-driven rates or prices. Interest rate sensitivity is the most significant market risk to which we are exposed. Interest rate risk is the sensitivity of income to changes in interest rates. Changes in interest rates, as well as fluctuations in the level and duration of assets and liabilities, affect net interest income, our primary source of income. Interest rate risk arises directly from our core banking activities. In addition to directly impacting net interest income, changes in the level of interest rates can also affect the amount of loans originated, the timing of cash flows on loans and securities, and the fair value of securities and derivatives, as well as other effects.
116
Table of Contents
The primary goal of interest rate risk management is to control this risk within limits approved by our Board of Directors. These limits reflect our tolerance for interest rate risk over both short-term and long-term horizons. We attempt to manage interest rate risk by identifying, quantifying, and where appropriate, hedging its exposure. If assets and liabilities do not re-price simultaneously and in equal volume, the potential for interest rate exposure exists. Our objective is to maintain stability in the growth of net interest income through the maintenance of an appropriate mix of interest-earning assets and interest-bearing liabilities and, when necessary, within limits management determines to be prudent, through the use of off-balance sheet hedging instruments such as interest rate swaps, floors and caps. Refer to Note 13 to consolidated financial statements appearing elsewhere in this prospectus for additional information regarding our use of derivative financial instruments.
Net Interest Income. We analyze our sensitivity to changes in interest rates through a net interest income model. We estimate what our net interest income would be for a 12-month period assuming no changes in interest rates. We then calculate what the net interest income would be for the same period under the assumption that the United States Treasury yield curve increases or decreases instantaneously by +200, +300, +400 and -100 basis point increments, with changes in interest rates representing immediate and permanent, parallel shifts in the yield curve. A basis point equals one-hundredth of one percent, and 100 basis points equals one percent. An increase in interest rates from 3% to 4% would mean, for example, a 100 basis point increase in the “Changes in Interest Rates” column below. The model requires that interest rates remain positive for all points along the yield curve for each rate scenario which may preclude the modeling of certain falling rate scenarios during periods of lower market interest rates. The relatively low level of interest rates prevalent at March 31, 2020 precluded the modeling of certain falling rate scenarios, including negative interest rates.
The tables below set forth, as of March 31, 2020 and December 31, 2019, the calculation of the estimated changes in our net interest income on an FTE basis that would result from the designated immediate changes in the United States Treasury yield curve.
Interest Rate Sensitivity
| As of March 31, 2020 |
||||
| Change in Interest Rates (basis points) (1) |
Net Interest Income Year 1 |
Year 1 Change from Level | ||
| (Dollars in thousands) | ||||
| 400 |
$424,264 | 10.9% | ||
| 300 |
414,212 | 8.3% | ||
| 200 |
404,348 | 5.7% | ||
| Flat |
382,610 | — % | ||
| -100 |
360,367 | (5.8)% | ||
| As of December 31, 2019 |
||||
| Change in Interest Rates (basis points) (1) |
Net Interest Income Year 1 |
Year 1 Change from Level | ||
| (Dollars in thousands) | ||||
| 400 |
$433,300 |
5.2% | ||
| 300 |
428,186 |
4.0% | ||
| 200 |
422,881 |
2.7% | ||
| Flat |
411,704 |
— % | ||
| -100 |
395,697 | (3.9)% | ||
The tables above indicate that at March 31, 2020 and December 31, 2019, in the event of an instantaneous parallel 200 basis points increase in rates, we would experience a 5.7% and 2.7% increase, respectively, in net interest income on an FTE, and in the event of an instantaneous 100 basis points decrease in interest rates, we would experience a 3.9% decrease at December 31, 2019 in net interest income, on an FTE basis. We have the ability to use interest rate derivative financial instruments, within internal policy guidelines, to manage interest rate risk as part of our asset/liability strategy. These derivatives provide significant protection against falling interest rates. Without the derivatives, our FTE net interest income would decline by 7.7% with an instantaneous 100 basis point decrease in interest rates, rather than the 3.9% decrease shown in the table above at December 31, 2019.
117
Table of Contents
Economic Value of Equity Analysis. We also analyze the sensitivity of our financial condition in interest rates through our economic value of equity (“EVE”) model. This analysis calculates the difference between the present value of expected cash flows from assets and liabilities assuming various changes in current interest rates.
The table below represents an analysis of our interest rate risk (excluding the effect of our pension plan) as measured by the estimated changes in our EVE, resulting from an instantaneous and sustained parallel shift in the yield curve (+200, +300, +400 basis points and -100 basis points) at March 31, 2020 and December 31, 2019. The model requires that interest rates remain positive for all points along the yield curve for each rate scenario which may preclude the modeling of certain falling rate scenarios during periods of lower market interest rates. The relatively low level of interest rates prevalent at March 31, 2020 precluded the modeling of certain falling rate scenarios, including negative interest rates.
EVE Interest Rate Sensitivity
| As of March 31, 2020 |
||||||||
| Change in Interest Rate (basis points) (i) |
Estimated EVE (ii) |
Estimated Increase (Decrease in EVE) from Level |
EVE as a Percentage of Present Value of Assets (iii) | |||||
| Amount |
Percent | |||||||
| (Dollars in thousands) | ||||||||
| 400 |
$2,539,206 | $281,268 | 12.5% | 21.43% | ||||
| 300 |
2,502,817 | 244,879 | 10.8% | 20.74% | ||||
| 200 |
2,450,858 | 192,920 | 8.5% | 19.95% | ||||
| Flat |
2,257,938 | — | — % | 17.77% | ||||
| -100 |
2,115,641 | (142,297) | (6.3)% | 16.53% | ||||
| As of December 31, 2019 |
||||||||
| Change in Interest Rate (Basis Points) (i) |
Estimated EVE (ii) |
Estimated Increase (Decrease in EVE) |
EVE as a Percentage of Present Value of Assets (iii) | |||||
| Amount |
Percent | |||||||
| (Dollars in thousands) | ||||||||
| 400 |
$ 2,446,754 |
$ 14,005 |
0.6% |
22.5% | ||||
| 300 |
2,453,287 |
20,538 |
0.8% |
22.1% | ||||
| 200 |
2,457,642 |
24,893 |
1.0% |
21.7% | ||||
| Flat |
2,432,749 |
— |
— % |
20.5% | ||||
| -100 |
2,364,175 | (68,574) | (2.8)% | 19.5% | ||||
(i) Assumes an immediate uniform change in interest rates at all maturities.
(ii) EVE is the discounted present value of expected cash flows from assets, liabilities and off-balance sheet contracts.
(iii) Present value of assets represents the discounted present value of incoming cash flows on interest-earning assets.
Our earnings are not directly or materially impacted by movements in foreign currency rates or commodity prices. Movements in equity prices may have a modest impact on earnings by affecting the volume of activity or the amount of fees from investment-related business lines. See Note 3 to the consolidated financial statements appearing elsewhere in this prospectus.
Liquidity and Capital Resources
Liquidity. Liquidity describes our ability to meet the financial obligations that arise in the normal course of business. Liquidity is primarily needed to meet deposit withdrawals and anticipated loan fundings, as well as current and planned expenditures. We seek to maintain sources of liquidity that are deep and diversified and that may be used during the normal course of business as well as on a contingency basis.
Our primary sources of funds are deposits, principal and interest payments on loans and securities, and proceeds from calls, maturities and sales of securities. While maturities and scheduled amortization of loans and securities are predictable sources of funds, deposit flows and loan prepayments are greatly influenced by general interest rates, economic conditions, and competition. Our most liquid assets are cash and due from banks and securities classified as available-for-sale.
118
Table of Contents
We participate in the Promontory Interfinancial Network, allowing us to provide access to multi-million dollar FDIC deposit insurance protection on deposits for consumers, businesses and public entities. We can elect to sell or repurchase this funding as reciprocal deposits from other Promontory network banks depending on our funding needs. At March 31, 2020 and December 31, 2019, we had a total of $329 million and $270 million of Promontory deposits, respectively, of which, $94 million was repurchased as reciprocal deposits from the Promontory network as of December 31, 2019. The remaining $176 million of Promontory deposits should be considered a source of liquidity as of December 31, 2019. As of March 31, 2020, there was no additional capacity from Promontory deposits.
Although customer deposits remain our preferred source of funds, maintaining back up sources of liquidity is part of our prudent liquidity risk management practices. We have the ability to borrow from the Federal Home Loan Bank of Boston. At March 31, 2020, we had $15 million in outstanding advances and the ability to borrow up to an additional $1.4 billion. We also have the ability to borrow from the Federal Reserve Bank of Boston. At March 31, 2020, we had a $608 million collateralized line of credit from the Federal Reserve Bank of Boston with no outstanding balance. Additionally, we had a total of $610 million of discretionary lines of credit at March 31, 2020.
Sources of Liquidity
| As of March 31, | As of December 31, | |||||||||||||||||||||||
| 2020 | 2019 | 2018 | ||||||||||||||||||||||
| Outstanding | Additional Capacity |
Outstanding | Additional Capacity |
Outstanding | Additional Capacity |
|||||||||||||||||||
| (In thousands) |
||||||||||||||||||||||||
| Promontory Deposits |
$ | 329,007 | $ | — | $ | 93,539 | $ | 176,346 | $ | 293,752 | $ | — | ||||||||||||
| Federal Home Loan Bank |
15,070 | 1,437,219 | (1) | 18,964 | 1,822,955 | (1) | 137,286 | 1,659,318 | (1) | |||||||||||||||
| Federal Reserve Bank of Boston |
— | 607,911 | (2) | — | 636,960 | (2) | — | 861,591 | (2) | |||||||||||||||
| Unsecured lines of credit |
— | 610,000 | — | 555,000 | — | 50,000 | ||||||||||||||||||
|
|
|
|
|
|
|
|
|
|
|
|
|
|||||||||||||
| $ | 344,077 | $ | 2,655,130 | $ | 112,503 | $ | 3,191,261 | $ | 431,038 | $ | 2,570,909 | |||||||||||||
|
|
|
|
|
|
|
|
|
|
|
|
|
|||||||||||||
| (1) | As of March 31, 2020, loans have been pledged to the Federal Home Loan Bank of Boston with a carrying value of $2.1 billion to secure additional borrowing capacity. As of December 31, 2019, loans and securities have been pledged to the Federal Home Loan Bank of Boston with a carrying value of $1.5 billion and $0.9 billion, respectively, to secure additional borrowing capacity. As of December 31, 2018, the carrying value of the pledged loans and securities totaled $1.2 billion and $1.0 billion, respectively. |
| (2) | Loans with a carrying value of $1.0 billion, $1.0 billion and $1.3 billion at March 31, 2020 and December 31, 2019 and 2018, respectively, have been pledged to the Federal Reserve Bank of Boston resulting in this additional unused borrowing capacity. |
We believe that advanced preparation, early detection, and prompt responses can avoid, minimize, or shorten potential liquidity crises. Our Board of Directors and our Asset Liability Committee have put a Liquidity Contingency Plan in place to establish methods for assessing and monitoring risk levels, as well as potential responses during unanticipated stress events. As part of its risk management framework, we perform periodic liquidity stress testing to assess its need for liquid assets as well as backup sources of liquidity.
Capital Resources. We are subject to various regulatory capital requirements administered by the Massachusetts Commissioner of Banks, the FDIC and the Federal Reserve (with respect to our consolidated capital requirements). At March 31, 2020 and December 31, 2019, we exceeded all applicable regulatory capital requirements, and were considered “well capitalized” under regulatory guidelines. See the section of this prospectus titled “Historical and Pro Forma Regulatory Capital Compliance” and Note 11 to the consolidated financial statements appearing elsewhere in this prospectus.
The net offering proceeds will significantly increase our liquidity and capital resources. Over time, the initial level of liquidity will be reduced as net offering proceeds are used for general corporate purposes, including funding loans. Our financial condition and results of operations will be enhanced by the net offering proceeds, resulting in increased net interest-earning assets and net interest income. However, due to the increase in equity resulting from the net offering proceeds, as well as other factors associated with the offering, our return on equity will be lower immediately following the offering. See the section of this prospectus titled “Risk Factors—Risks Related to the Offering—Our return on equity may be low following the offering. This could negatively affect the trading price of our shares of common stock.”
119
Table of Contents
Contractual Obligations, Commitments and Contingencies
In the ordinary course of our operations, we enter into certain contractual obligations. Such obligations include data processing services, operating leases for premises and equipment, agreements with respect to borrowed funds and deposit liabilities. The amounts below assume the contractual obligations and commitments will run through the end of the applicable term and, as such, do not include early termination fees or penalties where applicable. The following table summarizes our contractual obligations, other commitments and contingencies at December 31, 2019:
Contractual Obligations, Commitments and Contingencies
| Total | Less than One Year |
One to Three Years |
Four to Five Years |
After Five Years (2) |
||||||||||||||||
| (In thousands) | ||||||||||||||||||||
| Commitments to extend credit (1) |
$ | 3,606,182 | $ | 2,033,309 | $ | 626,014 | $ | 224,079 | $ | 722,780 | ||||||||||
| Standby letters of credit |
60,124 | 50,535 | 9,401 | 188 | — | |||||||||||||||
| Operating lease obligations |
59,533 | 13,958 | 22,609 | 8,677 | 14,289 | |||||||||||||||
| FHLB advances |
18,964 | 4,946 | 193 | 1,587 | 12,238 | |||||||||||||||
| Forward commitments to sell loans |
21,357 | 21,357 | — | — | — | |||||||||||||||
|
|
|
|
|
|
|
|
|
|
|
|||||||||||
| Total |
$ | 3,766,160 | $ | 2,124,105 | $ | 658,217 | $ | 234,531 | $ | 749,307 | ||||||||||
|
|
|
|
|
|
|
|
|
|
|
|||||||||||
| (1) | Unused commitments that are deemed to be unconditionally cancelable are included in the less than on year category in the above table. |
There were no material changes in our contractual obligations, other commitments and contingencies at March 31, 2020.
In the normal course of business, we enter into purchase orders with our commercial customers for the purchase of securities.
Impact of Inflation and Changing Prices
The financial nature of our Consolidated Financial Statements and related notes thereto presented elsewhere in this prospectus is more clearly affected by changes in interest rates than by inflation. Interest rates do not necessarily fluctuate in the same direction or in the same magnitude as the prices of goods and services. However, inflation affects us business as prices increase, the money supply grows as a result interest rates are affected by inflationary expectations. The impact on our business is noted in the increase in the size of loan requests with resulting growth in total assets. In addition, operating expenses may increase without a corresponding increase in productivity. There is no precise method to measure the effects of inflation on our Consolidated Financial Statements and related notes thereto presented elsewhere in this prospectus. Accordingly, any examination or analysis of the Consolidated Financial Statements and related notes thereto presented elsewhere in this prospectus should take into consideration the possible effects of inflation.
120
Table of Contents
EASTERN BANKSHARES, INC.
Eastern Bankshares, Inc. is a Massachusetts corporation formed in 2020 to conduct the offering. Upon completion of the offering, Eastern Bankshares, Inc. will own all of Eastern Bank’s capital stock, and through Eastern Bank and its wholly owned subsidiary Eastern Insurance Group LLC, Eastern Bankshares, Inc. will provide a variety of banking, trust and investment and insurance services. Eastern Bankshares, Inc. currently does not intend to engage in material business activities other than those related to owning all of the capital stock of Eastern Bank. (Please refer to the section of this prospectus titled “The Conversion and Offering” for a description of the reorganization of Eastern that will occur simultaneously with the completion of the offering.)
Eastern Bankshares, Inc. intends to contribute to Eastern Bank 50% of the net proceeds raised in the offering. A portion of the remaining net proceeds from the offering will be used to fund a loan that Eastern Bankshares, Inc. will make to our employee stock ownership plan to finance its purchase of shares in the offering (or possibly, after the offering, in open market purchases), and the balance will be retained by Eastern Bankshares, Inc. to be invested as discussed in the section of this prospectus titled “How We Intend to Use the Proceeds From the Offering.”
Upon completion of the offering, Eastern Bankshares, Inc. will be a bank holding company subject to regulation and examination by the Federal Reserve Board and to examination by the Massachusetts Commissioner of Banks. Eastern Bankshares, Inc. currently does not intend to engage in any material business activity other than those relating to owning all of the capital stock of Eastern Bank. In the future, Eastern Bankshares, Inc. may pursue other business activities, including mergers and acquisitions, investment alternatives and diversification of operations. There are, however, no current understandings or agreements for these activities. See the section of this prospectus titled “Supervision and Regulation—Holding Company Regulation” for a discussion of the activities that are permitted for bank holding companies.
Following the offering, Eastern Bankshares, Inc.’s cash flow will primarily depend on earnings from the investment of the net proceeds from the offering that it retains and any dividends received from Eastern Bank. Eastern Bankshares, Inc. intends to use the support staff and offices of Eastern Bank and will pay Eastern Bank for these services. If Eastern Bankshares, Inc. expands or changes its business in the future, it may hire its own employees.
EASTERN BANK
Overview
We are a Massachusetts-chartered bank headquartered in Boston, Massachusetts that has served our community for over 200 years. Founded in 1818 as a local savings bank, we have evolved over the years into a diversified commercial bank, providing a broad array of products and services to retail, commercial and small business customers. We operate primarily in the greater Boston market with 89 banking offices located in eastern Massachusetts and southern and coastal New Hampshire. We have two business segments: banking and insurance agency operations. As of March 31, 2020, we had total consolidated assets of $12.3 billion, total gross loans of $9.1 billion, total deposits of $10.3 billion and total stockholders’ equity of $1.7 billion.
Our mission is to invest in our customers, communities and colleagues to help them prosper and grow. We pride ourselves on understanding our customers’ financial needs and delivering a diverse suite of tailored, high-quality solutions through a consultative approach that fosters long-term relationships. We have served our communities since 1818, especially over the last few decades through the generosity of Eastern Bank Charitable Foundation and the robust volunteerism of our talented employees. We invest in our colleagues and believe our diverse and inclusive workforce is crucial to our success. Overall, we like to think of ourselves as good people, doing good things to help people prosper.
We believe that, as a result of our differentiated approach to banking, we have established a distinctive brand and reputation in the market, contributing to Eastern having the greatest share of deposits in the Boston market for any full-service bank headquartered in Boston. (Based upon the most currently available FDIC data as of June 30, 2019, our total deposits of $8.7 billion represented 2.4% of the Boston market.) We believe our focus on long-term client relationships contributes to our stable, low-cost deposit base, and that our long-term presence in the market enables us to prudently underwrite and originate high-quality assets and deliver more stable returns. In addition, we believe these benefits of our focus on long-term client relationships position us well for times of stress and allow us to successfully manage through the full range of economic cycles.
121
Table of Contents
For the quarter ended March 31, 2020 our annualized return on average assets was 0.29% driven by a net interest margin of 0.94%, cost of total deposits of 0.23% and fee income as a percent of revenue of 29.49%. At March 31, 2020, our ratio of common equity tier 1 capital to total assets, which we refer to as our “CET1 ratio,” was 12.42%, and our ratio of net loans to deposits was 87.03%. We are committed to expanding our business in a disciplined manner with a long-term perspective. We believe that we have prudently grown our business over the past five years, with a focus on transaction deposits and loans to commercial clients. For the five-year period from January 1, 2015 through December 31, 2019, our checking accounts (our primary relationship deposit product) grew from $4.2 billion to $5.3 billion, representing a compounded annual growth rate of 5.2%, and our commercial loans (our primary strategic focus for loan growth) grew from $4.1 billion to $6.2 billion, representing a compounded annual growth rate of 8.6%.
Our diversified products and services include lending, deposit, wealth and insurance products. Deposits obtained through our branch banking network have traditionally been the principal source of funds for use in lending and for other general business purposes. We offer a range of demand deposits, interest checking, money market accounts, savings accounts and time certificates of deposit. Our lending focuses on the following loan categories: commercial and industrial, including our Asset Based Lending Portfolio, commercial real estate, commercial construction, small business banking, residential real estate and home equity loans. Through Eastern Bank’s wealth management offering, we provide a wide range of trust services. Eastern Insurance Group LLC, a wholly owned subsidiary of Eastern Bank, acts as an agent in offering insurance solutions for clients with personal, commercial or employee benefits-related insurance needs. Eastern Insurance Group LLC operates through 22 non-branch offices located primarily in eastern Massachusetts.
Our website address is www.easternbank.com. Information on this website is not and should not be considered a part of this prospectus.
Market Area
Our primary market consists of the greater Boston area, specifically eastern and central Massachusetts, southern New Hampshire including the seacoast region and northern Rhode Island.
The statistical area used for government data gathering purposes that aligns most closely with our lending area is known as the Boston–Worcester–Providence combined statistical area, or CSA. In addition to greater Boston, this area includes the metropolitan areas of Manchester, New Hampshire; Worcester, Massachusetts; and Providence, Rhode Island. It also includes the Cape Cod region of Massachusetts. With an estimated population of 8.3 million, the Boston–Worcester–Providence CSA is the sixth largest CSA in the United States based upon 2018 population data.
We believe the Boston–Worcester–Providence CSA provides a well-diversified and resilient economic base. There are approximately 3.1 million households in the Boston–Worcester–Providence CSA with an average of 2.5 persons per household. Median household income in 2018 for the Boston–Worcester–Providence CSA was approximately $80,000 compared to $62,000 for the United States as a whole. The estimated median age of the population in the Boston–Worcester–Providence CSA is 39, compared to 38 for the United States as a whole. For the eleven counties in eastern Massachusetts and southern New Hampshire in which our branches are located and from which we gather most of our deposits, the average unemployment rate as of November 2019 was 2.3%, as compared to 3.3% for the United States. For the statistical area consisting of Boston and Cambridge, Massachusetts, and Nashua, New Hampshire—which is a subset of the Boston–Worcester–Providence CSA—the unemployment rate as of December 2019 was 2.1%, according to the U.S. Bureau of Labor Statistics. As disclosed elsewhere in this prospectus, the Covid-19 recession has significantly increased the unemployment rate in our market. As of June 2020, the unemployment rate in Massachusetts was 17.4%, and the unemployment rate for the Boston-Cambridge-Nashua statistical area as of May 2020 was 15.9%. Please refer to the section of this prospectus titled “Risk Factors—Risks Related to Covid-19 Pandemic and Associated Economic Slowdown” for additional information regarding the implications of the Covid-19 recession for our business.
Home to over 100 colleges and universities, including nationally and internationally recognized institutions such as Boston College, Boston University, Brown University, Harvard University, Massachusetts Institute of Technology, Northeastern University, Wellesley College and Worcester Polytechnic Institute, the Boston–Worcester–Providence CSA includes many employers in what often is referred to as the “knowledge-based economy” that relies on highly-educated employees, professionals and entrepreneurs. Approximately 43.1% of the population in the Boston–Worcester–Providence CSA age 25 or older has at least a bachelor’s degree, compared to 32.6% for the United States as a whole. Major
122
Table of Contents
employment sectors range from education, services, manufacturing and wholesale and retail trade, to finance, technology and health care. Seven of the ten largest employers in the Boston metropolitan statistical area (MSA) are hospitals. Professional, scientific, and technical services, which covers a variety of industries including computer systems design, scientific research and development, management consulting, architecture and law, comprise the second largest share of the Boston MSA employers.
We believe another important factor shaping the economy of the Boston–Worcester–Providence CSA is the formation of new business ventures, including those engaged in the technology and life sciences sectors. For the period from 2007 to 2017, the dollar amount of venture capital investments in companies headquartered in Massachusetts, as a percentage of all venture capital investments in the United States, was 9.2%, ranking second only behind California. For that period, Massachusetts had the highest amount of venture capital investment per $1,000 GDP at $15.20, with California ranked second at $14.87.
Our History and Recent Acquisitions
Eastern Bank was founded in 1818, and early in its history served primarily the communities of Lynn and Salem, Massachusetts, located approximately 10 to 15 miles northeast of Boston. Eastern Bank reorganized into its current mutual holding company structure in 1989 by forming Eastern Bank Corporation, the current mutual holding company of Eastern Bank that will cease to exist upon the completion of the offering. In 1998, we relocated our executive offices to Boston’s financial district.
Bank Acquisitions
During the past two decades, we have been able to expand our banking business through a combination of internal or “organic” growth complemented by opportunistic strategic transactions. Since 1997, we have completed seven mergers or acquisitions. In addition to increasing our deposit base and earning assets, these strategic transactions increased our presence in greater Boston and broadened our geographic market to include southeastern Massachusetts and southern and coastal New Hampshire.
Greater Boston
In 2008, we acquired MASSBANK, which operated 15 retail banking offices in the northern Middlesex County corridor between Boston and New Hampshire. MASSBANK had total assets of approximately $800 million at the time of our acquisition.
In 2010, we acquired Wainwright Bank & Trust Company, which operated 12 retail banking offices in Greater Boston. Wainwright had total assets of approximately $1 billion at the time of our acquisition.
Southern and Coastal New Hampshire
In 2014, we acquired Centrix Bank & Trust, which operated six retail banking offices in southern and coastal New Hampshire, which allowed us to extend the market we entered with the MASSBANK acquisition. Centrix had total assets of approximately $909 million at the time of our acquisition.
Southeastern Massachusetts
In 1998, we acquired Hibernia Savings Bank, which operated nine retail banking offices in the suburbs southeast of Boston. Hibernia had total assets of approximately $444 million at the time of our acquisition.
In 2005, we merged with Plymouth Savings Bank, which operated 18 retail banking offices and nine mortgage loan centers in southeastern Massachusetts, including Cape Cod. Plymouth had total assets of approximately $1.5 billion at the time of our merger.
In 2007, we merged with Sharon Co-operative Bank, which operated one office serving the residents of Sharon and surrounding communities. Sharon Co-operative Bank had total assets of approximately $68 million at the time of our merger.
123
Table of Contents
In 2012, we merged with The Community Bank, which was headquartered in Brockton, Massachusetts and operated five retail banking offices in southeastern Massachusetts. The Community Bank had total assets of approximately $324 million at the time of our merger.
Eastern Insurance Group Acquisitions
We acquired Allied American Insurance Agency, Inc. (renamed Eastern Insurance Group LLC) in 2002 from the Arbella Insurance Group. From 2004 through 2018, we expanded Eastern Insurance Group by acquiring 31 independent insurance agencies. The purchase prices ranged from less than $1 million to $17.1 million, and the average purchase price was $3.9 million. The revenue of the acquired agencies ranged from less than $1 million to $10.1 million and the average revenue was $1.4 million.
Our Competitive Strengths
Abiding commitment to long-term, customer-centric relationships. We pride ourselves on understanding our customers’ financial needs and delivering a diverse suite of tailored, high-quality solutions through a consultative approach that fosters long-term relationships. We have served our communities for over 200 years, evolving from a traditional mutual savings bank serving a relatively narrow geographic region northeast of Boston to a full service commercial bank with a presence across eastern Massachusetts and southern New Hampshire. We believe that over time we have developed long-standing customer relationships and established a distinctive brand, which emphasizes our commitment to our community and social activism.
Well-positioned in attractive greater Boston market. The Boston MSA is one of the largest banking markets in the country with a high concentration of affluent, highly-educated individuals and successful businesses. It has a diverse and vibrant business community supported by world class higher education institutions. We believe we have distinguished ourselves in the market through our distinctive approach to banking, notably our focus on customers, commitment to community and diversity of our workforce. Our strong brand, reputation and client relationships have become key drivers of our performance in the market.
Stable, low-cost deposit base. We believe our business model of fostering deep client relationships and our long-standing position in our communities allows us to attract deposit customers that are focused on more than just price. As a result, we have a stable, low-cost deposit base. Our average cost of total deposits for the quarter ended March 31, 2020 was 0.23% compared to 0.84% for the peer group used by RP Financial, LC for purposes of its independent valuation discussed elsewhere in this prospectus. Our funding advantage and deep client relationships enable us to prudently deploy our liquidity into high-quality loans and to generate attractive returns. Generally, we do not take brokered deposits.
Strong capital and liquidity position. At March 31, 2020, our CET1 ratio was 12.42%, and our cash and securities as a percentage of assets was 18.77%. On a pro forma basis, giving effect to the offering and the proposed use of proceeds discussed elsewhere in this prospectus, we will be the most well-capitalized and most liquid bank in the peer group used by RP Financial, LC in its appraisal. Assuming an offering at the mid-point of the valuation range, our pro forma CET1 ratio of 24.52% will be 263 bps above the next most well-capitalized bank in that peer group as of March 31, 2020. We believe our strong capital position will serve as a strong foundation in a period of significant economic uncertainty like we are experiencing today, providing us the financial flexibility to continue to invest in our businesses and execute on our strategic initiatives. A large proportion of our balance sheet will be comprised of highly liquid assets, which will allow us to continue to meet customer liquidity and funding needs in times of stress.
Disciplined underwriting and risk management. We focus on originating high-quality loans for our clients, which we believe generate stable returns. We believe our experienced credit risk professionals and conservative credit culture, combined with centralized processes and consistent underwriting standards, have generally allowed us to maintain high asset quality. We believe we have positioned the company to successfully navigate a wide range of credit and interest rate environments, including the current uncertain economic environment due to the Covid-19 recession and current low interest rates. We have long maintained a diversified loan portfolio with limited industry or property type concentrations. Our loans to borrowers engaged in various wholesale trade businesses, including household appliances, alcoholic beverage wholesalers, and grocery wholesalers, represent the largest concentration among our commercial borrowers, constituting 12% of our commercial portfolio at March 31, 2020. Our largest property type concentration in our commercial real estate portfolio as of March 31, 2020 is multi-family at 19%.
124
Table of Contents
Culture of technological innovation. We believe our ability to innovate and integrate new products, services and technology distinguishes us from many of our similarly-sized peers. Important to our development and refinement of technology-driven products and services in recent years has been customizing the interface between our customers and our outsourced core data processing systems. By customizing the software that connects our digital platforms to our core system, we believe we are able to develop, test and deploy new features and products more quickly than many of our peers. In addition, during the Covid-19 global pandemic, we were able to quickly transition more than half our workforce to work remotely, with our technology team working closely with senior management to ensure that systems and applications were in place to support a secure remote work environment while meeting an unprecedented surge in customer needs.
Experienced management team supported by a high-performing and diverse workforce. We believe that we have a highly experienced leadership team with deep roots in our markets. Our management team, which on average has 30.9 years of experience working in banking or the financial services sector, has successfully operated through the full range of economic cycles. Complementing their experience at Eastern Bank, most of our executive officers have had prior management experience at other leading companies and institutions, including publicly-traded banking companies. Our leadership team is supported by a high quality, highly motivated, diverse set of managers and employees committed to delivering a strong customer value proposition. We are recognized as an employer of choice by providing employees with opportunities for advancement and growth in an attractive business environment.
Commitment to communities. We believe our strong commitment to our communities provides a competitive advantage by strengthening customer relationships and increasing loyalty. The communities in our footprint are one of our three core constituencies (along with our colleagues and customers). We support our communities in a number of ways: through extensive employee volunteer efforts; through our donations to the Eastern Bank Charitable Foundation, a private foundation we formed in 1994; through executives providing board leadership to community organizations; and through the Bank’s social justice advocacy work. The Eastern Bank Charitable Foundation, which had total assets of $111.8 million as of March 31, 2020, funds a range of non-profit organizations serving our communities and creates partnerships with other organizations to “scale up” key initiatives (such as enhancing early childhood education). For the three-year period ended December 31, 2019, Eastern Bank Charitable Foundation’s annual charitable donations averaged approximately $7.6 million. Our stock donation to the Foundation upon completion of the offering will allow the Foundation, and indirectly the communities that we serve, both now and in the future, to share in our long-term growth.
Our commitment to our community also is reflected in Eastern Bank’s latest FDIC Community Reinvestment Act (“CRA”) rating, which was “Outstanding.”
Business Strategy
Our goal is to enhance our position as one of the leading community banking institutions in our market, providing a broad array of banking and other financial services to retail, commercial and small business customers. In recent years, we have focused significant effort on and invested heavily in our infrastructure to create sophisticated and competitive products and services, a strong, experienced work force, and awareness of our banking brand.
As a result, we believe we are well positioned to capitalize on the opportunities available in our market by focusing on the following core strategies.
Develop new customer relationships and deepen existing relationships. We seek to expand our market share in existing and contiguous markets across our businesses by leveraging our distinctive brand and delivering a diverse suite of tailored, high-quality solutions through a consultative, relationship-based approach reinforced by superior customer service. We believe this will result in disciplined growth of low-cost deposits, loans with attractive risk-adjusted returns and a steady stream of fee income. Our relationship-based approach has enabled us to achieve disciplined organic growth over time, and we expect this trend to continue. We believe our support of our small business and non-profit customers in obtaining funding in April and May 2020 under the Paycheck Protection Program, also known as “PPP,” demonstrates both our commitment and capacity to meet our customers’ needs, even in the most challenging circumstance. The Small Business Administration, or “SBA,” approved all applications for PPP funding across the nation on a “first come, first served” basis. We believe that our experience as the largest SBA lender in New England made us effective in helping a large number of our customers avail themselves of the very attractive PPP loans. Through June 30, 2020, we originated approximately 8,100 PPP loans, representing $1.1 billion of aggregate PPP loans. The vast majority of our PPP borrowers are existing commercial and small business borrowers, non-profit customers, retail banking customers and clients of Eastern Wealth Management and Eastern Insurance Group LLC. Please refer to the section of this prospectus titled “Recent Developments—Covid-19 Impact” for additional information regarding our PPP loans as of June 30, 2020.
125
Table of Contents
Pursue opportunistic acquisitions. We intend to prudently pursue opportunities to acquire banks in our existing and contiguous markets that create attractive financial returns. Our focus will primarily be on franchises that enhance our funding profile, product capabilities or geographic density, while maintaining an acceptable risk profile. We believe the vital need to make increasingly significant technological investments has greatly amplified the importance of scale in banking. In addition, we believe that the Covid-19 pandemic recession will increase the rate of consolidation in the banking industry. We believe that after the offering we will be well-positioned as a consolidator in the banking market because of our financial strength, reputation and culture. In addition, we intend to continue to pursue opportunistic acquisitions of additional insurance agencies in existing and contiguous markets.
Leverage technology to enhance customer experience and drive operating efficiencies. We have made significant investments in our technology to ensure we can deliver high-quality, innovative products and services to our customers. For example, we have recently upgraded our Mobile Banking platform for both consumer and commercial customers. In addition, we have continued investing in our new commercial lending origination system and platform, and we intend to progressively improve our consumer lending origination platform as well. We are committed to regularly investing in technology and data analytics, as we are positioning our franchise for the future. We believe these investments will differentiate us with our target customers and provide a scalable platform, which will generate significant operating leverage as we grow over time.
Maintain and grow our experienced, diverse and customer focused employee base. We have an established corporate culture based on personal accountability, high ethical standards and a commitment to training and career development. We will look to opportunistically hire talented bankers and employees with a continued emphasis on recruiting highly motivated, diverse managers and employees who can establish and maintain long-term customer relationships that are key to our business, brand and culture.
Manage risk to navigate a range of economic environments, including the current Covid-19 pandemic recession. We believe that our conservative credit culture, strong capital and liquidity position, and our deep client relationships are key to our long-term financial success. We believe that stable long-term growth and profitability are the result of building strong customer relationships one at a time while maintaining superior credit discipline. We supplement our conservative risk culture with a rigorous and continuous enterprise risk management program. The current Covid-19 pandemic recession is resulting in material uncertainty in the near- and medium-term future. In addition, a sustained period of low interest rates will put pressure on our net interest margin. We believe we are entering this period of stress from a position of strength, which allows us to maintain a strong balance sheet while still supporting our customers and communities in need.
Lending Activities
Overview. This section should be read in conjunction with the description of our lending activities contained elsewhere in this prospectus. See the sections of this prospectus titled “Management’s Discussion and Analysis of Financial Condition and Results of Operations—Results of Operations—Banking Business” and “—Financial Position—Loans.”
Commercial and Industrial Loans. We offer a broad range of products, including lines of credit and term loans. We primarily target companies and institutions with annual revenues of $10 million to $200 million and strive to serve as the lead bank for customers with multi-product, long-term, profitable relationships with an emphasis on building long-term relationships.
The primary risk associated with commercial and industrial loans is the ability of borrowers to achieve business results consistent with those projected at origination. Loans are extended on both a secured and unsecured basis, according to the credit profile of the customer, and substantially all loans are floating rate loans at varying spreads over LIBOR and Prime rate. The average tenor of our commercial and industrial portfolio varies according to market conditions but currently stands at 5 years. We believe the portfolio is well diversified with over 1,341 commercial relationships and approximately $2.9 billion in commitments at March 31, 2020.
In managing our commercial and industrial loan portfolio, we focus on the size of the customer’s lending relationship, which we view as the aggregate amount of all loans and loan commitments outstanding to a commercial borrower and any related borrowers or guarantors. The average commercial and industrial lending relationship by balance at March 31, 2020, was $1.3 million. At March 31, 2020, our ten largest commercial and industrial lending relationships had an average balance of $34.1 million and ranged in size from $29.8 million to $41.4 million.
126
Table of Contents
Approximately 72% of our commercial and industrial loan exposure at March 31, 2020 was to customers headquartered within our primary lending market, which consists of eastern and central Massachusetts, southern New Hampshire including the seacoast region, and northern Rhode Island, although we participate in the syndicated loan market and the Shared National Credit (“SNC”) Program. Our regulators and Eastern Bank consider a SNC to be any loan or loan commitment for which the commitment amount aggregates $100 million or more; and which is shared by three or more federally supervised unaffiliated institutions under a formal lending agreement; or a portion of which is sold to two or more federally supervised unaffiliated institutions, with the purchasing institutions assuming their pro rata share of the credit risk. As of March 31, 2020, our SNC portfolio totaled $491.2 million, or 27.7% of our commercial and industrial portfolio, and 41.0% of our SNC portfolio were loans to borrowers headquartered in our primary lending market.
Our commercial and industrial portfolio also includes our Asset Based Lending Portfolio, which we refer to as the ABL Portfolio, that totaled $168.5 million as of March 31, 2020.
Commercial Real Estate Loans. Loans in this category include mortgage loans on commercial real estate, both investment and owner occupied. Property types financed include office, industrial, multi-family, affordable housing, retail, hotel and other type properties.
The average outstanding loan in our commercial real estate portfolio was approximately $2 million as of March 31, 2020, although we originate commercial real estate loans with balances significantly larger than this average. At March 31, 2020, our ten largest commercial real estate loans had an average balance of $22.1 million, ranging from $19.2 million to $25.6 million.
We focus our commercial real estate lending on properties within our primary market area, but we will originate commercial real estate loans on properties located outside this area based on an established relationship with a strong borrower. We intend to continue to grow our commercial real estate loan portfolio while maintaining prudent underwriting standards. In addition to originating these loans, we also participate in commercial real estate loans with other financial institutions. Such participations are underwritten in accordance with our policies before we will participate in such loans.
We originate a variety of fixed- and adjustable-rate commercial real estate loans with terms and amortization periods generally up to 30 years, which may include balloon loans. Interest rates and payments on most of our adjustable-rate loans are set based upon the 30-day LIBOR index plus a margin.
If we foreclose on a commercial real estate loan, the marketing and liquidation period to convert the real estate asset to cash can be a lengthy process with substantial holding costs. In addition, vacancies, deferred maintenance, repairs and market stigma can result in prospective buyers expecting sale price concessions to offset their real or perceived economic losses for the time it takes them to return the property to profitability. Depending on the individual circumstances, initial charge-offs and subsequent losses on commercial real estate loans can be unpredictable and substantial.
Commercial Construction Loans. Loans in this category include construction project financing and are comprised of commercial real estate, business banking and residential loans for the purpose of constructing and developing real estate. Substantially all of our commercial construction portfolio is in commercial real estate. The majority of the loans in this category, measured by the outstanding loan balance as of March 31, 2020, are secured by properties located in our primary lending area. At March 31, 2020, our ten largest construction loans had an average commitment of $17.2 million, ranging from $11 million to $25 million.
Most of our construction loans are interest-only loans that provide for the payment of interest during the construction phase, which is usually up to 36 months, although some construction loans are extended, generally for six to 12 months. At the end of the construction phase, the loan may convert to a permanent mortgage loan or the loan may be paid in full. Loans generally can be made with a maximum loan-to-value ratio of 75% of the appraised market value upon completion of the project. When appropriate to the underwriting, a “discounted cash flow analysis” is utilized. Before making a commitment to fund a construction loan, we require an appraisal of the property by an independent licensed appraiser for construction and land development loans in excess of $500,000. For larger loans, we also will generally require an inspection of the property by an Eastern Bank-appointed construction engineer before disbursement of funds during the term of the construction loan. Land development loans within the construction portfolio totaled $19.9 million as of March 31, 2020.
Small Business Loans. This category, which we refer to as “business banking,” is comprised of loans to small businesses with exposures of under $1 million and small investment real estate projects with exposures of under $3 million.
127
Table of Contents
A portion of our small business loans are guaranteed by the United States Small Business Administration, which we refer to as the SBA, through the SBA 7(a) loan program. The SBA 7(a) loan program supports, through a United States Government guarantee, some portion of the traditional commercial loan underwriting that might not be fully covered absent the guarantee. Eastern Bank is a Preferred Lender under the SBA’s PLP Program, which allows expedited underwriting and approval of SBA 7(a) Loans. For 2009-2019, Eastern Bank was distinguished as the highest producer of SBA 7(a) loans, in terms of loan volume, in New England. As of March 31, 2020, our SBA portfolio held 2,999 loans with $134.6 million outstanding.
One- to Four-Family Residential Real Estate Loans. Our one- to four-family residential real estate loan portfolio consists of mortgage loans that enable borrowers to purchase or refinance existing homes, most of which serve as the primary residence of the owner. At March 31, 2020, our ten largest one- to four-family residential real estate loans had an average balance of $2.4 million, ranging from $2.1 million to $2.8 million.
Our one- to four-family residential real estate loans generally do not have prepayment penalties. We did not offer loans with negative amortization and did not offer interest-only one- to four-family residential real estate loans, although we may provide for interest-only payments with respect to loan modifications.
Through a team of approximately 15 licensed mortgage loan officers, we originate residential loans either for sale to investors or to retain in our loan portfolio. Decisions about whether to sell or retain residential loans are made based on the interest rate characteristics, pricing for loans in the secondary mortgage market, competitive factors and our capital needs, although we generally retain non-conforming jumbo residential loans in our portfolio. Since 2016, we have outsourced to an independent party the processing, underwriting (using our criteria) and closing of residential loans originated by our mortgage loan officers.
We expect the amount of residential real estate loans that we originate and retain in our portfolio will increase after the offering.
Home Equity Loans and Lines of Credit. We offer home equity lines of credit with cumulative loan-to-value ratios generally up to 80%, when taking into account both the balance of the home equity line of credit and first mortgage loan. We maintain policy standards for minimum credit score and cash reserves and maximum loan to value consistent with a “prime” portfolio. For home equity loans and lines of credit originated in 2019, the average FICO score was 765.
Other Consumer Loans. Loans in this category consist of unsecured personal lines of credit, overdraft protection, automobile loans, and other personal loans. Loans in this category include loans originated through our indirect automobile lending program, which we began to exit in 2018 to improve our liquidity position and to reduce lower yielding loans.
Loan Sales and Purchases
We generally originate commercial loans for our portfolio, although we sell participation interests in commercial and industrial loans and commercial real estate loans to local financial institutions, primarily on the portion of loans exceeding our borrowing limits.
We generally do not purchase whole loans, but we will purchase loan participations from other financial institutions. During the years ended December 31, 2019 and 2018, we purchased $325 million and $245 million of loan participations, respectively, based on origination year-end balances. As of March 31, 2020, we held loan participation interests totaling $1.05 billion in loans originated by other lenders, consisting of $663 million of commercial and industrial loan participations, $311 million of commercial real estate loan participations, and $77 million of commercial construction loan participations.
Loan Approval Procedures and Authority
Our lending activities follow written, non-discriminatory, underwriting standards and loan origination procedures established by Eastern Bank’s Board of Directors and management. Eastern Bank’s Board of Directors has delegated loan approval authority to certain officers up to prescribed limits, depending on the officer’s experience, the type of loan and whether the loan is secured or unsecured. Loans to commercial relationships of $3 million and above require approval by credit managers. Loans to commercial relationships greater than $5 million up to our internal loans-to-one relationship limitation require approval by management’s Credit Committee. All business banking loans under $1.5 million are approved
128
Table of Contents
by credit officers, and all business banking loans over $1.5 million are approved by the Credit Committee. Loan policy exceptions are fully disclosed to the approving authority, either an individual officer or the appropriate management or credit committee prior to approval. Exceptions are reported to the Risk Management Committee quarterly.
Loans-to-One Borrower Limit and Loan Category Concentration
The maximum amount that we may lend to one borrower and the borrower’s related entities generally is limited, by statute, to 20% of our capital, which is defined under Massachusetts law as the sum of our capital stock, surplus account and undivided profits. At March 31, 2020, our regulatory limit on loans-to-one borrower was $331 million, and this limit will increase following the completion of the offering. As of March 31, 2020, our internal limits on loans-to-one borrower (and related entities) were:
| • | $25 million for commercial real estate loans; |
| • | $75 million for commercial real estate relationships; and |
| • | $40 million for commercial loans, including loans to non-profit entities. |
Although our regulatory lending limits will increase upon the completion of the offering, we do not expect our internal lending limits will increase materially for the foreseeable future after the offering.
Investment Activities
This section should be read in conjunction with the description of our investment activities contained elsewhere in this prospectus. See the section of this prospectus titled “Management’s Discussion and Analysis of Financial Condition and Results of Operations—Securities.”
Sources of Funds
Deposits and other interest-bearing liabilities. This section should be read in conjunction with the sections of this prospectus titled “Management’s Discussion and Analysis of Financial Condition and Results of Operations—Financial Position—Deposits and other interest-bearing liabilities” and “—Liquidity and Capital Resources.”
Borrowings. This section should be read in conjunction with the section of this prospectus titled “Management’s Discussion and Analysis of Financial Condition and Results of Operations—Financial Position—Borrowings” and “—Liquidity and Capital Resources.”
Eastern Wealth Management
Through Eastern Bank’s wealth management division, we offer a range of trust services, including managing customer investments, serving as custodian for customer assets, and providing other fiduciary services including serving as trustee and personal representative of estates. Our clients include individuals, trusts, businesses, employer-sponsored retirement plans and charitable organizations. Services offered include financial planning and portfolio management. At March 31, 2020, Eastern Bank held $2.4 billion of assets in a fiduciary, custodial or agency capacity for customers. These assets are not assets of Eastern Bank and therefore are not included in the consolidated balance sheets included in this prospectus. Eastern Wealth Management had 44 full-time equivalent employees as of March 31, 2020 and revenue of $5.1 million or approximately 3.66% of our revenues.
Eastern Insurance Group LLC
Eastern Insurance Group LLC, a wholly owned subsidiary of Eastern Bank, acts as an independent agent in offering personal, business and employee benefits insurance products to individual and commercial clients. Personal insurance products include life, accident and health, automobile, and property and liability insurance including fire, condominium, home and tenants, among others. Commercial insurance products include group life and health, commercial property and liability, surety, and workers compensation insurance, among others. Eastern Insurance Group LLC also offers a wide range of employee benefits products and services, including professional advice related to health care cost management, employee engagement and retirement and executive services. Eastern Insurance Group LLC represents many leading insurance companies. Eastern Insurance Group LLC operates through 22 non-branch offices in eastern Massachusetts, one office in Keene, New Hampshire, and one office in Providence, Rhode Island. As measured by revenue, Eastern Insurance Group LLC
129
Table of Contents
is the third largest insurance agency in Massachusetts, the twenty-fourth largest insurance agency in the United States, and the third largest insurance agency in the United States owned by a banking company.
Eastern Insurance Group LLC routinely acquires smaller insurance agencies in existing and adjacent markets. During the five-year period ended December 31, 2019, Eastern Insurance Group LLC acquired 12 insurance agencies for an average purchase price of $3.3 million. On average the agencies acquired during that period had annual revenue of $1.4 million. We expect that a portion of the proceeds of the offering will be used to fund additional acquisitions by Eastern Insurance Group LLC. We expect to continue the same strategies for insurance agency acquisitions in the future.
Competition
The financial services industry in general and in our market in particular is highly competitive. We face significant competition in gathering deposits and originating loans. Our most direct competition for deposits has historically come from banking institutions operating in our primary market area. Based on data from the FDIC as of June 30, 2019 (the latest date for which information is available), we had a weighted average market share of 2.48% for the seven separate banking markets tracked by the Federal Reserve Board in which we have at least one branch. In the Boston market, which accounted for 91.8% of our deposits as of June 30, 2019, our market share was 2.41%, representing the seventh largest deposit share in that market. We also face competition for deposits from other financial service companies such as securities brokerage firms, credit unions, insurance companies and money market funds.
In consumer banking, the industry has become increasingly dependent on and oriented towards technology-driven delivery systems, permitting transactions to be conducted through a wide variety of online and mobile channels. In addition, technology has lowered the barriers to entry and made it possible for non-bank institutions to attract funds and provide lending and other financial services in our market despite not having a physical presence here. Given their lower cost structure, non-bank institutions that choose to solicit deposits primarily through digital platforms often are able to offer rates on deposit products that are higher than average for retail banking institutions with a traditional branch footprint, such as us. The primary factors driving competition for consumer loans and deposits are interest rates, fees charged, customer service levels, convenience, including branch location and hours of operation, and the range of products and services offered.
There is similarly intense competition in commercial banking, particularly for quality loan originations from traditional banking institutions such as large regional banks, as well as commercial finance companies, leasing companies, insurance companies and other non-bank lenders, and institutional investors including collateralized loan obligation managers. Some larger competitors, including some of the largest banks in the United States, have a significant and, in many cases, growing presence in our market area, may offer a broader array of products and, due to their asset size, may sometimes be in a position to hold more exposure on their own balance sheets. We compete on a number of factors including, among others, customer service, quality of execution, range of products offered, price and reputation. We expect competition to continue to increase, especially as a result of regulatory and technological changes and the continuing trend of consolidation in the financial services industry. Increased competition for deposits and the origination of loans could limit our growth in the future.
Personnel
As of March 31, 2020, we had 1,676 full-time and 187 part-time employees, none of whom is represented by a collective bargaining unit.
Subsidiaries
Upon the completion of the offering, the only entity controlled directly by Eastern Bankshares, Inc. will be Eastern Bank, which will be a wholly owned subsidiary. Eastern Bank controls four active subsidiaries in addition to Eastern Insurance Group LLC. Two wholly owned subsidiaries, Broadway Securities Corporation and Market Street Securities Corporation, are engaged in buying, selling, dealing in and holding securities. Real/Property Services, Inc. is a wholly owned subsidiary of Eastern Bank that provides real estate services to Eastern Bank.
Eastern Bank also owns an entity called “Shared Value Investments LLC,” which owns BCC Solar III Investment Fund, LLC, which in turn owns BCC NMTC CDE XXII, LLC, a company that invests in a solar community development entity (CDE). Eastern Bank’s investment in this entity provides funding for the construction of solar energy facilities in a manner to
130
Table of Contents
qualify for renewable energy investment tax credits. Eastern Bank’s investment in Shared Value Investments LLC at March 31, 2020 totaled $46.9 million.
Legal and Regulatory Proceedings
We operate in a legal and regulatory environment that exposes us to potentially significant risks. In addition to the matters described below, in the normal course of business, we are named, from time to time, as a defendant in various legal actions, including class actions and other individual litigation matters, arising in connection with our activities as a banking institution, including with respect to allegations of unfair or deceptive business practices and our role in administering trusts for which we are a trustee alone or with others. We also face legal exposure associated with employment actions, which at times can result in matters against Eastern Bank before the Massachusetts Commission Against Discrimination or Equal Employment Opportunity Commission. Actual or threatened legal actions against us include claims for substantial amounts of compensatory damages, claims for intermediate amounts of compensatory damages and claims for punitive damages. For additional information, see Note 13 “Commitments and Contingencies” to our audited consolidated financial statements included elsewhere in this prospectus.
In part as a result of the extensive regulation, supervision and examination of our business described elsewhere in this prospectus, we are also involved, from time to time, in other reviews, investigations and proceedings (both formal and informal) by governmental and self-regulatory agencies regarding our business, certain of which may result in adverse judgments, settlements, fines, penalties, public or private censure, increased costs, required remediation, restriction on business activities or other impacts on us.
We contest liability and the amount of damages as appropriate in each pending matter. Where available information indicates that it is probable a liability has been incurred at the date of the consolidated financial statements and we can reasonably estimate the amount of that loss, we accrue the estimated loss as a charge to income.
In many proceedings, however, it is inherently difficult to determine whether any loss is probable or even possible or to estimate the amount of any loss. We cannot predict with certainty if, how or when such proceedings will be resolved or what the eventual settlement, fine, penalty or other relief, if any, may be, particularly for proceedings that are in their early stages of development or where plaintiffs seek substantial or indeterminate damages. Numerous issues may need to be resolved before liability can be reasonably estimated, including through potentially lengthy discovery and determination of important factual matters, determination of issues related to class certification and the calculation of damages and by addressing novel or unsettled legal questions relevant to the proceedings in question.
The activities of Eastern Bank, including with respect to disclosures about and implementation of numerous consumer products are subject to various laws and numerous regulations, including those related to unfair or deceptive acts or practices. If Eastern Bank is found to have violated one or more consumer protection laws, it may be required to pay restitution to certain affected customers in connection with certain of these practices. In addition, Eastern Bank may face formal administrative enforcement actions from their federal and other governmental supervisory agencies, including the assessment of civil monetary penalties and restitution, relating to consumer products, and could also face potential civil litigation. For further information regarding risks related to regulatory actions and litigation, please refer to “Risk Factors—Risks Related to Our Business—Operational risks are inherent in our businesses,” “Risk Factors—Risks Related to Regulations—Our business is highly regulated, which could limit or restrict our activities and impose financial requirements or limitations on the conduct of our business,” and “Risk Factors—Risks Related to Regulations—We are subject to numerous laws designed to protect consumers, including the Community Reinvestment Act and fair lending laws, and failure to comply with these laws could lead to a wide variety of sanctions.”
Properties
At March 31, 2020, we conducted our banking business through our main office and 89 branch offices located in eastern Massachusetts and southern New Hampshire. In addition, Eastern Bank occupies two administrative/operational offices, in Lynn and Brockton, Massachusetts. Eastern Insurance Group LLC operates through 22 non-branch offices in eastern Massachusetts, one office in Keene, New Hampshire, and one office in Providence, Rhode Island. At March 31, 2020, we leased 103 of our offices, and the total net book value of our land, buildings, furniture, fixtures and equipment was $41.8 million.
131
Table of Contents
We are subject to the extensive regulatory framework applicable to bank holding companies and their subsidiaries. This framework is intended primarily for the protection of depositors, the FDIC’s Deposit Insurance Fund and the banking system as a whole, and generally is not intended for the protection of stockholders or other investors. Described below are the material elements of selected laws and regulations applicable to us and our subsidiaries. These descriptions are not intended to be complete and are qualified in their entirety by reference to the full text of the statutes and regulations described. Changes in applicable law or regulation, and in their interpretation and application by regulatory agencies and other governmental authorities, cannot be predicted, but may have a material effect on our business, financial condition or results of operations.
General
Eastern Bank is a Massachusetts-chartered non-member bank. Eastern Bank’s deposits are insured up to applicable limits by the Federal Deposit Insurance Corporation, which we refer to as the FDIC. Eastern Bank is subject to extensive regulation by the Massachusetts Commissioner of Banks, as its chartering authority, and by the FDIC, as its primary federal regulator. Eastern Bank is required to file reports with, and is periodically examined by, the FDIC and the Massachusetts Commissioner of Banks concerning its activities and financial condition and must obtain regulatory approvals prior to entering into certain transactions, including, but not limited to, mergers with or acquisitions of other financial institutions. Eastern Bank is a member of the Federal Home Loan Bank of Boston.
Eastern Bank is subject to federal and state regulation and supervision that establishes a comprehensive framework of activities in which an insured state-chartered bank can engage and is intended primarily for the protection of depositors and borrowers and, for purposes of the FDIC, the protection of the insurance fund. The regulatory structure also gives both federal and state regulatory authorities extensive discretion in connection with their supervisory and enforcement activities and examination policies, including policies with respect to the classification of assets and the establishment of adequate loan loss reserves for regulatory purposes.
As a bank holding company following the conversion, Eastern Bankshares, Inc. will be required to comply with the rules and regulations of the Federal Reserve Board. It will be required to file certain reports with the Federal Reserve Board and will be subject to examination by and the enforcement authority of the Federal Reserve Board. Eastern Bankshares, Inc. will also be subject to the rules and regulations of the Securities and Exchange Commission under the federal securities laws.
Any change in applicable laws or regulations, whether by the Massachusetts Commissioner of Banks, the FDIC, the Federal Reserve Board, the General Court of the Commonwealth of Massachusetts (the Massachusetts state legislature) or the United States Congress, could have a material adverse impact on the operations and financial performance of Eastern Bankshares, Inc. and Eastern Bank. In addition, Eastern Bankshares, Inc. and Eastern Bank will be affected by the monetary and fiscal policies of various agencies of the United States Government, including the Federal Reserve Board. In view of changing conditions in the national economy and in the money markets, it is impossible for management to accurately predict future changes in monetary policy or the effect of such changes on the business or financial condition of Eastern Bankshares, Inc. and Eastern Bank.
Set forth below is a brief description of material regulatory requirements that are or will be applicable to Eastern Bank and Eastern Bankshares, Inc. The description is limited to certain material aspects of the statutes and regulations addressed, and is not intended to be a complete description of such statutes and regulations and their effects on Eastern Bank and Eastern Bankshares, Inc.
Massachusetts Banking Laws and Supervision
Eastern Bank, as a Massachusetts-chartered bank, is regulated and supervised by the Massachusetts Commissioner of Banks. The Massachusetts Commissioner of Banks is required to regularly examine each state-chartered bank. The approval of the Massachusetts Commissioner of Banks is required to establish or close branches, to merge with another bank, to issue stock and to undertake many other activities. Any Massachusetts bank that does not operate in accordance with the regulations, policies and directives of the Massachusetts Commissioner of Banks may be sanctioned. The Massachusetts Commissioner of Banks may suspend or remove directors or officers of a Massachusetts-chartered bank who have violated the law, conducted a bank’s business in a manner that is unsafe, unsound or contrary to the depositors’ interests, or been
132
Table of Contents
negligent in the performance of their duties. In addition, the Massachusetts Commissioner of Banks has the authority to appoint a receiver or conservator if it is determined that the bank is conducting its business in an unsafe or unauthorized manner, and under certain other circumstances.
The powers that Massachusetts-chartered banks can exercise under these laws include, but are not limited to, the following.
Lending Activities. A Massachusetts-chartered bank may make a wide variety of mortgage loans including fixed-rate loans, adjustable-rate loans, variable-rate loans, participation loans, graduated payment loans, construction and development loans, condominium and co-operative loans, second mortgage loans and other types of loans that may be made in accordance with applicable regulations. Commercial loans may be made to corporations and other commercial enterprises with or without security. Consumer and personal loans may also be made with or without security.
Insurance Sales. Massachusetts-chartered banks may engage in insurance sales activities if the Massachusetts Commissioner of Banks has approved a plan of operation for insurance activities and the bank obtains a license from the Massachusetts Division of Insurance. Massachusetts-chartered banks may be licensed directly or indirectly through an affiliate or a subsidiary corporation established for this purpose. Eastern Bank has received approval for insurance sales activities, and offers a variety of personal and business insurance products and services through its wholly-owned subsidiary, Eastern Insurance Group LLC, a licensed insurance agency. Eastern Insurance Group LLC has also obtained all licenses required by various state insurance regulatory authorities in other states that license, regulate and supervise insurance producers, brokers and agents.
Investment Activities. In general and subject to constraints under federal law, Massachusetts-chartered banks may invest in preferred and common stock of any corporation organized under the laws of the United States or any state provided such investments do not involve control of any corporation and do not, in the aggregate, exceed 4.0% of the bank’s deposits and have separate authority to invest up to 15% of the bank’s assets in stock listed on a national stock exchange in the United States. Massachusetts-chartered banks may additionally invest an amount equal to 1.0% of their deposits in stocks of Massachusetts corporations or companies with substantial employment in the Commonwealth which have pledged to the Massachusetts Commissioner of Banks that such monies will be used for further development within the Commonwealth. At the present time, Eastern Bank has the authority under state law to invest in equity securities. However, such investment authority is constrained by federal law. See the subsection titled “—Federal Bank Regulation—Investment Activities” for such federal restrictions.
Dividends. Massachusetts-chartered banks may declare from net profits cash dividends not more frequently than quarterly and non-cash dividends at any time. No dividends may be declared, credited or paid if the bank’s capital stock is impaired. Massachusetts-chartered banks with outstanding preferred stock may not, without the prior approval of the Commissioner of Banks, declare dividends to the common stock without also declaring dividends to the preferred stock. The approval of the Massachusetts Commissioner of Banks is required if the total of all dividends declared in any calendar year exceeds the total of its net profits for that year combined with its retained net profits of the preceding two years, less any required transfer to surplus or a fund for the retirement of any preferred stock. Net profits for this purpose means the remainder of all earnings from current operations plus actual recoveries on loans and investments and other assets after deducting current operating expenses, actual losses, accrued dividends on preferred stock, if any, and all federal and state taxes. Eastern Bankshares, Inc. shall not declare or pay a cash dividend on, or repurchase any of, its capital stock if the effect thereof would cause its net worth to be reduced below (i) the amount required for the Liquidation Account or (ii) the regulatory capital requirements of Eastern Bankshares, Inc. (to the extent applicable).
Protection of Personal Information. Massachusetts has adopted regulatory requirements intended to protect personal information. The requirements are similar to existing federal laws such as the Gramm-Leach-Bliley Act, discussed below under “—Federal Bank Regulation—Privacy Regulations.” They require organizations to establish written information security programs to prevent identity theft and other fraud. The Massachusetts regulation also contains technology system security requirements, especially for the encryption of personal information sent over wireless or public networks or stored on portable devices.
Parity Approval. Massachusetts-chartered banks may, in accordance with Massachusetts law, exercise any power and engage in any activity that has been authorized for national banks, federal thrifts or state banks in a state other than Massachusetts, provided that the activity is permissible under applicable federal law and not specifically prohibited by
133
Table of Contents
Massachusetts law. Such powers and activities must be subject to the same limitations and restrictions imposed on the national bank, federal thrift or out-of-state bank that exercised the power or activity. A Massachusetts bank may exercise such powers, and engage in such activities by providing 30 days’ advanced written notice to the Massachusetts Commissioner of Banks.
Loans to One Borrower Limitations. Massachusetts banking law grants broad lending authority. However, with certain limited exceptions, total obligations of one borrower to a bank may not exceed 20.0% of the total of the bank’s capital, which is defined under Massachusetts law as the sum of the bank’s capital stock, surplus account and undivided profits.
Loans to a Bank’s Insiders. Under Massachusetts law, a Massachusetts-chartered bank must comply with Regulation O of the Federal Reserve Board and the Commissioner of Banks retains examination and enforcement authority to ensure compliance. Regulation O generally requires that extensions of credit to insiders:
| • | be made on terms that are substantially the same as, and follow credit underwriting procedures that are not less stringent than, those prevailing for comparable transactions with unaffiliated persons and that do not involve more than the normal risk of repayment or present other unfavorable features; |
| • | not exceed certain limitations on the amount of credit extended to such persons, individually and in the aggregate, which limits are based, in part, on the amount of the Massachusetts financial institution’s capital; and |
| • | meet other definitional and procedural requirements as specified in the regulation. |
Regulatory Enforcement Authority. Any Massachusetts-chartered bank that does not operate in accordance with the regulations, policies and directives of the Massachusetts Commissioner of Banks may be subject to sanctions for non-compliance, including seizure of the property and business of the bank, imposition of a conservatorship or revocation of its charter. The Massachusetts Commissioner of Banks may, under certain circumstances, suspend or remove officers or directors who have violated the law, conducted the bank’s business in a manner which is unsafe, unsound or contrary to the depositors’ interests or been negligent in the performance of their duties. In addition, upon finding that a bank has engaged in an unfair or deceptive act or practice, the Massachusetts Commissioner of Banks may issue an order to cease and desist and impose a fine on the bank concerned. Massachusetts consumer protection and civil rights statutes applicable to Eastern Bank permit private individual and class action law suits and provide for the rescission of consumer transactions, including loans, and the recovery of statutory and punitive damage and attorney’s fees in the case of certain violations of those statutes.
Massachusetts has other statutes and regulations that are similar to the federal provisions discussed below.
Federal Bank Regulation
Capital Requirements. Federal regulations require FDIC-insured depository institutions to meet several minimum capital standards: a common equity Tier 1 capital to risk-based assets ratio of 4.5%, a Tier 1 capital to risk-based assets ratio of 6.0%, a total capital to risk-based assets ratio of 8%, and a Tier 1 capital to average assets leverage ratio of 4%.
For purposes of the regulatory capital requirements, common equity Tier 1 capital is generally defined as common stockholders’ equity and retained earnings. Tier 1 capital is generally defined as common equity Tier 1 and additional Tier 1 capital. Additional Tier 1 capital includes certain noncumulative perpetual preferred stock and related surplus and minority interests in equity accounts of consolidated subsidiaries. Total capital includes Tier 1 capital (common equity Tier 1 capital plus additional Tier 1 capital) and Tier 2 capital. Tier 2 capital is comprised of capital instruments and related surplus, meeting specified requirements, and may include cumulative preferred stock and long-term perpetual preferred stock, mandatory convertible securities, intermediate preferred stock and subordinated debt. Also included in Tier 2 capital is the allowance for loan and lease losses limited to a maximum of 1.25% of risk-weighted assets and, for institutions that made such an election regarding the treatment of Accumulated Other Comprehensive Income (“AOCI”), up to 45% of net unrealized gains on available-for-sale equity securities with readily determinable fair market values. Institutions that have not exercised the AOCI opt-out have AOCI incorporated into common equity Tier 1 capital (including unrealized gains and losses on available-for-sale-securities). Eastern Bankshares will exercise the opt-out and therefore will not include AOCI in its regulatory capital determinations. Calculation of all types of regulatory capital is subject to deductions and adjustments specified in the regulations.
In determining the amount of risk-weighted assets for purposes of calculating risk-based capital ratios, all assets, including certain off-balance sheet assets (e.g., recourse obligations, direct credit substitutes, residual interests) are multiplied
134
Table of Contents
by a risk weight factor assigned by the regulations based on the risks believed inherent in the type of asset. Higher levels of capital are required for asset categories believed to present greater risk. For example, a risk weight of 0% is assigned to cash and United States government securities, a risk weight of 50% is generally assigned to prudently underwritten first lien one to four- family residential mortgages, a risk weight of 100% is assigned to commercial and consumer loans, a risk weight of 150% is assigned to certain past due loans and a risk weight of between 0% to 600% is assigned to permissible equity interests, depending on certain specified factors.
In addition to establishing the minimum regulatory capital requirements, the regulations limit capital distributions and certain discretionary bonus payments to management if the institution does not hold a “capital conservation buffer” consisting of 2.5% of common equity Tier 1 capital to risk-weighted assets above the amount necessary to meet its minimum risk-based capital requirements. The capital conservation buffer requirement began being phased in starting on January 1, 2016 at 0.625% of risk-weighted assets and increased each year until fully implemented at 2.5% on January 1, 2019. At March 31, 2020, Eastern Bank exceeded the fully phased in regulatory requirement for the capital conservation buffer.
The FDIC Improvement Act required each federal banking agency to revise its risk-based capital standards for insured institutions to ensure that those standards take adequate account of interest-rate risk, concentration of credit risk, and the risk of nontraditional activities, as well as to reflect the actual performance and expected risk of loss on multi-family residential loans. The FDIC, along with the other federal banking agencies, adopted a regulation providing that the agencies will take into account the exposure of a bank’s capital and economic value to changes in interest rate risk in assessing a bank’s capital adequacy. The FDIC also has authority to establish individual minimum capital requirements in appropriate cases upon determination that an institution’s capital level is, or is likely to become, inadequate in light of the particular circumstances.
Standards for Safety and Financial Weakness. As required by statute, the federal banking agencies adopted final regulations and Interagency Guidelines Establishing Standards for Safety and Financial weakness to implement safety and financial weakness standards. The guidelines set forth the safety and financial weakness standards that the federal banking agencies use to identify and address problems at insured depository institutions before capital becomes impaired. The guidelines address internal controls and information systems, internal audit systems, credit underwriting, loan documentation, interest rate exposure, asset growth, asset quality, earnings and compensation, fees and benefits. The agencies have also established standards for safeguarding customer information. If the appropriate federal banking agency determines that an institution fails to meet any standard prescribed by the guidelines, the agency may require the institution to submit to the agency an acceptable plan to achieve compliance with the standard.
Investment Activities. All state-chartered FDIC-insured banks, including Massachusetts-chartered banks, are generally limited in their investment activities to principal and equity investments of the type and in the amount authorized for national banks, notwithstanding state law, subject to certain exceptions. For example, state-chartered banks may, with FDIC approval, continue to exercise state authority that was in existence as of September 30, 1991, to invest in common or preferred stocks listed on a national securities exchange and in the shares of an investment company registered under the Investment Company Act of 1940, as amended. The maximum permissible investment is 100% of Tier 1 Capital, as specified by the FDIC’s regulations, or the maximum amount permitted by Massachusetts law, whichever is less.
In addition, the FDIC is authorized to permit such a state bank to engage in state-authorized activities or investments not permissible for national banks (other than non-subsidiary equity investments) if it meets all applicable capital requirements and it is determined that such activities or investments do not pose a significant risk to the Deposit Insurance Fund. The FDIC has adopted procedures for institutions seeking approval to engage in such activities or investments. In addition, a nonmember bank may control a subsidiary that engages in activities as principal that would only be permitted for a national bank to conduct in a “financial subsidiary” if a bank meets specified conditions and deducts its investment in the subsidiary for regulatory capital purposes.
Interstate Banking and Branching. Federal law permits well capitalized and well managed bank holding companies to acquire banks in any state, subject to Federal Reserve Board approval, certain concentration limits and other specified conditions. Interstate mergers of banks are also authorized, subject to regulatory approval and other specified conditions. In addition, recent amendments made by the Dodd-Frank Act permit banks to establish de novo branches on an interstate basis to the extent that branching is authorized by the law of the host state for the banks chartered by that state.
Prompt Corrective Regulatory Action. Federal law requires, among other things, that federal bank regulatory authorities take “prompt corrective action” with respect to banks that do not meet minimum capital requirements. For these purposes,
135
Table of Contents
the law establishes five capital categories: well capitalized, adequately capitalized, undercapitalized, significantly undercapitalized and critically undercapitalized.
The FDIC has adopted regulations to implement the prompt corrective action legislation. An institution is deemed to be “well capitalized” if it has a total risk-based capital ratio of 10.0% or greater, a Tier 1 risk-based capital ratio of 8.0% or greater, a common equity Tier 1 ratio of 6.5% or greater and a leverage ratio of 5.0% or greater. An institution is “adequately capitalized” if it has a total risk-based capital ratio of 8.0% or greater, a Tier 1 risk-based capital ratio of 6.0% or greater, a common equity Tier 1 ratio of 4.5% or greater and a leverage ratio of 4.0% or greater. An institution is “undercapitalized” if it has a total risk-based capital ratio of less than 8.0%, a Tier 1 risk-based capital ratio of less than 6.0%, a common equity Tier 1 ratio of less than 4.5% or a leverage ratio of less than 4.0%. An institution is deemed to be “significantly undercapitalized” if it has a total risk-based capital ratio of less than 6.0%, a Tier 1 risk-based capital ratio of less than 4.0%, a common equity Tier 1 ratio of less than 3.0% or a leverage ratio of less than 3.0%. An institution is considered to be “critically undercapitalized” if it has a ratio of tangible equity (as defined in the regulations) to total assets that is equal to or less than 2.0%. As of March 31, 2020, Eastern Bank was a “well capitalized” institution under FDIC regulations.
At each successive lower capital category, an insured depository institution is subject to more restrictions and prohibitions, including restrictions on growth, restrictions on interest rates paid on deposits, restrictions or prohibitions on payment of dividends, and restrictions on the acceptance of brokered deposits. Furthermore, if an insured depository institution is classified in one of the undercapitalized categories, it is required to submit a capital restoration plan to the appropriate federal banking agency, and the holding company must guarantee the performance of that plan. Based upon its capital levels, a bank that is classified as well-capitalized, adequately capitalized, or undercapitalized may be treated as though it were in the next lower capital category if the appropriate federal banking agency, after notice and opportunity for hearing, determines that an unsafe or unsound condition, or an unsafe or unsound practice, warrants such treatment. An undercapitalized bank’s compliance with a capital restoration plan is required to be guaranteed by any company that controls the undercapitalized institution in an amount equal to the lesser of 5.0% of the institution’s total assets when deemed undercapitalized or the amount necessary to achieve the status of adequately capitalized. If an “undercapitalized” bank fails to submit an acceptable plan, it is treated as if it is “significantly undercapitalized.” “Significantly undercapitalized” banks must comply with one or more of a number of additional restrictions, including but not limited to an order by the FDIC to sell sufficient voting stock to become adequately capitalized, requirements to reduce total assets, cease receipt of deposits from correspondent banks or dismiss directors or officers, and restrictions on interest rates paid on deposits, compensation of executive officers and capital distributions by the parent holding company. “Critically undercapitalized” institutions are subject to additional measures including, subject to a narrow exception, the appointment of a receiver or conservator within 270 days after it obtains such status.
Transaction with Affiliates and Regulation W of the Federal Reserve Board Regulations. Transactions between banks and their affiliates are governed by federal law. An affiliate of a bank is any company or entity that controls, is controlled by or is under common control with the bank. In a holding company context, the parent bank holding company and any companies which are controlled by such parent holding company are affiliates of the bank (although subsidiaries of the bank itself, except financial subsidiaries, are generally not considered affiliates). Generally, Section 23A of the Federal Reserve Act and the Federal Reserve Board’s Regulation W limit the extent to which the bank or its subsidiaries may engage in “covered transactions” with any one affiliate to an amount equal to 10.0% of such institution’s capital stock and surplus, and with all such transactions with all affiliates to an amount equal to 20.0% of such institution’s capital stock and surplus. Section 23B applies to “covered transactions” as well as to certain other transactions and requires that all such transactions be on terms substantially the same, or at least as favorable, to the institution or subsidiary as those provided to a non-affiliate. The term “covered transaction” includes the making of loans to, purchase of assets from, and issuance of a guarantee to an affiliate, and other similar transactions. Section 23B transactions also include the provision of services and the sale of assets by a bank to an affiliate. In addition, loans or other extensions of credit by the financial institution to the affiliate are required to be collateralized in accordance with the requirements set forth in Section 23A of the Federal Reserve Act.
Sections 22(h) and (g) of the Federal Reserve Act place restrictions on loans to a bank’s insiders, i.e., executive officers, directors and principal shareholders. Under Section 22(h) of the Federal Reserve Act, loans to a director, an executive officer and to a greater than 10.0% shareholder of a financial institution, and certain affiliated interests of these, together with all other outstanding loans to such person and affiliated interests, may not exceed specified limits. Section 22(h) of the Federal Reserve Act also requires that loans to directors, executive officers and principal shareholders be made on terms and conditions substantially the same as offered in comparable transactions to persons who are not insiders and also requires prior board approval for certain loans. In addition, the aggregate amount of extensions of credit by a financial institution to
136
Table of Contents
insiders cannot exceed the institution’s unimpaired capital and surplus. Section 22(g) of the Federal Reserve Act places additional restrictions on loans to executive officers.
Enforcement. The FDIC has extensive enforcement authority over insured state-chartered banks, including Eastern Bank. The enforcement authority includes, among other things, the ability to assess civil money penalties, issue cease and desist orders and remove directors and officers. In general, these enforcement actions may be initiated in response to violations of laws and regulations, breaches of fiduciary duty and unsafe or unsound practices. The FDIC is required, with certain exceptions, to appoint a receiver or conservator for an insured state nonmember bank if that bank was “critically undercapitalized” on average during the calendar quarter beginning 270 days after the date on which the institution became “critically undercapitalized.” The FDIC may also appoint itself as conservator or receiver for an insured state non-member bank under specified circumstances, including: insolvency; substantial dissipation of assets or earnings through violations of law or unsafe or unsound practices; existence of an unsafe or unsound condition to transact business; insufficient capital; or the incurrence of losses that will deplete substantially all of the institution’s capital with no reasonable prospect of replenishment without federal assistance.
Federal Insurance of Deposit Accounts. Eastern Bank is a member of the Deposit Insurance Fund, which is administered by the FDIC. Deposit accounts in Eastern Bank are insured up to a maximum of $250,000 for each separately insured depositor.
The FDIC assesses deposit insurance premiums on each insured institution quarterly based on risk characteristics of the institution. As a bank with assets of more than $10 billion, Eastern Bank is subject to a deposit assessment based on a scorecard issued by the FDIC. This scorecard considers, among other things, Eastern Bank’s rating under the Federal Financial Institutions Examination Council’s Uniform Financial Institutions Rating System or CAMELS rating, results of asset-related stress testing and funding-related stress, as well as our use of core deposits, among other things. Depending on the results of Eastern Bank’s performance under that scorecard, the total base assessment rate is between 1.5 and 40 basis points. The FDIC may also impose a special assessment in an emergency situation.
Pursuant to the Dodd-Frank Act, the FDIC has established 2.0% as the designated reserve ratio (“DRR”), which is the ratio of the Deposit Insurance Fund to insured deposits of the total industry. In March 2016, the FDIC adopted final rules designed to meet the statutory minimum DRR of 1.35% by September 30, 2020, the deadline imposed by the Dodd-Frank Act. The Dodd-Frank Act requires the FDIC to offset the effect on institutions with assets of less than $10 billion of the increase in the statutory minimum DRR to 1.35% from the former statutory minimum of 1.15%. The FDIC’s rules reduced assessment rates on all banks but imposed a surcharge on banks with assets of $10 billion or more until the DRR reaches 1.35% and will provide assessment credits to banks with assets of less than $10 billion for the portion of their assessments that contribute to the increase of the DRR to 1.35%. The rules also changed the method to determine risk-based assessment rates for established banks with less than $10 billion in assets to better ensure that banks taking on greater risks pay more for deposit insurance than less risky banks. The reserve ratio reached 1.36% on September 30, 2018, and as a result the surcharge on banks with assets of $10 billion or more ceased with the first assessment invoice in 2019. In addition, once the DRR reaches 1.38%, the FDIC will apply the assessment credits to banks that had assets below $10 billion at any time during the credit calculation period, which includes Eastern Bank.
The FDIC has authority to increase insurance assessments. A significant increase in insurance premiums would likely have an adverse effect on the operating expenses and results of operations of Eastern Bank. Future insurance assessment rates cannot be predicted.
Insurance of deposits may be terminated by the FDIC upon a finding that the institution has engaged in unsafe or unsound practices, is in an unsafe or unsound condition to continue operations or has violated any applicable law, regulation, rule order or regulatory condition imposed in writing. We do not know of any practice, condition or violation that might lead to termination of deposit insurance.
Privacy Regulations. FDIC regulations generally require that Eastern Bank disclose its privacy policy, including identifying with whom it shares a customer’s “non-public personal information,” to customers at the time of establishing the customer relationship and annually thereafter. In addition, Eastern Bank is required to provide its customers with the ability to “opt-out” of having their personal information shared with unaffiliated third parties and not to disclose account numbers or access codes to non-affiliated third parties for marketing purposes. Eastern Bank currently has a privacy protection policy in place and believes that such policy is in compliance with the regulations.
137
Table of Contents
Community Reinvestment Act. Under the Community Reinvestment Act, or CRA, as implemented by FDIC regulations, Eastern Bank as a non-member bank has a continuing and affirmative obligation, consistent with its safe and sound operation, to help meet the credit needs of its entire community, including low- and moderate-income neighborhoods. The CRA does not establish specific lending requirements or programs for financial institutions nor does it limit an institution’s discretion to develop the types of products and services that it believes are best suited to its particular community, consistent with the CRA. The CRA does require the FDIC, in connection with its examination of a non-member bank, to assess the institution’s record of meeting the credit needs of its community and to take such record into account in its evaluation of certain applications by such institution, including applications to acquire branches and other financial institutions. The CRA requires the FDIC to provide a written evaluation of an institution’s CRA performance utilizing a four-tiered descriptive rating system. Eastern Bank’s latest FDIC CRA rating was “Outstanding.”
Massachusetts has its own statutory counterpart to the CRA which is also applicable to Eastern Bank. The Massachusetts version is generally similar to the CRA but utilizes a five-tiered descriptive rating system. Massachusetts law requires the Massachusetts Commissioner of Banks to consider, but not be limited to, a bank’s record of performance under Massachusetts law in considering any application by the bank to establish a branch or other deposit-taking facility, to relocate an office or to merge or consolidate with or acquire the assets and assume the liabilities of any other banking institution. Eastern Bank’s most recent rating under Massachusetts law was “Outstanding.”
On January 9, 2020, the FDIC and the Office of the Comptroller of the Currency published a Notice of Proposed Rulemaking that would substantially amend their respective Community Reinvestment Act regulations. The Federal Reserve did not join in the Community Reinvestment Act Notice of Proposed Rulemaking. It is unclear whether a final rule will be promulgated or how it will modify the current rules. It is also unclear whether the Massachusetts Commissioner of Banks will adopt corresponding changes to its Community Reinvestment Act regulations, which apply to all Massachusetts-chartered banks, including Eastern Bank.
Compensation Practices. Our compensation practices are subject to oversight by the Federal Reserve Board and the FDIC. The federal banking regulators have provided guidance designed to ensure that incentive compensation arrangements at banking organizations take into account risk and are consistent with safe and sound practices. The guidance sets forth the following three key principles with respect to incentive compensation arrangements: (i) the arrangements should provide employees with incentives that appropriately balance risk and financial results in a manner that does not encourage employees to expose their organizations to imprudent risk; (ii) the arrangements should be compatible with effective controls and risk management; and (iii) the arrangements should be supported by strong corporate governance. The guidance provides that supervisory findings with respect to incentive compensation will be incorporated, as appropriate, into the organization’s supervisory ratings, which can affect its ability to make acquisitions or perform other actions. The guidance also provides that enforcement actions may be taken against a banking organization if its incentive compensation arrangements or related risk management, control or governance processes pose a risk to the organization’s safety and financial weakness.
Consumer Protection and Fair Lending Regulations. Massachusetts-chartered banks are subject to a variety of federal and Massachusetts statutes and regulations that are intended to protect consumers and prohibit discrimination in the granting of credit. These statutes and regulations provide for a range of sanctions for non-compliance with their terms, including imposition of administrative fines and remedial orders, and referral to the Attorney General for prosecution of a civil action for actual and punitive damages and injunctive relief. Certain of these statutes authorize private individual and class action lawsuits and the award of actual, statutory and punitive damages and attorneys’ fees for certain types of violations.
CFPB Supervision. With total assets in excess of $10 billion, Eastern Bank is classified as a large bank and therefore is subject to direct supervision and examination by the Consumer Financial Protection Bureau for compliance with federal consumer financial law under Title X of the Dodd-Frank Act.
USA PATRIOT Act. Eastern Bank is subject to the USA PATRIOT Act, which gave federal agencies additional powers to address terrorist threats through enhanced domestic security measures, expanded surveillance powers, increased information sharing, and broadened anti-money laundering requirements. By way of amendments to the Bank Secrecy Act, Title III of the USA PATRIOT Act provided measures intended to encourage information sharing among bank regulatory agencies and law enforcement bodies. Further, certain provisions of Title III impose affirmative obligations on a broad range of financial institutions, including banks, thrifts, brokers, dealers, credit unions, money transfer agents, and parties registered under the Commodity Exchange Act.
138
Table of Contents
CARES Act. Eastern Bank may be impacted by provisions of the Coronavirus Aid, Relief, and Economic Security Act, or CARES Act, containing certain temporary regulatory forbearance measures applicable during the Covid-19 pandemic state of emergency. These CARES Act provisions address the establishment of emergency liquidity facilities to support lending to small and midsize businesses under Section 13(3) of the Federal Reserve Act; a potential temporary increase of FDIC deposit insurance limits on noninterest bearing deposit accounts above current levels; temporary relief from troubled debt restructurings and optional temporary relief from current expected credit losses. Federal and state banking agencies also have issued guidance to regulated financial institutions during the Covid-19 pandemic state of emergency. These pronouncements address onsite examination frequency; loan modifications; deferral of real estate appraisals and evaluations; responsible small dollar lending; mortgage servicing; CECL transition; regulatory reporting; and other supervisory matters.
Other Regulations
Interest and other charges collected or contracted for by Eastern Bank are subject to state usury laws and federal laws concerning interest rates. Loan operations are also subject to state and federal laws applicable to credit transactions, such as the:
| • | Home Mortgage Disclosure Act of 1975, requiring financial institutions to provide information to enable the public and public officials to determine whether a financial institution is fulfilling its obligation to help meet the housing needs of the community it serves; |
| • | Equal Credit Opportunity Act, prohibiting discrimination on the basis of race, creed or other prohibited factors in extending credit; |
| • | Fair Credit Reporting Act of 1978, governing the use and provision of information to credit reporting agencies; |
| • | Massachusetts Debt Collection Regulations, establishing standards, by defining unfair or deceptive acts or practices, for the collection of debts from persons within the Commonwealth of Massachusetts and the General Laws of Massachusetts, Chapter 167E, which governs Eastern Bank’s lending powers; and |
| • | Rules and regulations of the various federal and state agencies charged with the responsibility of implementing such federal and state laws. |
The deposit operations of Eastern Bank also are subject to, among others, the:
| • | Right to Financial Privacy Act, which imposes a duty to maintain confidentiality of consumer financial records and prescribes procedures for complying with administrative subpoenas of financial records; |
| • | Check Clearing for the 21st Century Act (also known as “Check 21”), which gives “substitute checks,” such as digital check images and copies made from that image, the same legal standing as the original paper check; |
| • | Electronic Funds Transfer Act and Regulation E promulgated thereunder, which govern automatic deposits to and withdrawals from deposit accounts and customers’ rights and liabilities arising from the use of automated teller machines and other electronic banking services; and |
| • | General Laws of Massachusetts, Chapter 167D, which governs deposit powers. |
Federal Reserve System
The Federal Reserve Board regulations require depository institutions to maintain noninterest-earning reserves against their transaction accounts (primarily NOW and regular checking accounts). The Federal Reserve Board regulations generally require that reserves be maintained against aggregate transaction accounts as follows: for that portion of transaction accounts aggregating $124.2 million or less (which may be adjusted by the Federal Reserve Board) the reserve requirement is 3.0% and the amounts greater than $124.2 million require a 10.0% reserve (which may be adjusted annually by the Federal Reserve Board between 8.0% and 14.0%). The first $16.3 million of otherwise reservable balances (which may be adjusted by the Federal Reserve Board) are exempted from the reserve requirements. Eastern Bank is in compliance with these requirements.
Federal Home Loan Bank System
Eastern Bank is a member of the Federal Home Loan Bank System, which consists of 12 regional Federal Home Loan Banks. The Federal Home Loan Bank provides a central credit facility primarily for member institutions. Members of the
139
Table of Contents
Federal Home Loan Bank are required to acquire and hold shares of capital stock in the Federal Home Loan Bank. Eastern Bank acquired capital stock in the Federal Home Loan Bank of Boston and was in compliance with this requirement at March 31, 2020. Based on redemption provisions of the Federal Home Loan Bank of Boston, the stock has no quoted market value and is carried at cost. Eastern Bank reviews for impairment based on the ultimate recoverability of the cost basis of the Federal Home Loan Bank of Boston stock. As of March 31, 2020, no impairment has been recognized.
At its discretion, the Federal Home Loan Bank of Boston may declare dividends on the stock. The Federal Home Loan Banks are required to provide funds for certain purposes including the resolution of insolvent thrifts in the late 1980s and to contributing funds for affordable housing programs. These requirements could reduce the amount of dividends that the Federal Home Loan Banks pay to their members and result in the Federal Home Loan Banks imposing a higher rate of interest on advances to their members. In 2019, the Federal Home Loan Bank of Boston paid dividends equal to an annual yield of 6.05%. There can be no assurance that such dividends will continue in the future.
Holding Company Regulation
Eastern Bankshares, Inc. will be subject to examination, regulation, and periodic reporting under the Bank Holding Company Act of 1956, as amended, as administered by the Federal Reserve Board. Eastern Bankshares, Inc. will be required to obtain the prior approval of the Federal Reserve Board to acquire all, or substantially all, of the assets of any bank or bank holding company. Prior Federal Reserve Board approval would be required for the Eastern Bankshares, Inc. to acquire direct or indirect ownership or control of any voting securities of any bank or bank holding company if, after such acquisition, it would, directly or indirectly, own or control more than 5% of any class of voting shares of the bank or bank holding company. In addition to the approval of the Federal Reserve Board, prior approval may also be necessary from other agencies having supervisory jurisdiction over the bank to be acquired before any bank acquisition can be completed.
A bank holding company is generally prohibited from engaging in non-banking activities, or acquiring direct or indirect control of more than 5% of the voting securities of any company engaged in non-banking activities. One of the principal exceptions to this prohibition is for activities found by the Federal Reserve Board to be so closely related to banking or managing or controlling banks as to be a proper incident thereto. Some of the principal activities that the Federal Reserve Board has determined by regulation to be so closely related to banking are: (i) making or servicing loans; (ii) performing certain data processing services; (iii) providing discount brokerage services; (iv) acting as fiduciary, investment or financial advisor; (v) leasing personal or real property; (vi) making investments in corporations or projects designed primarily to promote community welfare; and (vii) acquiring a savings and loan association whose direct and indirect activities are limited to those permitted for bank holding companies.
The Gramm-Leach-Bliley Act of 1999 authorized a bank holding company that meets specified conditions, including being “well capitalized” and “well managed,” to opt to become a “financial holding company” and thereby engage in a broader array of financial activities than previously permitted. Such activities can include insurance underwriting and investment banking. Eastern Bankshares, Inc. has no present plan or intent to elect to become a financial holding company.
Eastern Bankshares, Inc. will be subject to the Federal Reserve Board’s capital adequacy guidelines for bank holding companies (on a consolidated basis) which have historically been similar to, though less stringent than, those of the FDIC for Eastern Bank. The Dodd-Frank Act, however, required the Federal Reserve Board to promulgate consolidated capital requirements for depository institution holding companies that are no less stringent, both quantitatively and in terms of components of capital, than those applicable to the depository institutions themselves. Consolidated regulatory capital requirements identical to those applicable to the subsidiary banks apply to bank holding companies; as is the case with the depository institutions themselves, the capital conservation buffer was phased in between 2016 and 2019.
A bank holding company is generally required to give the Federal Reserve Board prior written notice of any purchase or redemption of then outstanding equity securities if the gross consideration for the purchase or redemption, when combined with the net consideration paid for all such purchases or redemptions during the preceding 12 months, is equal to 10% or more of the company’s consolidated net worth. The Federal Reserve Board may disapprove such a purchase or redemption if it determines that the proposal would constitute an unsafe and unsound practice, or would violate any law, regulation, Federal Reserve Board order or directive, or any condition imposed by, or written agreement with, the Federal Reserve Board. There is an exception to this approval requirement for well-capitalized bank holding companies that meet certain other conditions.
The Federal Reserve Board has issued a policy statement regarding capital distributions, including dividends, by bank holding companies. In general, the Federal Reserve Board’s policies provide that dividends should be paid only out of
140
Table of Contents
current earnings and only if the prospective rate of earnings retention by the bank holding company appears consistent with the organization’s capital needs, asset quality and overall financial condition. The Federal Reserve Board’s policies also require that a bank holding company serve as a source of financial strength to its subsidiary banks by standing ready to use available resources to provide adequate capital funds to those banks during periods of financial stress or adversity and by maintaining the financial flexibility and capital-raising capacity to obtain additional resources for assisting its subsidiary banks where necessary. The Dodd-Frank Act codified the source of strength doctrine. Under the prompt corrective action laws, the ability of a bank holding company to pay dividends may be restricted if a subsidiary bank becomes undercapitalized. In addition, the Federal Reserve Board has issued guidance that requires consultation with the agency prior to a bank holding company’s payment of dividends of repurchase of stock under certain circumstances. These regulatory policies could affect the ability of the Eastern Bankshares, Inc. to pay dividends, repurchase its stock or otherwise engage in capital distributions.
Under the Federal Deposit Insurance Act, depository institutions are liable to the FDIC for losses suffered or anticipated by the FDIC in connection with the default of a commonly controlled depository institution or any assistance provided by the FDIC to such an institution in danger of default.
The status of Eastern Bankshares, Inc. as a registered bank holding company under the Bank Holding Company Act will not exempt it from certain federal and state laws and regulations applicable to corporations generally, including, without limitation, certain provisions of the federal securities laws.
Massachusetts Holding Company Regulation. Under the Massachusetts banking laws, a company owning or controlling two or more banking institutions is regulated as a bank holding company. The term “company” is defined by the Massachusetts banking laws similarly to the definition of “company” under the Bank Holding Company Act. Each Massachusetts bank holding company: (i) must obtain the approval of the Massachusetts Board of Bank Incorporation before engaging in certain transactions, such as the acquisition of more than 5% of the voting stock of another banking institution; (ii) must register, and file reports, with the Massachusetts Commissioner of Banks; and (iii) is subject to examination by the Massachusetts Commissioner of Banks. Eastern Bankshares, Inc. will not be a “bank holding company” under the Massachusetts banking laws.
Regulation of Eastern Insurance Group LLC
Our insurance agency, Eastern Insurance Group LLC, is subject to regulation and supervision by the Massachusetts Division of Insurance, and various state insurance regulatory authorities in other states that license, regulate and supervise insurance producers, brokers and agents.
Federal Securities Laws
Eastern Bankshares, Inc. common stock will be registered with the Securities and Exchange Commission after the offering. Eastern Bankshares, Inc. will be subject to the information, proxy solicitation, insider trading restrictions and other requirements under the Securities Exchange Act of 1934.
The registration under the Securities Act of 1933 of shares of common stock issued in Eastern Bankshares, Inc.’s public offering does not cover the resale of those shares. Shares of common stock purchased by persons who are not affiliates of Eastern Bankshares, Inc. may be resold without registration. Shares purchased by an affiliate of Eastern Bankshares, Inc. will be subject to the resale restrictions of Rule 144 under the Securities Act of 1933. If Eastern Bankshares, Inc. meets the current public information requirements of Rule 144 under the Securities Act of 1933, each affiliate of Eastern Bankshares, Inc. that complies with the other conditions of Rule 144, including those that require the affiliate’s sale to be aggregated with those of other persons, would be able to sell in the public market, without registration, a number of shares not to exceed, in any three-month period, the greater of 1% of the outstanding shares of Eastern Bankshares, Inc., or the average weekly volume of trading in the shares during the preceding four calendar weeks. In the future, Eastern Bankshares, Inc. may permit affiliates to have their shares registered for sale under the Securities Act of 1933.
Emerging Growth Company Status
The JOBS Act, which was enacted in 2012, has made numerous changes to the federal securities laws to facilitate access to capital markets. Under the JOBS Act, a company with total annual gross revenues of less than $1.07 billion during its most recently completed fiscal year qualifies as an “emerging growth company.” We expect that Eastern Bankshares, Inc. will qualify as an emerging growth company under the JOBS Act until December 31, 2021.
141
Table of Contents
An “emerging growth company” may choose not to hold shareholder votes to approve annual executive compensation (more frequently referred to as “say-on-pay” votes) or executive compensation payable in connection with a merger (more frequently referred to as “say-on-golden parachute” votes). An emerging growth company also is not subject to the requirement that its auditors attest to the effectiveness of the company’s internal control over financial reporting and can provide scaled disclosure regarding executive compensation. The JOBS Act also provides that an emerging growth company does not need to comply with any new or revised financial accounting standards until such date that a private company is otherwise required to comply with such new or revised accounting standards. Pursuant to the JOBS Act, we have elected to take advantage of the benefits of this extended transition period for complying with new or revised accounting standards as required when they are adopted for private companies. As a result, our operating results and financial statements may not be comparable to the operating results and financial statements of other companies who have adopted the new or revised accounting standards.
Eastern Bankshares, Inc. will cease to qualify as an emerging growth company on the earlier of: (i) the last day of the fiscal year of the company during which it had total annual gross revenues of $1.07 billion or more; (ii) the last day of the fiscal year of the issuer following the fifth anniversary of the offering; (iii) the date on which Eastern Bankshares, Inc. has, during the previous three-year period, issued more than $1.07 billion in non-convertible debt; or (iv) the date on which Eastern Bankshares, Inc. is deemed to be a “large accelerated filer” under Securities and Exchange Commission regulations (generally, Eastern Bankshares, Inc. will be deemed to be classified as a “large accredited filer” on the last day of the fiscal year in which the market value of voting and non-voting equity held by non-affiliates was at least $700 million or more as of the last day of the second quarter of that fiscal year). Eastern Bankshares, Inc. will not be classified as a large accelerated filer earlier than December 31, 2021. Once we cease to be an emerging growth company, we will not be entitled to the exemptions provided in the JOBS Act discussed above.
Sarbanes-Oxley Act of 2002
The Sarbanes-Oxley Act of 2002 is intended to improve corporate responsibility, to provide for enhanced penalties for accounting and auditing improprieties at publicly traded companies and to protect investors by improving the accuracy and reliability of corporate disclosures pursuant to federal securities laws. We have policies, procedures and systems designed to comply with these regulations, and we review and document such policies, procedures and systems to ensure continued compliance with these regulations.
Change in Control Regulations
Under the Change in Bank Control Act, no person, or group of persons acting in concert, may acquire control of a bank holding company such as Eastern Bankshares, Inc. unless the Federal Reserve Board has been given 60 days’ prior written notice and not disapproved the proposed acquisition. The Federal Reserve Board considers several factors in evaluating a notice, including the financial and managerial resources of the acquirer and competitive effects. Control, as defined under the applicable regulations, means the power, directly or indirectly, to direct the management or policies of the company or to vote 25% or more of any class of voting securities of the company. Acquisition of more than 10% of any class of a bank holding company’s voting securities constitutes a rebuttable presumption of control under certain circumstances, including where, as will be the case with Eastern Bankshares, Inc., the issuer has registered securities under Section 12 of the Securities Exchange Act of 1934.
In addition, federal regulations provide that no company may acquire control (as defined in the Bank Holding Company Act) of a bank holding company without the prior approval of the Federal Reserve Board. Any company that acquires such control becomes a “bank holding company” subject to registration, examination and regulation by the Federal Reserve Board.
142
Table of Contents
Eastern Bankshares, Inc. and Eastern Bank are subject to federal and state income taxation in the same general manner as other corporations, with some exceptions discussed below. Currently, Eastern Bank Corporation and Eastern Bank are included as part of Eastern Bank Corporation’s consolidated tax group. However, upon completion of the offering, Eastern Bank will be part of Eastern Bankshares, Inc.’s consolidated tax group, as Eastern Bank Corporation will cease to exist and Eastern Bankshares, Inc. will own 100% of the common stock of Eastern Bank. The following discussion of federal and state taxation is intended only to summarize certain pertinent tax matters and is not a comprehensive description of the tax rules applicable to Eastern Bankshares, Inc. or Eastern Bank upon completion of the offering.
Federal Taxation
General. Eastern Bankshares, Inc. will report its income on a calendar year basis using the accrual method of accounting. Presently, the Internal Revenue Service may examine, audit and assess tax deficiencies as to Eastern Bank Corporation’s U.S. federal income tax returns for tax years beginning after December 31, 2015. None of Eastern Bank Corporation’s U.S. federal income tax returns for those years is currently under audit. Eastern Bank Corporation’s U.S. federal income tax returns for tax years ending before January 1, 2016 may no longer be examined or audited by the Internal Revenue Service, subject to certain exceptions that we have determined are not relevant here. For its 2019 tax year, Eastern Bank’s maximum U.S. federal income tax rate was 21%.
Bad Debt Reserves. For taxable years beginning before January 1, 1996, thrift institutions that qualified under certain definitional tests and other conditions of the Internal Revenue Code were permitted to use certain favorable provisions to calculate their deductions from taxable income for annual additions to their bad debt reserve. A reserve could be established for bad debts on qualifying real property loans, generally secured by interests in real property improved or to be improved, under the percentage of taxable income method or the experience method. The reserve for non-qualifying loans was computed using the experience method. Federal legislation enacted in 1996 repealed the reserve method of accounting for bad debts and the percentage of taxable income method for tax years beginning after 1995 and required savings institutions to recapture or take into income certain portions of their accumulated bad debt reserves. However, those bad debt reserves accumulated prior to 1988 (“Base Year Reserves”) were not required to be recaptured unless the savings institution failed certain tests. Eastern Bank’s unrecaptured Base Year Reserve as of the end of the 2019 Fiscal Year is $20.8 million.
State Taxation
Financial institutions in Massachusetts are required to file combined income tax returns beginning with the year ended December 31, 2009. The Massachusetts excise tax rate for savings banks is currently 9% of federal taxable income, adjusted for certain items. Taxable income includes gross income as defined under the Internal Revenue Code, plus interest from bonds, notes and evidences of indebtedness of any state, including Massachusetts, less deductions, but not the credits, allowable under the provisions of the Internal Revenue Code, except for those deductions relating to dividends received and income or franchise taxes imposed by a state or political subdivision. Carryforwards and carrybacks of net operating losses and capital losses are not allowed. Eastern Bankshares, Inc.’s state tax returns, as well as those of its subsidiaries, are not currently under audit.
A financial institution or business corporation is generally entitled to special tax treatment as a “security corporation” under Massachusetts law provided that: (a) its activities are limited to buying, selling, dealing in or holding securities on its own behalf and not as a broker; and (b) it has applied for, and received, classification as a “security corporation” by the Commissioner of the Massachusetts Department of Revenue. A security corporation that is also a bank holding company under the Internal Revenue Code must pay a tax equal to 0.33% of its gross income. A security corporation that is not a bank holding company under the Internal Revenue Code must pay a tax equal to 1.32% of its gross income. Eastern Bank has two subsidiaries, Market Street Securities Corporation and Broadway Securities Corporation, which engage in securities transactions on its own behalf and are qualified as security corporations. Each subsidiary has received security corporation classification by the Massachusetts Department of Revenue. Neither subsidiary conducts any activities deemed impermissible under the governing statutes and the various regulations, directives, letter rulings and administrative pronouncements issued by the Massachusetts Department of Revenue.
143
Table of Contents
The New Hampshire Business Profits Tax (“BPT”) is assessed at the rate of 7.7%. For tax years ending on or after December 31, 2021, the BPT rate may be adjusted to as high as 7.9% and as low as 7.5% depending on collections from certain state revenue sources for New Hampshire’s fiscal year ending June 30, 2020. For this purpose, the term “gross business profits” generally means federal taxable income subject to certain modifications provided for in New Hampshire law. The New Hampshire Business Enterprise Tax (“BET”) is assessed at 0.6% of the total amount of payroll and certain employee benefits expense, interest expense, and dividends paid to shareholders. For years ending on or after December 31, 2021, the BET rate may be adjusted to as high as 0.675% and as low as 0.5% depending on collections from certain state revenue sources for New Hampshire’s fiscal year ending June 30, 2020. The BET is applied as a credit toward the BPT.
144
Table of Contents
Our Directors
The following table states our directors’ names, their ages as of December 31, 2019 and the years when they began serving as directors of Eastern Bank.
| Name (1) |
Position(s) Held
with |
Age | Director Since |
Current Term Expires |
||||||||||
| Robert F. Rivers |
Chief Executive Officer, Chair of the Board | 55 | 2015 | 2023 | ||||||||||
| Richard E. Holbrook |
Director | 68 | 2007 | 2022 | ||||||||||
| Deborah C. Jackson |
Director | 68 | 2000 | 2023 | ||||||||||
| Richard C. Bane |
Director | 64 | 2001 | 2021 | ||||||||||
| Luis A. Borgen |
Director | 50 | 2016 | 2023 | ||||||||||
| Joseph T. Chung |
Director | 55 | 2014 | 2021 | ||||||||||
| Paul M. Connolly |
Director | 70 | 2011 | 2021 | ||||||||||
| Bari A. Harlam |
Director | 58 | 2014 | 2021 | ||||||||||
| Diane S. Hessan |
Director | 65 | 2016 | 2023 | ||||||||||
| Peter K. Markell |
Director | 64 | 2006 | 2022 | ||||||||||
| Greg A. Shell |
Director | 44 | 2018 | 2022 | ||||||||||
| Paul D. Spiess |
Director | 70 | 2014 | 2022 | ||||||||||
| (1) | The mailing address for each person listed is 265 Franklin Street, Boston, Massachusetts 02110. |
The following includes a brief biography for each of our directors. The biography of each director also contains information regarding the person’s experience, qualifications, attributes or skills that caused the Board of Directors to determine that the person should serve as a director. There are no family relationships among any of our directors or executive officers. Each director is also a director of Eastern Bank and, until the completion of the offering, a member of the Board of Trustees of Eastern Bank Corporation. Unless otherwise indicated, directors have held their positions for the past five years.
Robert F. Rivers has served as the Chief Executive Officer and Chair of the Board of Directors of Eastern Bank since January 1, 2017. Mr. Rivers joined Eastern Bank in 2006 as its Vice Chair and Chief Banking Officer, becoming President in 2007, Chief Operating Officer in 2012 and an Eastern Bank director in 2015. He has also served as a trustee of Eastern Bank Corporation since 2007. Prior to joining Eastern, from 1991 to 2005, Mr. Rivers held a number of staff and line leadership positions at M&T Bank in Buffalo, NY. Immediately prior to joining Eastern, he was an Executive Vice President for Retail Banking at the former Commercial Federal Bank in Omaha, Nebraska. Mr. Rivers serves as the Board Chair of the Dimock Center, is a member of the executive committee of the Greater Boston Chamber of Commerce, is the Chair of the Massachusetts Business Roundtable and is a trustee of Stonehill College. He also serves on the Board of the Lowell Plan and on the Advisory Boards of the Lawrence Partnership and the JFK Library Foundation, and the Boston Women’s Workforce Council. A leader in Boston’s business community, Mr. Rivers has been recognized as a champion for social justice issues, having led the “Yes on 3” campaign to protect the rights of members of the LGBTQ+ community. He received his undergraduate degree from Stonehill College and holds an M.B.A. from the University of Rochester. We believe that Mr. Rivers is qualified to serve as a director based upon his experience as our Chief Executive Officer beginning in January 2017, his prior service as one of our senior executive officers, his prior senior management positions at other banks, and his familiarity with the communities that Eastern serves, including through his involvement with numerous non-profit organizations in the greater Boston area.
Richard E. Holbrook currently serves as director and Chair Emeritus of Eastern Bank. Mr. Holbrook retired as Chair and Chief Executive Officer of Eastern Bank in 2016, having served in those roles since 2007. He has served as a trustee of Eastern Bank Corporation since 2001. Mr. Holbrook joined Eastern Bank in 1996 as Chief Financial Officer and Executive Vice President and was named President and Chief Operating Officer of Eastern Bank and Eastern Bank Corporation in 2001. He has more than 25 years of banking experience as a commercial lender, trust officer and planning and financial manager. During his leadership at Eastern, Mr. Holbrook served as the Federal Advisor Council (“FAC”) representative for the First Federal Reserve District, meeting quarterly to discuss business and financial conditions with the Federal Reserve Board of Governors in Washington, D.C. Mr. Holbrook also served on the Board of Directors of the Federal Reserve Bank of
145
Table of Contents
Boston, and on the executive committee of the Boston Chamber of Commerce. He is also the former chair of the Massachusetts Bankers Association. He received his undergraduate degree from Yale University and his M.B.A. from Harvard Business School. We believe Mr. Holbrook’s experience working in the banking industry, particularly his decades of experience on our executive management team, qualifies him to serve on our Board of Directors.
Deborah C. Jackson is the Lead Director of Eastern Bank and has been a member of the Board of Directors since 2000. She serves as the President of Cambridge College in Cambridge Massachusetts, a position she has held since 2011. Prior to that, Ms. Jackson served for nearly a decade as CEO of the American Red Cross of Eastern Massachusetts, one of the nation’s largest Red Cross units. Prior to that, she served as Vice President of the Boston Foundation where she managed its $50 million grant and initiatives program. Throughout her career, Ms. Jackson has served and continues to serve on numerous commissions, task forces and boards including the Boston Green Ribbon Commission; the Mayor’s Task Force to Eliminate Racial and Ethnic Disparities in Health Care; the “City to City” program focusing on national and global best practices for urban policies; and the American Red Cross National Diversity Advisory Council. Ms. Jackson served for over 15 years on the board of the American Student Assistance Corporation, the nation’s first student loan guarantor agency; and she has served on the Boston College Carroll School of Management’s Advisory Board, and the boards of Milton Academy and Harvard Pilgrim Health Care. She also served as Chairman of the Board of Directors of the Association of Independent Colleges and Universities in Massachusetts and is a board member of the New England Chapter of The National Association of Corporate Directors. In addition, Ms. Jackson served as the Chair of the Audit Committee and on the Board of Directors of the Boston Stock Exchange, and currently serves on the Board of Directors of John Hancock Investments. Ms. Jackson attended Hampton University, graduated from Northeastern University with a B.A. and she pursued graduate studies in urban studies and planning from the Massachusetts Institute of Technology. Ms. Jackson is also the recipient of Honorary Doctorate degrees from Curry College and Merrimack Valley College. Ms. Jackson was a fellow of the British American Project of Johns Hopkins University, and previously served as a fellow of the Harvard University Advanced Leadership Institute and the Harvard University Institute for College Presidents. We believe Ms. Jackson’s extensive executive, civic, community and board leadership experience qualifies her to serve on our Board of Directors.
Richard C. Bane has served as a director of Eastern Bank since 2001 and as a Trustee of Eastern Bank Corporation since 1996. He is the President and Chief Executive Officer of Bane Care Management LLC, which operates skilled nursing facilities and assisted living facilities in Massachusetts. Mr. Bane formerly served as Chairman of the Massachusetts Senior Care Association, the state’s largest professional provider group, and now chairs that organization’s Payment Reform Task Force and Legislative Committees. Currently he leads many of the regional efforts to help determine the role of skilled and post-acute care in accountable care organizations. He lectures frequently on many aspects of senior services and post-acute care and is considered one of New England’s senior care industry leaders. In 2015 he was named to the Leadership Council of nationally recognized Schwartz Center for Compassionate Care. Mr. Bane is also involved in a wide range of corporate and community service activities. He is also a Board member of Targeted Risk Assurance Company (“TRACO”) and Carney Hospital (Steward) in Dorchester, MA. Mr. Bane holds an A.B. in Economics from Dartmouth College, and an M.B.A. from Harvard Business School. He was also awarded an Honorary Doctorate from Salem State University. We believe Mr. Bane’s extensive experience and civic leadership qualify him to serve on our Board of Directors.
Luis A. Borgen has been a director of Eastern Bank and a trustee of Eastern Bank Corporation since 2016. Since 2019, he has been the Chief Financial Officer for athenahealth, Inc., a leading cloud-based developer and provider of healthcare software that automates and manages revenue cycle management and electronic health records for physician practices and health systems. Prior to that, he was Chief Financial Officer for Vistaprint, an e-commerce company that produces marketing products for small and micro businesses. Prior to that, he served as Chief Financial Officer for two publicly traded companies: DAVIDsTEA and DaVita, Inc. Beginning in 1997, Mr. Borgen served in increasing roles of responsibility at Staples, Inc. leading to his appointment as Senior Vice President, Finance for the U.S. Retail business. He served in the U.S. Air Force from 1992 to 1997 and attained the rank of Captain. Mr. Borgen holds a B.S. in Management from the United States Air Force Academy, an M.S. from Boston College and an M.B.A. with Honors from the University of Chicago. Mr. Borgen is also a CFA charter holder. We believe Mr. Borgen’s experience with financial accounting matters and oversight of the financial reporting process of public companies qualifies him to serve on our Board of Directors.
Joseph T. Chung has served as a director of Eastern Bank and trustee of Eastern Bank Corporation since 2014. He is co-founder and CEO of Kinto, a care management platform for family caregivers looking after loved ones with Alzheimer’s Disease and related dementias. He is also co-founder and Managing Director of Redstar Ventures, an innovative venture foundry developing a series of new companies through a top-down, market driven process. Prior to Kinto and Redstar, Mr. Chung was Chairman and CEO of Allurent and co-founder, Chairman and Chief Technology Officer of Art Technology
146
Table of Contents
Group, a publicly traded, global enterprise software company. Mr. Chung holds B.S. and M.S. degrees in Computer Science from the Massachusetts Institute of Technology, and he conducted his graduate work at MIT’s Media Lab. He is a Venture Partner at the Media Lab’s E14 Fund. We believe Mr. Chung’s extensive expertise in innovation and technology experience qualifies him to serve on our Board of Directors.
Paul M. Connolly has served as a director of Eastern Bank and trustee of Eastern Bank Corporation since 2011. Mr. Connolly retired in 2010 as the First Vice President and Chief Operating Officer at the Federal Reserve Bank of Boston, a position he had held since 1994. As Chief Operating Officer of the Federal Reserve Bank of Boston, Mr. Connolly had the responsibility for the Bank’s financial services, information technology, finance, and support and administrative activities. Mr. Connolly joined The Federal Reserve Bank in 1975. Throughout his 36-year career, he served in a variety of positions in information technology, payments, planning and economic research, served on the Federal Reserve Financial Services Policy Committee and had national leadership responsibility for payment services and financial management. He currently serves on the board of directors for John Hancock Life Insurance Company and received an M.B.A. from Harvard Business School and an A.B. from Boston College. We believe Mr. Connolly’s extensive banking and regulatory experiences qualify him to serve on our Board of Directors.
Bari A. Harlam has served as a director of Eastern Bank and a trustee of Eastern Bank Corporation since 2014. Ms. Harlam currently serves as a member of the Board of Directors of the Mohawk Group, Inc., Champion Petfoods, LP, and OneWater Marine, Inc. Through March 2020, Ms. Harlam served as the Chief Marketing Officer for Hudson’s Bay Company. Prior to that, she served as the Executive Vice President of Membership, Marketing, and Analytics for BJ’s Wholesale Club. Before that, she was Chief Marketing Officer at Swipely, a technology startup and served as Senior Vice President of Marketing for CVS Health Corporation. Ms. Harlam has also served on the faculties of The Wharton School at the University of Pennsylvania, Columbia University’s Graduate School of Business, and the University of Rhode Island. She received her B.S., M.S., and Ph.D. from the University of Pennsylvania, The Wharton School of Business. Her work has been published in a variety of journals including Marketing Science, Journal of Marketing Research, and the Journal of Business Research. We believe Ms. Harlam’s extensive marketing and analytics expertise qualifies her to serve on our Board of Directors.
Diane S. Hessan has served as a director of Eastern Bank and a trustee of Eastern Bank Corporation since 2016. She currently serves as CEO of Salient Ventures, an investment and advisory company with a portfolio of angel investments focused on technology companies. Previously, she was CEO of Startup Institute, which is dedicated to helping people transform their careers to succeed in the innovation economy. She is also Chairman of C Space, where she was Founder and CEO for 14 years. C Space (formerly Communispace) is a market research company, which builds online communities to help marketers generate consumer insights. Ms. Hessan serves on the boards of Tufts University, MassChallenge, Panera, Brightcove, CoachUp, and Beth Israel Deaconess Medical Center, and received her M.B.A. from Harvard Business School and her B.A. in Economics and English from Tufts University. Ms. Hessan has also received Honorary Doctorate degrees from Bentley University and the New England College of Business. We believe Ms. Hessan’s executive experience, entrepreneurial passion and customer-centric, data driven perspective qualify her to serve on our Board of Directors.
Peter K. Markell has served as a director of Eastern Bank and a trustee of Eastern Bank Corporation since 2006. He is Executive Vice President of Administration and Finance, Chief Financial Officer and Treasurer for Partners HealthCare Systems, Inc. He joined Partners in 1999. Prior to that, he was a partner at Ernst & Young LLP for 21 years. A Certified Public Accountant, Mr. Markell is a Boston College graduate with a B.A. in Accounting and Finance and serves as the Chairman of the Board of Boston College. We believe Mr. Markell’s extensive expertise in innovation and technology experience qualify him to serve on our Board of Directors.
Greg A. Shell has served as a director of Eastern Bank and trustee of Eastern Bank Corporation since 2018. Prior to joining the Board, he served on the Bank’s Investment Advisory committee. Since 2016, Mr. Shell has served as Managing Director of Bain Capital, co-leading the Double Impact Fund, Bain Capital’s private equity fund focused on social impact. Prior to joining Bain Capital, Mr. Shell was a Portfolio Manager at Grantham, Mayo, Van Otterloo (“GMO”), a global investment management firm. Prior to that, he was a Senior Equity Analyst in the Global Equity Research group at Columbia Management Group, a global investment management firm. Mr. Shell has served on the New England Advisory Committee of the Federal Reserve Bank of Boston, and as a Director at Harvard Pilgrim Health Care, Fiduciary Trust, Massachusetts General Hospital and the Boston Foundation. Mr. Shell earned his M.B.A. from Harvard Business School and received a B.S. from the Massachusetts Institute is Technology. We believe Mr. Shell’s financial and investment experience, as well as his civic leadership qualifies him to serve on our Board of Directors.
147
Table of Contents
Paul D. Spiess has served as a director of Eastern Bank and a trustee of Eastern Bank Corporation since 2014. He has spent twenty-five years in the banking and financial services industry, serving as former Chairman of the Board of Centrix Bank and Trust, which merged with Eastern in 2014. He also served as Executive Vice President and Chief Operating Officer of CFX Bank in Keene, New Hampshire from 1993 to 1997. From 2004 to 2010, Mr. Spiess served in the office of the Governor of New Hampshire as an insurance and banking advisor. From 2000 to 2004, he served as a state legislator in Concord, New Hampshire, during which time he served on the House Commerce Committee. From 1983 to 1993, Mr. Spiess was Founder and President of Colonial Mortgage, Inc., of Amherst, New Hampshire, and served as a health care advisor and as Chairman of the Citizen’s Health Initiative. He graduated with a B.A. from Colby College and with an M.B.A from Boston University. We believe Mr. Spiess’s extensive knowledge of banking operations and credit risk, his experience in the banking and mortgage industries, and his board leadership experience qualify him to serve on our Board of Directors.
Executive Officers
The following table provides information regarding our executive officers who are not directors. Age information is as of December 31, 2019. Our executive officers serve at the discretion of our Board of Directors.
| Name |
Age | Position(s) | ||||
| Paul Alexander |
59 | Chief Marketing and Communications Officer of Eastern Bank | ||||
| Steven L. Antonakes |
51 | Executive Vice President, Enterprise Risk Management of Eastern Bank | ||||
| James B. Fitzgerald |
62 | Vice Chair, Chief Administrative Officer, Chief Financial Officer of Eastern Bank | ||||
| Barbara Heinemann |
57 | Executive Vice President, Consumer Banking of Eastern Bank | ||||
| Kathleen C. Henry |
47 | Executive Vice President, General Counsel, Corporate Secretary of Eastern Bank | ||||
| John F. Koegel |
69 | President & Chief Executive Officer of Eastern Insurance Group LLC | ||||
| Jan A. Miller |
69 | Vice Chair, Chief Commercial Banking Officer of Eastern Bank; President of Eastern Bank Corporation | ||||
| Quincy Miller |
45 | President of Eastern Bank; Vice Chair of Eastern Bank Corporation | ||||
| Nancy Huntington Stager |
59 | Executive Vice President, Chief Human Resource Officer of Eastern Bank | ||||
| Daniel J. Sullivan |
59 | Executive Vice President, Chief Credit Officer of Eastern Bank | ||||
| Donald M. Westermann |
42 | Executive Vice President, Chief Information Officer of Eastern Bank | ||||
The following includes a brief biography for each of executive officers who is not a director of Eastern Bankshares, Inc. Unless otherwise stated, each executive officer has served in his or her current position for the last five years.
Paul Alexander, 59, is the Chief Marketing and Communications Officer for Eastern Bank. Mr. Alexander joined Eastern in 2015 and since then has developed and executed marketing, communications and PR strategies resulting in increases in brand equity and employee engagement – via the “Join Us For Good” campaign. Before Eastern, Paul served as EVP and Chief Communications Officer for Liberty Mutual Insurance, where he held responsibility for all corporate brand marketing, advertising, communications, public relations, meeting management and event strategy, and major sports sponsorships. Before that he was Vice President of Global Advertising and Design for the Campbell Soup Company, a director of Advertising Development and a Brand Manager at Procter and Gamble. He began his career at Time Inc. as a Circulation Manager for Money Magazine. Mr. Alexander is on the Board of Directors of Skyword, a content marketing software and services company, and a member of the Board of the Ad Club of Boston. He is also on the Executive Committee of the Board of the Association of National Advertisers. Mr. Alexander is Chair of the Trustee Board of Myrtle Baptist Church and serves on the Board of Directors of The Partnership, Incorporated and the Board of Advisors of the Museum of Fine Arts of Boston (“MFA”). Mr. Alexander earned his undergraduate degree from Harvard College and M.B.A. from Harvard Business School.
Steven L. Antonakes, 51, is the Executive Vice President for Enterprise Risk Management at Eastern Bank. He joined Eastern Bank in 2015. He oversees Eastern Bank’s Enterprise Risk Management function, which includes Bank Secrecy Act/Anti-Money Laundering, Compliance, Corporate Security, Credit Risk Review, Information Security, Market and Model Risk Management, and Operational Risk. Mr. Antonakes previously served as the Deputy Director and the Associate Director for Supervision, Enforcement, and Fair Lending at the Consumer Financial Protection Bureau. Prior to joining the Bureau, Mr. Antonakes served as the Massachusetts Commissioner of Banks from 2003 to 2010. Preceding his appointment as Commissioner, Mr. Antonakes served in a variety of managerial positions at the Division of Banks having joined the agency as an entry-level bank examiner in 1990. During his 25-year regulatory career, Mr. Antonakes staffed the Financial Stability Oversight Council, served as the first state-voting member of the Federal Financial Institutions Examination Council, Vice Chairman of the Conference of State Bank Supervisors, and as a founding member of the governing board of
148
Table of Contents
the Nationwide Multistate Licensing System. In March 2007, Mr. Antonakes received NeighborWorks America’s Government Service Award for his work in combatting foreclosures. Mr. Antonakes earned his B.A. from Penn State University, an M.B.A. from Salem State University, and a PhD in Law and Public Policy from Northeastern University.
James B. Fitzgerald, 62, is the Vice Chair, Chief Administrative Officer and Chief Financial Officer of Eastern Bank. Since joining Eastern in 2012, his responsibilities have included managing the Finance, Legal, Technology, Operations and General Services groups. He brings nearly 37 years of experience in the financial services industry to Eastern Bank. In 2009, Mr. Fitzgerald co-founded and was chief financial officer for NBH Holdings Corp., the bank holding company for Bank Midwest NA of Kansas City. Prior to that, Mr. Fitzgerald served as an executive vice president and chief financial officer at Citizens Financial Group for eight years. He began his career as a financial leader in mergers and acquisitions at First Fidelity Bancorp, Citizens Financial Group and Washington Mutual. Mr. Fitzgerald currently services as a trustee of the Massachusetts Taxpayers Association, a trustee of SBERA, and serves on the board of the Thompson Island Outward Bound Education Center. Mr. Fitzgerald earned his bachelor’s degree in finance at Lehigh University and his MBA at Fordham University.
Barbara Heinemann, 57, is Executive Vice President of Consumer Banking at Eastern Bank. She joined Eastern in 2001. She oversees Retail Banking, Private Banking, Mortgage Banking and the Customer Service Center, bringing more than 35 years of experience to her role. Barbara was previously the Executive Vice President of Enterprise Risk Management overseeing Corporate Security, Corporate Compliance, Bank Secrecy Act Compliance, Information Security and Operational Risk Management Departments. Prior to that she held the title of Executive Vice President, Chief Information Officer at Eastern with responsibilities for the Technology and Operations Divisions. Before joining Eastern, Ms. Heinemann spent more than 13 years with Cambridgeport Bank, where she was Director of Retail Banking and then served as SVP of Technology & Operations for 7 years in addition to managing numerous enterprise-wide initiatives. She serves as a trustee of the North Shore Community College, holds Board seats on the North Shore Community College Foundation Board, the New England Automated Clearing House (“NEACH”) Board, the NEACH Payments Group Board, the Burbank Reading YMCA Board of Advisors, and participates as a member of the Greater Boston YMCA Capital Planning and Facilities committee. She earned an MBA from the University of Maryland and graduated from America’s Community Bankers’ National School of Banking at Fairfield University, and the Massachusetts Bankers’ Association School of Financial Studies at Babson College.
Kathleen C. Henry, 47, is Executive Vice President, General Counsel and Corporate Secretary of Eastern Bank. Ms. Henry joined Eastern in 2016. She oversees a legal team responsible for managing the legal affairs of Eastern Bank Corporation and its affiliates, including Eastern Bankshares, Inc., Eastern Bank and Eastern Insurance Group LLC. She also serves as the primary legal advisor to Eastern’s Board of Directors, Chief Executive Officer and senior management. She is responsible for serving as Secretary to the Board of Trustees of Eastern Bank Corporation and the Boards of Directors of Eastern Bankshares, Inc. and Eastern Bank, directing all governance activities for the Eastern Bank Corporation, Eastern Bankshares, Inc., Eastern Bank and their respective subsidiaries. Before joining Eastern, she was General Counsel and before that Deputy General Counsel of Plymouth Rock Assurance Corporation, and a litigation partner at Choate, Hall & Stewart LLP, specializing in insurance and reinsurance litigation. Ms. Henry serves on the board of directors of the Political Asylum Representation Project, the Advisory Board for the Northeastern University School of Law’s Women in the Law Conference, as trustee of the Boston Bar Foundation and has served on numerous committees of the Boston Bar Association. She earned a B.A in journalism from Boston University and a J.D. from Northeastern University School of Law.
John F. Koegel, 69, is President and Chief Executive Officer of Eastern Insurance Group LLC. Mr. Koegel first joined Eastern Insurance Group LLC in 2003. He started his career with the Metropolitan Insurance Company and then worked at American Mutual Insurance Company. In 1989, he joined Allied American Insurance Agency, the predecessor of Eastern Insurance, where he had oversight for both personal and commercial lines. Mr. Koegel has served on the Board for the Massachusetts Association of Independent Agents, its Executive Committee and is most recent past Chairman. He earned a B.S. from Northwest Missouri State University.
Jan A. Miller, 69, is currently a Vice Chair, the Chief Commercial Banking Officer of Eastern Bank and President of Eastern Bank Corporation. He joined Eastern as part of its acquisition of Wainwright Bank and Trust Company in 2010. Prior to joining Eastern, he served as President, Chief Executive Officer and director of Wainwright Bank and Trust Company since 1997 and prior to that served as Executive Vice President and Senior Lending Officer. Before joining Wainwright Bank, he spent 19 years with Shawmut National Corporation in a number of positions, including President and Director of Shawmut First County Bank and Business Line Manager, Business Banking, where he was responsible for all
149
Table of Contents
business banking activity for Shawmut throughout New England. He started his banking career at Bradford National Bank in Bradford, Vermont. Mr. Miller is a Past Chairman of the Board of both the Federal Home Loan Bank of Boston and the Massachusetts Bankers Association. Mr. Miller was an original member of the FDIC Advisory Committee on Community Banking and has served in various leadership positions in banking and community organizations throughout his banking career. Mr. Miller received his B.S. in Finance from Northeastern University.
Quincy Miller, 45, is President of Eastern Bank and a Vice Chair of Eastern Bank Corporation. Mr. Miller joined Eastern in 2016. He oversees a number of departments, including our Consumer Banking businesses, Business Banking, Institutional Banking an Eastern Wealth Management, and with Chief Executive Officer, leads the overall strategic direction of Eastern. Prior to joining Eastern, Mr. Miller served as the President of Citizens Bank, Massachusetts, and President of its Business Banking division. He started his career in consumer banking at M&T Bank in New York City in 1997. Mr. Miller serves on the Board of Directors for The Boys and Girls Club of Boston, The Bottom Line, Blue Cross Blue Shield of MA, The Alliance for Business Leadership, The Greater Boston YMCA Board of Overseers, Board Emeritus of The Greater Boston Food Bank and Chair Emeritus of The Urban League of Eastern Massachusetts. In 2020, Mr. Miller was honored at the Martin Luther King Jr. Memorial Breakfast with the MLK 50th Anniversary Award for his commitment to Diversity & Inclusion that expresses Dr. King’s commitment to justice and equity. Mr. Miller earned a B.A. in economics and business from Lafayette College and graduated from the Consumer Bankers Association’s Graduate School of Retail Bank Management. He currently serves on the Board of The Consumer Bankers Association.
Nancy Huntington Stager, 59, is Executive Vice President and Chief Human Resource Officer for Eastern Bank. She also serves as President and Chief Executive Officer of Eastern Bank Charitable Foundation. Ms. Stager joined the Bank in 1995. As Chief Human Resource Officer, Ms. Stager oversees talent recruitment and development, compensation and benefits, volunteerism and diversity and inclusion efforts. As the Eastern Bank Charitable Foundation’s President & Chief Executive Officer, she leads efforts to provide financial assistance and volunteer programs to support non-profit organizations across Eastern Bank’s footprint. She serves as a leading advocate for social justice issues in line with Eastern Bank’s advocacy platform. She is Board President for the Foundation for Business Equity, a private foundation started through a grant from Eastern Bank Charitable Foundation, that works with Black and Latinx enterprises to build capacity and facilitate access to capital and contracts to enable growth. Ms. Stager serves on a number of community boards across the Greater Boston area. Ms. Stager earned a B.S. in industrial and labor relations from Cornell University.
Daniel J. Sullivan, 59, is Executive Vice President and Chief Credit Officer of Eastern Bank. Mr. Sullivan joined Eastern Bank in 1996. He oversees all credit underwriting, credit training, managed assets and default management for the Bank. He also serves as chair of the Credit Policy and Credit Committee, where credit policies and larger credit requests are approved. In addition, he oversees all loan portfolio reviews. Prior to joining Eastern Bank, Mr. Sullivan was a vice president at Shawmut Bank, where he worked in loan workout and as a commercial relationship manager. Mr. Sullivan is an active member of the Risk Management Association (“RMA”) at the national and local levels and is certified by the RMA in credit risk management. Locally, Mr. Sullivan is active in the Northeast Region Chief Credit Officer Roundtables and is a presenter at the Loan Officer Residency Seminar, also on behalf of RMA. He earned a B.S. in Economics from the University of Lowell.
Donald M. Westermann, 42, is an Executive Vice President and the Chief Information Officer at Eastern Bank. He joined Eastern in 2007. Currently, he leads the Technology, Operations and Eastern Labs Teams, and is responsible for all aspects of the technology, operations and innovation strategy for Eastern, including digital, cyber-security, innovation, software engineering, data management, and delivery. Prior to joining Eastern, Mr. Westermann served as a Senior Manager with Grant Thornton and before that served as a consultant with Arthur Anderson, in each case in positions focused on technology and management information systems. Mr. Westermann earned a B.S. in Business Administration and Management Information Systems from Villanova University and an M.B.A. from the Sloan School of Management of the Massachusetts Institute of Technology.
Board Independence
The Nasdaq listing rules requires that independent directors compose a majority of a listed company’s board of directors. In addition, the Nasdaq listing rules require that, subject to specified exceptions, each member of a listed company’s audit, compensation, and nominating and corporate governance committees be independent and that audit committee members also satisfy independence criteria set forth in Rule 10A-3 under the Exchange Act. Under Nasdaq listing rules, a director will only qualify as an “independent director” if, in the opinion of our Board of Directors, that person does not have a relationship that would interfere with the exercise of independent judgment in carrying out the responsibilities of a
150
Table of Contents
director. In order to be considered independent under the Exchange Act, a member of an audit committee of a listed company may not, other than in his or her capacity as a member of the audit committee, the board of directors or any other board committee: (1) accept, directly or indirectly, any consulting, advisory or other compensatory fee from the listed company or any of its subsidiaries; or (2) be an affiliated person of the listed company or any of its subsidiaries. In addition to satisfying general independence requirements under the Nasdaq listing rules, a member of a compensation committee of a listed company may not, other than in his or her capacity as a member of the compensation committee, the board of directors or any other board committee, accept, directly or indirectly, any consulting, advisory or other compensatory fee from the listed company or any of its subsidiaries. Additionally, the board of directors of the listed company must consider whether the compensation committee member is an affiliated person of the listed company or any of its subsidiaries and, if so, must determine whether such affiliation would impair the director’s judgment as a member of the compensation committee.
Based upon information requested from and provided by each director concerning his or her background, employment and affiliations, family and other relationships, including those relationships described under the section of this prospectus entitled “Transactions with Related Persons,” our Board of Directors determined that each of our directors, with the exception of Robert F. Rivers and Richard Holbrook, are “independent” under the Nasdaq listing rules. Mr. Rivers is not considered independent because he currently serves as our chief executive officer. Mr. Holbrook served as chief executive officer from January 1, 2007 through December 31, 2016. Our Board of Directors also determined that each member of the audit, compensation, and nominating and corporate governance committees satisfies the independence standards for such committees established by the SEC and the Nasdaq listing rules, as applicable. In making these determinations on the independence of our directors, our Board of Directors considered the relationships that each such non-employee director has with our company and all other facts and circumstances our Board of Directors deemed relevant in determining independence.
Committees of the Board of Directors
We conduct business through meetings of our Board of Directors and its committees. The Board of Directors of Eastern Bankshares, Inc. has established various standing committees, including a Compensation Committee and an Audit Committee. Each of these committees operates under a written charter, which governs its composition, responsibilities and operations.
The table below sets forth the directors who serve on each of the committees for Eastern Bankshares, Inc. Note that, in addition to the committees below, Eastern Bank also maintains two additional committees, the Innovation Committee and the Trust Committee. The asterisk designates the committee’s chair. The Board of Directors of Eastern Bankshares, Inc. has designated director Peter K. Markell as an “audit committee financial expert,” as that term is defined by the rules and regulations of the Securities and Exchange Commission.
| Audit |
Compensation | Nominating/ Governance | ||
| Richard C. Bane* | Richard C. Bane | Richard C. Bane | ||
| Luis Borgen | Luis Borgen | Joseph T. Chung | ||
| Paul M. Connolly | Joseph T. Chung | Paul M. Connolly* | ||
| Peter K. Markell | Paul M. Connolly | Diane S. Hessan | ||
| Paul D. Spiess | Deborah C. Jackson | Deborah C. Jackson | ||
| Peter K. Markell* | Peter K. Markell | |||
| Paul D. Spiess |
| Risk Management |
Strategic Advisory |
|||||
| Richard C. Bane | Richard C. Bane | |||||
| Luis Borgen | Joseph T. Chung | |||||
| Paul M. Connolly | Diane S. Hessan | |||||
| Bari A. Harlam | Deborah C. Jackson | |||||
| Diane S. Hessan | Peter K. Markell | |||||
| Richard E. Holbrook | Robert F. Rivers* | |||||
| Peter K. Markell | ||||||
| Robert F. Rivers | ||||||
| Greg A. Shell | ||||||
| Paul D. Spiess* |
151
Table of Contents
TRANSACTIONS WITH RELATED PERSONS
We have had and expect in the future to have transactions with certain “related persons.” Related persons include our executive officers, directors, 5% or more beneficial owners of our common stock, immediate family members of these persons and entities in which one of these persons has a direct or indirect material interest. These transactions include, but are not limited to, lending activities and deposit services. We generally refer to transactions with these related persons as “related party transactions.”
Related Party Transaction Policy
Our Board of Directors will adopt a written policy governing the review and approval of transactions with related persons that will or may be expected to exceed $120,000 in any fiscal year. The policy will call for the related party transactions to be reviewed and, if deemed appropriate, approved or ratified by our nominating and governance committee. Upon determination by our nominating and governance committee that a transaction requires review under the policy, the material facts are required to be presented to the nominating and governance committee. In determining whether or not to approve a related party transaction, our nominating and governance committee will take into account, among other relevant factors, whether the related party transaction is in our best interests, whether it involves a conflict of interest and the commercial reasonableness of the transaction. In the event that we become aware of a related party transaction that was not approved under the policy before it was entered into, our nominating and governance committee will review such transaction as promptly as reasonably practical and will take such course of action as may be deemed appropriate under the circumstances. In the event a member of our nominating and governance committee is not disinterested with respect to the related party transaction under review, that member may not participate in the review, approval or ratification of that related party transaction.
Certain decisions and transactions are not subject to the related party transaction approval policy, including: (i) decisions on compensation or benefits relating to directors or executive officers, (ii) indebtedness to us in the ordinary course of business, on substantially the same terms, including interest rates and collateral, as those prevailing at the time for comparable loans with persons not related to us and not presenting more than the normal risk of collectability or other unfavorable features, and (iii) other ordinary course transactions.
Transactions with Certain Related Persons
The Sarbanes-Oxley Act of 2002 generally prohibits publicly traded companies from making loans to their executive officers and directors, but it contains a specific exemption from the prohibition for loans made by federally insured financial institutions, such as Eastern Bank, to their executive officers and directors in compliance with federal banking regulations. At March 31, 2020, we had $21.0 million of loans to related persons, including executive officers, directors and affiliates of directors. These loans were made in the ordinary course of business, were made on substantially the same terms, including interest rates and collateral, as those prevailing at the time for comparable loans with persons not related to Eastern Bank, and did not involve more than the normal risk of collectability or present other unfavorable features. These loans were performing according to their original terms at March 31, 2020 and were made in compliance with federal banking regulations.
152
Table of Contents
EXECUTIVE AND DIRECTOR COMPENSATION
The table below summarizes the total compensation paid to, or earned by, Mr. Rivers, who served as our Chief Executive Officer, Mr. Fitzgerald, who served as our Chief Administrative Officer and Chief Financial Officer, and Mr. Miller, who served as our President for the year ended December 31, 2019. We refer to these individuals as “Named Executive Officers.”
| Year Ended December 31, 2019 | ||||||||||||||||||||
| Name and Principal Position |
Salary (1) | Non-Equity Incentive Plan Compensation (2) |
Nonqualified Deferred Compensation Earnings (3) |
All Other Compensation (4) |
Total | |||||||||||||||
| Robert F. Rivers |
$ | 929,167 | $ | 1,940,800 | $ | 1,206,105 | $ | 408,459 | $ | 4,484,531 | ||||||||||
| Chief Executive Officer and Chair of the Board of Directors of Eastern Bank |
||||||||||||||||||||
| Quincy L. Miller |
545,833 | 412,000 | 148,375 | 212,635 | 1,318,843 | |||||||||||||||
| President and Vice Chair |
||||||||||||||||||||
| James B. Fitzgerald |
545,833 | 796,800 | 417,049 | 214,402 | 1,974,084 | |||||||||||||||
| Chief Financial Officer, Chief Administrative Officer, and Vice Chair |
||||||||||||||||||||
| (1) | Represents base salary earned in 2019. |
| (2) | Represents bonuses earned under the Management Incentive Plan during 2019 and the amounts payable under the Long-Term Incentive Plan awards that matured on December 31, 2019. For Messrs. Rivers, Miller and Fitzgerald, amounts earned under the Management Incentive Plan in 2019 were $1,075,000, $412,000, and $412,000, respectively. Bonuses under the Management Incentive Plan are based on performance components outlined in the plan, which components are subject to modification at the discretion of the Chief Executive Officer during the plan year. For Messrs. Rivers and Fitzgerald, the amounts payable under the Long-Term Incentive Plan awards that matured on December 31, 2019 were $865,800 and $384,800, respectively. None of Mr. Miller’s Long-Term Incentive Plan awards matured on December 31, 2019. The amounts shown in this column do not include any portion of the estimated value as of December 31, 2019 of vested Long-Term Incentive Plan awards that will mature in future years, which for Messrs. Rivers, Miller and Fitzgerald were $2,746,980, $1,089,100 and $1,089,100, respectively. See the subsection titled “—Long-Term Incentive Plan” below for additional information regarding the estimated value as of December 31, 2019 of Long-Term Incentive Plan awards to Messrs. Rivers, Miller and Fitzgerald that will mature in 2020, 2021, 2022 and 2023, respectively. |
| (3) | Represents the 2019 increase in the value of the SERP benefit, which increases (or decreases) based upon changes in one or more generally available investment benchmarks or strategies chosen by the respective participant. |
| (4) | Other compensation includes the amounts set forth in the following table: |
| Officer |
Perquisites (1) | Defined Contribution Plans (2) |
Employer SERP Contributions (3) |
Total | ||||||||||||
| Robert F. Rivers |
$ | 16,226 | $ | 8,400 | $ | 383,833 | $ | 408,459 | ||||||||
| Quincy L. Miller |
11,068 | 8,400 | 193,167 | 212,635 | ||||||||||||
| James B. Fitzgerald |
12,835 | 8,400 | 193,167 | 214,402 | ||||||||||||
| (1) | Amount includes automobile and parking allowances and taxable imputed income; all named executive officers declined club fees. |
| (2) | Amount includes employer contributions to the 401(k) Plan. |
| (3) | Represents deemed employer SERP contributions made during 2019. |
Severance and Change in Control Agreements
Eastern has entered into severance agreements with Messrs. Rivers and Miller and change in control agreements with each of the most senior executive officers. These change in control agreements provide for certain payments to these individuals in the event of the termination of their employment under specific circumstances.
Severance Agreements. Eastern Bank has entered into separate agreements with Messrs. Rivers and Miller governing certain terms of their employment with and separation from the company in circumstances not involving a change in control of Eastern. Under the terms of those agreements, in the event an executive is terminated for cause, the executive will receive
153
Table of Contents
all earned but unpaid salary, all accrued but unused vacation pay, vested and accrued bonuses or other incentive compensation, and reimbursements for any reasonable, necessary and properly documented expenses. In the event of termination without cause, in addition to the payments outlined above, Eastern will pay to the executive within 60 days of his termination a lump sum payment equal to 200% of his annual base compensation plus a prorated share of the annual incentive payment to which the executive would have been eligible under the Management Incentive Plan (described below) during the calendar year in which the termination date falls. The executive will also receive full vesting of benefits in existing grants under Eastern Bank’s Long-Term Incentive Plan. If Mr. Rivers elects COBRA coverage, Mr. Rivers will also receive 24 months of continued participation in Eastern group health and dental insurance plans, with Eastern Bank paying or reimbursing Mr. Rivers for the cost of such premiums, and Mr. Miller will receive a lump sum payment equivalent to 24x the amount of Eastern’s standard monthly contributions to Mr. Miller’s Eastern Bank group health and dental insurance premiums. The agreements provide for certain restrictive covenant obligations, which include each of Messrs. Rivers and Miller agreeing not to solicit customers and employees of Eastern Bank during their employment with Eastern Bank and continuing for a period ending 24 months following their termination of employment. In addition, Mr. Miller’s agreement also specifies that while he is employed, he will receive an annual base salary of not less than $450,000 (subject to adjustment), discretionary incentive and/or bonus compensation, and participation on generally applicable terms and conditions in other compensation and fringe benefit plans, an automobile allowance of $700 each month, and reimbursement of country club membership fees. Mr. Rivers’ agreement does not address compensation or benefits during employment.
Change in Control Agreements. In connection with the offering, Eastern has entered into change in control agreements with each of our most senior executive officers, including our Named Executive Officers. With certain exceptions discussed below, the agreements are substantially similar, and provide that if, during a potential change in control period or within 18 months after the consummation of a change in control, the executive’s employment is involuntarily terminated for reasons other than for “cause,” disability or death, or the executive voluntary resigns for “good reason,” the executive would be entitled to a lump sum severance payment equal to a multiple of (a) his or her base salary, plus (b) the greater of the executive’s annual bonus for the year in which the termination occurred and the average of the executive’s bonuses for the three (3) years immediately preceding the year in which the termination occurred. Such payment would be payable within sixty (60) days following the executive’s date of termination. For Mr. Rivers and Mr. Miller the applicable multiplier is 300%; for each of the other executives, the multiplier is 200%. In addition to the lump sum severance payment, Eastern will make a monthly cash payment for 18 months or the executive’s COBRA health continuation period, whichever ends earlier, in the amount that Eastern would have made to provide health and dental insurance to the executive. Any payment required under the agreements will be reduced to the extent necessary to avoid penalties under Section 280G of the Internal Revenue Code, but only if such reduction would result in a higher after-tax amount to the executive. In exchange for the lump sum severance payments and other benefits, the change in control agreements provide for certain post-employment obligations with respect to the executive’s ability to compete with Eastern and solicit our employees or customers. To receive benefits, Mr. Rivers and Mr. Miller will have to agree not to compete within that specified geographic area for two years after their separation and not to solicit customers or employees for three years; and the other executive officers will have to agree not to compete within that specified geographic area for one year after their separation and not to solicit customers or employees for two years.
The definition of a change in control includes the following scenarios: the Eastern directors do not constitute at least two-thirds of the board of directors of the company resulting from the combination (the “Surviving Board”); the shareholders of Eastern, immediately after the combination, own less than 60% of the combined voting power of the securities having the right to vote in an election of the Surviving Board; a person (or a group of persons acting in concert), other than Eastern Bankshares, Inc., becomes the beneficial owner of 25% or more of the combined voting power of the securities having the right to vote in an election of the Board of Directors of Eastern Bankshares, Inc. or Eastern Bank; or during any period of two consecutive years, individuals who constitute the Board of Trustees or Directors of Eastern at the beginning of such two-year period cease for any reason to constitute at least a majority of the Board, except that an individual shall be deemed to have been a trustee or director at the beginning of such period if such individual was elected, or nominated for election, by a vote of at least two-thirds of the trustees or directors who were trustees or directors at the beginning of the two-year period or were so elected or nominated by such trustees or directors; the sale of all or substantially all of the assets of Eastern Bankshares, Inc. or Eastern Bank; or any other transaction that the Board of Trustees or Board of Directors or other governing body of Eastern Bankshares, Inc. (or, if there is no Eastern Bankshares, Inc., Eastern Bank) determines constitutes a change in control for purposes of the change in control agreements.
Management Incentive Plan
We have instituted a Management Incentive Plan (“MIP”) as a short-term incentive plan for our executive officers to incentivize personal performance in conjunction with Eastern’s overall performance. MIP payments are based on both Eastern’s overall performance and the executive’s personal performance. For the year ended December 31, 2019, Mr. Rivers
154
Table of Contents
received an MIP payment of $1,075,000, and Messrs. Miller and Fitzgerald each received an MIP payment of $412,000, representing 113%, 75% and 75% of their 2019 base salaries, respectively.
We also have instituted an Eastern Insurance Group LLC Management Incentive Plan as a short-term incentive plan for our executive officers employed by Eastern Insurance Group LLC to incentivize personal performance in conjunction with our overall performance. Payments are based on the performance of Eastern Insurance Group LLC, the overall performance of Eastern Bank and the executive’s personal performance.
Long-Term Incentive Plan
Eastern’s Long-Term Incentive Plan is a deferred compensation plan designed to link incentive compensation for all executive officers and selected other officers to the growth of Eastern’s capital or, more recently, Eastern’s retained earnings. Long-Term Incentive Plan awards (“LTIP awards”) were made based on targets for cash compensation and as a percentage of an executive’s base salary in the year granted.
Eastern intends to pay in July 2020 the LTIP awards that were made in 2015 and matured on December 31, 2019. LTIP awards made in 2016 through 2019 will remain outstanding after the offering. No awards will be made under the current Long-Term Incentive Plan in 2020 or thereafter, although payments for past LTIP awards will be provided in accordance with their terms through 2024. Outstanding LTIP awards are subject to three-year vesting with accelerated vesting for participants who satisfy retirement eligibility under the LTIP award. Mr. Rivers and Mr. Fitzgerald are fully vested in all of their LTIP awards.
Generally, LTIP awards are valued as of December 31 of each year in the five-year grant cycle. The value of outstanding LTIP awards made in 2016 through 2019 will continue to be based primarily upon growth in Eastern’s capital or adjusted retained earnings, as applicable, and will not be tied to the value of our common stock after the offering. In calculating the growth in capital and adjusted retained earnings for periods after the offering, our Board of Directors intends to exclude the proceeds from the offering, as well as a theoretical return on the reinvestment of such proceeds partially offset by any direct and indirect costs of the offering, including incremental expenses required by the conversion.
After the five-year grant cycle for an LTIP award ends and the final appreciation is determined based on the cumulative growth in Eastern’s capital or adjusted retained earnings, as applicable, a modifier that can increase or decrease the value of the LTIP awards by up to 20% is applied to the cumulative appreciation at the discretion of the Board of Directors to determine the final value of the LTIP awards then due to be paid. The two factors used by the Board to determine the modifier are Eastern’s performance during the prior five-year period relative to a group of peer banks and the Board’s assessment of management’s performance during the prior five-year period, using an assessment framework similar to the six-factor Uniform Financial Institutions Rating System commonly referred to as CAMELS ratings.
LTIP awards generally are paid in a taxable lump sum, less applicable withholdings, in the calendar year following the last year of the five-year grant cycle, except for participants who terminate before retirement is reached, who are then paid currently, and for awards held by retirement-eligible participants, in which case the award will be paid in the ordinary course after the applicable five-year period (except in the event of death of a retirement-eligible participant with respect to certain LTIP award grants). Payments under LTIP awards are increased by “deemed interest,” which is measured from the maturity date to the payment date and is based on the highest available rate under Eastern Bank’s deposit instruments at the time.
For the year ended December 31, 2019, the accrued compensation expense for all outstanding LTIP awards totaled $24.2 million.
155
Table of Contents
For the year ended December 31, 2019, Mr. Rivers and Mr. Fitzgerald received payments of $552,920 and $241,902, respectively, for LTIP awards made in 2014 and that matured on December 31, 2018. The chart below shows for Messrs. Rivers, Miller and Fitzgerald the amounts that we intend to pay in 2020 for LTIP awards that were granted in 2015 and matured on December 31, 2019, as well as the estimated values as of December 31, 2019 of LTIP awards granted in 2016 through 2019. The value of LTIP awards granted in 2016 through 2019 will change, as described above, based primarily on the cumulative growth in our capital or adjusted retained earnings, as applicable.
| Long-Term Incentive Plan Payments (Grant Year/Payment Year) | ||||||||||||||||||||||||
| Estimated Values as of December 31, 2019 (1) | ||||||||||||||||||||||||
| Name and principal position |
Granted 2015 Payable 2020 |
Granted 2016 Payable 2021 (1) |
Granted 2017 Payable 2022 (1) |
Granted 2018 Payable 2023 (1) |
Granted 2019 Payable 2024 (1) |
Total | ||||||||||||||||||
| Robert F. Rivers |
$ | 865,800 | $ | 909,600 | $ | 952,500 | $ | 636,480 | $ | 248,400 | $ | 3,612,780 | ||||||||||||
| Quincy L. Miller |
— | 454,800 | 317,500 | 234,000 | 82,800 | 1,089,100 | ||||||||||||||||||
| James B. Fitzgerald |
384,800 | 454,800 | 317,500 | 234,000 | 82,800 | 1,473,900 | ||||||||||||||||||
| (1) | Values for LTIP awards payable in 2021-2024 are estimated as of December 31, 2019 and subject to change under the terms of Long-Term Incentive Plan. |
Benefit Plans
401(k) Plan. Eastern Bank maintains a tax-qualified profit-sharing plan with an employee elective deferral feature under Section 401(k) of the Internal Revenue Code (the “401(k) Plan”). All full-time or part-time employees who meet specific service requirements and who have attained the age of 21 are eligible to make elective deferrals to the 401(k) Plan. Employees generally qualify for employer contributions following an eligibility year with 1,000 hours or more of service.
A participant may contribute up to 75% of his or her compensation to the 401(k) Plan on a pre-tax or after-tax “Roth contribution” basis, subject to the limitations imposed by the Internal Revenue Code. For 2020, the deferral contribution limit is $19,500, except that any participant over age 50 may contribute, an additional “catch-up contribution” of up to $6,500 to the 401(k) Plan each year (subject to applicable cost-of-living adjustments in future years). In addition to deferral contributions, the 401(k) Plan provides that Eastern Bank will make a safe harbor contribution to eligible participants’ accounts equal to 3% of the participant’s plan compensation (as defined in the 401(k) Plan) earned during the plan year. A participant is always 100% vested in his or her deferral contributions and safe harbor contributions. The 401(k) Plan permits a participant to direct the investment of his or her own account into various investment options.
Generally, a participant (or participant’s beneficiary) may receive a distribution from his or her vested account at retirement, age 591⁄2 (while employed with Eastern Bank), death, hardship, disability or termination of employment, and elect for the distribution to be paid in the form of a lump sum or other alternative forms of payment permitted by the plan.
In connection with the offering, we intend to allow participants to invest up to the greater of 50% of their account balances (less the outstanding balance of participant loans, if any) or $250 under the 401(k) Plan in Eastern Bankshares, Inc. common stock. We will also allow participants in the 401(k) Plan to invest up to 50% of future pre- and after-tax deferrals and employer safe harbor contributions in Eastern Bankshares, Inc. common stock. However, after the offering, we will prohibit intra-plan transfers that would have the effect of increasing a participant’s ownership of common stock through the 401(k) Plan if at that time the participant’s 401(k) Plan account, less the outstanding balance of a participant’s loans, if any, is 50% or more invested in Eastern Bankshares, Inc. common stock. See the section of this prospectus titled “The Conversion and Offering—Subscription Offering and Subscription Rights” for more information.
Employee Stock Ownership Plan. In connection with the offering, Eastern Bank adopted an employee stock ownership plan for eligible employees, i.e., those employees of Eastern Bank who have attained age 21 and have 1,000 hours of service in the 12-month period commencing on an employee’s employment date. If the eligibility requirements are not satisfied in the first year of employment, subsequent eligibility periods will be measured on the anniversaries of the employment date. Employees who satisfy the eligibility requirements will begin participation in the employee stock ownership plan on the later of the effective date of the offering or upon the first day of the month commencing on or after the eligible employee’s satisfaction of the eligibility requirements.
156
Table of Contents
The employee stock ownership plan trustee is expected to purchase, on behalf of the employee stock ownership plan, 8% of the sum of the shares of common stock sold in the offering plus the number of shares we donate to the Eastern Bank Charitable Foundation. The ultimate decision, however, of whether or not and to what extent the employee stock ownership plan will purchase shares in the offering will be made by its trustee (initially a committee comprised of Eastern Bank executives) acting in its fiduciary capacity with respect to the employee stock ownership plan. The employee stock ownership plan will not initially have an independent trustee. We expect that this purchase will be made in the offering, but in the event the amount purchased by the employee stock ownership plan does not equal such 8%, then if market conditions warrant, in the judgment of our employee stock ownership plan trustee, purchases could be made after the offering in open market purchases. The employee stock ownership plan will fund its stock purchase with a loan from Eastern Bankshares, Inc. equal to the aggregate purchase price of the common stock. The loan will be repaid principally through Eastern Bank’s contribution to the employee stock ownership plan and dividends, if any, payable on common stock held by the employee stock ownership plan over the anticipated 30-year term of the loan. The interest rate for the employee stock ownership plan loan is expected to be an adjustable rate equal to the prime rate, as published in The Wall Street Journal, on the closing date of the offering, and thereafter, equal to the prime rate on the first business day of each succeeding calendar year.
The trustee will hold the shares purchased by the employee stock ownership plan in an unallocated suspense account, and shares will be released from the suspense account on a pro-rata basis as the loan is repaid, assuming level loan payments. The trustee will allocate the shares released among participants on the basis of each participant’s proportional share of compensation relative to the compensation of all participants. Each participant will cliff-vest in his or her benefit, i.e., will become 100% vested, after three years of vesting service with Eastern Bank or a participating subsidiary. Credited service will include both calendar years of service from January 1, 2020 (the initial effective date of the employee stock ownership plan) and years of vesting service that a participant has earned under the Bank’s defined benefit pension plan prior to the adoption of the employee stock ownership plan. A participant also will become fully vested in his or her benefit upon normal retirement, early retirement, death or disability, a change in control, or termination of the employee stock ownership plan. A vested participant will be entitled to receive a distribution from the employee stock ownership plan upon separation from service or, if earlier, plan termination.
The employee stock ownership plan permits a participant to direct the trustee as to how to vote the shares of common stock allocated to his or her account. The trustee votes unallocated shares and allocated shares for which participants do not provide voting instructions on a matter in the same ratio as those shares for which participants provide instructions, subject to fulfillment of the trustee’s fiduciary responsibilities.
Defined Benefit Pension Plan. Eastern Bank provides pension benefits to employees through membership in the Savings Bank Employees’ Retirement Association (“SBERA”). The plan is a noncontributory, defined benefit plan. Our annual contribution to the defined benefit plan is based upon standards established by the Pension Protection Act. The contribution is based on an actuarial method intended to provide not only for benefits attributable to service to date, but also for those expected to be earned in the future. The Board has approved conversion of the defined benefit pension plan from a “traditional pension plan” with a benefit formula based on age, service and salary, to a “cash balance” defined benefit plan. The conversion is expected to occur November 1, 2020.
Supplemental Executive Retirement Plans. Eastern maintains a supplemental executive retirement plan (“SERP”), in which Messrs. Rivers, Miller and Fitzgerald participate. Executives who participate in the SERP are ineligible to participate in our Benefits Equalization Plan described below. Under the SERP, each executive becomes entitled to receive a benefit following his or her separation from service (as defined in the agreements). During the executive’s service with the Company, his or her account is credited monthly by Eastern Bank at 20% of his or her salary and 20% target short-term incentive (subject to adjustment when the actual short-term incentive is determined). Each executive’s SERP benefit vests over a 10-year period commencing at 50% after five years of service and 10% each year thereafter. However, a participant will be fully vested if retirement eligible or upon death or disability. An executive is retirement eligible upon the earlier of age 65, age 60 with 5 years of service or age 55 with 10 years of service. Messrs. Rivers and Fitzgerald vested due to being retirement eligible.
Benefits Equalization Plan. Eastern Bank maintains a non-qualified benefits equalization plan (“BEP”) to provide a pension supplement to restore pension benefits for employees who are not eligible for the SERP and whose compensation exceeds the annual statutory compensation maximum that can be considered under the defined benefit plan, and/or exceeds the annual permitted pension benefit amount under the Internal Revenue Code. These IRS limits for the plan year beginning in 2019 were $280,000 (compensation) and $225,000 (annual benefit) and for the plan year beginning in 2020 are $285,000 and $230,000. The
157
Table of Contents
benefit formula is the same as provided in the defined benefit pension plan, with an offset for benefits provided by that plan. Benefits generally (unless the participant elects to postpone pursuant to the BEP) are paid in a lump sum in the January following retirement or death. For the year ended December 31, 2019, the accrued compensation expense for the BEP totaled $21.6 million. As of March 31, 2020, the unfunded BEP obligation was $37.3 million. In connection with the conversion of the defined benefit pension plan to a cash balance plan, the BEP is also being amended to a cash balance format.
409A Deferred Compensation Plan. Eastern Bank maintains a 409A Deferred Compensation Plan (“409A Plan”) that allows directors and certain former corporators of Eastern Bank Corporation and selected executives of Eastern Bank to defer compensation under a non-qualified deferred compensation plan. Although all directors and executive officers are eligible to participate in the 409A Plan, as of March 31, 2020 only five executive officers but none of our named executive officers participate. Directors Bane, Connolly and Harlam also participate in the 409A Plan. Amounts deferred are fully vested. Although employer contributions are permitted, none have been made to date.
Eastern Insurance Group LLC Supplemental Executive Retirement Plan. The Eastern Insurance Group LLC Supplemental Executive Retirement Plan (“EIG SERP”) allows select administrative and sales executives to defer compensation. One executive officer is a participant in the EIG SERP but none of our named executive officers participate.
Rabbi Trusts. Eastern Bank maintains grantor trusts, which also are known as “rabbi trusts,” one of which relates to the employees of an acquired bank. The rabbi trusts hold assets that are available to pay benefits under various non-qualified deferred compensation arrangements. In the event of a change in control, an additional contribution would be required to fund the rabbi trust for Eastern Bank employees to 110% of the defined benefit liability and 100% of any defined contribution liability, with any surplus returned to Eastern Bank or its successor. Eastern Bank would not incur additional compensation expense if such funding were required.
Director Compensation
For the year ended December 31, 2019, each of our directors (other than the Chair of the Board) received an annual fee of $50,000 as a Board of Directors retainer and annual fees ranging from $5,000 to $6,250 in committee meeting fees, in addition to retainers provided for Chairs of certain committees. Directors who are also employees are not compensated for serving as directors.
Set forth below is a summary of the compensation received by each of our non-employee directors for the year ended December 31, 2019.
| Year Ended December 31, 2019 | ||||||||||||||||
| Name |
Fees earned ($) (1) |
Nonqualified Deferred Compensation Earnings (2) |
All Other Compensation ($) (3) |
Total ($) | ||||||||||||
| Richard C. Bane |
$ | 101,800 | $ | 394,168 | $ | 50,000 | $ | 545,968 | ||||||||
| Luis Borgen |
76,800 | — | 50,000 | 126,800 | ||||||||||||
| Joseph T. Chung |
88,050 | — | 50,000 | 138,050 | ||||||||||||
| Paul M. Connolly |
95,800 | 70,055 | 50,000 | 215,855 | ||||||||||||
| Bari A. Harlam |
69,000 | 84,346 | 50,000 | 203,346 | ||||||||||||
| Diane S. Hessan |
73,050 | — | 50,000 | 123,050 | ||||||||||||
| Richard E. Holbrook (4) |
84,550 | — | — | 84,550 | ||||||||||||
| Deborah C. Jackson |
118,050 | — | 50,000 | 168,050 | ||||||||||||
| Peter K. Markell |
96,050 | — | 50,000 | 146,050 | ||||||||||||
| Greg A. Shell |
78,750 | — | 50,000 | 128,750 | ||||||||||||
| Paul D. Spiess |
90,250 | — | 50,000 | 140,250 | ||||||||||||
| (1) | Represents total fees earned in 2019, including fees deferred pursuant to the 409A Deferred Compensation Plan. |
| (2) | Represents the 2019 increase in the value of the deferred compensation benefits noted above, which increase (or decrease) is based upon changes in one or more generally available investment benchmarks or strategies chosen by the respective participant. |
| (3) | Represents 2019 accruals under the Outside Directors’ Retainer Continuance Plan. As a former executive of Eastern Bank Corporation, Mr. Holbrook is not eligible to participate in this plan. |
| (4) | In addition to his fees earned as a director in 2019, Mr. Holbrook also received $898,496 related to a 2014 grant under the Long-Term Incentive Plan, and a $200,000 retirement-related payment in 2019 in connection with his previous tenure as Chief Executive Officer. |
158
Table of Contents
Outside Directors’ Retainer Continuance Plan. In addition to the fees outlined above, directors who have never been employees of Eastern Bank or an acquired company (“Outside Directors”) are eligible for an annual benefit after retirement or other separation from service (the “Outside Directors’ Retainer Continuance Plan”). An amount equal to one year’s annual retainer is accrued for each Outside Director on an annual basis. At the time of payout, Outside Directors receive annual payments equal to the sum of all annual retainers paid to the Outside Director (disregarding meeting fees and other payments) divided by the number of years in the benefit period. The “benefit period” is the lesser of ten or the total years of service as an Outside Director. Beneficiaries of a deceased Outside Director receive the benefits to which the Outside Director was entitled and in the event that the deceased Outside Director had not yet started receiving payments under the plan, starting no earlier than the year in which the Outside Director would have attained the age of 50.
The Eastern Bank Deferred Compensation Plan. Eastern Bank maintains a frozen non-qualified plan for elective deferrals prior to January 1, 2005. The frozen plan is “grandfathered” and not subject to Section 409A of the Internal Revenue Code. Mr. Bane is the only Director participating in this plan.
Benefits to be Considered Following Completion of the Offering
Following the offering, we intend to adopt one or more new stock-based benefit plans that will provide for grants of stock options and restricted common stock awards. If adopted within 12 months following the completion of the offering, the aggregate number of shares reserved for the grants of stock options or available for restricted stock awards under the stock-based benefit plans would be limited to 10% and 4%, respectively, of the shares sold in the offering and donated to the Eastern Bank Charitable Foundation.
The stock-based benefit plans will not be established sooner than six months after the offering, and if adopted within one year after the offering, the plans must be approved by the holders of at least a majority of the votes eligible to be cast by our shareholders. If stock-based benefit plans are established more than one year after the offering, they must be approved by a majority of votes cast by our shareholders. The stock-based benefit plans are also subject to the applicable Nasdaq shareholder approval requirements, which generally require that any stock-based benefit plan must be approved by a majority of the votes cast on the proposal to adopt or amend such a plan. The following additional restrictions would apply to our stock-based benefit plans only if such plans are adopted within one year after the offering:
| • | non-employee directors in the aggregate may not receive more than 30% of the options and restricted stock awards authorized under the plans; |
| • | any one non-employee director may not receive more than 5% of the options and restricted stock awards authorized under the plans; |
| • | any officer or employee may not receive more than 25% of the options and restricted stock awards authorized under the plans; |
| • | if, as we expect, Eastern Bank has tangible capital of 10% or more, in which case tax-qualified employee stock benefit plans and restricted stock plans may acquire up to 12% of the shares sold in the offering; |
| • | the options and restricted stock awards may not vest more rapidly than 20% per year, beginning on the first anniversary of shareholder approval of the plans; |
| • | accelerated vesting is not permitted except for death, disability or upon a change in control of Eastern Bank or Eastern Bankshares, Inc.; and |
| • | our executive officers or directors must exercise or forfeit their options in the event that Eastern Bank becomes critically undercapitalized, is subject to enforcement action or receives a capital directive. |
Any shares awarded in excess of the limitations set forth above must be acquired in the secondary market, and such secondary market acquisitions must be no earlier than when such limitations can be exceeded.
We have not determined whether we will present stock-based benefit plans for shareholder approval prior to or more than 12 months after the completion of the offering. In the event either federal or state regulators change their regulations or policies regarding stock-based benefit plans, including any regulations or policies restricting the size of awards and vesting of benefits as described above, the restrictions described above may not be applicable.
159
Table of Contents
We may obtain the shares needed for our stock-based benefit plans by issuing additional shares of common stock from authorized but unissued shares or through stock repurchases.
The actual value of the shares awarded under stock-based benefit plans would be based in part on the price of Eastern Bankshares, Inc.’s common stock at the time the shares are awarded. The stock-based benefit plans are subject to shareholder approval, and cannot be implemented until at least six months after the offering. The following table presents the total value of all shares of restricted stock that would be available for issuance under the stock-based benefit plans, assuming the shares are awarded when the market price of our common stock ranges from $8.00 per share to $14.00 per share.
| Share Price |
5,401,042 MRP Shares Minimum |
6,354,167 MRP Shares Midpoint |
7,307,292 MRP Shares Maximum |
8,403,385 MRP Shares Super Maximum | ||||
| $8.00 |
$43,208,333 | $50,833,333 | $58,458,333 | $67,227,084 | ||||
| $10.00 |
$54,010,417 | $63,541,667 | $73,072,917 | $84,033,854 | ||||
| $12.00 |
$64,812,500 | $76,250,000 | $87,687,500 | $100,840,625 | ||||
| $14.00 |
$75,614,584 | $88,958,334 | $102,302,084 | $117,647,396 |
The grant-date fair value of the options granted under the stock-based benefit plans will be based in part on the price of shares of common stock of Eastern Bankshares, Inc. at the time the options are granted. The value also will depend on the various assumptions utilized in the option pricing model ultimately adopted. The following table presents the total estimated value of the options to be available for grant under the stock-based benefit plans, assuming the market price and exercise price for the stock options are equal and the range of market prices for the shares is $8.00 per share to $14.00 per share. The Black-Scholes option pricing model provides an estimate only of the fair value of the options, and the actual value of the options may differ significantly from the value set forth in this table.
| Exercise Price |
Grant Date Fair Value Per Option |
13,502,604 Options Minimum |
15,885,417 Options Midpoint |
18,268,229 Options Maximum |
21,008,464 Options Super Maximum | |||||
| $8.00 |
$2.02 | $27,329,271 | $32,152,083 | $36,974,896 | $42,521,130 | |||||
| $10.00 |
$2.53 | $34,161,589 | $40,190,104 | $46,218,620 | $53,151,413 | |||||
| $12.00 |
$3.04 | $40,993,906 | $48,228,125 | $55,462,344 | $63,781,695 | |||||
| $14.00 |
$3.54 | $47,826,224 | $56,266,146 | $64,706,068 | $74,411,978 |
The tables presented above are provided for informational purposes only. There can be no assurance that our stock price will not trade below $10.00 per share. Before you make an investment decision, we urge you to read this prospectus carefully, including, but not limited to, the section titled “Risk Factors” beginning on page 19.
160
Table of Contents
SUBSCRIPTIONS BY DIRECTORS AND OFFICERS
The table below sets forth information regarding intended common stock subscriptions for each of Eastern Bankshares, Inc.’s directors and named executive officers, including their associates, for the other executive officers of Eastern Bankshares, Inc. as a group, and for all of these individuals as a group. There can be no assurance that any individual director or executive officer, or the directors and executive officers as a group, will purchase any specific number of shares of our common stock. In the event the individual maximum purchase limitation is increased, persons subscribing for the maximum amount may increase their purchase order. See the section of this prospectus titled “The Conversion and Offering—Additional Limitations on Common Stock Purchases.” Directors and officers will purchase shares of common stock at the same $10.00 purchase price per share and on the same terms as other purchasers in the offering. This table excludes shares of common stock to be purchased by the employee stock ownership plan, as well as any stock awards or stock option grants that may be made no earlier than six months after the completion of the offering. Federal and state regulations prohibit our directors and officers from selling the shares they purchase in the offering for one year after the date of purchase. The directors and executive officers have indicated their intention to subscribe in the offering for an aggregate of 1,907,500 shares ($19,075,000) of common stock, equal to approximately 1.5% of the number of shares of common stock to be sold in the offering at the minimum of the offering range, assuming shares are available. Purchases by directors, officers and their associates will be included in determining whether the required minimum number of shares has been subscribed for the offering. Subscriptions by management through our 401(k) plan are included in the proposed purchases set forth below and will be counted as part of the maximum number of shares such individuals may subscribe for in the offering and as part of the maximum number of shares directors and officers may purchase in the offering.
| Name of Beneficial Owner |
Number of Shares |
Aggregate Purchase Price |
Percentage of Shares Outstanding at Minimum of Offering Range |
|||||||||
| Directors: |
||||||||||||
| Robert F. Rivers |
200,000 | $ | 2,000,000 | 0.15 | % | |||||||
| Richard E. Holbrook |
200,000 | $ | 2,000,000 | 0.15 | % | |||||||
| Deborah C. Jackson |
30,000 | $ | 300,000 | 0.02 | % | |||||||
| Richard C. Bane |
120,000 | $ | 1,200,000 | 0.09 | % | |||||||
| Luis A. Borgen |
100,000 | $ | 1,000,000 | 0.08 | % | |||||||
| Joseph T. Chung |
50,000 | $ | 500,000 | 0.04 | % | |||||||
| Paul M. Connolly |
12,500 | $ | 125,000 | 0.01 | % | |||||||
| Bari A. Harlam |
30,000 | $ | 300,000 | 0.02 | % | |||||||
| Diane S. Hessan |
40,000 | $ | 400,000 | 0.03 | % | |||||||
| Peter K. Markell |
100,000 | $ | 1,000,000 | 0.08 | % | |||||||
| Greg A. Shell |
200,000 | $ | 2,000,000 | 0.15 | % | |||||||
| Paul D. Spiess |
100,000 | $ | 1,000,000 | 0.08 | % | |||||||
| Other Named Executive Officers: |
||||||||||||
| Quincy L. Miller |
75,000 | $ | 750,000 | 0.06 | % | |||||||
| James B. Fitzgerald |
150,000 | $ | 1,500,000 | 0.12 | % | |||||||
| Total for directors and other named executive officers |
1,407,500 | $ | 14,075,000 | 1.1 | % | |||||||
| Other Executive Officers: |
||||||||||||
| Total for directors and executive officers as a group |
1,917,500 | $ | 19,175,000 | 1.5 | % | |||||||
|
|
|
|
|
|
|
|||||||
| (1) | The mailing address for each person listed is 265 Franklin Street, Boston, Massachusetts 02110 |
| (2) | At the adjusted maximum of the offering range, the intended subscriptions by directors and executive officers, as a group, would represent approximately 1% of our outstanding shares of common stock, assuming shares are available. |
161
Table of Contents
The Board of Trustees of Eastern Bank Corporation and the Board of Directors of Eastern Bankshares, Inc. have approved the plan of conversion. We anticipate that the plan of conversion will also be approved by the corporators of Eastern Bank Corporation. We have filed an application with respect to the offering with the Federal Reserve Board, and the approval of the Federal Reserve Board is required before we can consummate the offering. We have filed an application with respect to the offering with the Massachusetts Commissioner of Banks, and the Massachusetts Commissioner of Banks has authorized us to commence the offering. However, the final approval of the Massachusetts Commissioner of Banks is required before we can consummate the offering. Any approval by the Massachusetts Commissioner of Banks or the Federal Reserve Board does not constitute a recommendation or endorsement of the plan of conversion.
General
The Board of Trustees of Eastern Bank Corporation and the Board of Directors of Eastern Bankshares, Inc. adopted the plan of conversion on June 12, 2020. Upon the completion of the offering, we will donate to Eastern Bank Charitable Foundation a number of shares of our common stock equal to 4% of the shares outstanding immediately after that donation. According, immediately after the completion of the offering and our donation of those shares to Eastern Bank Charitable Foundation, the purchasers in the offering will own, in the aggregate, 96% of our common stock and the Eastern Bank Charitable Foundation will own 4% of our common stock. A diagram of our corporate structure before and after the offering is set forth in the “Summary” section of this prospectus.
Pursuant to the plan of conversion, we will offer shares of common stock for sale in the subscription offering to our eligible account holders, supplemental eligible account holders, our tax-qualified employee benefit plans, including our employee stock ownership plan and 401(k) plans, and our employees, officers, trustees, directors and corporators. In addition, we may offer common stock for sale in a community offering to members of the general public, with a preference given to natural persons, and trusts of natural persons, residing in the Massachusetts and New Hampshire cities and towns appearing on page 11 of this prospectus.
We have the right to accept or reject, in whole or in part, any orders to purchase shares of the common stock received in the community offering. The community offering will begin at the same time as the subscription offering and must be completed within 45 days after the completion of the subscription offering unless otherwise extended by the Massachusetts Commissioner of Banks. See the subsection titled “—Community Offering” herein.
We also may offer for sale shares of common stock not purchased in the subscription or community offerings through a syndicated offering in which J.P. Morgan Securities LLC and Keefe, Bruyette & Woods, Inc. will serve as joint book-running managers. See the subsection titled “—Syndicated Offering” herein.
We intend to retain between $527.1 million and $713.2 million of the net proceeds of the offering and to invest between $635.2 million and $859.3 million of the net proceeds in Eastern Bank. The offering will be consummated only upon the issuance of at least the minimum number of shares of our common stock offered pursuant to the plan of conversion.
We determined the number of shares of common stock to be offered in the offering based upon an independent valuation appraisal of the estimated pro forma market value of Eastern Bankshares, Inc. All shares of common stock to be sold in the offering will be sold at $10.00 per share. Investors will not be charged a commission to purchase shares of common stock. The independent valuation will be updated and the final number of the shares of common stock to be issued in the offering will be determined at the completion of the offering. See the subsection titled “—Stock Pricing and Number of Shares to be Issued” for more information as to the determination of the estimated pro forma market value of the common stock.
The following is a brief summary of the offering and is qualified in its entirety by reference to the provisions of the plan of conversion. A copy of the plan of conversion is available for inspection at each branch office of Eastern Bank. The plan of conversion is also filed as an exhibit to Eastern Bankshares, Inc.’s applications to conduct the offering and to become a bank holding company upon the completion of the offering, copies of which may be obtained from the Federal Reserve Board or inspected, without charge, at the Massachusetts Division of Banks. The plan of conversion is also filed as an exhibit to the registration statement we have filed with the Securities and Exchange Commission, of which this prospectus is a part. Copies of the registration statement may be obtained from the Securities and Exchange Commission or online at the Securities and Exchange Commission’s website, www.sec.gov. See the section of this prospectus titled “Where You Can Find Additional Information.”
162
Table of Contents
Reorganization of Eastern Immediately Prior to Completion of Offering
Eastern Bank Corporation organized Eastern Bankshares, Inc. in 2020 as a wholly-owned subsidiary of Eastern Bank Corporation. Prior to the merger, described below, Eastern Bankshares, Inc. will have no assets or liabilities and will not have engaged in any business.
The conversion will be effectuated as follows. Immediately prior to the completion of the offering but after the Federal Reserve Board approves the application for the Eastern Bankshares, Inc. to become a bank holding company under the Bank Holding Company Act of 1956, as amended, Eastern Bank Corporation will contribute to Eastern Bankshares, Inc. all of the shares of capital stock of Eastern Bank, and promptly thereafter, Eastern Bank Corporation will merge with and into Eastern Bankshares, Inc. As part of that merger, shares of Eastern Bankshares, Inc. common stock held by Eastern Bank Corporation immediately prior to the merger will be canceled and all persons holding liquidation rights in Eastern Bank Corporation immediately prior to the merger will constructively receive liquidation rights in Eastern Bankshares, Inc. Immediately after the merger, Eastern Bankshares, Inc. will sell shares of common stock in the offering, and promptly following the receipt of proceeds from such sale, Eastern Bankshares, Inc. will contribute 50% of the net proceeds to Eastern Bank.
Effects of Conversion
Eastern Bank converted to the stock form of organization when the Bank reorganized into the mutual holding company structure in 1989 with the formation of Eastern Bank Corporation. Neither the conversion nor the offering will affect the corporate structure or operations of Eastern Bank.
Continuity. The conversion will not affect the normal business of Eastern Bank of accepting deposits and making loans. Eastern Bank will continue to be a Massachusetts-chartered bank and will continue to be regulated by the Massachusetts Commissioner of Banks and the FDIC. After the conversion, Eastern Bank will continue to offer existing services to depositors, borrowers and other customers under current policies. The directors of Eastern Bank serving at the time of the conversion will be the directors of Eastern Bankshares upon the completion of the conversion. The conversion will not result in any reduction of Eastern Bank’s reserves or net worth.
Similarly, neither the conversion nor the offering will affect the structure or operations of Eastern Insurance Group LLC.
Effect on Deposit Accounts. Pursuant to the plan of conversion, each depositor of Eastern Bank at the time of the conversion will automatically continue as a depositor after the conversion, and the deposit balance, interest rate and other terms of such deposit accounts will not change as a result of the conversion. Each such account will be insured by the FDIC to the same extent as before the conversion.
Effect on Loans. No loan outstanding from Eastern Bank will be affected by the conversion, and the amount, interest rate, maturity and security for each loan will remain as it was contractually fixed prior to the conversion.
Tax Effects. We will receive opinions of our counsel with regard to federal and state income tax consequences of the conversion to the effect that neither Eastern Bank Corporation, Eastern Bankshares, Inc. nor Eastern Bank will realize, as a result of the conversion, gain or loss for federal income tax purposes, net income for Massachusetts income tax purposes, taxable business profits for New Hampshire Business Profits Tax, or gross business receipts for the New Hampshire Business Enterprise Tax. See the subsection titled “—Material Income Tax Consequences.”
Effect on Liquidation Rights. Each depositor in Eastern Bank has both a deposit account in Eastern Bank and a pro rata ownership interest in the net worth of Eastern Bank Corporation based upon the deposit balance in his or her account. This ownership interest is tied to the depositor’s account and has no tangible market value separate from the deposit account. This ownership interest may only be realized in the event of a complete liquidation of Eastern Bank Corporation and Eastern Bank; however, there has never been a liquidation of a solvent mutual holding company. Any depositor who opens a deposit account obtains a pro rata ownership interest in Eastern Bank Corporation without any additional payment beyond the amount of the deposit. A depositor who reduces or closes his or her account receives a portion or all of the balance in the deposit account but nothing for his or her ownership interest in the net worth of Eastern Bank Corporation, which is lost to the extent that the balance in the account is reduced or closed.
163
Table of Contents
Consequently, depositors in a stock depository institution that is a subsidiary of a mutual holding company normally have no way of realizing the value of their ownership interest, which in the case of Eastern prior to the conversion would be realizable only in the unlikely event that Eastern Bank Corporation and Eastern Bank are liquidated. If this occurs, the depositors of record at that time, as owners, would share pro rata in any residual surplus and reserves of Eastern Bank Corporation after other claims, including claims of depositors to the amounts of their deposits, are paid.
Under the plan of conversion, eligible account holders will receive an interest in a liquidation account maintained by Eastern Bankshares, Inc. in an amount equal to (i) Eastern Bank Corporation’s ownership interest in Eastern Bank’s total shareholders’ equity as of the date of the latest statement of financial condition included in this prospectus, plus (ii) the value of the net assets of Eastern Bank Corporation as of the date of the latest statement of financial condition of Eastern Bank Corporation prior to the consummation of the conversion (excluding its ownership of Eastern Bank). The plan of conversion also provides for the establishment of a parallel liquidation account maintained in Eastern Bank to support Eastern Bankshares, Inc.’s liquidation account in the event Eastern Bankshares, Inc. does not have sufficient assets to fund its obligations under Eastern Bankshares, Inc.’s liquidation account. Eastern Bankshares, Inc. and Eastern Bank will hold the liquidation accounts for the benefit of eligible account holders who continue to maintain deposits in Eastern Bank after the conversion. The liquidation accounts are designed to provide payments to depositors of their liquidation interests, if any, in the end of a liquidation of (a) Eastern Bankshares, Inc. and Eastern Bank, or (b) Eastern Bank. See the subsection titled “—Liquidation Rights.”
Reasons for the Offering
Our strategic objective for many years has been to evolve over time into one of the leading banking institutions in our market by concentrating on achieving disciplined, profitable growth in our core business lines while maintaining an abiding commitment to our customers, colleagues and communities. Profitable growth provides us with the flexibility to pursue strategic acquisitions as opportunities arise and to make additional technological, risk management and talent investments.
We believe the additional capital provided by the offering will, when added to our existing well-capitalized balance sheet, give us a strong foundation that in the near-term will help us to remain resilient while the regional, national and global economies recover from the recession caused by Covid-19 pandemic and over the longer-term allow us to accelerate our growth—principally by:
Enhancing our capital and liquidity position to increase our resiliency in the short-term and to provide a foundation for long-term future growth. By substantially increasing our regulatory capital and liquidity, the offering will enhance our capacity to build and maintain credit reserves in the near term while maintaining the financial flexibility to support all of our stakeholders, including by continuing to work constructively with our borrowers adversely affected by the Covid-19 recession, offering payment deferrals, loan modifications and, where prudent, additional lines of credit to our business customers with proven track records. Over the longer-term, the substantial increase in our regulatory capital and liquidity will provide a foundation for us to renew our focus on pursuing profitable loan and deposit growth through disciplined organic growth in our core business lines consistent with our overarching goal of serving more people, businesses and communities for many more generations.
Enhancing our ability to make investments in new technologies to meet the ever-increasing customer demands for “ease of use” of banking and financial services. As we anticipate the competitive landscape that will emerge after our economy recovers from the negative impacts of Covid-19 pandemic, we believe the most significant systemic challenge we will face is the accelerating pace of technological change driven by ubiquitous digital adoption by both consumer and commercial banking customers. We believe this trend has greatly amplified the importance of scale in banking, and the increasing benefit of scale exacerbates the challenge of competing with significantly larger banks and large information technology and e-commerce companies. The capital raised in the offering will allow us to increase our investments in new technologies to develop and implement an increasingly sophisticated array of banking and other financial services for retail, small business and commercial customers to meet the ever-increasing customer expectations for “ease of use” of banking and financial services and products.
Better positioning us to pursue opportunistic strategic transactions within our existing and contiguous markets and through digital delivery channels. We believe the additional capital raised in the offering, coupled with our structure as a publicly-traded company, will make us a more attractive and competitive bidder for mergers and acquisitions of other financial institutions or business lines as opportunities arise. We will be able to structure business combinations using stock, cash or a combination of both. We believe that the current economic recession will increase the rate of consolidation in the
164
Table of Contents
banking industry. We have completed seven bank acquisitions or mergers since 1999, the most recent of which was our 2014 acquisition of New Hampshire-based Centrix Bank. We also expect that a portion of the proceeds of the offering will be used to fund acquisitions of independent insurance agencies by Eastern Insurance Group LLC. From 2004 through 2018, we expanded Eastern Insurance Group LLC by acquiring 31 independent insurance agencies for an aggregate price of $124.9 million. We expect to maintain a disciplined approach to strategic transactions, focusing on opportunities in or contiguous to our market that create value for our shareholders and that we believe will likely materially enhance the strength of our franchise, while maintaining an acceptable risk profile. We do not currently have any agreement or understanding regarding any specific transaction.
Expanding and retaining a talented and diverse workforce. By increasing our capital through the offering, we believe that we will be better positioned to expand and retain a talented and diverse workforce dedicated to providing superior service to our customers and to fostering a culture of compliance and accountability. In addition, we believe the offering will enhance our ability to attract and retain qualified officers and employees by allowing us to implement various stock benefit plans, including an employee stock ownership plan concurrently with the offering and one or more equity incentive plans after the offering. Through continued investments in human capital and effective technology, we can continue to advance our mission to do good things to help people prosper.
Supporting our local communities through an additional significant and immediate donation to Eastern Bank Charitable Foundation. We intend to donate to Eastern Bank Charitable Foundation, upon the completion of the offering, a number of shares of our authorized but previously unissued common stock that will represent 4% of the shares of Eastern Bankshares, Inc. common stock that will be outstanding immediately after that donation. The opportunity to have an outsized philanthropic impact on the Foundation and the community-orientated non-profit organizations that it supports is viewed by our Board and senior management as an important benefit of the offering. Eastern Bank formed Eastern Bank Charitable Foundation in 1994, and to date Eastern Bank has been the sole source of the Foundation’s funding. Eastern Bank Charitable Foundation had total assets of approximately $111.8 million at March 31, 2020, and for the three-year period ended December 31, 2019, the Foundation’s annual charitable donations averaged approximately $7.6 million. Our stock donation to the Foundation upon completion of the offering will complement our historical charitable giving and allow the Foundation, and indirectly the communities that we serve, both now and in the future, to share in our long-term growth. Although we expect that our annual charitable donations after the offering and excluding the stock donation will be a small percentage of our net income, we believe the impact of that reduction will be offset by our stock donation.
Enhancing our ability to positively impact local communities through expanded volunteerism and enhanced advocacy influence. We believe that with increased scale through both organic growth and opportunistic strategic acquisitions—coupled with our culture of supporting community volunteerism, where we already are a market leader—we will be able to have a broader and deeper positive impact on our local communities. We also expect that with increased scale, we will be able to have a more impactful “voice” on social justice issues. Eastern takes pride in its public advocacy regarding social justice issues that affect the communities we serve. In recent years, we have advocated in support of immigrants and their families, pay equality, and the LGBTQ+ community.
Offering our depositors, employees, officers, directors, trustees and corporators an equity ownership interest in our future growth and profitability. We believe that offering stock to our depositors, employees, officers, directors, trustees and corporators will provide those constituencies with an economic interest in our future success, should they decide to invest. We believe that an ownership interest in Eastern will help to align the interests of our employees with our overall profitability, complementing our organizational focus on continuing to improve Eastern so that it remains competitive in our markets for generations to come.
Approvals Required
The affirmative vote of a majority of the total votes eligible to be cast by the corporators of Eastern Bank Corporation, including the majority of “independent” corporators, was required to approve the plan of conversion. These approvals were received at a special meeting of corporators held on [DATE], 2020. We have filed an application with respect to the offering with the Federal Reserve Board, and the approval of the Federal Reserve Board is required before we can consummate the offering. We have filed an application with respect to the offering with the Massachusetts Commissioner of Banks, and the Massachusetts Commissioner of Banks has authorized us to commence the offering. However, the final approval of the Massachusetts Commissioner of Banks is required before we can consummate the offering.
165
Table of Contents
Stock Pricing and Number of Shares to be Issued
The plan of conversion and applicable regulations require that the aggregate purchase price of the common stock sold in the offering must be based on the appraised pro forma market value of the common stock, as determined by an independent valuation. We have retained RP Financial, LC to prepare an independent valuation appraisal. For its services in preparing the initial valuation, RP Financial, LC will receive a fee of $400,000, as well as payment for reimbursable expenses and an additional $25,000 for each updated valuation prepared. We have paid RP Financial, LC no other fees during the previous three years. We have agreed to indemnify RP Financial, LC and its employees and affiliates against specified losses, including any losses in connection with claims under the federal securities laws, arising out of its services as independent appraiser, except where such liability results from RP Financial, LC’s bad faith or negligence.
The independent valuation was prepared by RP Financial, LC in reliance upon the information contained in this prospectus, including the consolidated financial statements of Eastern Bankshares, Inc. RP Financial, LC also considered the following factors, among others:
| • | the present results and financial condition of Eastern Bankshares, Inc. and the projected results and financial condition of Eastern Bankshares, Inc.; |
| • | the economic and demographic conditions in Eastern Bankshares, Inc.’s existing market area; |
| • | certain historical, financial and other information relating to Eastern Bankshares Inc.; |
| • | a comparative evaluation of the operating and financial characteristics of Eastern Bankshares, Inc. with those of other publicly traded savings institutions; |
| • | the effect of the offering on Eastern Bankshares, Inc.’s shareholders’ equity and earnings potential; |
| • | the proposed dividend policy of Eastern Bankshares, Inc.; and |
| • | the trading market for securities of comparable institutions and general conditions in the market for such securities. |
The independent valuation is also based on an analysis of a peer group of publicly traded bank holding companies and savings and loan holding companies that RP Financial, LC considered comparable to Eastern Bankshares, Inc. under regulatory guidelines applicable to the independent valuation. Since the inclusion of commercial banking companies in the peer group was an exception to the applicable regulatory valuation guidelines, RP Financial, LC sought and received prior authorization from the Federal Reserve Board and the Massachusetts Commissioner of Banks to include commercial banking companies in the peer group along with the comparable publicly-traded thrift institutions. Under these guidelines, a minimum of ten peer group companies are selected from the universe of all publicly-traded financial institutions with relatively comparable resources, strategies and financial and other operating characteristics. Such companies must also be traded on an exchange (such as Nasdaq or the New York Stock Exchange). The companies selected are all fully-converted banking companies. In addition, RP Financial, LC limited the peer group companies to the following two selection criteria: (i) New England institutions with assets between $6.0 billion and $18.0 billion, equity-to-assets ratios of at least 10.75%, tangible equity-to-tangible assets ratios of at least 8.75%, non-performing assets/asset ratios of less than 1.25% and reported and core return on average assets ratios of greater than 0.50%; and (ii) Mid-Atlantic institutions with assets between $6.0 billion and $18.0 billion, equity-to-assets ratios of at least 10.75%, tangible equity-to-tangible assets ratios of at least 8.75%, non-performing assets/assets ratios of less than 1.25% and reported and core return on average assets ratios of greater than 0.50%.
The independent valuation appraisal considered the pro forma effect of the offering. Consistent with federal appraisal guidelines, the appraisal applied three primary methodologies: (i) the pro forma price-to-book value approach applied to both reported book value and tangible book value; (ii) the pro forma price-to-earnings approach applied to reported and core earnings; and (iii) the pro forma price-to-assets approach. The market value ratios applied in the three methodologies were based on the current market valuations of the peer group companies. RP Financial, LC placed the greatest emphasis on the price-to-earnings and price-to-book approaches in estimating pro forma market value. RP Financial, LC did not consider a pro forma price-to-assets approach to be as meaningful in preparing the appraisal, as this approach is more meaningful when a company has low equity or earnings. The price-to-assets approach is less meaningful for a company like us, as we have equity in excess of regulatory capital requirements and positive reported and core earnings.
In applying each of the valuation methods, RP Financial, LC considered adjustments to the pro forma market value based on a comparison of Eastern Bankshares, Inc. with the peer group. RP Financial, LC made slight upward adjustments
166
Table of Contents
for: (i) financial condition; and (ii) primary market area. RP Financial, LC made slight downward adjustments for: (i) profitability, growth and viability of earnings; and (ii) marketing of the issue. RP Financial, LC made no adjustments for: (i) asset growth; (ii) liquidity of the shares; (iii) dividends; (iv) management; and (v) effect of government regulations and regulatory reform.
The slight upward adjustment for financial condition took into consideration our more favorable pro forma balance sheet liquidity, our more favorable funding composition and our higher pro forma tangible capital as a percent of assets. The slight upward adjustment for our primary market area took into consideration the more favorable growth potential of our market area compared to the primary market area counties of our peer group. The slight downward adjustment for profitability, growth and viability of earnings took into consideration our less favorable efficiency ratio and lower pro forma return as a percent of equity relative to the comparable peer group measures. The slight downward adjustment for marketing of the issue took into consideration the volatile stock market conditions in both the overall market and the market for bank and thrift stocks and the heightened uncertainty associated with the new issue market in the prevailing stock market environment including the new issue market for Eastern Bankshares, Inc. shares.
Included in RP Financial, LC’s independent valuation were certain assumptions as to the pro forma earnings of Eastern Bankshares, Inc. after the offering that were used in determining the appraised value. These assumptions included estimated expenses, an assumed after-tax rate of return of 0.27% as of March 31, 2020 on the net offering proceeds and purchases in the open market of common stock by the stock-based benefit plan at the $10.00 per share purchase price. See the section of this prospectus titled “Pro Forma Data” for additional information concerning assumptions included in the independent valuation and used in preparing pro forma data. The use of different assumptions may yield different results.
The independent valuation states that as of May 21, 2020, the estimated pro forma market value of Eastern Bankshares, Inc. was $1.6 billion. Based on applicable regulations, this market value forms the midpoint of a range with a minimum of $1.4 billion and a maximum of $1.8 billion. The aggregate offering price of the shares will be equal to the valuation range multiplied by the percentage of Eastern Bankshares, Inc. common stock to be sold in the offering. The number of shares offered will be equal to the aggregate offering price of the shares divided by the price per share. Based on the valuation range, the percentage of Eastern Bankshares, Inc. common stock to be sold in the offering and the $10.00 price per share, the minimum of the offering range is 129,625,000 shares, the midpoint of the offering range is 152,500,000 shares and the maximum of the offering range is 175,375,000 shares.
Following commencement of the subscription offering, the maximum of the valuation range may be increased by up to 15%, or up to $2.1 billion, without resoliciting subscribers, which will result in a corresponding increase of up to 15% in the maximum of the offering range to up to 201,681,250 shares, to reflect changes in the market and financial conditions or demand for the shares. We will not decrease the minimum of the valuation range and the minimum of the offering range without a resolicitation of subscribers. The subscription price of $10.00 per share will remain fixed. See the subsection titled “—Additional Limitations on Common Stock Purchases” as to the method of distribution of additional shares to be issued in the event of an increase in the offering range of up to 201,681,250 shares.
The Board of Directors of Eastern Bankshares, Inc. reviewed the independent valuation and, in particular, considered the following:
| • | Eastern Bankshares, Inc.’s financial condition and results of operations; |
| • | a comparison of financial performance ratios of Eastern Bankshares, Inc. to those of other financial institutions of similar size; and |
| • | market conditions generally and in particular for financial institutions. |
All of these factors are set forth in the independent valuation. The Board of Directors also reviewed the methodology and the assumptions used by RP Financial, LC in preparing the independent valuation and believes that such assumptions were reasonable. The offering range may be amended with the approval of the Federal Reserve Board and the Massachusetts Commissioner of Banks, if required, as a result of subsequent developments in the financial condition of Eastern Bankshares, Inc. or Eastern Bank or market conditions generally. In the event the independent valuation is updated to amend the pro forma market value of Eastern Bankshares, Inc. to less than $1.4 billion or more than $2.1 billion, the appraisal will be filed with the Securities and Exchange Commission by a post-effective amendment to Eastern Bankshares, Inc.’s registration statement.
167
Table of Contents
The following table presents a summary of selected pricing ratios for Eastern Bankshares, Inc. (on a pro forma basis) as of and for the twelve months ended March 31, 2020, and for the peer group companies based on earnings and other information as of and for the twelve months ended March 31, 2020, with stock prices as of May 21, 2020, as reflected in the appraisal report. Compared to the average pricing of the peer group, our pro forma pricing ratios at the midpoint of the offering range indicated a discount of 31.55% on a price-to-book value basis, a discount of 41.88% on a price-to-tangible book value basis and a premium of 71.70% on a price-to-earnings basis. Our Board of Directors, in reviewing and approving the appraisal, considered the range of price-to-earnings multiples and the range of price-to-book value and price-to-tangible book value ratios at the different amounts of shares to be sold in the offering. The appraisal did not consider one valuation approach to be more important than the other. The estimated appraised value and the resulting premium/discount took into consideration the potential financial effect of the offering.
| Eastern Bankshares, Inc. (on a pro forma basis, assuming completion of the offering) |
Price-to- earnings multiple (1) |
Price-to- book value ratio |
Price-to- tangible book value ratio |
|||||||||
| Adjusted maximum |
23.91x | 61.77 | % | 69.44 | % | |||||||
| Maximum |
20.14x | 57.57 | % | 65.32 | % | |||||||
| Midpoint |
17.05x | 53.39 | % | 61.12 | % | |||||||
| Minimum |
14.12x | 48.64 | % | 56.27 | % | |||||||
| Valuation of peer group companies, all of which are fully converted (on a historical basis) |
||||||||||||
| Averages |
9.93x | 78.00 | % | 105.16 | % | |||||||
| Medians |
8.20x | 73.88 | % | 104.34 | % | |||||||
| (1) | Price-to-earnings multiples calculated by RP Financial, LC in the independent appraisal are based on an estimate of “core,” or recurring, earnings. These ratios are different than those presented in “Pro Forma Data.” |
The independent valuation is not intended, and must not be construed, as a recommendation of any kind as to the advisability of purchasing our shares of common stock. RP Financial, LC did not independently verify our consolidated financial statements and other information that we provided to them, nor did RP Financial, LC independently value our assets or liabilities. The independent valuation considers Eastern Bank as a going concern and should not be considered as an indication of the liquidation value of Eastern Bank. Moreover, because the valuation is necessarily based upon estimates and projections of a number of matters, all of which may change from time to time, no assurance can be given that persons purchasing our common stock in the offering will thereafter be able to sell their shares at prices at or above the $10.00 price per share.
If the update to the independent valuation at the conclusion of the offering results in an increase in the maximum of the valuation range to more than $2.1 billion and a corresponding increase in the offering range to more than 201,681,250 shares, or a decrease in the minimum of the valuation range to less than $1.4 billion and a corresponding decrease in the offering range to fewer than 129,625,000 shares, then we will promptly return with interest at 0.02% per annum all funds previously delivered to us to purchase shares of common stock in the subscription and community offerings and cancel deposit account withdrawal authorizations and, after consulting with the Massachusetts Commissioner of Banks and the Federal Reserve Board, we may terminate the plan of conversion. Alternatively, we may establish a new offering range, extend the offering period and commence a resolicitation of purchasers or take other actions as permitted by the Massachusetts Commissioner of Banks and the Federal Reserve Board in order to complete the offering. In the event that we extend the offering and conduct a resolicitation due to a change in the independent valuation, we will notify subscribers of the extension of time and of the rights of subscribers to place a new stock order for a specified period of time. Any single offering extension will not exceed [ ] days; aggregate extensions may not conclude beyond [DATE], 2022, which is two years after the special meeting of directors to approve the plan of conversion.
An increase in the number of shares to be issued in the offering would decrease both a subscriber’s ownership interest and Eastern Bankshares, Inc.’s pro forma earnings and shareholders’ equity on a per share basis while increasing shareholders’ equity on an aggregate basis. A decrease in the number of shares to be issued in the offering would increase both a subscriber’s ownership interest and Eastern Bankshares, Inc.’s pro forma earnings and shareholders’ equity on a per share basis, while decreasing shareholders’ equity on an aggregate basis.
168
Table of Contents
Copies of the independent valuation appraisal report of RP Financial, LC and the detailed memorandum setting forth the method and assumptions used in the appraisal report are filed as exhibits to the documents specified under “Where You Can Find Additional Information.”
Subscription Offering and Subscription Rights
In accordance with the plan of conversion, rights to subscribe for shares of common stock in the subscription offering have been granted in the following descending order of priority. The filling of all subscriptions that we receive will depend on the availability of common stock after satisfaction of all subscriptions of all persons having prior rights in the subscription offering and compliance with the purchase and ownership limitations set forth in the plan of conversion and as described below under “—Additional Limitations on Common Stock Purchases.”
Priority 1: Eligible Account Holders. Each depositor of Eastern Bank with aggregate deposit account balances of $50.00 or more (a “Qualifying Deposit”) at the close of business on March 29, 2019 (an “Eligible Account Holder”) will receive, without payment therefor, nontransferable subscription rights to purchase, subject to the overall purchase limitations, up to the greater of $2,000,000 (200,000 shares) of our common stock, 0.10% of the total number of shares of common stock issued in the offering, or 15 times the product of the number of subscription shares offered multiplied by a fraction of which the numerator is the aggregate Qualifying Deposit account balances of the Eligible Account Holder and the denominator is the aggregate Qualifying Deposit account balances of all Eligible Account Holders. See the subsection titled “—Additional Limitations on Common Stock Purchases.” If there are not sufficient shares available to satisfy all subscriptions, shares will first be allocated so as to permit each Eligible Account Holder to purchase a number of shares sufficient to make his or her total allocation equal to the lesser of 100 shares or the number of shares for which he or she subscribed. Thereafter, any remaining unallocated shares will be allocated to each remaining Eligible Account Holder whose subscription remains unfilled in same the proportion that the amount of his or her Qualifying Deposit bears to the total amount of Qualifying Deposits of all subscribing Eligible Account Holders whose subscriptions remain unfilled. If an amount so allocated exceeds the amount subscribed for by any one or more Eligible Account Holders, the excess shall be reallocated among those Eligible Account Holders whose subscriptions are not fully satisfied until all available shares have been allocated.
To ensure proper allocation of our shares of common stock, each Eligible Account Holder must list on his or her stock order form all deposit accounts in which he or she has an ownership interest on March 29, 2019. In the event of an oversubscription, failure to list an account could result in fewer shares being allocated than if all accounts had been disclosed. In the event of an oversubscription, the subscription rights of Eligible Account Holders who are also directors or executive officers of Eastern named in this prospectus, or who are associates of such persons, will be subordinated to the subscription rights of other Eligible Account Holders to the extent attributable to their increased deposits in the 12 months preceding March 29, 2019.
Priority 2: Supplemental Eligible Account Holders. To the extent that there are sufficient shares of common stock remaining after satisfaction of subscriptions by Eligible Account Holders, each depositor with a Qualifying Deposit as of the close of business on March 31, 2020 who is not an Eligible Account Holder (“Supplemental Eligible Account Holder”) will receive, without payment therefor, nontransferable subscription rights to purchase up to the greater of $2,000,000 (200,000 shares) of our common stock, 0.10% of the total number of shares of common stock issued in the offering, or 15 times the product of the number of subscription shares offered multiplied by a fraction of which the numerator is the aggregate Qualifying Deposit account balances of the Supplemental Eligible Account Holder and the denominator is the aggregate Qualifying Deposit account balances of all Supplemental Eligible Account Holders, subject to the overall purchase limitations. See the subsection titled “—Additional Limitations on Common Stock Purchases.” If there are not sufficient shares available to satisfy all subscriptions, shares will be allocated so as to permit each Supplemental Eligible Account Holder to purchase a number of shares sufficient to make his or her total allocation equal to the lesser of 100 shares of common stock or the number of shares for which he or she subscribed. Thereafter, unallocated shares will be allocated to each Supplemental Eligible Account Holder whose subscription remains unfilled in the proportion that the amount of his or her Qualifying Deposit bears to the total amount of Qualifying Deposits of all Supplemental Eligible Account Holders whose subscriptions remain unfilled. If an amount so allocated exceeds the amount subscribed for by any one or more Supplemental Eligible Account Holders, the excess shall be reallocated (one or more times as necessary) among those Supplemental Eligible Account Holders whose subscriptions are not fully satisfied until all available shares have been allocated.
To ensure proper allocation of common stock, each Supplemental Eligible Account Holder must list on the stock order form all deposit accounts in which he or she had an ownership interest at March 31, 2020. In the event of oversubscription, failure to list an account could result in fewer shares being allocated than if all accounts had been disclosed.
169
Table of Contents
Priority 3: Tax-Qualified Plans. Our tax-qualified employee plans, including Eastern Bank’s employee stock ownership plan and 401(k) plan, will receive, without payment therefor, nontransferable subscription rights to purchase in the aggregate up to 10% of the shares of common stock sold in the offering and issued to the Foundation, although our employee stock ownership plan intends to purchase 8% of the shares of common stock sold in the offering and issued to the Foundation. If market conditions warrant, in the judgment of its trustees, the employee stock ownership plan may instead elect to purchase shares in the open market following the completion of the offering, subject to the approval of the Federal Reserve Board and the Massachusetts Commissioner of Banks. The amount of the subscription requests by the 401(k) plan will be determined by its participants, who will have the right to invest up to 50% of their 401(k) plan accounts, adjusted for loan balances, in our common stock, subject to the maximum purchase limitations.
Priority 4: Employees, Officers, Directors, Trustees and Corporators. To the extent that there are sufficient shares of common stock remaining after satisfaction of subscriptions by Eligible Account Holders, Supplemental Eligible Account Holders, and tax-qualified plans, each employee, officer, director, trustee and corporator of Eastern Bank, Eastern Bank Corporation or Eastern Insurance Group LLC at the time of the offering who is not eligible in the first or second priority category will receive, without payment therefor, subject to the overall purchase limitations, non-transferable subscription rights to purchase up to $2,000,000 (200,000 shares) of common stock; provided, however, that the aggregate number of shares of common stock that may be purchased by employees, officers, directors, trustees and corporators in the offering shall be limited to 30% of the total number of shares of common stock sold in the offering (including shares purchased by employees, officers, directors, trustees and corporators under this priority and under the preceding priority categories, but not including shares purchased by the employee stock ownership plan). In the event that persons in this category subscribe for more shares of stock than are available for purchase by them, shares will be allocated among such subscribing persons on an equitable basis, such as by giving weight to the period of service, compensation, position of the individual subscriber and the amount of the order.
Expiration Date. The subscription offering will expire at 2:00 p.m., Eastern Time, on [EXPIRATION DATE], unless extended by us for up to [ ] days or such additional periods with the approval of the Massachusetts Commissioner of Banks and the Federal Reserve Board, if necessary. Subscription rights will expire whether or not each eligible depositor can be located. We may decide to extend the expiration date of the subscription offering for any reason, whether or not subscriptions have been received for shares at the minimum, midpoint, maximum or adjusted maximum of the offering range. Subscription rights which have not been exercised prior to the expiration date will become void.
We will not execute orders until at least the minimum number of shares of common stock has been sold in the offering. If at least 129,625,000 shares have not been sold in the offering by [EXTENSION DATE] and the Massachusetts Commissioner of Banks and the Federal Reserve Board, if necessary, have not consented to an extension, all funds delivered to us to purchase shares of common stock in the offering will be returned promptly, with interest at 0.02% per annum for funds received in the subscription and community offerings, and all deposit account withdrawal authorizations will be canceled. If an extension beyond [EXTENSION DATE] is granted by the Massachusetts Commissioner of Banks and the Federal Reserve Board, if necessary, we will resolicit purchasers in the offering as described under “—Procedure for Purchasing Shares in Subscription and Community Offerings—Expiration Date.”
Community Offering
To the extent that shares of common stock remain available for purchase after satisfaction of all subscriptions of Eligible Account Holders, Supplemental Eligible Account Holders, our tax-qualified employee stock benefit plans and employees, officers, directors, trustees and corporators, we may offer shares pursuant to the plan of conversion to members of the general public in a community offering. Shares will be offered in the community offering with the following preferences:
| (i) | natural persons, and trusts of natural persons, residing in the Massachusetts and New Hampshire cities and towns appearing on page 11 of this prospectus; and |
| (ii) | other members of the general public. |
Subscribers in the community offering may purchase up to $2,000,000 (200,000 shares) of common stock, subject to the overall purchase limitations. See the subsection titled “—Additional Limitations on Common Stock Purchases.” The opportunity to purchase shares of common stock in the community offering category is subject to our right, in our sole discretion, to accept or reject any such orders in whole or in part either at the time of receipt of an order or as soon as practicable following the expiration date of the offering.
170
Table of Contents
If we do not have sufficient shares of common stock available to fill the orders of natural persons, and trusts of natural persons, residing in the Massachusetts and New Hampshire cities and towns listed above, we will allocate the available shares among those persons in a manner that permits each of them, to the extent possible, to purchase the lesser of 100 shares or the number of shares subscribed for by such person. Thereafter, unallocated shares will be allocated among natural persons, and trusts of natural persons, residing in those counties whose orders remain unsatisfied on an equal number of shares basis per order. In connection with the allocation process, orders received for shares of common stock in the community offering will first be filled up to a maximum of 2% of the shares sold in the offering, and thereafter any remaining shares will be allocated on an equal number of shares basis per order until all shares have been allocated.
The term “residing” or “resident” as used in this prospectus with respect to the community means any Person who occupies a dwelling within the local community, has a present intent to remain within the local community for a period of time, and manifests the genuineness of that intent by establishing an ongoing physical presence within the local community together with an indication that such presence within the local community is something other than merely transitory in nature. We may utilize deposit or loan records or other evidence provided to us to determine whether a person is a resident. In all cases, however, the determination shall be in our sole discretion.
Expiration Date. The community offering may occur either concurrently with or after the subscription offering, and is currently expected to terminate at the same time as the subscription offering, and must terminate no more than 45 days following the subscription offering, unless extended. Eastern Bankshares, Inc. may decide to extend the community offering for any reason and is not required to give purchasers notice of any such extension unless such period extends beyond [EXTENSION DATE], in which event we will resolicit purchasers.
Syndicated Offering
If feasible, our Board of Directors may decide to offer for sale shares of common stock not subscribed for or purchased in the subscription and community offerings in a syndicated best-efforts offering, subject to such terms, conditions and procedures as we may determine, in a manner that will achieve a wide distribution of our shares of common stock.
If a syndicated offering is held, J.P. Morgan Securities LLC and Keefe, Bruyette & Woods, Inc. will serve as joint book-running managers. In the event that shares of common stock are sold in a syndicated offering, we will pay fees of 5.50% of the aggregate amount of all shares of common stock sold in the syndicated offering to J.P. Morgan Securities LLC, Keefe, Bruyette & Woods, Inc., and any other broker-dealers included in the syndicated offering. The shares of common stock will be sold at the same price per share ($10.00 per share) that the shares are sold in the subscription offering and the community offering.
In the event of a syndicated offering on a best-efforts basis, it is currently expected that investors would follow the same general procedures applicable to purchasing shares in the subscription and community offerings (the use of order forms and the submission of funds directly to Eastern Bankshares, Inc. for the payment of the purchase price of the shares ordered) except that payment must be in immediately available funds (bank checks, money orders, deposit account withdrawals from accounts at Eastern Bank or wire transfers). See the subsection titled “—Procedure for Purchasing Shares in Subscription and Community Offerings.” “Sweep” arrangements and delivery versus payment settlement will only be used in a syndicated offering to the extent consistent with Rules 10b-9 and 15c2-4 and then-existing guidance and interpretations thereof of the Securities and Exchange Commission regarding the conduct of “min/max” offerings.
In the event of a syndicated offering on a firm commitment basis, the proposed underwriting agreement will not be entered into with J.P. Morgan Securities LLC, Keefe, Bruyette & Woods, Inc., as representatives of the underwriters named in the underwriting agreement, and us until immediately prior to the completion of the syndicated offering. At that time, J.P. Morgan Securities LLC, Keefe, Bruyette & Woods, Inc. and any other broker-dealer included in such syndicated offering will represent that they have received sufficient indications of interest to complete the offering. Pursuant to the terms of the underwriting agreement, and subject to certain customary provisions and conditions to closing, upon execution of the underwriting agreement, J.P. Morgan Securities LLC, Keefe, Bruyette & Woods, Inc. and any other underwriter will be obligated to purchase all the shares subject to such syndicated offering.
If for any reason we cannot effect a syndicated offering of shares of common stock not purchased in the subscription and community offerings, or in the event that there are an insignificant number of shares remaining unsold after such offerings, we will try to make other arrangements for the sale of unsubscribed shares. The Federal Reserve Board, the Massachusetts Commissioner of Banks and the Financial Industry Regulatory Authority must approve any such arrangements.
171
Table of Contents
Additional Limitations on Common Stock Purchases
The plan of conversion includes the following additional limitations on the number of shares of common stock that may be purchased in the offering:
| • | No individual, or individuals exercising subscription rights through a single qualifying account held jointly, may purchase more than $2,000,000 (200,000 shares) in the offering; |
| • | Except for the employee stock ownership plan and the 401(k) plan, as described above, no person or entity, together with associates or persons acting in concert with such person or entity, may purchase more than $2,000,000 (200,000 shares) of common stock in all categories of the offering combined; |
| • | Tax qualified employee benefit plans, including our employee stock ownership plan and 401(k) plan, may purchase in the aggregate up to 10% of the shares of common stock sold in the offering and issued to the Foundation, including shares issued in the event of an increase in the offering range of up to 15%; |
| • | The aggregate number of shares of common stock that may be purchased in all categories of the offering by officers, directors, trustees and corporators of Eastern Bank Corporation, Eastern Bankshares, Inc. and Eastern Bank and their associates may not exceed 30% of the total shares sold in the offering; and |
| • | No person may purchase fewer than 25 shares of common stock, to the extent those shares are available for purchase. |
Depending upon market or financial conditions, our Board of Directors, with regulatory approval and without further approval of corporators of Eastern Bank Corporation, may decrease or increase the purchase limitations. If a purchase limitation is increased, subscribers in the subscription offering who ordered the maximum and who indicated on their stock order form an interest in being resolicited will be given the opportunity to increase their orders up to the then applicable limit. The effect of this type of resolicitation will be an increase in the number of shares of common stock owned by persons who choose to increase their orders. In the event that the maximum purchase limitation is increased to 5% of the shares sold in the offering, such limitation may be further increased to 9.99%, provided that orders for shares of common stock exceeding 10% of the shares sold in the offering shall not exceed in the aggregate 10% of the total shares sold in the offering.
In the event of an increase in the offering range of up to 201,681,250 shares of common stock, shares will be allocated in the following order of priority in accordance with the plan of conversion:
| (i) | to fill the subscriptions of our tax-qualified employee benefit plans, specifically our employee stock ownership plan and our 401(k) plan, for up to 10% of the total number of shares of common stock sold in the offering and issued to the Foundation; |
| (ii) | in the event that there is an oversubscription at the Eligible Account Holder, Supplemental Eligible Account Holder or employee, officer, director, trustee and corporator levels, to fill unfilled subscriptions of these subscribers according to their respective priorities; and |
| (ii) | to fill unfilled subscriptions in the community offering, with preference given first to natural persons, and trusts of natural persons, residing in the Massachusetts and New Hampshire cities and towns listed above, and then to members of the general public. |
The term “associate” of a person means:
| (i) | any corporation or organization (other than Eastern Bank, Eastern Bank Corporation or Eastern Bankshares, Inc. or a majority-owned subsidiary of any of those entities) of which the person is an officer, partner or, directly or indirectly, 10% beneficial shareholder; |
| (ii) | any trust or other estate in which the person has a substantial beneficial interest or serves as a trustee or in a similar fiduciary capacity; and |
| (iii) | any relative or spouse of such person, or any relative of such spouse, who either has the same home as the person or who is a director, trustee or officer of Eastern Bank, Eastern Bankshares, Inc. or Eastern Bank Corporation. |
The following relatives of directors, trustees, officers and corporators will be considered “associates” of these individuals regardless of whether they share a household with the director, trustee or officer: any child, stepchild, parent, stepparent, spouse, sibling, mother-in-law, father-in-law, son-in-law, daughter-in-law, brother-in-law or sister-in-law. This also includes adoptive relationships.
172
Table of Contents
The term “acting in concert” means persons seeking to combine or pool their voting or other interests in the securities of an issuer for a common purpose, pursuant to any contract, understanding, relationship, agreement or other arrangement, whether written or otherwise. When persons act together for such purpose, their group is deemed to have acquired their stock. The determination of whether a group is acting in concert shall be made solely by us and may be based on any evidence upon which we choose to rely, including, without limitation, joint account relationships or the fact that such persons have filed joint Schedules 13D with the Securities and Exchange Commission with respect to other companies; provided, however, that the determination of whether a group is acting in concert remains subject to review by the Massachusetts Commissioner of Banks. Persons who have the same address, whether or not related, will be deemed to be acting in concert unless we determine otherwise. Our directors and trustees are not treated as associates of each other solely because of their membership on the Boards of Directors or Trustees.
Common stock purchased in the offering will be freely transferable except for shares purchased by directors and certain officers of Eastern Bankshares, Inc. or Eastern Bank and except as described below. Any purchases made by any associate of Eastern Bankshares, Inc. or Eastern Bank for the explicit purpose of meeting the minimum number of shares of common stock required to be sold in order to complete the offering shall be made for investment purposes only and not with a view toward redistribution. In addition, under Financial Industry Regulatory Authority guidelines, members of the Financial Industry Regulatory Authority and their associates are subject to certain restrictions on transfer of securities purchased in accordance with subscription rights and to certain reporting requirements upon purchase of these securities. For a further discussion of limitations on purchases of our shares of common stock at the time of offering and thereafter, see the subsection titled “—Certain Restrictions on Purchase or Transfer of Our Shares after the Offering” and “Restrictions on Acquisition of Eastern Bankshares, Inc.”
Plan of Distribution; Selling Agent and Underwriter Compensation
Subscription and Community Offerings. To assist in the marketing of our shares of common stock in the subscription and community offerings, we have retained Keefe, Bruyette & Woods, Inc., which is a broker-dealer registered with the Financial Industry Regulatory Authority. Keefe, Bruyette & Woods, Inc. will assist us on a best efforts basis in the subscription and community offerings by:
| • | consulting as to the marketing implications of the plan of conversion, including the percentage of common stock to be offered in the offering; |
| • | reviewing with the Boards the financial impact of the offering on us, based upon the independent appraiser’s appraisal of the common stock; |
| • | reviewing all offering documents, including the prospectus, stock order forms and related marketing materials; |
| • | assisting us in the design and implementation of a marketing strategy for the structuring and marketing the offering; |
| • | assisting our management in scheduling and preparing for meetings with potential investors and/or other broker-dealers in connection with the offering; and |
| • | providing such other general advice and assistance as may be requested to promote the successful completion of the offering. |
Eastern Bankshares, Inc. has agreed with Keefe, Bruyette & Woods, Inc. not to sell or issue, contract to sell or otherwise dispose of any shares of our common stock for a period of 90 days after the consummation of the offering without Keefe, Bruyette & Woods, Inc.’s prior written consent, other than the shares being offered in the offering and other than in connection with any plan or arrangement described in this prospectus, including the stock donation to the Eastern Bank Charitable Foundation, and in connection with any acquisition or proposed acquisition of a business (including substantially all of the assets of any business) pursuant to an agreement entered into after the consummation of the offering.
For these services, Keefe, Bruyette & Woods, Inc. will receive a fee of 0.50% of the aggregate dollar amount of all shares of common stock sold in the subscription and community offerings. No fee will be payable to Keefe, Bruyette & Woods, Inc. with respect to shares purchased by directors, trustees, corporators, officers, employees or their immediate families and their personal trusts, shares purchased by our employee benefit plans or trusts established for the benefit of our directors, officers and employees, and shares issued to the Foundation. In connection with the subscription offering, if, as a result of any resolicitation of subscribers, Keefe, Bruyette & Woods, Inc. reasonably determines that it is required or
173
Table of Contents
requested to provide significant services, Keefe, Bruyette & Woods, Inc. will be entitled to additional compensation for these services not to exceed $100,000.
In addition, J.P. Morgan Securities LLC is serving as our capital markets advisor in connection with the subscription and community offerings and will receive a fee of the greater of $4.0 million and 0.50% of the aggregate dollar amount of all shares of common stock sold in the subscription and community offerings. No fee will be payable to J.P. Morgan Securities LLC with respect to shares purchased by directors, trustees, corporators, officers, employees or their immediate families and their personal trusts, shares purchased by our employee benefit plans or trusts established for the benefit of our directors, officers and employees, and shares issued to the Foundation. Solely by virtue of its role as our capital markets advisor, J.P. Morgan Securities LLC will not be deemed to be an “underwriter” within the meaning of the Securities Act.
J.P. Morgan Securities LLC has also been granted the right to participate in future financings by the Company; this right is deemed to constitute 1% in underwriting compensation for the offering pursuant to FINRA Rule 5110.
Syndicated Offering. In the event that shares of common stock are sold in a syndicated offering, we will pay fees of 5.50% of the aggregate dollar amount of all shares of common stock sold in the syndicated offering to J.P. Morgan Securities LLC, Keefe, Bruyette & Woods, Inc., and any other broker-dealers included in the syndicated offering.
Expenses. We have also agreed to reimburse Keefe, Bruyette & Woods, Inc. and J.P. Morgan Securities LLC for reasonable expenses, including certain documented out-of-pocket expenses, in an amount not to exceed $50,000 each, and legal fees, in an amount not to exceed $300,000. In addition, we have agreed to reimburse J.P. Morgan Securities LLC for reasonable expenses, provided that fees of counsel and other professional advisors engaged solely by J.P. Morgan Securities LLC shall not exceed $50,000. If the offering is terminated or if the engagement of Keefe, Bruyette & Woods, Inc. or J.P. Morgan Securities LLC is terminated in accordance with the provisions of the agency agreement or an engagement letter, as applicable, Keefe, Bruyette & Woods, Inc. or J.P. Morgan Securities LLC, as applicable, will only receive reimbursement of its reasonable out-of-pocket expenses and will return any amounts paid or advanced by us in excess of these amounts. We have separately agreed to pay Keefe, Bruyette & Woods, Inc. certain fees and reimbursements of certain expenses for serving as records agent, as described below.
Records Management
We have also engaged Keefe, Bruyette & Woods, Inc. as records agent in connection with the subscription and community offerings. In its role as records agent, Keefe, Bruyette & Woods, Inc., will assist us in the subscription and community offerings by:
| • | consolidating deposit accounts; |
| • | designing and preparing stock order forms; |
| • | providing software for our Stock Information Center; |
| • | subscription services; and |
| • | record processing services. |
For these services, Keefe, Bruyette & Woods, Inc. will receive a fee of $300,000. Any material changes in applicable regulations or the Plan of Conversion, or delays requiring duplicate or replacement processing due to changes in record dates may result in additional fees not exceeding $30,000 payable to Keefe, Bruyette & Woods, Inc. We have also agreed to reimburse Keefe, Bruyette & Woods, Inc. for reasonable expenses in an amount not to exceed $100,000.
Indemnity
We will indemnify Keefe, Bruyette & Woods, Inc. and J.P. Morgan Securities LLC against liabilities and expenses, including legal fees, incurred in connection with certain claims or litigation arising out of or based upon untrue statements or omissions contained in the offering materials for the common stock, including liabilities under the Securities Act of 1933, as amended, as well as certain other claims and litigation arising out of the engagement of either Keefe, Bruyette & Woods, Inc. or J.P. Morgan Securities LLC with respect to the offering.
174
Table of Contents
Solicitation of Offers by Officers and Directors
Some of our directors and executive officers may participate in the solicitation of offers to purchase common stock in the subscription and community offerings. These persons will be reimbursed for their reasonable out-of-pocket expenses incurred in connection with the solicitation. Other regular employees of Eastern Bank may assist in the offering, but only in ministerial capacities, and may provide clerical work in effecting a sales transaction. No offers or sales may be made by tellers or at the teller counters. Investment-related questions of prospective purchasers will be directed to executive officers or registered representatives of Keefe, Bruyette & Woods, Inc. Our other employees have been instructed not to solicit offers to purchase shares of common stock or provide advice regarding the purchase of common stock. We will rely on Rule 3a4-1 under the Securities Exchange Act of 1934, as amended, and sales of common stock will be conducted within the requirements of Rule 3a4-1, so as to permit officers, directors and employees to participate in the sale of common stock. None of our officers, directors or employees will be compensated in connection with their participation in the offering.
Procedure for Purchasing Shares in Subscription and Community Offerings
Expiration Date. The subscription and community offerings will expire at 2:00 p.m., Eastern Time, on [EXPIRATION DATE], unless we extend one or both for up to [ ] days, with the approval of the Massachusetts Commissioner of Banks and the Federal Reserve Board, if required. This extension may be approved by us, in our sole discretion, without notice to purchasers in the offering. Any extension of the subscription and/or community offering beyond [EXTENSION DATE] would require the Massachusetts Commissioner of Banks’ and the Federal Reserve Board’s approval. If the offering is so extended, all subscribers will be notified and given an opportunity to confirm, change or cancel their orders. If you do not respond to this notice, we will promptly return your funds with interest at 0.02% per annum or cancel your deposit account withdrawal authorization. If the offering range is decreased below the minimum of the offering range or is increased above the adjusted maximum of the offering range, all subscribers’ stock orders will be cancelled, their deposit account withdrawal authorizations will be cancelled, and funds submitted to us will be returned promptly, with interest at 0.02% per annum for funds received in the subscription and community offerings. We will then resolicit the subscribers, giving them an opportunity to place a new stock order for a period of time.
We reserve the right in our sole discretion to terminate the offering at any time and for any reason (subject to any required regulatory approvals), in which case we will cancel any deposit account withdrawal authorizations and promptly return all funds submitted, with interest at 0.02% per annum from the date of receipt as described above.
Use of Order Forms in the Subscription and Community Offerings. In order to purchase shares of common stock in the subscription and community offerings, you must properly complete an original stock order form and remit full payment. We are not required to accept orders submitted on photocopied or facsimiled order forms. All order forms must be received (not postmarked) prior to 2:00 p.m., Eastern Time, on [EXPIRATION DATE]. We are not required to accept order forms that are not received by that time, are not signed or are otherwise executed defectively or are received without full payment or without appropriate deposit account withdrawal instructions. We are not required to notify subscribers of incomplete or improperly executed order forms, and we have the right to waive or permit the correction of incomplete or improperly executed order forms. We do not represent, however, that we will do so and we have no affirmative duty to notify any prospective subscriber of any such defects. You may submit your order form and payment by mail using the stock order reply envelope provided, by overnight delivery to the address indicated on the stock order form or by hand delivery to Eastern Bank’s office located at 195 Market Street, Lynn, MA 01901. You may also hand-deliver stock order forms to the Stock Information Center. Hand-delivered stock order forms will only be accepted at this location. We will not accept stock order forms at our other banking offices. Please do not mail stock order forms to Eastern Bank’s offices.
Once tendered, an order form cannot be modified or revoked without our consent. We reserve the absolute right, in our sole discretion, to reject orders received in the community offering, in whole or in part, at the time of receipt or at any time prior to completion of the offering. If you are ordering shares in the subscription offering, you must represent that you are purchasing shares for your own account and that you have no agreement or understanding with any person for the sale or transfer of the shares. We have the right to reject any order submitted in the offering by a person who we believe is making false representations or who we otherwise believe, either alone or acting in concert with others, is violating, evading, circumventing, or intends to violate, evade or circumvent the terms and conditions of the plan of conversion. Our interpretation of the terms and conditions of the plan of conversion and of the acceptability of the order forms will be final.
By signing the order form, you will be acknowledging that the common stock is not a deposit or savings account and is not federally insured or otherwise guaranteed by Eastern Bank, the Federal Deposit Insurance Corporation, the federal
175
Table of Contents
government or the Depositors Insurance Fund, and that you received a copy of this prospectus. However, signing the order form will not result in you waiving your rights under the Securities Act of 1933 or the Securities Exchange Act of 1934.
Payment for Shares. Payment for all shares of common stock will be required to accompany all completed order forms for the purchase to be valid. Payment for shares in the subscription and community offerings may be made by:
| (i) | personal check, bank check or money order, made payable to Eastern Bankshares, Inc.—do not submit cash; or |
| (ii) | authorization of withdrawal from the types of Eastern Bank deposit account(s) designated on the stock order form. |
Appropriate means for designating withdrawals from deposit accounts at Eastern Bank are provided on the order form. The funds designated must be available in the account(s) at the time the order form is received. A hold will be placed on these funds, making them unavailable to the depositor. Funds authorized for withdrawal will continue to earn interest within the account at the contractual rate until the offering is completed, at which time the designated withdrawal will be made. Interest penalties for early withdrawal applicable to certificate accounts will not apply to withdrawals authorized for the purchase of shares of common stock; however, if a withdrawal results in a certificate account with a balance less than the applicable minimum balance requirement, the certificate will be canceled at the time of withdrawal without penalty and the remaining balance will earn interest at the current passbook rate subsequent to the withdrawal. In the case of payments made by personal check, these funds must be available in the account(s). Checks and money orders received in the subscription and community offerings will be immediately cashed and placed in a segregated account at Eastern Bank and will earn interest at 0.02% per annum from the date payment is processed until the offering is completed or terminated.
You may not remit cash, Eastern Bank line of credit checks or any type of third-party checks (including those payable to you and endorsed over to Eastern Bankshares, Inc.). You may not designate on your stock order form direct withdrawal from a retirement account held at Eastern Bank. See the subsection titled “—Procedure for Purchasing Shares in Subscription and Community Offering—Using Individual Retirement Account Funds.” If permitted by the Massachusetts Commissioner of Banks and the Federal Reserve Board, in the event we resolicit large purchasers, as described above in “—Additional Limitations on Common Stock Purchases,” such purchasers who wish to increase their purchases will not be able to use personal checks to pay for the additional shares, but instead must pay for the additional shares using immediately available funds. We may accept wire transfers at our sole discretion.
Once we receive your executed stock order form, it may not be modified, amended or rescinded without our consent, unless the offering is not completed by [EXTENSION DATE]. If the subscription and community offerings are extended past [EXTENSION DATE], all subscribers will be notified and given an opportunity to confirm, change or cancel their orders. If you do not respond to this notice, we will promptly return your funds with interest at 0.02% per annum or cancel your deposit account withdrawal authorization. We may resolicit purchasers for a specified period of time.
Regulations prohibit Eastern Bank from lending funds or extending credit to any persons to purchase shares of common stock in the offering.
We shall have the right, in our sole discretion, to permit institutional investors to submit irrevocable orders together with the legally binding commitment for payment and to thereafter pay for the shares of common stock for which they subscribe in the community offering at any time prior to [ ] hours before the completion of the offering. This payment may be made by wire transfer.
If our employee stock ownership plan purchases shares in the offering, it will not be required to pay for such shares until completion of the offering, provided that there is a loan commitment from an unrelated financial institution, Eastern Bankshares, Inc. to lend to the employee stock ownership plan the necessary amount to fund the purchase. In addition, if our 401(k) plan purchases shares in the offering, it will not be required to pay for such shares until completion of the offering.
Using Individual Retirement Account Funds. If you are interested in using funds in your individual retirement account (“IRA”) or other retirement account to purchase shares of common stock in the offering, you must do so through an account offered by a custodian that can hold common stock. By regulation, Eastern Bank retirement accounts are not capable of holding common stock. Therefore, if you wish to use funds that are currently in a retirement account held at Eastern Bank, you may not designate on the order form that you wish funds to be withdrawn from the account for the purchase of common stock. The funds you wish to use for the purchase of common stock will instead have to be transferred to an independent trustee or custodian, such as a brokerage firm, which offers the type of retirement accounts that can hold common stock. The
176
Table of Contents
purchase must be made through that account. If you do not have such an account, you will need to establish one before placing a stock order. A one-time and/or annual administrative fee may be payable to the independent trustee or custodian. You may select the IRA custodian of your choice. You may, but are under no obligation to, select KBW or one of its affiliated broker dealers, Stifel, Nicolaus & Company, Incorporated (“SN”) or Century Securities Associates (“CSA”) as your IRA or other retirement account custodian. If you do purchase shares of Eastern Bankshares, Inc. common stock using funds from a KBW, SN or CSA IRA account, you acknowledge that KBW, SN or CSA, as applicable, did not recommend or give you advice regarding such purchase. Other than the standard account fees and compensation associated with all IRA accounts, KBW, SN and CSA do not receive additional fees or compensation as a result of the purchase of Eastern Bankshares, Inc. common stock through a KBW, SN or CSA IRA or other retirement account. There will be no early withdrawal or Internal Revenue Service interest penalties for these transfers. Individuals interested in using funds in an individual retirement account or any other retirement account, whether held at Eastern Bank or elsewhere, to purchase shares of common stock should contact our Stock Information Center for guidance as soon as possible, preferably at least two weeks before the , 2020 offering deadline. Processing such transactions takes additional time, and whether such funds can be used may depend on limitations imposed by the institutions where such funds are currently held. We cannot guarantee that you will be able to use such funds.
Delivery of Shares of Common Stock. All shares of common stock sold will be issued in book entry form. Stock certificates will not be issued. A statement reflecting ownership of shares of common stock issued in the subscription and community offerings will be mailed by our transfer agent to the persons entitled thereto at the registration address noted by them on their stock order forms as soon as practicable following consummation of the offering. We expect trading in the stock to begin on the day of completion of the offering or the next business day. Until a statement reflecting ownership of shares of common stock is available and delivered to purchasers, purchasers might not be able to sell the shares of common stock that they ordered, even though the shares of common stock will have begun trading. Your ability to sell the shares of common stock before receiving your statement will depend on arrangements you may make with a brokerage firm.
Other Restrictions. Notwithstanding any other provision of the plan of conversion, no person is entitled to purchase any shares of common stock to the extent the purchase would be illegal under any federal or state law or regulation, including state “blue sky” regulations, or would violate regulations or policies of the Financial Industry Regulatory Authority, particularly those regarding free riding and withholding. We may ask for an acceptable legal opinion from any purchaser as to the legality of his or her purchase and we may refuse to honor any purchase order if an opinion is not timely furnished. In addition, we are not required to offer shares of common stock to any person who resides in a foreign country, or in a State of the United States with respect to which any of the following apply:
| (i) | a small number of persons otherwise eligible to subscribe for shares under the plan of conversion reside in such state; |
| (ii) | the offer or sale of shares of common stock to such persons would require us or our employees to register, under the securities laws of such state, to register as a broker or dealer or to register or otherwise qualify our securities for sale in such state; or |
| (iii) | such registration or qualification would be impracticable for reasons of cost or otherwise. |
Restrictions on Transfer of Subscription Rights and Shares
Applicable banking regulations prohibit any person with subscription rights, including the Eligible Account Holders, Supplemental Eligible Account Holders and employees, officers, directors, trustees and corporators, from transferring or entering into any agreement or understanding to transfer the legal or beneficial ownership of the subscription rights issued under the plan of conversion or the shares of common stock to be issued upon their exercise. These rights may be exercised only by the person to whom they are granted and only for his or her account. When registering your stock purchase on the order form, you cannot add the name(s) of others for joint stock registration who do not have subscription rights or who qualify only in a lower purchase priority than you do. Doing so may jeopardize your subscription rights. Each person exercising subscription rights will be required to certify that he or she is purchasing shares solely for his or her own account and that he or she has no agreement or understanding regarding the sale or transfer of such shares. The regulations also prohibit any person from offering or making an announcement of an offer or intent to make an offer to purchase subscription rights or shares of common stock to be issued upon their exercise prior to completion of the offering.
We will pursue any and all legal and equitable remedies in the event we become aware of the transfer of subscription rights, and we will not honor orders that we believe involve the transfer of subscription rights.
177
Table of Contents
Stock Information Center
Our banking office personnel may not, by law, assist with investment-related questions about the offering. If you have any questions regarding the offering, please call our Stock Information Center. The telephone number is [STOCK CENTER NUMBER]. The Stock Information Center is open Monday through Friday between 10:00 a.m. and 4:00 p.m., Eastern Time. The Stock Information Center will be closed on bank holidays.
Material U.S. Federal Income Tax Consequences
The following statement of Material U.S. Federal Income Tax Consequences addresses U.S. federal income tax consequences of the offerings contemplated hereunder. The statement does not address any other tax consequences to Eligible Account Holders, Supplemental Eligible Account Holders, employees, officers, directors, trustees or corporators who will be distributed nontransferable subscription rights to purchase shares of Eastern Bankshares, Inc. common stock. Accordingly, any such taxpayer who is not a U.S. resident for U.S. federal income tax purposes is encouraged to seek tax advice as to the tax consequences in foreign jurisdictions of transactions contemplated hereunder. In addition, no opinion is provided as to any U.S. federal income tax consequences other than those expressly addressed below.
Completion of the offering is subject to the prior receipt of an opinion of counsel or tax advisor with respect to the U.S. federal income tax consequences of the offering to Eastern Bankshares, Inc., Eastern Bank, and to Eligible Account Holders and employees, officers, directors, trustees and corporators. Unlike private letter rulings, an opinion of counsel or tax advisor is not binding on the Internal Revenue Service or any state taxing authority, and such authorities may disagree with such opinions. In the event of such disagreement, there can be no assurance that Eastern Bankshares, Inc. or Eastern Bank would prevail in a judicial proceeding.
Eastern Bankshares, Inc. and Eastern Bank have received an opinion of counsel, Nutter, McClennen & Fish, LLP, regarding all of the material U.S. federal income tax consequences of the Reorganization and the offering, which includes the following:
| 1. | The Eastern Bank Contribution together with the merger of Eastern Bank Corporation with and into Eastern Bankshares, Inc. (the “Reorganization”) will qualify as a reorganization within the meaning of Section 368(a)(1)(F) of the Internal Revenue Code. |
| 2. | Neither Eastern Bank Corporation nor Eastern Bankshares, Inc. will recognize gain or loss on the Reorganization. |
| 3. | The assets acquired by Eastern Bankshares, Inc. in the Reorganization will, immediately after the Reorganization, have an adjusted tax basis in Eastern Bankshares, Inc.’s hands that is equal the adjusted tax basis of those assets in the hands of Eastern Bank Corporation immediately before the Reorganization. |
| 4. | Eastern Bankshares, Inc.’s holding period for capital assets acquired in the reorganization will include Eastern Bank Corporation’s holding period in those assets as of the time immediately before the Reorganization. |
| 5. | The Eligible Account Holders will not realize any gain or loss on the exchange of their liquidation interests in Eastern Bank Corporation for liquidation interests in Eastern Bankshares, Inc. as part of the Reorganization. |
| 6. | The Eligible Account Holders, officers, directors, trustees or corporators will not realize, upon distribution to them of nontransferable subscription rights to purchase shares of Eastern Bankshares, Inc. common stock gross income for U.S. federal income tax purposes. |
| 7. | The basis of the shares of Eastern Bankshares, Inc. common stock purchased in the offering by the exercise of nontransferable subscription rights will be the purchase price paid for that stock. |
| 8. | The holding period of the Eastern Bankshares, Inc. common stock purchased pursuant to the exercise of nontransferable subscription rights will commence on the date that the offering closes. |
| 9. | No gain or loss will be recognized by Eastern Bankshares, Inc. on the receipt of money in exchange for Eastern Bankshares, Inc. common stock sold in the offering. |
Opinion #6 above contains a tax opinion as to U.S. federal income tax consequences to the Eligible Account Holders, Supplemental Eligible Account Holders, officers, directors, trustees or corporators on distribution to them of nontransferable subscription rights to purchase shares of Eastern Bankshares, Inc. common stock. That opinion is based on an assumption that the nontransferable subscription rights have no value. If the nontransferable subscription rights have
178
Table of Contents
value, Eligible Account Holders, Supplemental Eligible Account Holders, officers, directors, trustees or corporators will have income or gain on receipt of those subscription rights. Eligible Account Holders, Supplemental Eligible Account Holders, officers, directors, trustees or corporators are encouraged to consult their own tax advisors as to the tax consequences in the event that subscription rights are deemed to have value.
We have received a letter from RP Financial, LC stating its belief that as an ascertainable factual matter the subscription rights do not have any market value and that the price at which the subscription rights are exercisable will not be more or less than the fair market value of the shares of Eastern Bankshares, Inc. common stock that can be acquired thereby as of the date of the exercise. This position is based on the fact that these subscription rights are acquired by the recipients without cost, are nontransferable and of short duration, and afford the recipients the right only to purchase the common stock at the same price as will be paid by members of the general public in any community offering.
The opinion of Nutter, McClennen & Fish, LLP, unlike a letter ruling issued by the Internal Revenue Service, is not binding on the Internal Revenue Service and the conclusions expressed therein may be challenged at a future date. We do not plan to apply for a letter ruling concerning the transactions described herein.
The federal income tax opinions have been filed with the Securities and Exchange Commission as exhibits to the Eastern Bankshares, Inc. registration statement of which this prospectus is a part.
Certain Restrictions on Purchase or Transfer of Our Shares After the Offering
All shares of common stock purchased in the offering by a director, trustee, corporator or certain officers of Eastern Bank Corporation, Eastern Bankshares, Inc., Eastern Bank or Eastern Insurance Group LLC, as well as their associates, generally may not be sold for a period of one year following the closing of the offering, except in the event of the death or substantial disability of the individual. In this context, the term “officer” generally means every officer of the level of vice president or above. Each certificate for restricted shares will bear a legend giving notice of this restriction on transfer, and instructions will be issued to the effect that any transfer within this time period of any certificate or record ownership of the shares other than as provided above is a violation of the restriction. Any shares of common stock issued at a later date as a stock dividend, stock split, or otherwise, with respect to the restricted stock will be similarly restricted. The directors and executive officers of Eastern Bankshares, Inc. also will be restricted by the insider trading rules under the Securities Exchange Act of 1934.
Purchases of shares of our common stock by any of the directors, trustees, corporators, and the officers described above of Eastern Bank Corporation, Eastern Bankshares, Inc., Eastern Bank or Eastern Insurance Group LLC, as well as their associates, during the three-year period following the closing of the offering may be made only through a broker or dealer registered with the Securities and Exchange Commission, except with the prior written approval of the Federal Reserve Board and the Massachusetts Commissioner of Banks. This restriction does not apply, however, to negotiated transactions involving more than 1% of our outstanding common stock or to purchases of our common stock by our stock option plan or any of our tax-qualified employee stock benefit plans or non-tax-qualified employee stock benefit plans, including any restricted stock plans.
Federal regulations prohibit Eastern Bankshares, Inc. from repurchasing its shares of common stock during the first year following offering unless compelling business reasons exist for such repurchases, or to fund management recognition plans that have been ratified by shareholders (with regulatory approval) or tax-qualified employee stock benefit plans. In addition, the repurchase of shares of common stock is subject to Federal Reserve Board policy related to repurchases of shares by financial institution holding companies. Massachusetts regulations prohibit Eastern Bankshares, Inc. from repurchasing its shares of our common stock during the first three years following the completion of the offering except to fund tax-qualified or nontax-qualified employee stock benefit plans, or except in amounts not greater than 5% of our outstanding shares of common stock where compelling and valid business reasons are established to the satisfaction of the Massachusetts Commissioner of Banks.
179
Table of Contents
EASTERN BANK CHARITABLE FOUNDATION
General
In furtherance of our commitment to the communities in our market area, the plan of conversion provides that we will donate stock of Eastern Bankshares, Inc. to the existing Eastern Bank Charitable Foundation, which was formed in 1994 as a charitable trust under Massachusetts law. In addition to its existing assets, the Foundation will be funded with shares of our common stock, as further described below.
By further enhancing our visibility and reputation in the communities within our market area, we believe that the Foundation will continue to enhance the long-term value of Eastern Bank’s community banking franchise. The offering presents us with a unique opportunity to provide a substantial additional continuing benefit to our community through Eastern Bank Charitable Foundation.
Purpose of the Foundation
In connection with the closing of the offering, Eastern Bankshares, Inc. intends to donate to Eastern Bank Charitable Foundation a number of shares equal to 4% of the shares of our common stock that will be outstanding upon the completion of the offering and our donation to Eastern Bank Charitable Foundation.
The primary purpose of Eastern Bank Charitable Foundation is to provide financial support to charitable organizations and charitable activities in the markets that we serve. Eastern Bank Charitable Foundation is dedicated completely to activities that promote charitable causes, which includes creating partnerships with other organizations to “scale up” key initiatives, such as enhancing early childhood development, workforce development, and fostering growth for small and minority-owned business.
Funding Eastern Bank Charitable Foundation with shares of our common stock is also intended to allow our communities to share in our potential growth and success after the offering is completed because Eastern Bank Charitable Foundation will benefit directly from any increases in the value of our shares of common stock.
Structure of the Foundation
Eastern Bank Charitable Foundation is a charitable trust under Massachusetts law. The trust instrument provides that Eastern Bank Charitable Foundation is organized exclusively for charitable purposes as set forth in section 501(c)(3) of the Internal Revenue Code of 1986, as amended (the “Code”). Eastern Bank Charitable Foundation’s trust instrument further provides that no part of the net earnings of the Foundation will inure to the benefit of or be payable to any private shareholder or individual.
Eastern Bank Charitable Foundation is governed by a Board of Trustees, including our Chief Executive Officer Robert F. Rivers and one individual who is not affiliated with us. There must be a minimum of seven trustees, and such trustees are appointed by Eastern Bank.
The Trustees of Eastern Bank Charitable Foundation are responsible for establishing its grant and donation policies, consistent with the purposes for which it was established. As trustees of a charitable trust, the trustees of Eastern Bank Charitable Foundation are at all times bound by their fiduciary duty to advance the Foundation’s charitable goals, to protect its assets and to act in a manner consistent with the charitable purposes for which the Foundation was established. The trustees also are responsible for directing the activities of the Foundation, including the management and voting of the shares of our common stock held by the Foundation. However, as required by Federal Reserve Board regulations, all shares of our common stock held by Eastern Bank Charitable Foundation must be voted in the same ratio as all other shares of our common stock on all proposals considered by our shareholders.
Eastern Bank Charitable Foundation’s place of business is located at our administrative offices. The Board of Trustees of Eastern Bank Charitable Foundation appoints such officers and employees as may be necessary to manage its operations. By agreement with the Federal Reserve Board, Eastern Bank Charitable Foundation is considered to be an affiliate of Eastern Bank Corporation and its subsidiaries, and therefore to the extent applicable, we comply with the affiliates restrictions set forth in Sections 23A and 23B of the Federal Reserve Act and Massachusetts banking regulations governing transactions between Eastern Bank and affiliates.
180
Table of Contents
Eastern Bank Charitable Foundation will receive:
| (1) | any dividends that may be paid on our shares of common stock in the future; and |
| (2) | the proceeds of the sale of any of the shares of common stock in the open market from time to time. |
In addition, within the limits of applicable federal and state laws, Eastern Bank Charitable Foundation may obtain one or more loans collateralized by the shares of common stock. Eastern Bank does not intend to provide any loans to Eastern Bank Charitable Foundation.
As a private foundation under section 501(c)(3) of the Code, Eastern Bank Charitable Foundation is required to distribute annually in grants or permissible distributions a minimum of 5% of the average fair market value of its net investment assets from the preceding year.
Tax Considerations
Eastern Bank Charitable Foundation is exempt from income taxation under section 501(a) of the Code as an organization described in section 501(c)(3) of the Code and is further classified as a private nonoperating foundation, as described in section 509(a) of the Code. We have not received a tax opinion as to whether Eastern Bank Charitable Foundation’s tax exempt status will be affected by the regulatory requirement that all shares of our common stock held by Eastern Bank Charitable Foundation must be voted in the same ratio as all other outstanding shares of our common stock on all proposals considered by our shareholders.
Under the Code, Eastern Bank Charitable Foundation, together with other commonly controlled private foundations, is limited to owning no more than 2% of our voting stock and no more than 2% in value of all outstanding shares of all classes of our stock in order to not invoke the so-called excess business holdings rules of section 4943 of the Code. Our donation to Eastern Bank Charitable Foundation will not exceed this limitation.
We believe that our donation of shares of our common stock to Eastern Bank Charitable Foundation should not constitute an act of self-dealing and that we should be entitled to a deduction in the amount of the fair market value of the stock at the time of the donation given that no goods or services will be provided in exchange for the stock. The Internal Revenue Service may disagree with our determination, however. To the extent the Stock Donation is not deductible, we would not receive a tax benefit, and we would recognize as an after-tax expense the portion of the value of the Stock Donation that is not deductible. We are permitted to deduct for charitable purposes only an amount equal to 10% of our annual taxable income in any one year. We are permitted under the Code to carry the excess donation over the 5-year period following the year of the donation to Eastern Bank Charitable Foundation. We estimate that all of the donation should be deductible over the 5-year period (i.e., the year in which the donation is made and the succeeding 5-year period). Even if the donation is deductible, we may not have sufficient earnings to be able to use the deduction in full. Any such decision to continue to make additional donations to Eastern Bank Charitable Foundation in the future would be based on an assessment of, among other factors, our financial condition at that time, the interests of our shareholders and depositors, and the financial condition and operations of the Foundation.
As a private foundation, earnings and gains, if any, from the sale of common stock or other assets generally are exempt from federal and state income taxation. However, investment income, such as interest, dividends and capital gains, generally is taxed at a rate of 1-1.39%. Eastern Bank Charitable Foundation is required to file an annual return (Form 990-PF) with the Internal Revenue Service within 4 1⁄2 months after the close of its fiscal year, with the opportunity to extend the filing date up to 6 months. Eastern Bank Charitable Foundation will be required to make its annual return available for public inspection. The annual return for a private foundation includes, among other things, an itemized list of all grants made or approved, showing the amount of each grant, the recipient, any relationship between a grant recipient and the Foundation’s managers and a concise statement of the purpose of each grant. Eastern Bank Charitable Foundation also files returns annually (Form PC) with the Massachusetts Attorney General’s office, which is subject to the same filing deadline as the Form 990-PF.
Regulatory Requirements Imposed on the Foundation
Federal Reserve Board regulations require that, before our Board of Directors adopted the Plan of Conversion, the Board of Directors had to identify its members that will serve on the Foundation’s board, and these trustees could not participate in our Board’s discussions concerning donations to the Foundation and could not vote on the matter. Our Board of Directors complied with this regulation in adopting the Plan of Conversion.
181
Table of Contents
Federal Reserve Board regulations provide that the Federal Reserve Board will generally not object if a well-capitalized savings association donates to a charitable foundation an aggregate amount of 8% or less of the shares or proceeds issued in an offering. Eastern Bank qualifies as a well-capitalized savings association for purposes of this limitation, and the donation to Eastern Bank Charitable Foundation will not exceed this limitation.
Federal Reserve Board regulations impose the following additional requirements on the establishment of the Foundation:
| • | the Foundation’s primary purpose must be to serve and make grants in our local community; |
| • | the Federal Reserve Board may examine the Foundation at the Foundation’s expense; |
| • | the Foundation must comply with all supervisory directives imposed by the Federal Reserve Board; |
| • | the Foundation must provide annually to the Federal Reserve Board a copy of the annual report that the Foundation submits to the Internal Revenue Service; |
| • | the Foundation must operate according to written policies adopted by its Board of Trustees, including a conflict of interest policy; |
| • | the Foundation may not engage in self-dealing and must comply with all laws necessary to maintain its tax-exempt status under the Code; and |
| • | the Foundation must vote its shares of our common stock in the same ratio as all of the other shares voted on each proposal considered by our shareholders. |
In addition, as noted above, Eastern Bank Corporation has agreed to consider Eastern Bank Charitable Foundation an affiliate of Eastern Bank and Eastern Bankshares, Inc.
182
Table of Contents
RESTRICTIONS ON ACQUISITION OF EASTERN BANKSHARES, INC.
The following discussion is a general summary of the material provisions of Massachusetts law, the articles of organization and bylaws of Eastern Bankshares, Inc. and certain other regulatory provisions that may be deemed to have an “anti-takeover” effect. The following description is necessarily general and is not intended to be a complete description of each relevant document or regulatory provision. Eastern Bankshares, Inc.’s articles of organization and bylaws are included as part of the application filed with the Federal Reserve Board and the registration statement in which this prospectus is included filed with the Securities and Exchange Commission. See the section of this prospectus titled “Where You Can Find Additional Information.”
Massachusetts Law and Articles of Organization and Bylaws of Eastern Bankshares, Inc.
Although the Board of Directors of Eastern Bankshares, Inc. is not aware of any effort that might be made to obtain control of Eastern Bankshares, Inc. after the offering, the Board of Directors believes that it is appropriate to include certain provisions as part of Eastern Bankshares, Inc.’s articles of organization to protect the interests of Eastern Bankshares, Inc. and its shareholders from takeovers which the Board of Directors might conclude are not in the best interests of Eastern Bank, Eastern Bankshares, Inc. or Eastern Bankshares, Inc.’s shareholders. In addition, Massachusetts law contains a number of provisions relating to corporate governance and the rights of shareholders that may discourage future takeover attempts.
Classified Board of Directors. The articles of organization provide that the Board of Directors will be divided into three classes of directors, with the classes to be as nearly equal in number as possible, and with the directors serving three-year terms, with one class to be elected annually. As a result, approximately one-third of the Board of Directors will be elected each year. This classification will have the effect of making it more difficult for stockholders to change the composition of the Board of Directors. The number of directors may be determined only by resolution adopted by the Board of Directors. Our bylaws establish qualifications for Board members, including restrictions on affiliations with competitors of Eastern Bank and restrictions based upon prior legal or regulatory violations. Further, our bylaws impose notice and information requirements in connection with the nomination by shareholders of candidates for election to the Board of Directors or the proposal by shareholders of business to be acted upon at an annual meeting of shareholders. Such notice and information requirements are applicable to all shareholder business proposals and nominations, and are in addition to any requirements under the federal securities laws.
Restrictions on Call of Special Meetings. The bylaws provide that special meetings of shareholders can be called by the chair, the chief executive officer, or by the Board of Directors.
Restrictions on Removing Directors from Office. The articles of organization provide that directors may be removed only for cause, and only by the affirmative vote of either (i) the affirmative vote of at least two-thirds of the Independent Directors then in office, or (ii) the holders of a majority of the voting power of the shares of Eastern Bankshares, Inc. common stock then-outstanding and entitled to vote. Cause is defined in the Massachusetts Business Corporation Act to mean only (i) conviction of a felony, (ii) declaration of unsound mind by order of court, (iii) gross dereliction of duty, (iv) commission of an action involving moral turpitude, or (v) commission of an action which constitutes intentional misconduct or a knowing violation of law if such action in either event results both in an improper substantial personal benefit and a material injury to Eastern Bankshares, Inc.
Authorized but Unissued Shares. Eastern Bankshares, Inc. has authorized but unissued shares of common and preferred stock. See the section of this prospectus titled “Description of Capital Stock of Eastern Bankshares, Inc.” The articles of organization authorize 50,000,000 shares of preferred stock, no par value per share. Eastern Bankshares, Inc. is authorized to issue preferred stock from time to time in one or more series subject to applicable provisions of law, and the Board of Directors is authorized to fix the designations, and relative preferences, limitations, voting rights, if any, including without limitation, offering rights of such shares (which could be multiple or as a separate class). In the event of a proposed merger, tender offer or other attempt to gain control of Eastern Bankshares, Inc. that the Board of Directors does not approve, it may be possible for the Board of Directors to authorize the issuance of a series of preferred stock with rights and preferences that would impede the completion of the transaction. An effect of the possible issuance of preferred stock therefore may be to deter a future attempt to gain control of Eastern Bankshares, Inc. The Board of Directors has no present plan or understanding to issue any preferred stock.
Restrictions on Acquisitions of Securities. The articles of organization provide that no person may directly or indirectly offer to acquire or acquire the beneficial ownership of more than 10% of the issued and outstanding voting stock of Eastern
183
Table of Contents
Bankshares, Inc. Shares acquired in excess of this limitation will not be entitled to vote or to take other shareholder action or to be counted in determining the total number of outstanding shares for purposes of any matter involving shareholder action. Under regulations applicable to the offering, for a period of three years following completion of the offering, no person may acquire beneficial ownership of more than 10% of our common stock without prior approval of the Federal Reserve Board and the Massachusetts Commissioner of Banks. If any person exceeds this 10% beneficial ownership threshold, shares in excess of 10% will not be counted as shares entitled to vote during the three-year period following completion of the offering. After that three-year period, the holder of shares in excess of the 10% threshold will be entitled to cast only one one-hundredth (1/100) of a vote per share for each share in excess of the 10% threshold. For additional information regarding the restrictions imposed by the Federal Reserve Board and the Massachusetts Commissioner of Banks, see the subsections titled “—Federal Regulations” and “—Massachusetts Regulations.” The foregoing provision of the articles of organization does not apply to:
| • | Eastern Bankshares, Inc. or any subsidiary or any pension, profit-sharing, stock bonus or other compensation plan maintained by Eastern Bankshares, Inc. for the benefit of the employees of Eastern Bankshares, Inc. or any subsidiary, or any trust or custodial arrangement established in connection with any such plan; |
| • | any offer with a view toward public resale made exclusively to Eastern Bankshares, Inc. by underwriters or a selling group acting on its behalf; |
| • | a corporate reorganization without a change in the respective beneficial ownership interests of Eastern Bankshares, Inc.’s shareholders other than pursuant to the exercise of any dissenters’ appraisal rights; or |
| • | any offer or acquisition of shares of voting stock that has been approved in advance by an affirmative vote of not less than two-thirds of the directors then in office (plus an affirmative vote of two-thirds of the independent directors then in office if there is an interested shareholder at the time of the offer or acquisition). |
Amendments to Articles of Organization and Bylaws. Eastern Bankshares, Inc.’s articles of organization may be amended by the Board of Directors without shareholder action to the fullest extent permitted by the Massachusetts Business Corporation Act. Eastern Bankshares, Inc.’s articles of organization may also be amended by the affirmative vote of a majority of the total votes eligible to be cast by shareholders on such amendment, provided that such amendment has been duly approved by the affirmative vote of a majority of the Eastern Bankshares, Inc. directors. Eastern Bankshares, Inc.’s bylaws may be amended by the affirmative vote of a majority of Eastern Bankshares, Inc.’s directors or by the shareholders by the affirmative vote of a majority of the total votes eligible to be voted at a duly constituted meeting of shareholders.
Business Combinations with Interested Shareholders. Eastern Bankshares, Inc.’s articles of organization provide that certain “Business Combinations” require the affirmative vote of the holders of at least 80% of the voting power of the outstanding shares of Eastern Bankshares, Inc. Business Combination means: (1) any merger or consolidation of Eastern Bankshares, Inc. or any of its subsidiaries with or into any Interested Shareholder (as defined in the articles of organization) or its affiliate; (2) any sale, lease, exchange, mortgage, pledge, transfer, or other disposition to or with any Interested Shareholder or its affiliate having an aggregate fair market value equal to or greater than 10% of the combined assets of Eastern Bankshares, Inc. and its subsidiaries; (3) the issuance or transfer by Eastern Bankshares, Inc. or any subsidiary of any securities of Eastern Bankshares, Inc. or any subsidiary to any Interested Shareholder or its affiliate in exchange for cash, securities or other property having an aggregate fair market value equal to or greater than 10% of the combined assets of Eastern Bankshares, Inc. and its subsidiaries, except for any issuance or transfer pursuant to an employee benefit plan of Eastern Bankshares, Inc. or its subsidiaries; (4) the adoption of any plan or proposal for the liquidation or dissolution of Eastern Bankshares, Inc. proposed by or on behalf of any Interested Shareholder or its affiliate; and (5) any reclassification of securities (including any reverse share split) or recapitalization of Eastern Bankshares, Inc. or any merger or consolidation of Eastern Bankshares Inc. with any of its subsidiaries or any other transaction (whether or not with or into or otherwise involving any Interested Shareholder) which has the effect, directly or indirectly, of increasing the proportionate share of the outstanding shares of any class or series of equity or convertible securities of Eastern Bankshares Inc. or any subsidiary which is directly or indirectly owned by any Interested Shareholder or its affiliate. However, if certain conditions are met, including the Business Combination being approved by two-thirds of the Independent Directors then in office and/or certain price and procedure conditions, then only the affirmative vote, if any, as may be required by law would be required to approve the Business Combination.
Vote Required for Certain Transactions. The articles of organization further provide that, unless a higher percentage vote is required by law or the fair price provision of the articles of organization, any sale, lease or exchange of all or substantially all of Eastern Bankshares, Inc.’s property or assets, including goodwill; or the merger, share exchange or consolidation of Eastern Bankshares, Inc. with or into any other entity must be approved by an affirmative vote of at least two-thirds of the total votes that may be cast by Eastern Bankshares, Inc.’s shareholders on such a transaction. However, only
184
Table of Contents
a majority vote of Eastern Bankshares, Inc.’s shareholders is necessary if the transaction has been recommended to the shareholders for approval by two-thirds of the directors then in office (unless there is an Interested Shareholder, in which case the recommendation to shareholders must also be approved by the vote of a majority of the Independent Directors then in office).
Purpose and Anti-Takeover Effects of Eastern Bankshares, Inc.’s Articles of Organization and Bylaws. Our Board of Directors believes that the provisions described above are prudent and will reduce our vulnerability to takeover attempts and certain other transactions that have not been negotiated with and approved by our Board of Directors. These provisions also will assist us in the orderly deployment of the offering proceeds into productive assets during the initial period after the offering. We believe these provisions are in the best interests of Eastern Bankshares, Inc. and its shareholders. Our Board of Directors believes that it will be in the best position to determine the fair value of Eastern Bankshares, Inc. and to negotiate more effectively for what may be in the best interests of all our shareholders. Accordingly, our Board of Directors believes that it is in the best interests of Eastern Bankshares, Inc. and all of our shareholders to encourage potential acquirers to negotiate directly with the Board of Directors and that these provisions will encourage such negotiations and discourage hostile takeover attempts. It is also the view of our Board of Directors that these provisions should not discourage persons from proposing a merger or other transaction at a price reflective of the fair value of Eastern Bankshares, Inc. and that is in the best interests of all our shareholders.
Takeover attempts that have not been negotiated with and approved by our Board of Directors present the risk of a takeover on terms that may be less favorable than might otherwise be available. A transaction that is negotiated and approved by our Board of Directors, on the other hand, can be carefully planned and undertaken at an opportune time in order to obtain maximum value for our shareholders, with due consideration given to matters such as the management and business of the acquiring corporation.
Although a tender offer or other takeover attempt may be made at a price substantially above the current market price, such offers are sometimes made for less than all of the outstanding shares of a target company. As a result, shareholders may be presented with the alternative of partially liquidating their investment at a time that may be disadvantageous or retaining their investment in an enterprise that is under different management and whose objectives may not be similar to those of the remaining shareholders.
Despite our belief as to the benefits to shareholders of these provisions of Eastern Bankshares, Inc.’s articles of organization and bylaws, these provisions also may have the effect of discouraging a future takeover attempt that would not be approved by our Board of Directors, but pursuant to which shareholders may receive a substantial premium for their shares over then current market prices. As a result, shareholders who might desire to participate in such a transaction may not have any opportunity to do so. Such provisions will also make it more difficult to remove our Board of Directors and management. Our Board of Directors, however, has concluded that the potential benefits outweigh the possible disadvantages of these provisions.
Federal Regulations
Federal Reserve Board regulations prohibit any person from making an offer, announcing an intent to make an offer or participating in any other arrangement to purchase stock or acquire stock or subscription rights in a converting institution or its holding company from another person prior to completion of its offering. Further, without the prior written approval of the Federal Reserve Board, no person may make an offer or announcement of an offer to purchase shares or actually acquire shares of Eastern Bank or Eastern Bankshares, Inc. for a period of three years from the date of the completion of the offering if, upon the completion of such offer, announcement or acquisition, the person would become the beneficial owner of more than 10% of the outstanding stock of the institution or its holding company. The Federal Reserve Board has defined “person” to include any individual, group acting in concert, corporation, partnership, association, joint stock company, trust, unincorporated organization or similar company, a syndicate or any other group formed for the purpose of acquiring, holding or disposing of securities of an insured institution. However, offers made exclusively to a bank or its holding company, or to an underwriter or member of a selling group acting on the converting institution’s or its holding company’s behalf for resale to the general public, are excepted. The regulation also provides civil penalties for willful violation or assistance in any such violation of the regulation by any person connected with the management of the converting institution or its holding company or who controls more than 10% of the outstanding shares or voting rights of a converted institution or its holding company.
185
Table of Contents
Massachusetts Regulations
Massachusetts regulations provide that, without prior written notice to us and the prior written approval of the Massachusetts Commissioner of Banks, no person may directly or indirectly offer to acquire the beneficial ownership of more than 10% of any class of our equity securities for a period of three years from the date of the completion of the offering. Where a person, directly or indirectly, acquires beneficial ownership of more than 10% of any class of our equity securities, without prior written notice to us and the prior written approval of the Massachusetts Commissioner of Banks, the securities beneficially owned by such person in excess of 10% shall not be counted as shares entitled to vote, shall not be voted by any person or counted as voting shares in connection with any matter submitted to the shareholders for a vote, and shall not be counted as outstanding for purposes of determining the affirmative vote necessary to approve any matter submitted to shareholders for a vote, and the Massachusetts Commissioner of Banks may take any further action she or he may deem appropriate. The regulations provide for civil penalties for a violation of these regulations.
Change in Control Law and Regulations
Under the Change in Bank Control Act, no person, or group of persons acting in concert, may acquire control of a bank holding company such as Eastern Bankshares, Inc. unless the Federal Reserve Board has been given 60 days’ prior written notice and has not disapproved the proposed acquisition. The Federal Reserve Board considers several factors in evaluating a notice, including the financial and managerial resources of the acquirer and competitive effects. Control, as defined under the Change in Bank Control Act, means the power, directly or indirectly, to direct the management or policies of the company or to vote 25% or more of any class of voting securities of the company. Acquisition of more than 10% of any class of a bank holding company’s voting securities constitutes a rebuttable presumption of control under certain circumstances, including where, as will be the case with Eastern Bankshares, Inc., the issuer has registered securities under Section 12 of the Securities Exchange Act of 1934.
In addition, federal regulations provide that no company may acquire control (as defined in the Bank Holding Company Act) of a bank holding company without the prior approval of the Federal Reserve Board. Any company that acquires such control becomes a “bank company” subject to registration, examination and regulation by the Federal Reserve Board.
Massachusetts Banking Law
Under Massachusetts banking laws, a company owning or controlling two or more banking institutions, including a savings bank, is regulated as a bank holding company. Each Massachusetts bank holding company: (i) must obtain the approval of the Massachusetts Board of Bank Incorporation before engaging in certain transactions, such as the acquisition of more than 5% of the voting stock of another banking institution; (ii) must register, and file reports, with the Massachusetts Division of Banks; and (iii) is subject to examination by the Massachusetts Division of Banks. Eastern Bankshares, Inc. would become a Massachusetts bank holding company if it acquires a second banking institution and holds and operates it separately from Eastern Bank.
186
Table of Contents
DESCRIPTION OF CAPITAL STOCK OF EASTERN BANKSHARES, INC.
The following description is a general summary of the material provisions of the articles of organization and bylaws of Eastern Bankshares, Inc. The following description is necessarily general and is not intended to be a complete description of each relevant document. Eastern Bankshares, Inc.’s articles of organization and bylaws are included as part of the application filed with the Federal Reserve Board and the registration statement in which this prospectus is included filed with the Securities and Exchange Commission. See the section of this prospectus titled “Where You Can Find Additional Information.”
For a general summary of the material provisions of Massachusetts law, the articles of organization and bylaws of Eastern Bankshares, Inc. and certain other regulatory provisions that may be deemed to have an “anti-takeover” effect, see the section of this prospectus titled “Restrictions on Acquisition of Eastern Bankshares, Inc.”
General
Eastern Bankshares, Inc. is authorized to issue 1,000,000,000 shares of common stock, $0.01 par value per share, 50,000,000 shares of preferred stock, no par value per share. Eastern Bankshares, Inc. currently expects to issue in the offering up to 201,681,250 shares of common stock at the adjusted maximum of the offering range. Eastern Bankshares, Inc. will not issue shares of preferred stock in the offering. Each share of common stock will have the same relative rights as, and will be identical in all respects to, each other share of common stock. Upon payment of the subscription price for the common stock, in accordance with the plan of conversion, all of the shares of common stock will be duly authorized, fully paid and nonassessable.
The shares of common stock will represent nonwithdrawable capital, will not be an account of an insurable type, and will not be insured by the Federal Deposit Insurance Corporation or any other government agency.
Common Stock
Dividends. Holders of Eastern Bankshares, Inc.’s common stock will be entitled to receive and share equally in such dividends as its Board of Directors may declare out of funds legally available for such payments. If Eastern Bankshares, Inc. issues preferred stock, holders of such stock may have a priority over holders of common stock with respect to the payment of dividends. State and federal laws and regulations place limitations on the payment of dividends. Eastern Bankshares, Inc. shall not declare or pay a cash dividend on, or repurchase any of, its capital stock if the effect thereof would cause its net worth to reduce below (i) the amount required for the Liquidation Account or (ii) the regulatory capital requirements of Eastern Bankshares, Inc. (to the extent applicable). See the section of this prospectus titled “Our Dividend Policy.”
Voting Rights. Upon completion of the offering, the holders of common stock of Eastern Bankshares, Inc. will have exclusive voting rights in Eastern Bankshares, Inc. They will elect Eastern Bankshares, Inc.’s Board of Directors and act on other matters as are required to be presented to them under Massachusetts law or as are otherwise presented to them by the Board of Directors. Generally, each holder of common stock will be entitled to one vote per share and will not have any right to cumulate votes in the election of directors. Any person who beneficially owns more than 10% of the then-outstanding shares of Eastern Bankshares, Inc.’s common stock, however, will not be entitled or permitted to vote any shares of common stock held in excess of the 10% limit. If Eastern Bankshares, Inc. issues shares of preferred stock, holders of the preferred stock may also possess voting rights. Certain matters require the approval of holders of 80% of the shares of common stock then outstanding; provided, however, that if the Board of Directors recommends, by the affirmative vote of two-thirds of the Independent Directors then in office at a duly constituted meeting of the Board of Directors, that shareholders approve such matter at such meeting of shareholders, such matter shall require only the affirmative vote of a majority of the total votes eligible to be cast.
As a Massachusetts-chartered stock bank, corporate powers and control of Eastern Bank are vested in its Board of Directors, who elect the officers of Eastern Bank and who fill any vacancies on the Board of Directors. Voting rights of Eastern Bank are vested exclusively in the owners of the shares of capital stock of Eastern Bank, which will be Eastern Bankshares, Inc., and voted at the direction of Eastern Bankshares, Inc.’s Board of Directors. Consequently, the holders of the common stock of Eastern Bankshares, Inc. will not have direct control of Eastern Bank.
187
Table of Contents
Liquidation. In the event of any liquidation, dissolution or winding up of Eastern Bank, Eastern Bankshares, Inc., as the holder of 100% of Eastern Bank’s capital stock, would be entitled to receive all assets of Eastern Bank available for distribution, after payment or provision for payment of all debts and liabilities of Eastern Bank, including all deposit accounts and accrued interest thereon, and after distribution of the balance in the liquidation account to Eligible Account Holders and Supplemental Eligible Account Holders. In the event of liquidation, dissolution or winding up of Eastern Bankshares, Inc., the holders of its common stock would be entitled to receive, after payment or provision for payment of all its debts and liabilities (including payments with respect to its liquidation account), all of the assets of Eastern Bankshares, Inc. available for distribution. If preferred stock is issued, the holders thereof may have a priority over the holders of the common stock in the event of liquidation or dissolution.
Preemptive Rights. Holders of the common stock of Eastern Bankshares, Inc. will not be entitled to preemptive rights with respect to any shares that may be issued. The common stock is not subject to redemption or sinking fund provisions.
Preferred Stock
None of the shares of Eastern Bankshares, Inc.’s authorized preferred stock will be issued as part of the offering. Preferred stock may be issued with preferences and designations as our Board of Directors may from time to time determine. Our Board of Directors may, without shareholder approval, issue shares of preferred stock with voting, dividend, liquidation and conversion rights that could dilute the voting strength of the holders of the common stock and may assist management in impeding an unfriendly takeover or attempted change in control.
Sole and Exclusive Forum
The articles of organization of Eastern Bankshares, Inc. provide that state and federal courts located in Massachusetts will be the exclusive forum for substantially all disputes between us and our shareholders, which could limit our shareholders’ ability to obtain a favorable judicial forum for disputes with us or our directors, officers or employees. The articles of organization of Eastern Bankshares, Inc. provide that, unless we consent in writing to the selection of an alternative forum, the Business Litigation Session of the Suffolk County Superior Court (the “BLS”) in general is the sole and exclusive forum for any derivative action or proceeding brought on behalf of Eastern Bankshares, Inc., any action asserting a claim of breach of a fiduciary duty, any action asserting a claim arising pursuant to any provision of Massachusetts corporate law, or any action asserting a claim governed by the internal affairs doctrine. The articles of organization provide that the BLS will have exclusive jurisdiction, unless the BLS does not have subject matter jurisdiction, in which case a state court located within Massachusetts or, if no state court located within Massachusetts has subject matter jurisdiction, the United States District Court for the District of Massachusetts will have exclusive jurisdiction. For any claim arising under the Securities Act of 1933 or the rules and regulations thereunder, the articles of organization provide that the United States District Court for the District of Massachusetts and the BLS (or if the BLS does not have subject matter jurisdiction, a state court located within Massachusetts), to the fullest extent permitted by law, will have concurrent jurisdiction for the resolution of such claim, unless Eastern Bankshares, Inc. consents in writing to the selection of an alternative forum. The articles of organization also provide that the exclusive forum provision does not apply to any claim for which the federal courts have exclusive jurisdiction. Section 27 of the Securities Exchange Act of 1934 (the “Exchange Act”) creates exclusive federal jurisdiction over all suits brought to enforce any liability or duty created by the Exchange Act or the rules and regulations thereunder. The choice of forum provision may limit a shareholder’s ability to bring a claim in a judicial forum that the shareholder finds favorable for disputes with us or our directors and officers or other employees, which may discourage such lawsuits against us and our directors, officers and other employees. Alternatively, if a court were to find the choice of forum provision contained in our articles of organization to be inapplicable or unenforceable in an action, we may incur additional costs associated with resolving such action in other jurisdictions, which could adversely affect our business and financial condition.
The transfer agent and registrar for Eastern Bankshares, Inc.’s common stock is Continental Stock Transfer & Trust Company, New York, New York.
188
Table of Contents
The consolidated financial statements of Eastern Bank Corporation at December 31, 2019 and 2018, and for each of the two years in the period ended December 31, 2019, appearing in this Prospectus and Registration Statement have been audited by Ernst & Young LLP, independent registered public accounting firm, as set forth in their report thereon appearing elsewhere herein, and are included in reliance upon such report given on the authority of such firm as experts in accounting and auditing.
RP Financial, LC has consented to the publication herein of the summary of its report setting forth its opinion as to the estimated pro forma market value of the shares of common stock upon completion of the offering and its letters with respect to subscription rights and the liquidation account.
Nutter, McClennen & Fish, LLP, Boston, Massachusetts, counsel to Eastern Bank Corporation, Eastern Bankshares, Inc. and Eastern Bank, has issued to Eastern Bankshares, Inc. its opinion regarding the legality of the common stock and the tax consequences of the offering under federal, Massachusetts and New Hampshire law. Certain legal matters will be passed upon for Keefe, Bruyette & Woods, Inc. and J.P. Morgan Securities LLC by Simpson Thacher & Bartlett LLP, New York, New York.
189
Table of Contents
WHERE YOU CAN FIND ADDITIONAL INFORMATION
Eastern Bankshares, Inc. has filed with the Securities and Exchange Commission a registration statement under the Securities Act of 1933 with respect to the shares of common stock offered hereby. As permitted by the rules and regulations of the Securities and Exchange Commission, this prospectus does not contain all the information set forth in the registration statement. Such information, including the appraisal report which is an exhibit to the registration statement, can be examined without charge at the public reference facilities of the Securities and Exchange Commission located at 100 F Street, N.E., Washington, D.C. 20549, and copies of such material can be obtained from the Securities and Exchange Commission at prescribed rates. The Securities and Exchange Commission’s telephone number is 1-800-SEC-0330. In addition, the Securities and Exchange Commission maintains a web site (http://www.sec.gov) that contains reports, proxy and information statements and other information regarding registrants that file electronically with the Securities and Exchange Commission, including Eastern Bankshares, Inc. The statements contained in this prospectus as to the contents of any contract or other document filed as an exhibit to the registration statement are, of necessity, brief descriptions of the material terms of, and should be read in conjunction with, such contract or document.
Eastern Bankshares, Inc. has filed applications for approval of the offering with the Massachusetts Commissioner of Banks and the Federal Reserve Board. The application for offering filed with the Massachusetts Commissioner of Banks may be inspected, without charge, at the offices of the Massachusetts Division of Banks, 1000 Washington Street, 10th Floor, Boston, Massachusetts. To obtain a copy of the application filed with the Federal Reserve Board, you may contact Scott Chu, Supervisory Analyst, of the Federal Reserve Bank of Boston, at (617) 973-3088. The plan of conversion is available, upon request, at each of Eastern Bank’s offices.
In connection with the offering, Eastern Bankshares, Inc. will register its common stock under Section 12(b) of the Securities Exchange Act of 1934 and, upon such registration, Eastern Bankshares, Inc. and the holders of its common stock will become subject to the proxy solicitation rules, reporting requirements and restrictions on common stock purchases and sales by directors, officers and greater than 10% shareholders, the annual and periodic reporting and certain other requirements of the Securities Exchange Act of 1934. Under the plan of conversion, Eastern Bankshares, Inc. has undertaken that it will not terminate such registration for a period of at least three years following the offering.
190
Table of Contents
INDEX TO CONSOLIDATED FINANCIAL STATEMENTS
| Page | ||||
| F-2 | ||||
| Consolidated Balance Sheets as of March 31, 2020 (unaudited) and December 31, 2019 and 2018 |
F-3 | |||
| Consolidated Statements of Income for the three months ended March 31, 2020 and 2019 (unaudited) and the years ended December 31, 2019 and 2018 |
F-4 | |||
| Consolidated Statements of Comprehensive Income for the three months ended March 31, 2020 and 2019 (unaudited) and the years ended December 31, 2019 and 2018 |
F-5 | |||
| Consolidated Statements of Changes in Equity for the three months ended March 31, 2020 and 2019 (unaudited) and the years ended December 31, 2019 and 2018 |
F-6 | |||
| Consolidated Statements of Cash Flows for the three months ended March 31, 2020 and 2019 (unaudited) and the years ended December 31, 2019 and 2018 |
F-7 | |||
| F-8 | ||||
F-1
Table of Contents
REPORT OF INDEPENDENT REGISTERED PUBLIC ACCOUNTING FIRM
Report of Ernst & Young LLP, Independent Registered Public Accounting Firm
To the Shareholders and the Board of Directors of Eastern Bank Corporation
Opinion on the Financial Statements
We have audited the accompanying consolidated balance sheets of Eastern Bank Corporation (the “Company”) as of December 31, 2019 and 2018, the related consolidated statements of income, comprehensive income, changes in equity and cash flows for each of the two years in the period ended December 31, 2019, and the related notes (collectively referred to as the “consolidated financial statements”). In our opinion, the consolidated financial statements present fairly, in all material respects, the financial position of the Company at December 31, 2019 and 2018, and the results of its operations and its cash flows for each of the two years in the period ended December 31, 2019, in conformity with U.S. generally accepted accounting principles.
Basis for Opinion
These financial statements are the responsibility of the Company’s management. Our responsibility is to express an opinion on the Company’s financial statements based on our audits. We are a public accounting firm registered with the Public Company Accounting Oversight Board (United States) (PCAOB) and are required to be independent with respect to the Company in accordance with the U.S. federal securities laws and the applicable rules and regulations of the Securities and Exchange Commission and the PCAOB.
We conducted our audits in accordance with the standards of the PCAOB. Those standards require that we plan and perform the audit to obtain reasonable assurance about whether the financial statements are free of material misstatement, whether due to error or fraud. The Company is not required to have, nor were we engaged to perform, an audit of its internal control over financial reporting. As part of our audits we are required to obtain an understanding of internal control over financial reporting but not for the purpose of expressing an opinion on the effectiveness of the Company’s internal control over financial reporting. Accordingly, we express no such opinion.
Our audits included performing procedures to assess the risks of material misstatement of the financial statements, whether due to error or fraud, and performing procedures that respond to those risks. Such procedures included examining, on a test basis, evidence regarding the amounts and disclosures in the financial statements. Our audits also included evaluating the accounting principles used and significant estimates made by management, as well as evaluating the overall presentation of the financial statements. We believe that our audits provide a reasonable basis for our opinion.
/s/ Ernst & Young LLP
We have served as the Company’s auditor since 2002.
Boston, Massachusetts
May 4, 2020
F-2
Table of Contents
CONSOLIDATED BALANCE SHEETS
| As of March 31, |
As of December 31, | |||||||||||
| 2020 | 2019 | 2018 | ||||||||||
| (Unaudited) | ||||||||||||
| (In Thousands) | ||||||||||||
| Assets |
||||||||||||
| Cash and due from banks |
$ | 94,215 | $ | 135,503 | $ | 149,703 | ||||||
| Short-term investments |
672,234 | 227,099 | 110,005 | |||||||||
|
|
|
|
|
|
|
|||||||
| Cash and cash equivalents |
766,449 | 362,602 | 259,708 | |||||||||
|
|
|
|
|
|
|
|||||||
| Securities: |
||||||||||||
| Trading |
652 | 961 | 52,899 | |||||||||
|
Available-for-sale |
1,549,927 | 1,508,236 | 1,455,898 | |||||||||
|
|
|
|
|
|
|
|||||||
| Total securities |
1,550,579 | 1,509,197 | 1,508,797 | |||||||||
|
|
|
|
|
|
|
|||||||
| Loans held for sale |
2,843 | 26 | 22 | |||||||||
| Loans: |
||||||||||||
| Commercial and industrial |
1,771,122 | 1,642,184 | 1,658,765 | |||||||||
| Commercial real estate |
3,523,721 | 3,535,441 | 3,211,118 | |||||||||
| Commercial construction |
293,135 | 273,774 | 313,209 | |||||||||
| Business banking |
779,916 | 771,498 | 740,938 | |||||||||
| Residential real estate |
1,420,003 | 1,428,630 | 1,430,764 | |||||||||
| Consumer home equity |
929,554 | 933,088 | 949,410 | |||||||||
| Other consumer |
369,652 | 402,431 | 551,799 | |||||||||
|
|
|
|
|
|
|
|||||||
| Total loans |
9,087,103 | 8,987,046 | 8,856,003 | |||||||||
| Less: allowance for loan losses |
(109,138 | ) | (82,297 | ) | (80,655 | ) | ||||||
| Less: unamortized premiums, net of unearned discounts and deferred fees |
(6,360 | ) | (5,565 | ) | (435 | ) | ||||||
|
|
|
|
|
|
|
|||||||
| Loans, net of allowance for loan losses and unamortized premiums, net of unearned discounts and deferred fees |
8,971,605 | 8,899,184 | 8,774,913 | |||||||||
|
|
|
|
|
|
|
|||||||
| Federal Home Loan Bank stock, at cost |
8,805 | 9,027 | 17,959 | |||||||||
| Premises and equipment, net |
54,867 | 57,453 | 66,475 | |||||||||
| Bank-owned life insurance |
78,170 | 77,546 | 75,434 | |||||||||
| Goodwill and other intangibles, net |
377,033 | 377,734 | 381,276 | |||||||||
| Deferred income taxes, net |
5,152 | 28,207 | 37,676 | |||||||||
| Prepaid expenses |
87,960 | 61,336 | 60,855 | |||||||||
| Other assets |
440,291 | 246,463 | 195,172 | |||||||||
|
|
|
|
|
|
|
|||||||
| Total assets |
$ | 12,343,754 | $ | 11,628,775 | $ | 11,378,287 | ||||||
|
|
|
|
|
|
|
|||||||
| Liabilities and Equity |
||||||||||||
| Deposits: |
||||||||||||
| Demand deposits |
$ | 3,646,052 | $ | 3,517,447 | $ | 3,444,804 | ||||||
| Interest checking accounts |
2,318,609 | 1,814,327 | 1,899,336 | |||||||||
| Savings accounts |
1,002,709 | 971,119 | 999,649 | |||||||||
| Money market investments |
3,016,932 | 2,919,360 | 2,580,756 | |||||||||
| Certificates of deposit |
324,709 | 329,139 | 474,948 | |||||||||
|
|
|
|
|
|
|
|||||||
| Total deposits |
10,309,011 | 9,551,392 | 9,399,493 | |||||||||
|
|
|
|
|
|
|
|||||||
| Borrowings: |
||||||||||||
| Federal funds purchased |
— | 201,082 | 168,776 | |||||||||
| Federal Home Loan Bank advances |
15,070 | 18,964 | 137,286 | |||||||||
| Escrow deposits of borrowers |
16,357 | 15,349 | 14,875 | |||||||||
| Interest rate swap collateral funds |
— | — | 13,350 | |||||||||
|
|
|
|
|
|
|
|||||||
| Total borrowings |
31,427 | 235,395 | 334,287 | |||||||||
|
|
|
|
|
|
|
|||||||
| Other liabilities |
340,582 | 241,835 | 211,366 | |||||||||
|
|
|
|
|
|
|
|||||||
| Total liabilities |
10,681,020 | 10,028,622 | 9,945,146 | |||||||||
|
|
|
|
|
|
|
|||||||
| Commitments and contingencies (Note 13) |
||||||||||||
| Equity: |
||||||||||||
| Retained earnings |
1,651,314 | 1,644,000 | 1,508,902 | |||||||||
| Accumulated other comprehensive loss, net of tax |
11,420 | (43,847 | ) | (75,761 | ) | |||||||
|
|
|
|
|
|
|
|||||||
| Total equity |
1,662,734 | 1,600,153 | 1,433,141 | |||||||||
|
|
|
|
|
|
|
|||||||
| Total liabilities and equity |
$ | 12,343,754 | $ | 11,628,775 | $ | 11,378,287 | ||||||
|
|
|
|
|
|
|
|||||||
The accompanying notes are an integral part of these consolidated financial statements.
F-3
Table of Contents
CONSOLIDATED STATEMENTS OF INCOME
| Three Months Ended March 31, | Year Ended December 31, | |||||||||||||||
| 2020 | 2019 | 2019 | 2018 | |||||||||||||
| (Unaudited) | ||||||||||||||||
| (In Thousands) | ||||||||||||||||
| Interest and dividend income: |
||||||||||||||||
| Interest and fees on loans |
$ | 95,538 | $ | 100,556 | $ | 402,092 | $ | 369,148 | ||||||||
| Taxable interest and dividends on available for sale securities |
8,178 | 8,052 | 31,400 | 31,988 | ||||||||||||
| Non-taxable interest and dividends on available for sale securities |
1,921 | 2,354 | 8,306 | 9,585 | ||||||||||||
| Interest on federal funds sold and other short-term investments |
517 | 353 | 2,977 | 3,412 | ||||||||||||
| Interest and dividends on trading securities |
5 | 168 | 242 | 1,033 | ||||||||||||
|
|
|
|
|
|
|
|
|
|||||||||
| Total interest and dividend income |
106,159 | 111,483 | 445,017 | 415,166 | ||||||||||||
|
|
|
|
|
|
|
|
|
|||||||||
| Interest expense: |
||||||||||||||||
| Interest on deposits |
5,414 | 6,519 | 27,301 | 17,384 | ||||||||||||
| Interest on borrowings |
599 | 2,292 | 6,452 | 7,738 | ||||||||||||
|
|
|
|
|
|
|
|
|
|||||||||
| Total interest expense |
6,013 | 8,811 | 33,753 | 25,122 | ||||||||||||
|
|
|
|
|
|
|
|
|
|||||||||
| Net interest income |
100,146 | 102,672 | 411,264 | 390,044 | ||||||||||||
| Provision for loan losses |
28,600 | 3,000 | 6,300 | 15,100 | ||||||||||||
|
|
|
|
|
|
|
|
|
|||||||||
| Net interest income after provision for loan losses |
71,546 | 99,672 | 404,964 | 374,944 | ||||||||||||
|
|
|
|
|
|
|
|
|
|||||||||
| Noninterest income: |
||||||||||||||||
| Insurance commissions |
27,477 | 24,762 | 90,587 | 91,885 | ||||||||||||
| Service charges on deposit accounts |
6,098 | 6,404 | 27,043 | 26,897 | ||||||||||||
| Trust and investment advisory fees |
5,095 | 4,628 | 19,653 | 19,128 | ||||||||||||
| Debit card processing fees |
2,470 | 2,410 | 10,452 | 16,162 | ||||||||||||
| Interest rate swap (loss) income |
(6,009 | ) | 340 | 4,362 | 5,012 | |||||||||||
| Income (losses) from investments held in rabbi trusts |
(6,743 | ) | 4,147 | 9,866 | (1,542 | ) | ||||||||||
| (Losses) gains on trading securities, net |
(2 | ) | 1,142 | 1,297 | 2,156 | |||||||||||
| Gain on sales of mortgage loans held for sale, net |
93 | 50 | 795 | 397 | ||||||||||||
| Gains on sales of securities available for sale, net |
122 | 50 | 2,016 | 50 | ||||||||||||
| Other |
4,768 | 3,867 | 16,228 | 20,450 | ||||||||||||
|
|
|
|
|
|
|
|
|
|||||||||
| Total noninterest income |
33,369 | 47,800 | 182,299 | 180,595 | ||||||||||||
|
|
|
|
|
|
|
|
|
|||||||||
| Noninterest expense: |
||||||||||||||||
| Salaries and employee benefits |
61,589 | 67,306 | 252,238 | 239,349 | ||||||||||||
| Office occupancy and equipment expenses |
8,689 | 8,799 | 36,458 | 35,480 | ||||||||||||
| Data processing expenses |
10,004 | 10,676 | 45,939 | 45,260 | ||||||||||||
| Professional services |
3,689 | 3,138 | 15,958 | 14,812 | ||||||||||||
| Charitable donations |
1,187 | 3,648 | 12,905 | 13,251 | ||||||||||||
| Marketing expenses |
2,468 | 1,723 | 9,619 | 11,100 | ||||||||||||
| FDIC insurance |
906 | 873 | 1,878 | 4,180 | ||||||||||||
| Amortization of intangible assets |
702 | 887 | 3,542 | 3,891 | ||||||||||||
| Net periodic benefit cost, excluding service cost |
(2,442 | ) | (1,334 | ) | (5,335 | ) | (6,498 | ) | ||||||||
| Other |
8,380 | 9,113 | 39,482 | 37,103 | ||||||||||||
|
|
|
|
|
|
|
|
|
|||||||||
| Total noninterest expense |
95,172 | 104,829 | 412,684 | 397,928 | ||||||||||||
|
|
|
|
|
|
|
|
|
|||||||||
| Income before provision for income taxes |
9,743 | 42,643 | 174,579 | 157,611 | ||||||||||||
| Provision for income taxes |
1,298 | 9,678 | 39,481 | 34,884 | ||||||||||||
|
|
|
|
|
|
|
|
|
|||||||||
| Net income |
$ | 8,445 | $ | 32,965 | $ | 135,098 | $ | 122,727 | ||||||||
|
|
|
|
|
|
|
|
|
|||||||||
The accompanying notes are an integral part of these consolidated financial statements.
F-4
Table of Contents
CONSOLIDATED STATEMENTS OF COMPREHENSIVE INCOME
| Three Months Ended March 31, | Year Ended December 31, | |||||||||||||||
| 2020 | 2019 | 2019 | 2018 | |||||||||||||
| (Unaudited) | ||||||||||||||||
| (In Thousands) | ||||||||||||||||
| Net income |
$ | 8,445 | $ | 32,965 | $ | 135,098 | $ | 122,727 | ||||||||
|
|
|
|
|
|
|
|
|
|||||||||
| Other comprehensive income (loss), net of tax |
||||||||||||||||
| Net change in fair value of securities available for sale |
26,192 | 24,990 | 41,158 | (30,525 | ) | |||||||||||
| Net change in fair value of cash flow hedges |
29,075 | 4,002 | 12,636 | 2,988 | ||||||||||||
| Net change in actuarial pension benefits |
— | — | (21,880 | ) | 7,437 | |||||||||||
|
|
|
|
|
|
|
|
|
|||||||||
| Total other comprehensive income (loss) |
55,267 | 28,992 | 31,914 | (20,100 | ) | |||||||||||
|
|
|
|
|
|
|
|
|
|||||||||
| Total comprehensive income |
$ | 63,712 | $ | 61,957 | $ | 167,012 | $ | 102,627 | ||||||||
|
|
|
|
|
|
|
|
|
|||||||||
The accompanying notes are an integral part of these consolidated financial statements.
F-5
Table of Contents
CONSOLIDATED STATEMENTS OF CHANGES IN EQUITY
| Retained Earnings |
Accumulated Other Comprehensive Loss |
Total | ||||||||||
| (In Thousands) | ||||||||||||
| Balance at December 31, 2017 |
$ | 1,379,006 | $ | (48,492 | ) | $ | 1,330,514 | |||||
| Opening balance reclassification (1) |
||||||||||||
| Unrealized appreciation on securities available for sale |
(1,953 | ) | 1,953 | — | ||||||||
| Actuarial net loss of defined benefit pension plans |
9,122 | (9,122 | ) | — | ||||||||
| Net income |
122,727 | — | 122,727 | |||||||||
| Other comprehensive loss, net of tax |
— | (20,100 | ) | (20,100 | ) | |||||||
|
|
|
|
|
|
|
|||||||
| Balance at December 31, 2018 |
1,508,902 | (75,761 | ) | 1,433,141 | ||||||||
|
|
|
|
|
|
|
|||||||
| Net income |
135,098 | — | 135,098 | |||||||||
| Other comprehensive income, net of tax |
— | 31,914 | 31,914 | |||||||||
|
|
|
|
|
|
|
|||||||
| Balance at December 31, 2019 |
$ | 1,644,000 | $ | (43,847 | ) | $ | 1,600,153 | |||||
|
|
|
|
|
|
|
|||||||
| Balance at December 31, 2018 |
$ | 1,508,902 | $ | (75,761 | ) | $ | 1,433,141 | |||||
| Net income (unaudited) |
32,965 | — | 32,965 | |||||||||
| Other comprehensive income, net of tax (unaudited) |
— | 28,992 | 28,992 | |||||||||
|
|
|
|
|
|
|
|||||||
| Balance at March 31, 2019 (unaudited) |
$ | 1,541,867 | $ | (46,769 | ) | $ | 1,495,098 | |||||
|
|
|
|
|
|
|
|||||||
|
Balance at December 31, 2019 |
$ | 1,644,000 | $ | (43,847 | ) | $ | 1,600,153 | |||||
| Cumulative effect accounting adjustment (2) (unaudited) |
(1,131 | ) | — | (1,131 | ) | |||||||
| Net income (unaudited) |
8,445 | — | 8,445 | |||||||||
| Other comprehensive income, net of tax (unaudited) |
— | 55,267 | 55,267 | |||||||||
|
|
|
|
|
|
|
|||||||
| Balance at March 31, 2020 (unaudited) |
$ | 1,651,314 | $ | 11,420 | $ | 1,662,734 | ||||||
|
|
|
|
|
|
|
|||||||
| (1) | Represents adjustments needed to reflect the cumulative impact on retained earnings for reclassification of the income tax effect attributable to accumulated other comprehensive income, as a result of the Tax Cuts and Jobs Act (the “Tax Act”). Pursuant to the Company’s adoption of Accounting Standards Update 2018-02, the Company elected to reclassify amounts stranded in other comprehensive income to retained earnings. |
| (2) | Represents cumulative impact on retained earnings pursuant to the Company’s adoption of Accounting Standards Update 2016-02 Leases. The transition adjustment to the opening balance of retained earnings on January 1, 2020 amounted to $1.1 million, net of tax, related to an incremental accrued rent adjustment calculated as a result of electing the hindsight practical expedient (unaudited). |
The accompanying notes are an integral part of these consolidated financial statements.
F-6
Table of Contents
CONSOLIDATED STATEMENTS OF CASH FLOWS
| Three Months Ended March 31, | Year Ended December 31, | |||||||||||||||
| 2020 | 2019 | 2019 | 2018 | |||||||||||||
| (Unaudited) | ||||||||||||||||
| (In Thousands) | ||||||||||||||||
| Cash flows (used in) provided by operating activities |
||||||||||||||||
| Net income |
$ | 8,445 | $ | 32,965 | $ | 135,098 | $ | 122,727 | ||||||||
| Adjustments to reconcile net income to net cash provided by operating activities: |
||||||||||||||||
| Provision for loan losses |
28,600 | 3,000 | 6,300 | 15,100 | ||||||||||||
| Depreciation and amortization |
4,318 | 4,813 | 19,482 | 20,068 | ||||||||||||
| Deferred income tax expense (benefit) |
4,641 | 8,251 | 1,376 | (4,878 | ) | |||||||||||
| Amortization of premiums and discounts |
1,586 | 1,772 | 8,193 | 4,747 | ||||||||||||
| Right-of-use asset amortization |
3,615 | |
— |
|
— | — | ||||||||||
| Increase in cash surrender value of bank-owned life insurance |
(625 | ) | (552 | ) | (2,112 | ) | (15 | ) | ||||||||
| Net gain on sale of securities available for sale |
(122 | ) | (50 | ) | (2,016 | ) | (50 | ) | ||||||||
| Net gain on sale of mortgage loans held for sale |
(93 | ) | (50 | ) | (795 | ) | (397 | ) | ||||||||
| Mark-to-market on loans held for sale |
49 | — | — | — | ||||||||||||
| Proceeds from sale of loans held for sale |
51,997 | 24,502 | 208,658 | 108,788 | ||||||||||||
| Originations of loans held for sale |
(54,770 | ) | (24,607 | ) | (207,867 | ) | (106,059 | ) | ||||||||
| Change in: |
||||||||||||||||
| Trading securities |
309 | 34,412 | 51,938 | (6,108 | ) | |||||||||||
| (Increase) decrease in prepaid pension expense |
(30,473 | ) | (17,758 | ) | (11,031 | ) | 11,237 | |||||||||
| Loss on sale of premises and equipment |
— | — | 271 | 145 | ||||||||||||
| Other assets |
(61,071 | ) | (8,903 | ) | (31,298 | ) | 21,536 | |||||||||
| Other liabilities |
12,043 | (28,393 | ) | 19,680 | 18,168 | |||||||||||
|
|
|
|
|
|
|
|
|
|||||||||
| Net cash (used in) provided by operating activities |
(31,551 | ) | 29,402 | 195,877 | 205,009 | |||||||||||
|
|
|
|
|
|
|
|
|
|||||||||
| Cash flows used in investing activities |
||||||||||||||||
| Proceeds from sales of securities available for sale |
5,600 | 4,938 | 47,985 | 11,672 | ||||||||||||
| Proceeds from maturities and principal paydowns of securities available for sale |
56,021 | 38,300 | 204,065 | 162,425 | ||||||||||||
| Purchases of securities available for sale |
(70,301 | ) | — | (252,571 | ) | (167,584 | ) | |||||||||
| Proceeds from sale of Federal Home Loan Bank stock |
749 | 14,003 | 42,034 | 18,346 | ||||||||||||
| Purchases of Federal Home Loan Bank stock |
(527 | ) | (12,274 | ) | (33,102 | ) | (12,035 | ) | ||||||||
| Investments in low income housing projects |
(5,177 | ) | (528 | ) | (6,349 | ) | (3,270 | ) | ||||||||
| Contributions to other equity investments |
(137 | ) | — | (4,545 | ) | (146 | ) | |||||||||
| Distributions from equity investments |
13 | 19 | 62 | 226 | ||||||||||||
| Proceeds from life insurance policies |
— | — | — | 743 | ||||||||||||
| Net increase in loans |
(101,856 | ) | (67,843 | ) | (135,666 | ) | (637,518 | ) | ||||||||
| Acquisition of businesses, net of cash acquired |
— | — | — | (11,500 | ) | |||||||||||
| Proceeds from sale of portion of insurance agency business |
— | — | — | 571 | ||||||||||||
| Purchases of premises and equipment |
(1,029 | ) | (2,193 | ) | (7,187 | ) | (9,034 | ) | ||||||||
|
|
|
|
|
|
|
|
|
|||||||||
| Net cash used in investing activities |
(116,644 | ) | (25,578 | ) | (145,274 | ) | (647,104 | ) | ||||||||
|
|
|
|
|
|
|
|
|
|||||||||
| Cash flows provided by (used in) financing activities |
||||||||||||||||
| Net increase (decrease) in demand, savings, interest checking and money market investment deposit accounts |
762,049 | (118,703 | ) | 297,708 | 485,087 | |||||||||||
| Net (decrease) increase in certificate of deposits |
(4,430 | ) | (28,172 | ) | (145,809 | ) | 98,954 | |||||||||
| Net (decrease) increase in borrowed funds |
(203,968 | ) | 66,815 | (98,892 | ) | (192,218 | ) | |||||||||
| Contingent consideration paid |
(92 | ) | (263 | ) | (716 | ) | (1,173 | ) | ||||||||
| Payment of initial public offering costs |
(1,517 | ) | — | — | — | |||||||||||
|
|
|
|
|
|
|
|
|
|||||||||
| Net cash provided by (used in) financing activities |
552,042 | (80,323 | ) | 52,291 | 390,650 | |||||||||||
|
|
|
|
|
|
|
|
|
|||||||||
| Net increase (decrease) in cash, cash equivalents and restricted cash |
403,847 | (76,499 | ) | 102,894 | (51,445 | ) | ||||||||||
| Cash, cash equivalents and restricted cash at beginning of period |
362,602 | 259,708 | 259,708 | 311,153 | ||||||||||||
|
|
|
|
|
|
|
|
|
|||||||||
| Cash, cash equivalents and restricted cash at end of period |
$ | 766,449 | $ | 183,209 | $ | 362,602 | $ | 259,708 | ||||||||
|
|
|
|
|
|
|
|
|
|||||||||
| Supplemental disclosure of cash flow information |
||||||||||||||||
| Cash paid during the period for: |
||||||||||||||||
| Interest paid on deposits and borrowings |
$ | 6,908 | $ | 8,340 | $ | 34,217 | $ | 23,732 | ||||||||
| Income taxes |
5,361 | 5,785 | 31,308 | 29,731 | ||||||||||||
| Non-cash activities: |
||||||||||||||||
| Net increase in capital commitments relating to low income housing tax credit projects |
$ | 5,000 | $ | — | $ | 10,000 | $ | 13,000 | ||||||||
| Initial recognition of operating lease right-of-use assets upon adoption of Accounting Standards Update 2016-02 |
92,948 | — | — | — | ||||||||||||
| Initial recognition of operating lease liabilities upon adoption of Accounting Standards Update 2016-02 |
96,426 | — | — | — | ||||||||||||
The accompanying notes are an integral part of these consolidated financial statements.
F-7
Table of Contents
NOTES TO CONSOLIDATED FINANCIAL STATEMENTS
1. Summary of Significant Accounting Policies
Nature of Operations
Eastern Bank Corporation (the “Company”) is a Massachusetts-chartered mutual bank holding company. Through its wholly-owned subsidiaries, Eastern Bank (the “Bank”) and Eastern Insurance Group LLC, the Company provides a variety of banking, trust and investment services, and insurance services, through its full-service bank branches and insurance offices, located primarily in Eastern Massachusetts, southern and coastal New Hampshire and Rhode Island.
The activities of the Company are subject to the regulatory supervision of the Federal Reserve Board. The activities of the Bank are subject to the regulatory supervision of the Federal Deposit Insurance Corporation (“FDIC”) and the Consumer Financial Protection Bureau (“CFPB”). The Company and the activities of the Bank are also subject to various Massachusetts and New Hampshire business and banking regulations.
Basis of Presentation
The consolidated financial statements include the accounts of the Company, its wholly-owned subsidiaries and entities in which it holds a controlling financial interest through being the primary beneficiary or through holding a majority of the voting interest. All intercompany accounts and transactions have been eliminated in consolidation.
The Company’s consolidated financial statements have been prepared in conformity with accounting principles generally accepted in the United States (“GAAP”) as set forth by the Financial Accounting Standards Board (“FASB”) and its Accounting Standards Codification and Accounting Standards Update as well as the rules and interpretive releases of the Securities and Exchange Commission (“SEC”) under the authority of federal securities laws. In preparing the consolidated financial statements, management is required to make estimates and assumptions that affect the reported amounts of assets and liabilities as of the date of the balance sheets and income and expenses for the periods reported. Actual results could differ from those estimates based on changing conditions, including economic conditions and future events.
Material estimates that are particularly susceptible to change relate to the determination of the allowance for loan losses, valuation and fair value measurements, other-than-temporary impairment on investment securities, the liabilities for benefit obligations (particularly pensions), the provision for income taxes and impairment of goodwill and other intangibles.
Unaudited Interim Financial Information
The accompanying consolidated balance sheet as of March 31, 2020, the consolidated statements of income and comprehensive income, of changes in equity and of cash flows for the three months ended March 31, 2020 and 2019 are unaudited. The unaudited interim consolidated financial statements have been prepared on the same basis as the audited annual consolidated financial statements and, in the opinion of management, reflect all adjustments, which include only normal recurring adjustments, necessary for the fair statement of the Company’s financial position as of March 31, 2020 and the results of its operations and its cash flows for the three months ended March 31, 2020 and 2019. The financial data and other information disclosed in these notes related to the three months ended March 31, 2020 and 2019 are also unaudited. The results for the three months ended March 31, 2020 are not necessarily indicative of results to be expected for the year ending December 31, 2020, any other interim periods, or any future year or period.
Cash and Cash Equivalents
Cash and cash equivalents include cash on hand and amounts due from banks, Federal funds sold, and other short-term investments including restricted cash pledged, all of which have an original maturity of 90 days or less. Cash and cash equivalents includes $48.2 million, $22.2 million and $11.6 million of restricted cash pledged as collateral at March 31, 2020 (unaudited) and December 31, 2019 and 2018, respectively, which for purposes of the Company’s consolidated statements of cash flows, is included in cash, cash equivalents and restricted cash.
Securities
Debt securities are classified at the time of purchase as either “trading”, “available for sale” or “held to maturity”. Equity securities are measured at fair value with changes in the fair value recognized through net income. Debt securities that
F-8
Table of Contents
EASTERN BANK CORPORATION
NOTES TO CONSOLIDATED FINANCIAL STATEMENTS
are bought and held principally for the purpose of resale in the near terms are classified as trading securities and recorded at fair value, with subsequent changes in fair value included in net income. Debt securities that the Company has the positive intent and the ability to hold to maturity are classified as held to maturity securities and recorded at amortized cost.
Debt securities not classified as either trading or held to maturity are classified as available for sale and recorded at fair value, with changes in fair value excluded from net income and reported in other comprehensive income, net of related tax. Amortization of premiums and accretion of discounts are computed using the effective interest rate method.
Management evaluates impaired securities for other-than-temporary impairment (“OTTI”) at least on a quarterly basis, and more frequently when economic or market concerns warrant such evaluation. Consideration is given to the length of time and the extent to which the fair value has been less than cost, current market conditions, the financial condition and near-term prospects of the issuer, performance of collateral underlying the securities, the ratings of the individual securities, the interest rate environment, the Company’s intent to sell the security or whether it is more likely than not that the Company will be required to sell the debt security before its anticipated recovery, as well as other qualitative factors.
If a decline in fair value below the amortized cost basis of an investment is judged to be other than temporary, the investment is written down to fair value. The portion of the impairment related to credit losses is included in net income, and the portion of the impairment related to other factors is included in other comprehensive income. Gains and losses on sales of securities are recognized at the time of sale on the specific-identification basis.
Loans
Loans are reported at their principal amount outstanding, net of deferred loan fees and any unearned discount or unamortized premium for acquired loans. Unearned discount and unamortized premium are accreted and amortized, respectively, to interest and dividend income on a basis that results in level rates of return over the terms of the loans. For originated loans, origination fees and related direct incremental origination costs are offset, and the resulting net amount is deferred and amortized over the life of the related loans using the interest method, assuming a certain level of prepayments. When loans are sold or repaid, the unamortized fees and costs are recorded to interest and dividend income. Interest income on loans is accrued based upon the daily principal amount outstanding except for loans on nonaccrual status. For acquired loans with no signs of credit deterioration at acquisition, interest income is also accrued based upon the daily principal amount outstanding, adjusted further by the accretion of any discount or amortization of any premium associated with the loan.
Nonperforming Loans (“NPLs”)
Nonaccrual Loans
Interest accruals are generally discontinued when management has determined that the borrower may be unable to meet contractual obligations and/or when loans are 90 days or more in arrears. Exceptions may be made if management believes that collateral held by the Company is clearly sufficient and in full satisfaction of both principal and interest or the loan is accounted for as a purchased credit-impaired loan. When a loan is placed on nonaccrual, all interest previously accrued but not collected is reversed against current period income and amortization of deferred loan fees is discontinued. Interest received on nonaccrual loans is either applied against principal or reported as income according to management’s judgment as to the collectability of principal. Nonaccrual loans may be returned to an accrual status when principal and interest payments are no longer delinquent, and the risk characteristics of the loan have improved to the extent that there no longer exists a concern as to the collectability of principal and interest. Loans are considered past due based upon the number of days delinquent according to their contractual terms. Nonaccrual loans and loans that are more than 90 days past due but still accruing interest are considered NPLs.
Impaired Loans
Impaired loans consist of all loans for which management has determined it is probable the Company will be unable to collect all amounts due according to the contractual terms of the loan agreements. Factors considered by
F-9
Table of Contents
EASTERN BANK CORPORATION
NOTES TO CONSOLIDATED FINANCIAL STATEMENTS
management in determining impairment include payment status, collateral value, and the probability of collecting scheduled principal and interest payments when due. The Company measures impairment of loans using a discounted cash flow method, the loan’s observable market price, or the fair value of the collateral if the loan is collateral dependent.
Troubled Debt Restructured (“TDR”) Loans
In cases where a borrower experiences financial difficulties and the Company makes certain concessionary modifications to contractual terms, the loan is classified as a TDR. Modifications may include adjustments to interest rates, extensions of maturity, consumer loans where the borrower’s obligations have been effectively discharged through Chapter 7 Bankruptcy and the borrower has not reaffirmed the debt to the Company, and other actions intended to minimize economic loss and avoid foreclosure or repossession of collateral. All TDR loans are considered impaired and therefore are subject to a specific review for impairment loss. The impairment analysis discounts the present value of the anticipated cash flows by the loan’s contractual rate of interest in effect prior to the loan’s modification or the fair value of collateral if the loan is collateral dependent. The amount of impairment loss, if any, is recorded as a specific loss allocation to each individual loan in the allowance for loan losses. Commercial loans (commercial and industrial, commercial real estate, commercial construction, and business banking loans) and residential loans that have been classified as TDRs and which subsequently default are reviewed to determine if the loan should be deemed collateral dependent. In such an instance, any shortfall between the value of the collateral and the book value of the loan is determined by measuring the recorded investment in the loan against the fair value of the collateral less costs to sell.
The Company’s policy is to retain any restructured loans, which are on nonaccrual status prior to being modified, on nonaccrual status for approximately six months subsequent to being modified before the Company considers its return to accrual status. If the restructured loan is on accrual status prior to being modified, the Company reviews it to determine if the modified loan should remain on accrual status.
Purchased Credit-impaired (“PCI”) Loans
At acquisition, loans that have evidence of deterioration in credit quality since origination and for which it is probable that all contractually required payments will not be collected are initially recorded at fair value with no valuation allowance. Such loans are deemed to be PCI loans. Under the accounting model for PCI loans, the excess of cash flows expected to be collected over the carrying amount of the loans, referred to as the “accretable yield,” is accreted into interest income over the life of the loans using the effective yield method. Accordingly, PCI loans are not subject to classification as nonaccrual in the same manner as originated loans. Rather, acquired loans are considered to be accruing loans because their interest income relates to the accretable yield recognized and not to contractual interest payments at the loan level. The difference between contractually required principal and interest payments and the cash flows expected to be collected, referred to as the “nonaccretable difference,” includes estimates of both the impact of prepayments and future credit losses expected to be incurred over the life of the loans.
The estimate of cash flows expected to be collected is regularly re-assessed subsequent to acquisition. These re-assessments involve updates, as necessary, of the key assumptions and estimates used in the initial estimate of fair value. Generally speaking, expected cash flows are affected by:
| • | Changes in the expected principal and interest payments over the estimated life – Changes in expected cash flows may be driven by the credit outlook and actions taken with borrowers. Changes in expected future cash flows resulting from loan modifications are included in the assessment of expected cash flows. |
| • | Change in prepayment assumptions – Prepayments affect the estimated life of the loans, which may change the amount of interest income expected to be collected. |
| • | Change in interest rate indices for variable rate loans – Expected future cash flows are based, as applicable, on the variable rates in effect at the time of the assessment of expected cash flows. |
A decrease in expected cash flows in subsequent periods may indicate that the loan is impaired which would require the establishment of an allowance for loan losses by a charge to the provision for loan losses. An increase in expected
F-10
Table of Contents
EASTERN BANK CORPORATION
NOTES TO CONSOLIDATED FINANCIAL STATEMENTS
cash flows in subsequent periods serves, first, to reduce any previously established allowance for loan losses by the increase in the present value of cash flows expected to be collected, and results in a recalculation of the amount of accretable yield for the loan. The adjustment of accretable yield due to an increase in expected cash flows is accounted for as a change in estimate. The additional cash flows expected to be collected are reclassified from the nonaccretable difference to the accretable yield, and the amount of periodic accretion is adjusted accordingly over the remaining life of the loans.
A PCI loan may be resolved either through receipt of payment (in full or in part) from the borrower, the sale of the loan to a third party, or foreclosure of the collateral. For PCI loans accounted for on an individual loan basis and resolved directly with the borrower, any amount received from resolution in excess of the carrying amount of the loan is recognized and reported within interest income.
A refinancing or modification of a PCI loan accounted for individually is assessed to determine whether the modification represents a TDR. If the loan is considered to be a TDR, it will be included in the total impaired loans reported by the Company. The loan will continue to recognize interest income based upon the excess of cash flows expected to be collected over the carrying amount of the loan.
Allowance for Loan Losses
The allowance for loan losses is established to provide for probable losses incurred in the Company’s loan portfolio at the balance sheet date and is established through a provision for loan losses charged to net income. The allowance is based on management’s assessment of many factors, including the risk characteristics of the loan portfolio, current economic conditions, and trends in loan delinquencies and charge-offs. Charge-offs, net of recoveries, are charged directly to the allowance. Commercial and residential loans are charged-off in the period in which they are deemed uncollectible. Delinquent loans in these product types are subject to ongoing review and analysis to determine if a charge-off in the current period is appropriate. For consumer finance loans, policies and procedures exist that require charge-off consideration upon a certain triggering event depending on the product type. Charge-off triggers include: 120 days delinquent for automobile, home equity, and other consumer loans with the exception of cash reserve loans for which the trigger is 150 days delinquent; death of the borrower; or chapter 7 bankruptcy. In addition to those events, the charge-off determination includes other loan quality indicators, such as collateral position and adequacy or the presence of other repayment sources.
The allowance for loan losses is evaluated on a regular basis by management. While management uses current information in establishing the allowance for losses, future adjustments to the allowance may be necessary if economic conditions or conditions relative to borrowers differ substantially from the assumptions used in making the evaluation. Management uses a methodology to systematically estimate the amount of loss incurred in the portfolio. The Company’s commercial real estate, commercial and industrial, commercial construction and business banking loans are evaluated using a loan rating system, historical losses and other factors which form the basis for estimating incurred losses. Portfolios of more homogeneous populations of loans, including residential mortgages and consumer loans, are analyzed as groups taking into account delinquency ratios, historical loss experience and charge-offs.
The allowance consists of specific and general components. The specific component consists of reserves for impaired loans (defined as those where management has determined it is probable it will not collect all payments when due), typically classified as either doubtful or substandard. For impaired loans, an allowance is established when the discounted cash flows (or collateral value or observable market price) of the loan is lower than the carrying value of the loan. The general component covers non-impaired, non-classified loans and is based on the Company’s historical loss experience adjusted for qualitative factors, including internal infrastructure factors, external macroeconomic factors, internal portfolio factors and external industry data, all customized to loan pools that include loans with similar characteristics.
In the ordinary course of business, the Company enters into commitments to extend credit and standby letters of credit. Such financial instruments are recorded in the financial statements when they become payable. The credit risk associated with these commitments is evaluated in a manner similar to the allowance for loan losses. The reserve for unfunded lending commitments is included in other liabilities in the balance sheet.
Additionally, various regulatory agencies, as an integral part of the Company’s examination process, periodically assess the appropriateness of the allowance for loan losses and may require the Company to increase its provision for loan losses or recognize further loan charge-offs, in accordance with U.S. GAAP.
F-11
Table of Contents
EASTERN BANK CORPORATION
NOTES TO CONSOLIDATED FINANCIAL STATEMENTS
Mortgage Banking Activities
Mortgage loans held for sale to the secondary market are carried at the lower of cost or estimated market value on an individual loan basis. The Company enters into commitments to fund residential mortgage loans with an offsetting forward commitment to sell them in the secondary markets in order to mitigate interest rate risk. Gains or losses on sales of mortgage loans are recognized in the consolidated statements of income at the time of sale. Interest income is recognized on loans held for sale between the time the loan is funded and the loan is sold. Direct loan origination costs and fees are deferred upon origination and are recognized in the consolidated statements of income on the date of sale.
Other Real Estate Owned (“OREO”)
OREO consists of properties and other assets acquired through foreclosure proceedings or acceptance of a deed in lieu of foreclosure. OREO is recorded in other assets in consolidated balance sheets, on an individual asset basis at the lower of cost or fair value, less estimated selling costs. The Company relies primarily on third-party valuation information from certified appraisers and values are generally based upon recent appraisals of the underlying collateral, brokers’ opinions based upon recent sales of comparable properties, estimated equipment auction or liquidation values, income capitalization, or a combination of income capitalization and comparable sales. As of March 31, 2020 (unaudited) and December 31, 2019 and 2018, the Company’s OREO was immaterial.
Federal Home Loan Bank Stock
The Company, as a member of the Federal Home Loan Bank (“FHLB”) of Boston, is required to maintain an investment in capital stock of the FHLB. Based on redemption provisions, the stock has no quoted market value and is carried at cost.
Premises and Equipment
Land is carried at cost. Buildings, leasehold improvements and equipment are stated at cost less accumulated depreciation and amortization. Depreciation is computed using the straight-line method over the estimated useful lives of the related assets. Leasehold improvements are amortized over the shorter of the lease terms or the estimated lives of the improvements. Expected lease terms include lease options to the extent that the exercise of such options is reasonably assured.
Banking premises and equipment held for sale are carried at the lower of cost or estimated fair value, less estimated costs to sell.
Goodwill and Other Intangible Assets
Acquisitions of businesses are accounted for using the acquisition method of accounting. Accordingly, the net assets of the companies acquired are recorded at their fair values at the date of acquisition. Goodwill represents the excess of purchase price over the fair value of net assets acquired. Other intangible assets represent acquired assets that lack physical substance but can be distinguished from goodwill because of contractual or other legal rights, or because the asset is capable of being sold or exchanged either on its own, or in combination with a related contract, asset, or liability.
The Company evaluates goodwill for impairment at least annually, during the fourth quarter, or more often if warranted, using a quantitative impairment approach. The quantitative impairment test compares the book value to the fair value of each reporting unit. If the book value exceeds the fair value, an impairment is charged to net income. Management has identified two reporting units for purposes of testing goodwill for impairment: the banking business and the insurance agency business.
Other intangible assets, all of which are definite-lived, are stated at cost less accumulated amortization. The Company evaulates other intangible assets for impairment whenever events or changes in circumstances indicate that the carrying value of the asset may not be fully recovered. Any impairment losses are charged to net income. The Company amortizes other intangible assets over their respective estimated useful lives. The estimated useful lives of core deposit identifiable intangible assets fall within a range of seven to ten years and the estimated useful life of customer lists from
F-12
Table of Contents
EASTERN BANK CORPORATION
NOTES TO CONSOLIDATED FINANCIAL STATEMENTS
insurance agency acquisitions is ten years. The estimated useful life of non-compete agreements resulting from insurance agency acquisitions are dependent upon the terms of the agreement. The Company reassesses the useful lives of other intangible assets at least annually, or more frequently based on specific events or changes in circumstances.
Retirement Plans
The Company provides benefits to its employees and executive officers through various retirement plans, including a postretirement defined benefit plan, a defined benefit supplemental executive retirement plan, a defined contribution plan, a benefit equalization plan, and an outside director retainer continuance plan.
The postretirement benefits are provided through membership in the Savings Banks Employees’ Retirement Association (“SBERA”). The plan is a noncontributory, defined benefit plan (“Defined Benefit Plan”). Benefits become fully vested after three years or eligible service for individuals employed on or before October 31, 1989. Individuals employed subsequent to October 31, 1989 become fully vested after five years of eligible service. The annual contribution to the Defined Benefit Plan is based upon standards established by the Pension Protection Act. The contribution is based on an actuarial method intended to provide not only for benefits attributable to service to date, but also for those expected to be earned in the future.
The Company also has an unfunded Defined Benefit Supplemental Executive Retirement Plan (“DB SERP”) that provides certain retired and currently employed officers with defined pension benefits in excess of qualified plan limits imposed by U.S. federal tax law. The DB SERP has a plan year end of December 31.
The Company also has an unfunded Benefit Equalization Plan (“BEP”) to provide retirement benefits to certain employees whose retirement benefits under the qualified pension plan are limited per the Internal Revenue Code. The BEP has a plan year end of October 31.
The Company also has an unfunded Outside Directors’ Retainer Continuance Plan that provides pension benefits to outside directors who retire from service. The Outside Directors’ Retainer Continuance Plan has a plan year end of December 31.
Plan assets are invested in various investment funds and held at fair value which generally represents observable market prices. Pension liability is determined based on the actuarial cost method factoring in assumptions such as salary increases, expected retirement date, mortality rate, employee turnover and future increases in healthcare costs. The actuarial cost method used to compute the pension liabilities and related expense is the projected unit credit method. The projected benefit obligation is principally determined based on the present value of the projected benefit distributions at an assumed discount rate (which is the rate at which the projected benefit obligation could be effectively settled as of the measurement date). The discount rate which is utilized is determined using the spot rate approach whereby the individual spot rates on the Financial Times and Stock Exchange (“FTSE”) above-median yield curve are applied to each corresponding year’s projected cash flow used to measure the respective plan’s service cost and interest cost. Periodic pension expense (or income) includes service costs, interest costs based on the assumed discount rate, the expected return on plan assets, if applicable, based on an actuarially derived market-related value and amortization of actuarial gains and losses. Net period benefit cost excluding service cost is included as a separate line item in noninterest expense in the consolidated statements of income. Service cost is included in salaries and employee benefits in the consolidated statements of income. The amortization of actuarial gains and losses is determined using the 10% corridor minimum amortization approach and is taken over the average remaining future service of the plan participants. The overfunded or underfunded status of the plans is recorded as an asset or liability on the consolidated balance sheets, with changes in that status recognized through other comprehensive income, net of related taxes. Funded status represents the difference between the projected benefit obligation of the plan and the market value of the plan’s assets.
Employee Tax Deferred Incentive Plan
The Company has an employee tax deferred incentive plan (“401(k)”) under which the Company makes voluntary contributions within certain limitations. All employees who meet specified age and length of service requirements are eligible to participate in the 401(k) plan. The amount contributed by the Company is included in salaries and employee benefits expense.
F-13
Table of Contents
EASTERN BANK CORPORATION
NOTES TO CONSOLIDATED FINANCIAL STATEMENTS
Defined Contribution Supplemental Executive Retirement Plan
The Company has a defined contribution supplemental executive retirement plan (“DC SERP”), which allows certain senior officers to earn benefits calculated as a percentage of their compensation. The participant benefits are adjusted based upon a deemed investment performance of measurement funds selected by the participant. These measurement funds are for tracking purposes and are used only to track the performance of a mutual fund, market index, savings instrument, or other designated investment or portfolio of investments.
Deferred Compensation
The Company sponsors three plans which allow for elective compensation deferrals by directors, trustees, and certain senior-level employees. Each plan allows its participants to designate deemed investments for deferred amounts from certain options which include diversified choices, such as exchange traded funds, mutual funds, and a deemed fund yielding the highest rate paid by the Company on deposit accounts each month. Portfolios with various risk profiles are available to participants with the approval of the Compensation Committee. The Company purchases and sells investments which track the deemed investment choices, so that it has available funds to meet its payment liabilities. Deferred amounts, adjusted for deemed investment performance, are paid at the time of a participant designated date or event, such as separation from service, death, or disability. The total amounts due to participants under these plans are included in other liabilities on the Company’s consolidated balance sheets.
Variable Interest Entities (“VIE”) and Voting Interest Entities (“VOE”)
The Company is involved in the normal course of business with various types of special purpose entities, some of which meet the definition for VIEs and VOEs.
VIEs are entities that possess any of the following characteristics: 1) the total equity investment at risk is insufficient to permit the legal entity to finance its activities without additional subordinated financial support from other parties; 2) as a group, the holders of the equity investment at risk lack any of the characteristics of a controlling financial interest; or 3) the equity investors’ voting rights are not proportional to the economics, and substantially all of the activities of the entity either involve or are conducted on behalf of an investor that has disproportionally few voting rights. The Company consolidates entities deemed to be VIEs when it, or a wholly-owned subsidiary, is determined to be the primary beneficiary. The primary beneficiary analysis is a qualitative analysis based on power and economics. An enterprise has a controlling financial interest in a VIE if it has both 1) the power to direct the activities of a VIE that most significantly impact the VIE’s economic performance and 2) the obligation to absorb losses of the VIE that potentially could be significant to the VIE or the right to receive benefits from the VIE that potentially could be significant to the VIE.
VOEs are entities in which the total equity investment at risk is sufficient to enable the entity to finance itself independently and provides the equity holders with the obligation to absorb losses, the right to receive residual returns and the right to make decisions about the entity’s activities. The Company consolidates VOEs when it, or a wholly-owned subsidiary, holds the majority of the voting interest in the VOE.
Rabbi Trusts
The Company established rabbi trusts to meet its obligations under certain executive non-qualified retirement benefits and deferred compensation plans and to mitigate the expense volatility of the aforementioned retirement plans. The rabbi trusts are considered VIEs as the equity investment at risk is insufficient to permit the trust to finance its activities without additional subordinated financial support from the Company. The Company is considered the primary beneficiary of the rabbi trusts as it has the power to direct the activities of the rabbi trusts that significantly affect the rabbi trust’s economic performance and it has the obligation to absorb losses of the rabbi trusts that could potentially be significant to the rabbi trusts by virtue of its contingent call options on the rabbi trust’s assets in the event of the Company’s bankruptcy. As the primary beneficiary of these VIEs, the Company consolidates the rabbi trust investments, executive retirement benefits liabilities and deferred compensation plan liabilities. These rabbi trust investments consist primarily of cash and cash equivalents, U.S. government agency obligations, equity securities, mutual funds and other exchange-traded funds, and are recorded at fair value. Changes in fair value are recorded in noninterest income in the statements of income.
F-14
Table of Contents
EASTERN BANK CORPORATION
NOTES TO CONSOLIDATED FINANCIAL STATEMENTS
Tax Credit Investment
Through a wholly-owned subsidiary, the Company is the sole member of a tax credit investment company through which it consolidates a community development entity (“CDE”) that is considered a VIE. The CDE is considered a VIE because as a group, the holders of the equity investment at risk lack any of the characteristics of a controlling financial interest. The tax credit investment company is considered the primary beneficiary of the CDE as it has the power to direct the activities of a VIE that most significantly impact the VIEs economic performance and the obligation to absorb losses of and the right to receive benefits from the VIE that potentially could be significant to the VIE.
Bank Owned Life Insurance
The Company holds bank-owned life insurance on the lives of certain participating executives, primarily as a result of mergers and acquisitions of certain insurance agencies. The amount reported as an asset on the balance sheet is the sum of the cash surrender values reported to the Company by the various insurance carriers. Certain policies are split-dollar life insurance policies whereby the Company recognizes a liability for the postretirement benefit related to the arrangement. This postretirement benefit is included in other liabilities on the balance sheet.
Income Taxes
The Company accounts for income taxes under the asset and liability method. Under this method, deferred tax assets and liabilities are established for the temporary differences between the accounting basis and the tax basis of the Company’s assets and liabilities at enacted tax rates expected to be in effect when the amounts related to such temporary differences are realized or settled. A valuation allowance is established if it is considered more likely than not that all or a portion of the deferred tax assets will not be realized. Interest and penalties paid on the underpayment of income taxes are classified as income tax expense.
The Company periodically evaluates the potential uncertainty of its tax positions as to whether it is more likely than not its position would be upheld upon examination by the appropriate taxing authority. A tax position that meets the more-likely-than-not recognition threshold is measured to determine the amount of benefit to recognize in the consolidated financial statements. The tax position is measured at the largest amount of benefit that is greater than 50% likely of being realized upon settlement.
Low Income Housing Tax Credits and Other Tax Credit Investments
As part of its community reinvestment initiatives, the Company invests in qualified affordable housing projects and other tax credit investment projects. The Company receives low-income housing tax credits, investment tax credits, rehabilitation tax credits, solar tax credits and other tax credits as a result of its investments in these limited partnership investments.
The Company accounts for its investments in qualified affordable housing projects using the proportional amortization method and amortizes the initial cost of the investment in proportion to the tax credits and other tax benefits allocated to the Company. The amortization of the excess of the carrying amount of the investment over its estimated residual value is included as a component of income tax expense. At investment inception, the Company records a liability for the committed amount of the investment; this liability is reduced as contributions are made. There were no commitments outstanding for these projects as of March 31, 2020 (unaudited) and December 31, 2019 or 2018.
The Company evaluates investments in tax credit investment companies for consolidation based on the variable or voting interest entity guidance, as appropriate. Other tax credit investment projects are accounted for using either the cost method or equity method.
Advertising Costs
All advertising costs are expensed in the period in which they are incurred. Advertising costs were not significant for any periods presented.
F-15
Table of Contents
EASTERN BANK CORPORATION
NOTES TO CONSOLIDATED FINANCIAL STATEMENTS
Insurance Commissions
Through Eastern Insurance Group LLC, the Company acts as an agent in offering property, casualty, and life and health insurance to both consumer and commercial customers. Insurance commissions consist of the several types of insurance revenue related to insurance policy sales. The Company earns a fixed commission on the sale of these insurance products and services and may occasionally earn a bonus commission if certain volume thresholds are met. The Company recognizes insurance commission revenues as performance obligations of underlying agreements are satisfied, which is typically the effective date of the insurance policy. Additionally, for certain types of insurance products, the Company may earn and recognize revenue related to the annual residual commissions commensurate with annual premiums being paid. The Company’s contracts typically contain a single, material distinct performance obligation, therefore the Company does not estimate standalone selling prices as the entire transaction price is allocated to the single performance obligation.
The Company also earns profit sharing revenue from insurers whom they place into business. Such revenues are considered performance bonuses based upon certain performance metrics. This amount can vary from period to period and is difficult to predict. Therefore, the Company does not recognize revenue until it has concluded that a significant revenue reversal will not occur in future periods.
Trust Operations
The Bank is a full-service trust company that provides a wide range of trust services to customers that includes managing customer investments, safekeeping customer assets, supplying disbursement services, and providing other fiduciary services. Trust assets held in a fiduciary or agency capacity for customers are not included in the accompanying consolidated balance sheets as they are not assets of the Company. The fees charged are variable based on the Company’s responsibility, ranging from 20 basis points for general custodial services to 125 basis points for comprehensive management services. Revenue from administrative and management activities associated with these assets is recognized as performance obligations of underlying agreements are satisfied.
Derivative Financial Instruments
Derivative instruments are carried at fair value in the Company’s financial statements. The accounting for changes in the fair value of a derivative instrument is determined by whether it has been designated and qualifies as part of a hedging relationship, and further, by the type of hedging relationship. At the inception of a hedge, the Company documents certain items, including, but not limited to, the following: the relationship between hedging instruments and hedged items, the Company’s risk management objectives, hedging strategies, and the evaluation of hedge transaction effectiveness. Documentation includes linking all derivatives that are designated as hedges to specific assets or liabilities on the balance sheet or to specific forecasted transactions.
The Company’s derivative instruments that are designated and qualify for hedge accounting are classified as cash flow hedges (i.e., hedging the exposure to variability in expected future cash flows associated with a recognized asset or liability, or a forecasted transaction). As such, changes in the fair value of the designated hedging instrument that is included in the assessment of hedge effectiveness are recorded in other comprehensive income and reclassified into net income in the same period or periods during which the hedged forecasted transaction affects net income. Such reclassifications shall be presented in the same income statement line item as the net income effect of the hedged item. If the hedging instrument is not highly effective at achieving offsetting cash flows attributable to the revised contractually specified interest rate(s), hedge accounting will be discontinued. At that time, accumulated other comprehensive income would be frozen and amortized, as long as the forecasted transactions are still probable of occurring.
The Company’s derivative instruments not designated as hedging instruments are recorded at fair value and changes in fair value are recognized in other noninterest income. Derivative instruments not designated as hedging instruments include interest rate swaps, foreign exchange contracts offered to commercial customers to assist them in meeting their financing and investing objectives for their risk management purposes, and risk participation agreements entered into as financial guarantees of performance on customer-related interest rate swap derivatives. The interest rate and foreign exchange risks associated with customer interest rate swaps and foreign exchange contracts are mitigated by entering into similar derivatives having offsetting terms with correspondent bank counterparties.
F-16
Table of Contents
EASTERN BANK CORPORATION
NOTES TO CONSOLIDATED FINANCIAL STATEMENTS
All derivative financial instruments eligible for clearing are cleared through the Chicago Mercantile Exchange (the “CME”). In accordance with its amended rulebook, CME legally characterizes variation margin payments made to and received from the CME as settlement of derivatives rather than as collateral against derivatives.
Fair Value Measurements
ASC 820 “Fair Value Measurements and Disclosures” defines fair value as the price that would be received to sell an asset or paid to transfer a liability in an orderly transaction between market participants on the measurement date. A fair value measurement assumes that the transaction to sell the asset or transfer the liability occurs in the principal market for the asset or liability or, in the absence of a principal market, the most advantageous market. An orderly transaction is a transaction that assumes exposure to the market for a period prior to the measurement date. Market participants are buyers and sellers in the principal market that are independent, knowledgeable, able and willing to transact. ASC 820 also establishes a fair value hierarchy that prioritizes the inputs to valuation techniques used to measure fair value. The hierarchy gives the highest priority to unadjusted quoted prices in active markets for identical assets or liabilities (Level 1 measurements), and the lowest priority to unobservable inputs (Level 3 measurements). The three levels of the fair value hierarchy are described below:
Level 1 – Inputs are quoted prices (unadjusted) in active markets for identical assets or liabilities that the reporting entity has the ability to access at the measurement date.
Level 2 – Valuations based on quoted prices in markets that are not active or for which all significant inputs are observable, either directly or indirectly.
Level 3 – Prices or valuations that require unobservable inputs that reflect the Company’s own assumptions that are significant to the fair value measurement.
To the extent that valuation is based on models or inputs that are less observable or unobservable in the market, the determination of fair value requires more judgment. Accordingly, the degree of judgment exercised by the Company in determining fair value is greatest for instruments categorized in Level 3. A financial instrument’s level within the fair value hierarchy is based on the lowest level of any input that is significant to the fair value measurement.
Segment Reporting
An operating segment is defined as a component of a business for which separate financial information is available that is evaluated regularly by the chief operating decision-maker (“CODM”) in deciding how to allocate resources and evaluate performance. The Company has determined that its CODM is its President and Chief Executive Officer. The Company has two reportable segments: its banking business, which consists of a full range of banking lending, savings, and small business offerings, and its wealth management and trust operations; and its insurance agency business, which consists of insurance-related activities.
Deferred Offering Costs
The Company capitalizes certain legal, professional, accounting and other third-party fees that are directly associated with in-process stock offerings as deferred offering costs until such offering is consummated. After consummation of the stock offerings, these costs are recorded in equity as a reduction of additional paid-in capital generated as a result of the offering. Should the in-process stock offerings be abandoned, the deferred offering costs will be expensed immediately as a charge to net income. The Company recorded deferred offering costs as of March 31, 2020 (unaudited) and December 31, 2019 of $1.9 million and $0.3 million, respectively. There were no deferred offering costs as of December 31, 2018.
Recent Accounting Pronouncements
Relevant standards that were recently issued but not yet adopted as of December 31, 2019:
In June 2016, FASB issued ASU 2016-13, Financial Instruments–Credit Losses on Financial Instruments and relevant amendments (Topic 326) (“ASU 2016-13”). This update was created to replace the current GAAP method of
F-17
Table of Contents
EASTERN BANK CORPORATION
NOTES TO CONSOLIDATED FINANCIAL STATEMENTS
calculating credit losses Specifically, the standard replaces the existing incurred loss impairment guidance by requiring immediate recognition of expected credit losses. For financial assets carried at amortized cost that are held at the reporting date (including trade and other receivables, loans and commitments, held-to-maturity debt securities and other financial assets). Credit losses are measured based on historical experience, current conditions and reasonable supportable forecasts. The standard also amends existing impairment guidance for available for-sale securities, in which credit losses will be recorded as an allowance versus a write-down of the amortized cost basis of the security. It will also allow for a reversal of impairment loss when the credit of the issuer improves. The guidance requires a cumulative effect of the initial application to be recognized in retained earnings at the date of initial application.
In November 2018, the FASB issued ASU 2018-19, Codification Improvements to Topic 326, Financial Instruments – Credit Losses. The amendments in Update No. 2018-19 was intended to clarify that receivables arising from operating leases are not within the scope of Subtopic 326-20. Instead, impairment of receivables arising from operating leases should be accounted for in accordance with Topic 842, Leases. In November 2019, FASB issued ASU 2019-11, Codification Improvements to Topic 326, Financial Instruments – Credit Losses. This update require entities to include expected recoveries of the amortized cost basis previously written off or expected to be written off in the valuation account for purchased financial assets with credit deterioration. In addition the amendments in this update clarify and improve various aspects of the guidance for ASU 2016-13.
For public entities that meet the definition of an SEC filer (excluding smaller reporting entities) the guidance is effective for annual reporting periods beginning after December 15, 2019. Early adoption is permitted for all entities as of the fiscal years beginning after December 15, 2018. For all other entities, the guidance is effective for annual reporting periods beginning after December 15, 2022, including interim periods within those fiscal years.
The Company anticipates to early adopt this standard during the year ending on December 31, 2021 and is currently assessing the impact of the adoption of this standard on its consolidated financial statements. To date, the Company has been assessing the key differences and gaps between its current allowance methodology and model and those it is considering using upon adoption. This has included assessing the adequacy of existing loss data, developing models for default and loss estimates, and finalizing vendor selection. While currently unable to reasonably estimate the impact of adopting this ASU, it is expected that the impact of adoption will be influenced by the composition, characteristics and quality of the loan and securities portfolios as well as the prevailing economic conditions and forecasts as of the adoption date.
In October 2018, the FASB issued ASU 2018-16, Derivatives and Hedging (Topic 815): Inclusion of the Secured Overnight Financing Rate (SOFR) Overnight Index Swap (OIS) Rate as a Benchmark Interest Rate for Hedge Accounting Purposes (“ASU 2018-16”). This update permits the use of the Overnight Index Swap (“OIS”) rate based on the Secured Overnight Financing Rate (“SOFR”) as a U.S. benchmark interest rate for hedge accounting purposes under Topic 815. For public companies, the amendments were effective for fiscal years beginning after December 15, 2018, and interim periods within those fiscal years. For nonpublic companies, the amendments in this update are effective for fiscal years beginning after December 15, 2019, and interim periods within those years. The amendments should be adopted on a prospective basis for qualifying new or re-structured hedging relationships entered into on or after the date of adoption. The Company will adopt this standard on the nonpublic company effective date and is in the process of assessing the impact of this standard in conjunction with its efforts to review and address its loans that are currently priced off LIBOR indexes and are tied to existing interest rate hedges.
In August 2018, the FASB issued ASU 2018-13, Fair Value Measurement (Topic 820) Disclosure Framework—Changes to the Disclosure Requirements for Fair Value Measurement (“ASU 2018-13”). This update modifies the disclosure requirements related to the fair value measurements in Topic 820. Specifically, this update amends disclosure around changes in unrealized gains and losses, the range and weighted average of significant unobservable inputs used in Level 3 fair value measurements and the description of measurement uncertainty. ASU 2018-13 is effective for fiscal years, and interim periods within those fiscal years, beginning after December 15, 2019 for both public and nonpublic companies and early adoption is permitted. The Company expects the adoption of ASU 2018-13 to not have a significant impact, if any, on its consolidated financial statements.
In August 2018, the FASB issued ASU 2018-14, Compensation—Retirement Benefits—Defined Benefit Plans—General (Subtopic 715-20) Disclosure Framework—Changes to the Disclosure Requirements for Defined Benefit Plans (“ASU 2018-14”). This update modifies the disclosure requirements for employers that sponsor defined benefit pension and/or other postretirement benefit plans. The guidance eliminates requirements for certain disclosures that are no longer
F-18
Table of Contents
EASTERN BANK CORPORATION
NOTES TO CONSOLIDATED FINANCIAL STATEMENTS
considered cost beneficial and requires new ones that the FASB considers pertinent. For public companies, ASU 2018-14 is effective for fiscal years ending after December 15, 2020. For nonpublic companies, ASU 2018-14 is effective for fiscal years ending after December 15, 2021. Early adoption is permitted. The Company will adopt this standard on the nonpublic company effective date. The Company expects the adoption of this standard will not have a material impact on its consolidated financial statements.
In August 2018, the FASB issued ASU 2018-15, Intangibles–Goodwill and Other–Internal-use software (Subtopic 350-40): Customer’s Accounting for Implementation Costs Incurred in a Cloud Computing Arrangement That is a Service Contract (“ASU 2018-15”).This update addresses accounting for fees paid by a customer for implementation, set-up and other upfront costs incurred in a cloud computing arrangement that is hosted by the vendor (i.e., a service contract). The new guidance aligns treatment for capitalization of implementation costs with guidance on internal-use software. For public entities, the guidance is effective for annual reporting periods beginning after December 15, 2019. For nonpublic entities, the guidance is effective for annual reporting periods beginning after December 15, 2020, and for all interim periods beginning after December 15, 2021. The Company will adopt this standard on the nonpublic company effective date and is currently assessing the impact of the new standard on its consolidated financial statements.
In February 2016, the FASB issued ASU 2016-02, Leases (Topic 842) (“ASU 2016-02”). Topic 842 was subsequently amended by ASU 2018-01, Land Easement Practical Expedient for Transition to Topic 842 (“ASU 2018-01”); ASU 2018-10, Codification Improvements to Topic 842, Leases (“ASU 2018-10”); ASU 2018-11, Targeted Improvements (“ASU 2018-11”); and ASU 2018-20 Leases (Topic 842): Narrow-Scope Improvements for Lessors (“ASU 2018-20”). ASU 2018-01 permits an entity to elect an optional transition practical expedient to not evaluate under Topic 842 land easements that exist or expired before the entity’s adoption of Topic 842 and that were not previously accounted for as leases under Topic 840. ASU 2018-10 was issued to clarify the Codification or to correct unintended application of guidance within ASU 2016-02. ASU 2018-11 allows for an optional transition method in which the provisions of Topic 842 would be applied upon the adoption date and would not have to be retroactively applied to the earliest reporting period presented in the consolidated financial statements. Lastly, ASU 2018-20 provided narrow-scope improvements for lessors, which was issued to increase transparency and comparability among organizations. ASU 2016-02 and the several additional amendments thereto are collectively referred to herein as ASC 842.
ASC 842 sets out the principles for the recognition, measurement, presentation and disclosure of leases for both parties to a contract (i.e., lessees and lessors). The standard represents a wholesale change to lease accounting and requires all leases with a term longer than 12 months to be reported on the balance sheet through recognition of a right-of-use asset and a corresponding liability for future lease obligations. Leases will be classified as financing or operating, with classification affecting the pattern and grouping of expenses in the income statement. The standard also requires extensive disclosures for assets, expenses, and cash flows associated with leases, as well as a maturity analysis of lease liabilities. In November 2019, FASB issued guidance delaying the effective date for all entities except for public business entities that are SEC filers. For public business entities the guidance is effective for fiscal year beginning after December 15, 2018, for all other entities the guidance is effective for fiscal year beginning after December 15, 2020, early adoption is permitted for all entities.
The Company early adopted this standard on January 1, 2020. In accordance with ASU 2018-11, the Company used the effective date as the date of application and, therefore, periods prior to January 1, 2020, were not restated. The new standard provides a number of optional practical expedients in transition. The Company elected the “package of practical expedients”, which permits the Company to not reassess prior conclusions about lease identification, lease classification, and initial direct costs under ASC 842. The Company also elected the hindsight practical expedient and, therefore, used the hindsight knowledge as of the effective date when determining lease terms and impairment. In addition, the Company elected the practical expedient to not separate lease and non-lease components and, therefore, accounts for each separate lease component of a contract and its associated non-lease components as a single lease component. The new standard also provides a practical expedient for an entity’s ongoing accounting relating to leases of 12 months or less (“short-term leases”). The Company has elected the short-term lease recognition exemption for all leases that qualify and will not recognize right-of-use assets and lease liabilities for those leases. The adoption of this standard resulted in the recognition of right-of-use asset and lease liabilities on the Company’s balance sheet for its real estate and equipment operating leases of $92.9 million and $96.4 million, respectively. The Company recorded an adjustment to remove the Company’s existing deferred rent liability of approximately $3.5 million. The Company also recognized a transition adjustment to the opening balance of retained earnings on January 1, 2020 amounting to
F-19
Table of Contents
EASTERN BANK CORPORATION
NOTES TO CONSOLIDATED FINANCIAL STATEMENTS
$1.1 million, net of tax, related to an incremental accrued rent adjustment calculated as a result of electing the hindsight practical expedient. The amount of right-of-use assets were determined based upon the present value of the remaining minimal rental payments under current leasing standards for existing operating leases, adjusted for options that the Company is reasonably certain to exercise, less accrued rent as of December 31, 2019 and the incremental accrued rent as a result of electing the hindsight practical expedient. Lastly, the amount of lease liabilities was determined based upon the present value of the remaining minimum rental payments under current leasing standards for existing operating leases, adjusted for options that the Company is reasonably certain to exercise.
Relevant standards that were adopted during the year ended December 31, 2019:
In May 2014, the FASB issued ASU 2014-09, Revenue from Contracts with Customers (Topic 606) (“ASU 2014-09”) and has since issued several additional amendments thereto, collectively referred to herein as ASC 606. This standard outlines a single comprehensive model for entities to use in accounting for revenue arising from contracts with customers and supersedes most current revenue recognition guidance. The new standards requires entities to allocate contract consideration to performance obligations in an arrangement on a relative standalone selling price basis, based on a five-step model. Specifically, revenue is recognized when control of a promised good or service is transferred to the customer, in an amount that reflects the consideration to which the entity expects to receive in exchange for those goods or services. The Company adopted the standard under the modified retrospective approach which requires entities to recognize a cumulative catch-up adjustment to the opening balance of retained earnings at the effective date. For public entities, the guidance was effective for annual periods beginning after December 15, 2017, including interim periods within those fiscal years. For nonpublic entities, the guidance is effective for annual periods beginning after December 15, 2018, and interim periods beginning after December 15, 2019.
In accordance with the nonpublic company requirements, the Company adopted ASC 606 on January 1, 2019. In completing its assessment of the Company’s revenue streams within the scope of ASC 606, the Company did not identify any revenue sources for which the timing of recognition needed to change under the new standard. The adoption of this standard on January 1, 2019 did not have a material impact on the Company’s consolidated financial statements, its current accounting policies and practices, or the timing or amount of revenue recognized. As a result, no adjustment has been made to retained earnings. Additionally, the Company evaluated and made necessary changes, where appropriate, to business processes, systems, and internal controls in order to support the recognition, measurement, and disclosure requirements of the new standard. The Company also considered the impact of ASC 606 subtopic ASC 340-40. Under ASC 340-40, the Company is required to capitalize and amortize incremental costs of obtaining a contract, such as sales commissions, over the period of benefit. The Company does not pay sales commissions and has not identified any other incremental cost to obtain a contract, therefore ASC 340-40 had no impact to its consolidated financial statements.
In January 2016, the FASB issued ASU 2016-01, Financial Instruments – Overall (Subtopic 825-10): Recognition and Measurement of Financial Assets and Financial Liabilities (“ASU 2016-01”). This standard has an impact on how companies recognize, measure, present and make disclosures related to certain financial assets and financial liabilities. Specifically, it eliminated the requirement for entities that are not considered public business entities to disclose the fair value of financial instruments measured at amortized cost. Additionally, it requires that all equity securities will be measured at fair value through net income with certain exceptions, including investments accounted for under the equity method of accounting or where the fair market value of an equity security is not readily available. The Company early adopted the provision as of January 1, 2016 and subsequently adopted the remaining provisions of this standard as of January 1, 2019. The adoption of this standard did not have a material impact on the Company’s consolidated financial statements.
In March 2018, the FASB issued ASU 2018-03 Technical Corrections and Improvements to Financial Instruments—Overall (Subtopic 825-10): Recognition and Measurement of Financial Assets and Financial Liabilities (“ASU 2018-13”). This update was issued to add improvements to ASU 2016-01 discussed above. Specifically, to increase stakeholders’ awareness of the amendments and to expedite the improvements. ASU 2018-03 is not required to be adopted before adopting the amendments in ASU 2016-01 and the effective date is the same effective date as ASU 2016-01. This update did not have a significant impact on the Company’s consolidated financial statements.
In March 2017, the FASB issued ASU 2017-07 Compensation—Retirement Benefits (Topic 715): Improving the Presentation of Net Periodic Pension Cost and Net Periodic Postretirement Benefit Cost (“ASU 2017-07”). The update was
F-20
Table of Contents
EASTERN BANK CORPORATION
NOTES TO CONSOLIDATED FINANCIAL STATEMENTS
primarily issued to improve the presentation of net periodic pension cost and net periodic postretirement benefit cost in the financial statements. For nonpublic companies, this ASU is effective for annual periods beginning after December 15, 2018, and interim periods within annual periods beginning after December 15, 2019. The Company adopted this standard as of the nonpublic company effective date, which was on January 1, 2019. This standard did not have a significant impact on the Company’s consolidated financial statements.
In February 2018, the FASB issued ASU 2018-02, Income Statement—Reporting Comprehensive Income (Topic 220): Reclassification of Certain Tax Effects from Accumulated Other Comprehensive Income (“ASU 2018-02”). This update provides entities with the option to reclassify to retained earnings tax effects related to items that have been stranded in accumulated other comprehensive income (“AOCI”) as a result of the Tax Cut and Jobs Act (“Tax Act”). An entity that elects to reclassify these amounts must reclassify stranded tax effects related to the Tax Act’s change in the U.S. federal tax rate for all items accounted for in other comprehensive income. ASU 2018-02 is effective for all entities for fiscal years beginning after December 15, 2017, and interim periods within those fiscal years. The Company adopted this ASU as of January 1, 2018 and the reclassification resulted in a decreased AOCI and increased retained earnings of $7.2 million.
Relevant standards that were recently issued but not yet adopted as of March 31, 2020 (unaudited):
In March 2020, the FASB issued ASU 2020-4, Reference Rate Reform (Topic 848). This update addresses optional expedients and exceptions for applying GAAP to certain contracts, hedging relationships, and other transactions affected by reference rate reform if certain criteria are met. The new guidance applies only to contracts, hedging relationships, and other transactions that reference the London Interbank Offered Rate (“LIBOR”) or another reference rate expected to be discontinued because of reference rate reform. The expedients and exceptions provided by the amendments do not apply to contract modifications made and hedging relationships existing as of December 31, 2022, that an entity has elected certain optional expedients for and that are retained through the end of the hedging relationship. For public and nonpublic entities, the guidance is effective as of March 12, 2020 through December 31, 2022 and do not apply to contract modifications made after December 31, 2022. The Company will adopt this standard on the nonpublic company effective date and is currently in the process of reviewing its contracts and existing processes in order to assess the risks and potential impact of the transition away from LIBOR
Relevant standards that were adopted during the period ended March 31, 2020 (unaudited):
In February 2016, the FASB issued ASU 2016-02, Leases (Topic 842) (“ASU 2016-02”). Topic 842 was subsequently amended by ASU 2018-01, Land Easement Practical Expedient for Transition to Topic 842 (“ASU 2018-01”); ASU 2018-10, Codification Improvements to Topic 842, Leases (“ASU 2018-10”); ASU 2018-11, Targeted Improvements (“ASU 2018-11”); and ASU 2018-20 Leases (Topic 842): Narrow-Scope Improvements for Lessors (“ASU 2018-20”). ASU 2018-01 permits an entity to elect an optional transition practical expedient to not evaluate under Topic 842 land easements that exist or expired before the entity’s adoption of Topic 842 and that were not previously accounted for as leases under Topic 840. ASU 2018-10 was issued to clarify the Codification or to correct unintended application of guidance within ASU 2016-02. ASU 2018-11 allows for an optional transition method in which the provisions of Topic 842 would be applied upon the adoption date and would not have to be retroactively applied to the earliest reporting period presented in the consolidated financial statements. Lastly, ASU 2018-20 provided narrow-scope improvements for lessors, which was issued to increase transparency and comparability among organizations. ASU 2016-02 and the several additional amendments thereto are collectively referred to herein as ASC 842.
ASC 842 sets out the principles for the recognition, measurement, presentation and disclosure of leases for both parties to a contract (i.e., lessees and lessors). The standard represents a wholesale change to lease accounting and requires all leases with a term longer than 12 months to be reported on the balance sheet through recognition of a right-of-use asset and a corresponding liability for future lease obligations. Leases will be classified as financing or operating, with classification affecting the pattern and grouping of expenses in the income statement. The standard also requires extensive disclosures for assets, expenses, and cash flows associated with leases, as well as a maturity analysis of lease liabilities. In November 2019, FASB issued guidance delaying the effective date for all entities except for public business entities that are SEC filers. For public business entities the guidance is effective for fiscal year beginning after December 15, 2018, for all other entities the guidance is effective for fiscal year beginning after December 15, 2020, early adoption is permitted for all entities.
F-21
Table of Contents
EASTERN BANK CORPORATION
NOTES TO CONSOLIDATED FINANCIAL STATEMENTS
The Company early adopted this standard on January 1, 2020. In accordance with ASU 2018-11, the Company used the effective date as the date of application and, therefore, periods prior to January 1, 2020, were not restated. The new standard provides a number of optional practical expedients in transition. The Company elected the “package of practical expedients”, which permits the Company to not reassess prior conclusions about lease identification, lease classification, and initial direct costs under ASC 842. The Company also elected the hindsight practical expedient and, therefore, used the hindsight knowledge as of the effective date when determining lease terms and impairment. In addition, the Company elected the practical expedient to not separate lease and non-lease components and, therefore, accounts for each separate lease component of a contract and its associated non-lease components as a single lease component. The new standard also provides a practical expedient for an entity’s ongoing accounting relating to leases of 12 months or less (“short-term leases”). The Company has elected the short-term lease recognition exemption for all leases that qualify and will not recognize right-of-use assets and lease liabilities for those leases. The adoption of this standard resulted in the recognition of right-of-use asset and lease liabilities on the Company’s balance sheet for its real estate and equipment operating leases of $92.9 million and $96.4 million, respectively. The Company recorded an adjustment to remove the Company’s existing deferred rent liability of approximately $3.5 million. The Company also recognized a transition adjustment to the opening balance of retained earnings on January 1, 2020 amounting to $1.1 million, net of tax, related to an incremental accrued rent adjustment calculated as a result of electing the hindsight practical expedient. The amount of right-of-use assets were determined based upon the present value of the remaining minimal rental payments under current leasing standards for existing operating leases, adjusted for options that the Company is reasonably certain to exercise, less accrued rent as of December 31, 2019 and the incremental accrued rent as a result of electing the hindsight practical expedient. Lastly, the amount of lease liabilities was determined based upon the present value of the remaining minimum rental payments under current leasing standards for existing operating leases, adjusted for options that the Company is reasonably certain to exercise.
In August 2018, the FASB issued ASU 2018-13, Fair Value Measurement (Topic 820) Disclosure Framework—Changes to the Disclosure Requirements for Fair Value Measurement (“ASU 2018-13”). This update modifies the disclosure requirements related to the fair value measurements in Topic 820. Specifically, this update amends disclosure around changes in unrealized gains and losses, the range and weighted average of significant unobservable inputs used in Level 3 fair value measurements and the description of measurement uncertainty. The Company adopted ASU 2018-13 on January 1, 2020. This update did not have a material impact on its consolidated financial statements.
In October 2018, the FASB issued ASU 2018-16, Derivatives and Hedging (Topic 815): Inclusion of the Secured Overnight Financing Rate (SOFR) Overnight Index Swap (OIS) Rate as a Benchmark Interest Rate for Hedge Accounting Purposes (“ASU 2018-16”). This update permits the use of the Overnight Index Swap (“OIS”) rate based on the Secured Overnight Financing Rate (“SOFR”) as a U.S. benchmark interest rate for hedge accounting purposes under Topic 815. The amendments should be adopted on a prospective basis for qualifying new or re-structured hedging relationships entered into on or after the date of adoption. The company adopted this standard on January 1, 2020. This update did not have a material impact on its consolidated financial statements.
2. Mergers and Acquisitions
During the year ended December 31, 2018, the Company completed the acquisition of certain insurance agencies for total consideration of $11.5 million in cash. These acquisitions were considered to be business combinations and were accounted for using the acquisition method.
F-22
Table of Contents
EASTERN BANK CORPORATION
NOTES TO CONSOLIDATED FINANCIAL STATEMENTS
The following table summarizes the estimated fair value of the assets acquired and liabilities assumed for the business combinations described above:
| (In Thousands) | ||||
| Assets acquired: |
||||
| Customer list intangible |
$ | 4,400 | ||
| Non-compete intangible |
600 | |||
|
|
|
|||
| Total Assets |
5,000 | |||
|
|
|
|||
| Net assets acquired |
5,000 | |||
| Consideration |
||||
| Total cash paid |
(11,500 | ) | ||
| Contingent consideration |
(1,200 | ) | ||
|
|
|
|||
| Total fair value of consideration |
(12,700 | ) | ||
|
|
|
|||
| Goodwill |
$ | 7,700 | ||
|
|
|
|||
The Company recorded a liability of $1.2 million for contingent consideration related to attainment of revenue targets over a period of time after the acquisition date. The amount of contingent consideration was based upon management’s best estimate of possible outcomes. According to the purchase agreements, the contingent consideration payouts range from $0 to $1.4 million.
For tax purposes, these acquisitions were considered asset acquisitions and as such, the amortization of goodwill and intangible assets is deductible for tax purposes. Acquisition-related legal and professional fee costs of $0.2 million associated with these acquisitions were charged to expense during the year ended December 31, 2018 and were included in the professional fee line item of the consolidated statements of income.
During the three months ended March 31, 2020 and 2019 (unaudited) and the years ended December 31, 2019 and 2018, the Company did not have any material charges to expense or payments to adjust the acquisition-related contingent consideration liabilities.
These acquisitions were not considered significant to the Company’s consolidated financial statements and, therefore, pro forma data and certain other disclosures have been excluded.
3. Securities
Trading Securities
Trading securities, at fair value, were as follows:
| As of March 31, |
As of December 31 | |||||||||||
| 2020 | 2019 | 2018 | ||||||||||
| (Unaudited) | ||||||||||||
| (In Thousands) | ||||||||||||
| Debt securities: |
||||||||||||
| Municipal bonds and obligations |
$652 | $ | 961 | $ | 52,899 | |||||||
|
|
|
|
|
|
|
|||||||
| $ | 652 | $ | 961 | $ | 52,899 | |||||||
|
|
|
|
|
|
|
|||||||
The reduction in the Company’s municipal bonds and obligations at December 31, 2019 from December 31, 2018 was due to the Company’s exit of its capital markets business during the year ended December 31, 2019. For the three months ended March 31, 2020 (unaudited) and years ended December 31, 2019 and 2018, the net unrealized gains and losses on trading activities for trading securities still held at the reporting date was less than $0.1 million.
F-23
Table of Contents
EASTERN BANK CORPORATION
NOTES TO CONSOLIDATED FINANCIAL STATEMENTS
Available for Sale Securities
The amortized cost, gross unrealized gains and losses, and fair value of available for sale securities for the periods below were as follows:
| As of and for the three months ended March 31, 2020 |
||||||||||||||||
| (Unaudited) | ||||||||||||||||
| Amortized | Unrealized | Unrealized | Fair | |||||||||||||
| Cost | Gains | Losses | Value | |||||||||||||
| (In Thousands) | ||||||||||||||||
| Debt securities: |
||||||||||||||||
| Government-sponsored residential mortgage-backed securities |
$ | 1,154,763 | $ | 48,726 | $ | — | $ | 1,203,489 | ||||||||
| U.S. Treasury securities |
60,240 | 995 | — | 61,235 | ||||||||||||
| State and municipal bonds and obligations |
267,023 | 11,932 | (1 | ) | 278,954 | |||||||||||
| Other |
6,182 | 67 | — | 6,249 | ||||||||||||
|
|
|
|
|
|
|
|
|
|||||||||
| $ | 1,488,208 | $ | 61,720 | $ | (1 | ) | $ | 1,549,927 | ||||||||
|
|
|
|
|
|
|
|
|
|||||||||
| As of and for the year ended December 31, 2019 |
||||||||||||||||
| Amortized | Unrealized | Unrealized | Fair | |||||||||||||
| Cost | Gains | Losses | Value | |||||||||||||
| (In Thousands) | ||||||||||||||||
| Debt securities: |
||||||||||||||||
| Government-sponsored residential mortgage-backed securities |
$ | 1,151,305 | $ | 17,208 | $ | (545 | ) | $ | 1,167,968 | |||||||
| U.S. Treasury securities |
50,155 | 265 | — | 50,420 | ||||||||||||
| State and municipal bonds and obligations |
272,582 | 10,959 | (3 | ) | 283,538 | |||||||||||
| Other |
6,155 | 155 | — | 6,310 | ||||||||||||
|
|
|
|
|
|
|
|
|
|||||||||
| $ | 1,480,197 | $ | 28,587 | $ | (548 | ) | $ | 1,508,236 | ||||||||
|
|
|
|
|
|
|
|
|
|||||||||
| As of and for the year ended December 31, 2018 |
||||||||||||||||
| Amortized | Unrealized | Unrealized | Fair | |||||||||||||
| Cost | Gains | Losses | Value | |||||||||||||
| (In Thousands) | ||||||||||||||||
| Debt securities: |
||||||||||||||||
| Government-sponsored residential mortgage-backed securities |
$ | 1,153,495 | $ | 1,919 | $ | (19,277 | ) | $ | 1,136,137 | |||||||
| State and municipal bonds and obligations |
321,184 | 1,883 | (9,351 | ) | 313,716 | |||||||||||
| Other |
6,045 | — | — | 6,045 | ||||||||||||
|
|
|
|
|
|
|
|
|
|||||||||
| $ | 1,480,724 | $ | 3,802 | $ | (28,628 | ) | $ | 1,455,898 | ||||||||
|
|
|
|
|
|
|
|
|
|||||||||
F-24
Table of Contents
EASTERN BANK CORPORATION
NOTES TO CONSOLIDATED FINANCIAL STATEMENTS
The amortized cost and estimated fair value of available for sale securities by contractual maturities as of March 31, 2020 (unaudited) are shown below. Actual maturities may differ from contractual maturities because borrowers may have the right to call or prepay obligations with or without prepayment penalties. The scheduled contractual maturities of available for sale securities as of the dates indicated were as follows:
| March 31, 2020 (unaudited) | ||||||||||||||||||||||||||||||||||||||||
| Due in one year or less |
Due after one year to five years |
Due after five to ten years |
Due after ten years | Total | ||||||||||||||||||||||||||||||||||||
| Amortized Cost |
Fair Value |
Amortized Cost |
Fair Value |
Amortized Cost |
Fair Value |
Amortized Cost |
Fair Value | Amortized Cost |
Fair Value | |||||||||||||||||||||||||||||||
| (In Thousands) | ||||||||||||||||||||||||||||||||||||||||
| Available for sale securities: |
||||||||||||||||||||||||||||||||||||||||
| Government-sponsored residential mortgage-backed securities |
$ | — | $ | — | $ | 19,902 | $ | 20,855 | $ | 172,447 | $ | 179,157 | $ | 962,414 | $ | 1,003,477 | $ | 1,154,763 | 1,203,489 | |||||||||||||||||||||
| U.S. Treasury securities |
50,103 | 51,069 | 10,137 | 10,166 | — | — | — | — | 60,240 | 61,235 | ||||||||||||||||||||||||||||||
| State and municipal bonds and obligations |
380 | 380 | 13,834 | 14,126 | 71,354 | 73,531 | 181,455 | 190,917 | 267,023 | 278,954 | ||||||||||||||||||||||||||||||
| Other |
6,182 | 6,249 | — | — | — | — | — | — | 6,182 | 6,249 | ||||||||||||||||||||||||||||||
|
|
|
|
|
|
|
|
|
|
|
|
|
|
|
|
|
|
|
|
|
|||||||||||||||||||||
| Total available for sale securities |
$ | 56,665 | $ | 57,698 | $ | 43,873 | $ | 45,147 | $ | 243,801 | $ | 252,688 | $ | 1,143,869 | $ | 1,194,394 | $ | 1,488,208 | $ | 1,549,927 | ||||||||||||||||||||
|
|
|
|
|
|
|
|
|
|
|
|
|
|
|
|
|
|
|
|
|
|||||||||||||||||||||
| December 31, 2019 | ||||||||||||||||||||||||||||||||||||||||
| Due in one year or less |
Due after one year to five years |
Due after five to ten years |
Due after ten years | Total | ||||||||||||||||||||||||||||||||||||
| Amortized Cost |
Fair Value |
Amortized Cost |
Fair Value |
Amortized Cost |
Fair Value |
Amortized Cost |
Fair Value | Amortized Cost |
Fair Value | |||||||||||||||||||||||||||||||
| (In Thousands) | ||||||||||||||||||||||||||||||||||||||||
| Available for sale securities |
||||||||||||||||||||||||||||||||||||||||
| Government-sponsored residential mortgage-backed securities |
$ | — | $ | — | $ | 8,139 | $ | 8,464 | $ | 199,428 | $ | 203,706 | $ | 943,738 | $ | 955,798 | $ | 1,151,305 | $ | 1,167,968 | ||||||||||||||||||||
| U.S. Treasury securities |
40 | 40 | 50,115 | 50,380 | — | — | — | — | 50,155 | 50,420 | ||||||||||||||||||||||||||||||
| State and municipal bonds and obligations |
381 | 381 | 8,889 | 9,109 | 77,227 | 79,504 | 186,085 | 194,544 | 272,582 | 283,538 | ||||||||||||||||||||||||||||||
| Other |
6,155 | 6,310 | — | — | — | — | — | — | 6,155 | 6,310 | ||||||||||||||||||||||||||||||
|
|
|
|
|
|
|
|
|
|
|
|
|
|
|
|
|
|
|
|
|
|||||||||||||||||||||
| Total available for sale securities |
$ | 6,576 | $ | 6,731 | $ | 67,143 | $ | 67,953 | $ | 276,655 | $ | 283,210 | $ | 1,129,823 | $ | 1,150,342 | $ | 1,480,197 | $ | 1,508,236 | ||||||||||||||||||||
|
|
|
|
|
|
|
|
|
|
|
|
|
|
|
|
|
|
|
|
|
|||||||||||||||||||||
Mortgage-backed securities include investments in securities that are insured or guaranteed by Freddie Mac or Fannie Mae. Mortgage-backed securities are purchased to achieve positive interest rate spread with minimal administrative expense, and to lower the Company’s credit risk. Mortgage-backed securities and callable securities are shown at their contractual maturity dates. However, both are expected to have shorter average lives due to expected prepayments and callable features, respectively. Included in the available for sale securities as of March 31, 2020 (unaudited) and December 31, 2019 and 2018 were $261.9 million, $266.4 million and $296.3 million, respectively, of callable securities at fair value.
U.S. Treasury securities are purchased for liquidity purposes at zero risk weighting for capital purposes and as collateral for interest rate derivative positions.
F-25
Table of Contents
EASTERN BANK CORPORATION
NOTES TO CONSOLIDATED FINANCIAL STATEMENTS
State and municipal securities include fixed rate investment grade bonds issued primarily by municipalities in local communities within Massachusetts, and the Commonwealth of Massachusetts. The market value of these securities may be affected by call options, long dated maturities, general market liquidity and credit factors.
As of March 31, 2020 (unaudited) and December 31, 2019 and 2018, the Company had no investments in obligations of individual states, counties, or municipalities, which exceeded 10% of equity.
Gross realized gains from sales of available for sale securities were $0.1 million in both the three months ended March 31, 2020 and 2019 (unaudited), and $2.1 million and $0.2 million during the years ended December 31, 2019 and 2018, respectively. The Company had no significant gross realized losses from sales of securities available for sale during the three months ended March 31, 2020 and 2019 (unaudited) and the years ended December 31, 2019 or 2018. No other-than-temporary impairment was recorded during the three months ended March 31, 2020 or 2019, (unaudited) and years ended December 31, 2019 or 2018.
Management prepares an estimate of the expected cash flows for investment securities available for sale that potentially may be deemed to have OTTI. This estimate begins with the contractual cash flows of the security. This amount is then reduced by an estimate of probable credit losses associated with the security. When estimating the extent of probable losses on the securities, management considers the credit quality and the ability to pay of the underlying issuers. Indicators of diminished credit quality of the issuers include defaults, interest deferrals, or “payments in kind.” Management also considers those factors listed in the Investments – Debt and Equity Securities topic of the FASB ASC when estimating the ultimate realizability of the cash flows for each individual security.
The resulting estimate of cash flows after considering credit is then subject to a present value computation using a discount rate equal to the current yield used to accrete the beneficial interest or the effective interest rate implicit in the
security at the date of acquisition. If the present value of the estimated cash flows is less than the current amortized cost basis, an OTTI is considered to have occurred and the security is written down to the fair value indicated by the cash flow analysis. As part of the analysis, management considers whether it intends to sell the security or whether it is more than likely that it would be required to sell the security before the expected recovery of its amortized cost basis.
F-26
Table of Contents
EASTERN BANK CORPORATION
NOTES TO CONSOLIDATED FINANCIAL STATEMENTS
Information pertaining to available for sale securities with gross unrealized losses as of March 31, 2020 (unaudited) and December 31, 2019 and 2018, which the Company has not deemed to be OTTI, aggregated by investment category and length of time that individual securities have been in a continuous loss position, follows:
| March 31, 2020 | ||||||||||||||||||||||||||||
| (Unaudited) | ||||||||||||||||||||||||||||
| Less than 12 Months | 12 Months or Longer | Total | ||||||||||||||||||||||||||
| # of Holdings |
Gross Unrealized Losses |
Fair Value |
Gross Unrealized Losses |
Fair Value | Gross Unrealized Losses |
Fair Value | ||||||||||||||||||||||
| (Dollars in thousands) | ||||||||||||||||||||||||||||
| State and municipal bonds and obligations |
2 | $ | 1 | $ | 867 | $ | — | $ | — | $ | 1 | $ | 867 | |||||||||||||||
|
|
|
|
|
|
|
|
|
|
|
|
|
|
|
|||||||||||||||
| 2 | $ | 1 | $ | 867 | $ | — | $ | — | $ | 1 | $ | 867 | ||||||||||||||||
|
|
|
|
|
|
|
|
|
|
|
|
|
|
|
|||||||||||||||
| December 31, 2019 | ||||||||||||||||||||||||||||
| Less than 12 Months | 12 Months or Longer | Total | ||||||||||||||||||||||||||
| # of Holdings |
Gross Unrealized Losses |
Fair Value |
Gross Unrealized Losses |
Fair Value | Gross Unrealized Losses |
Fair Value | ||||||||||||||||||||||
| (Dollars in thousands) | ||||||||||||||||||||||||||||
| Government-sponsored residential mortgage-backed securities |
1 | $ | 545 | $ | 74,550 | $ | — | $ | — | $ | 545 | $ | 74,550 | |||||||||||||||
| State and municipal bonds and obligations |
2 | 3 | 850 | — | — | 3 | 850 | |||||||||||||||||||||
|
|
|
|
|
|
|
|
|
|
|
|
|
|
|
|||||||||||||||
| 3 | $ | 548 | $ | 75,400 | $ | — | $ | — | $ | 548 | $ | 75,400 | ||||||||||||||||
|
|
|
|
|
|
|
|
|
|
|
|
|
|
|
|||||||||||||||
| December 31, 2018 | ||||||||||||||||||||||||||||
| Less than 12 Months | 12 Months or Longer | Total | ||||||||||||||||||||||||||
| # of Holdings |
Gross Unrealized Losses |
Fair Value |
Gross Unrealized Losses |
Fair Value |
Gross Unrealized Losses |
Fair Value |
||||||||||||||||||||||
| (Dollars in thousands) | ||||||||||||||||||||||||||||
| Government-sponsored residential mortgage-backed securities |
17 | $ | — | $ | — | $ | 19,277 | $ | 925,797 | $ | 19,277 | $ | 925,797 | |||||||||||||||
| State and municipal bonds and obligations |
257 | 978 | 47,324 | 8,373 | 151,562 | 9,351 | 198,886 | |||||||||||||||||||||
|
|
|
|
|
|
|
|
|
|
|
|
|
|
|
|||||||||||||||
| 274 | $ | 978 | $ | 47,324 | $ | 27,650 | $ | 1,077,359 | $ | 28,628 | $ | 1,124,683 | ||||||||||||||||
|
|
|
|
|
|
|
|
|
|
|
|
|
|
|
|||||||||||||||
The Company does not intend to sell these investments and has determined based upon available evidence that it is more likely than not that the Company will not be required to sell each security before the expected recovery of its amortized cost basis. As a result, the Company does not consider these investments to be OTTI. The Company made this determination by reviewing various qualitative and quantitative factors regarding each investment category, such as current market conditions, extent and nature of changes in fair value, issuer rating changes and trends, and volatility of earnings.
As a result of the Company’s review of these qualitative and quantitative factors, the causes of the impairments listed in the table above by category are as follows as of March 31, 2020 (unaudited) and December 31, 2019:
| • | Government-sponsored residential mortgage-backed securities - The security with an unrealized loss in this portfolio has contractual terms that generally do not permit the issuer to settle the security at a price less than the current par value of the investment. The decline in market value of this security is attributable to changes in interest rates and not credit quality. Additionally, this security is implicitly guaranteed by the U.S. Government or one of its agencies. |
| • | State and municipal bonds and obligations - The securities with unrealized losses in this portfolio have contractual terms that generally do not permit the issuer to settle the securities at a price less than the current par value of the investment. The decline in market value of these securities is attributable to changes in interest rates and not credit quality. These bonds are investment grade and are rated AA Standard and Poor’s. |
F-27
Table of Contents
EASTERN BANK CORPORATION
NOTES TO CONSOLIDATED FINANCIAL STATEMENTS
During the year ended December 31, 2018 the Company tendered illiquid common shares for one of its cost method investments in exchange for cash and stock in the acquiring entity totaling $0.6 million. The Company recorded a gain of $0.6 million for the consideration received in excess of the cost basis of the tendered shares. The newly acquired stock in the acquiring entity had a fair value of $0.3 million and was subsequently donated to the Eastern Bank Charitable Foundation. The portion of the gain related to the stock donation was a non-taxable securities gain.
4. Loans and Allowance for Loan Losses
Loans Portfolio Composition
The Company’s loans portfolio is comprised of the following main categories: commercial, residential and consumer. The commercial loan category includes: commercial and industrial, commercial real estate, commercial construction and business banking. The consumer loan category includes: consumer home equity and other consumer loans.
Commercial Lending
| • | Commercial and industrial: Loans in this category consist of revolving and term loans extended to businesses and corporate enterprises for the purpose of financing working capital, equipment purchases and acquisitions. |
| • | Commercial real estate: Loans in this category include mortgage loans on commercial real estate, both investment and owner occupied. Property types financed include office, industrial, multi-family, affordable housing, retail, hotel and other types of properties. |
| • | Commercial construction: Loans in this category include construction project financings and are comprised of commercial real estate, business banking and residential loans for the purpose of constructing and developing real estate. |
| • | Business banking: Loans in this category are comprised of loans to small businesses with exposures of under $1 million and small investment real estate projects with exposures of under $3 million; and are separate and distinct from the commercial and industrial and commercial real estate portfolios described above due to the size of the loans. Business banking originations include traditionally underwritten loans as well as partially automated scored loans. |
Residential Lending
| • | Residential real estate: Loans in this category consist of mortgage loans on residential real estate. |
Consumer Lending
| • | Consumer home equity: Loans in this category consist of home equity lines of credit and home equity loans. |
| • | Other consumer: Loans in this category consist of unsecured personal lines of credit, overdraft protection, automobile and aircraft loans, and other personal loans. |
F-28
Table of Contents
EASTERN BANK CORPORATION
NOTES TO CONSOLIDATED FINANCIAL STATEMENTS
The following table provides a summary of the Company’s loan portfolio as of the dates indicated:
| As of March 31, | As of December 31, | |||||||||||
| 2020 | 2019 | 2018 | ||||||||||
| (Unaudited) | ||||||||||||
| (In thousands) | ||||||||||||
| Commercial and industrial |
$ | 1,771,122 | $ | 1,642,184 | $ | 1,658,765 | ||||||
| Commercial real estate |
3,523,721 | 3,535,441 | 3,211,118 | |||||||||
| Commercial construction |
293,135 | 273,774 | 313,209 | |||||||||
| Business banking |
779,916 | 771,498 | 740,938 | |||||||||
| Residential real estate |
1,420,003 | 1,428,630 | 1,430,764 | |||||||||
| Consumer home equity |
929,554 | 933,088 | 949,410 | |||||||||
| Other consumer |
369,652 | 402,431 | 551,799 | |||||||||
|
|
|
|
|
|
|
|||||||
| Loans before unamortized premiums, unearned discounts and deferred fees |
9,087,103 | 8,987,046 | 8,856,003 | |||||||||
| Allowance for loan losses |
(109,138 | ) | (82,297 | ) | (80,655 | ) | ||||||
| Unamortized premiums, net of unearned discounts and deferred fees |
(6,360 | ) | (5,565 | ) | (435 | ) | ||||||
|
|
|
|
|
|
|
|||||||
| Loans after the allowance for loan losses, unamortized premiums, unearned discounts and deferred fees |
$ | 8,971,605 | $ | 8,899,184 | $ | 8,774,913 | ||||||
|
|
|
|
|
|
|
|||||||
There are no other loan categories that exceed 10% of total loans not already reflected in the preceding table.
The Company’s lending activities are conducted principally in the New England area with the exception of its Shared National Credit Program (“SNC Program”) portfolio. The Company participates in the SNC Program in an effort to improve industry and geographical diversification. The SNC Program portfolio is included in the Company’s commercial and industrial, commercial real estate and commercial construction portfolios. The SNC Program portfolio is defined as loan syndications with exposure over $100 million and with three or more lenders participating.
Most loans originated by the Company are either collateralized by real estate or other assets or guaranteed by federal and local governmental authorities. The ability and willingness of the single-family residential and consumer borrowers to honor their repayment commitments is generally dependent on the level of overall economic activity within the borrowers’ geographic areas and real estate values. The ability and willingness of commercial real estate, commercial and industrial, and construction loan borrowers to honor their repayment commitments is generally dependent on the health of the real estate economy in the borrowers’ geographic areas and the general economy. The ability and willingness of airplane loan borrowers to repay is generally dependent on the health of the general economy.
Loans Pledged as Collateral
The carrying value of loans pledged to secure advances from the FHLB were $2.1 billion, $1.5 billion and $1.2 billion at March 31, 2020 (unaudited) and December 31, 2019 and 2018, respectively.
At March 31, 2020 (unaudited) and December 31, 3019 and 2018, mortgage loans partially or wholly-owned by others and serviced by the Company amounted to approximately $15.0 million, $15.6 million and $16.8 million, respectively.
Allowance for Loan Losses
The allowance for loan losses is established to provide for probable losses incurred in the Company’s loan portfolio at the balance sheet date and is established through a provision for loan losses charged to net income. Charge-offs, net of recoveries, are charged directly to the allowance. Commercial and residential loans are charged-off in the period in which they are deemed uncollectible. Delinquent loans in these product types are subject to ongoing review and analysis to determine if a charge-off in the current period is appropriate. For consumer loans, policies and procedures exist that require charge-off consideration upon a certain triggering event depending on the product type.
F-29
Table of Contents
EASTERN BANK CORPORATION
NOTES TO CONSOLIDATED FINANCIAL STATEMENTS
The following table summarizes the changes in the allowance for loan losses for the periods indicated:
| For the three months ended March 31, |
For the year ended December 31, |
|||||||||||||||
| 2020 | 2019 | 2019 | 2018 | |||||||||||||
| (Unaudited) | ||||||||||||||||
| (In thousands) | ||||||||||||||||
| Balance at the beginning of year |
$ | 82,297 | $ | 80,655 | $ | 80,655 | $ | 74,111 | ||||||||
| Loans charged off |
(2,343 | ) | (1,924 | ) | (9,499 | ) | (12,461 | ) | ||||||||
| Recoveries |
584 | 762 | 4,841 | 3,905 | ||||||||||||
| Provision charged to expense |
28,600 | 3,000 | 6,300 | 15,100 | ||||||||||||
|
|
|
|
|
|
|
|
|
|||||||||
| Balance at end of year |
$ | 109,138 | $ | 82,493 | $ | 82,297 | $ | 80,655 | ||||||||
|
|
|
|
|
|
|
|
|
|||||||||
The following tables summarize changes in the allowance for loan losses by loan category and bifurcates the amount of allowance allocated to each loan category based on collective impairment analysis and loans evaluated individually for impairment:
| For the three months ended March 31, 2020 | ||||||||||||||||||||||||||||||||||||
| (Unaudited) | ||||||||||||||||||||||||||||||||||||
| Commercial and Industrial |
Commercial Real Estate |
Commercial Construction |
Business Banking |
Residential Real Estate |
Consumer Home Equity |
Other Consumer |
Other | Total | ||||||||||||||||||||||||||||
| (In thousands) | ||||||||||||||||||||||||||||||||||||
| Allowance for loan losses: |
||||||||||||||||||||||||||||||||||||
| Beginning balance |
$ | 20,919 | $ | 34,730 | $ | 3,424 | $ | 8,260 | $ | 6,380 | $ | 4,027 | $ | 4,173 | $ | 384 | $ | 82,297 | ||||||||||||||||||
| Charge-offs |
— | — | — | (1,337 | ) | — | (473 | ) | (533 | ) | — | (2,343 | ) | |||||||||||||||||||||||
| Recoveries |
322 | 1 | — | 127 | 60 | 14 | 60 | — | 584 | |||||||||||||||||||||||||||
| Provision (benefit) |
9,290 | 14,496 | 1,288 | 3,131 | (212 | ) | 345 | 319 | (57 | ) | 28,600 | |||||||||||||||||||||||||
|
|
|
|
|
|
|
|
|
|
|
|
|
|
|
|
|
|
|
|||||||||||||||||||
| Ending balance |
$ | 30,531 | $ | 49,227 | $ | 4,712 | $ | 10,181 | $ | 6,228 | $ | 3,913 | $ | 4,019 | $ | 327 | $ | 109,138 | ||||||||||||||||||
|
|
|
|
|
|
|
|
|
|
|
|
|
|
|
|
|
|
|
|||||||||||||||||||
| Ending balance: individually evaluated for impairment |
$ | 4,037 | $ | 270 | $ | — | $ | 453 | $ | 1,275 | $ | 221 | $ | — | $ | — | $ | 6,256 | ||||||||||||||||||
|
|
|
|
|
|
|
|
|
|
|
|
|
|
|
|
|
|
|
|||||||||||||||||||
| Ending balance: acquired with deteriorated credit quality |
$ | — | $ | 936 | $ | — | $ | — | $ | 256 | $ | — | $ | — | $ | — | $ | 1,192 | ||||||||||||||||||
|
|
|
|
|
|
|
|
|
|
|
|
|
|
|
|
|
|
|
|||||||||||||||||||
| Ending balance: collectively evaluated for impairment |
$ | 26,494 | $ | 48,021 | $ | 4,712 | $ | 9,728 | $ | 4,697 | $ | 3,692 | $ | 4,019 | $ | 327 | $ | 101,690 | ||||||||||||||||||
|
|
|
|
|
|
|
|
|
|
|
|
|
|
|
|
|
|
|
|||||||||||||||||||
| Loans ending balance: |
||||||||||||||||||||||||||||||||||||
| Individually evaluated for impairment |
$ | 32,423 | $ | 8,054 | $ | — | $ | 10,258 | $ | 29,393 | $ | 6,280 | $ | 23 | $ | — | $ | 86,431 | ||||||||||||||||||
| Acquired with deteriorated credit quality |
3,939 | 5,780 | — | — | 3,424 | — | — | — | 13,143 | |||||||||||||||||||||||||||
| Collectively evaluated for impairment |
1,734,760 | 3,509,887 | 293,135 | 769,658 | 1,387,186 | 923,274 | 369,629 | — | 8,987,529 | |||||||||||||||||||||||||||
|
|
|
|
|
|
|
|
|
|
|
|
|
|
|
|
|
|
|
|||||||||||||||||||
| Total loans by group |
$ | 1,771,122 | $ | 3,523,721 | $ | 293,135 | $ | 779,916 | $ | 1,420,003 | $ | 929,554 | $ | 369,652 | $ | — | $ | 9,087,103 | ||||||||||||||||||
|
|
|
|
|
|
|
|
|
|
|
|
|
|
|
|
|
|
|
|||||||||||||||||||
F-30
Table of Contents
EASTERN BANK CORPORATION
NOTES TO CONSOLIDATED FINANCIAL STATEMENTS
| For the three months ended March 31, 2019 | ||||||||||||||||||||||||||||||||||||
| (Unaudited) | ||||||||||||||||||||||||||||||||||||
| Commercial and Industrial |
Commercial Real Estate |
Commercial Construction |
Business Banking |
Residential Real Estate |
Consumer Home Equity |
Other Consumer |
Other | Total | ||||||||||||||||||||||||||||
| (In thousands) | ||||||||||||||||||||||||||||||||||||
| Allowance for loan losses: |
||||||||||||||||||||||||||||||||||||
| Beginning balance |
$ | 19,321 | $ | 32,400 | $ | 4,606 | $ | 8,167 | $ | 7,059 | $ | 4,113 | $ | 4,600 | $ | 389 | $ | 80,655 | ||||||||||||||||||
| Charge-offs |
— | — | — | (1,439 | ) | (17 | ) | — | (468 | ) | — | (1,924 | ) | |||||||||||||||||||||||
| Recoveries |
460 | 2 | — | 127 | 59 | 8 | 106 | — | 762 | |||||||||||||||||||||||||||
| Provision (benefit) |
1,063 | 768 | (381 | ) | 1,320 | 68 | (16 | ) | 152 | 26 | 3,000 | |||||||||||||||||||||||||
|
|
|
|
|
|
|
|
|
|
|
|
|
|
|
|
|
|
|
|||||||||||||||||||
| Ending balance |
$ | 20,844 | $ | 33,170 | $ | 4,225 | $ | 8,175 | $ | 7,169 | $ | 4,105 | $ | 4,390 | $ | 415 | $ | 82,493 | ||||||||||||||||||
|
|
|
|
|
|
|
|
|
|
|
|
|
|
|
|
|
|
|
|||||||||||||||||||
| Ending balance: individually evaluated for impairment |
$ | 1,354 | $ | 40 | $ | — | $ | 221 | $ | 1,901 | $ | 355 | $ | 19 | $ | — | $ | 3,890 | ||||||||||||||||||
|
|
|
|
|
|
|
|
|
|
|
|
|
|
|
|
|
|
|
|||||||||||||||||||
| Ending balance: acquired with deteriorated credit quality |
$ | 239 | $ | 181 | $ | — | $ | — | $ | 393 | $ | — | $ | — | $ | — | $ | 813 | ||||||||||||||||||
|
|
|
|
|
|
|
|
|
|
|
|
|
|
|
|
|
|
|
|||||||||||||||||||
| Ending balance: collectively evaluated for impairment |
$ | 19,251 | $ | 32,949 | $ | 4,225 | $ | 7,954 | $ | 4,875 | $ | 3,750 | $ | 4,371 | $ | 415 | $ | 77,790 | ||||||||||||||||||
|
|
|
|
|
|
|
|
|
|
|
|
|
|
|
|
|
|
|
|||||||||||||||||||
| Loans ending balance: |
||||||||||||||||||||||||||||||||||||
| Individually evaluated for impairment |
$ | 11,825 | $ | 12,141 | $ | — | $ | 8,414 | $ | 27,160 | $ | 4,867 | $ | 242 | $ | — | $ | 64,649 | ||||||||||||||||||
| Acquired with deteriorated credit quality |
5,038 | 7,817 | — | — | 3,595 | — | — | — | 16,450 | |||||||||||||||||||||||||||
| Collectively evaluated for impairment |
1,685,710 | 3,311,105 | 268,712 | 729,656 | 1,402,171 | 937,833 | 506,398 | — | 8,841,585 | |||||||||||||||||||||||||||
|
|
|
|
|
|
|
|
|
|
|
|
|
|
|
|
|
|
|
|||||||||||||||||||
| Total loans by group |
$ | 1,702,573 | $ | 3,331,063 | $ | 268,712 | $ | 738,070 | $ | 1,432,926 | $ | 942,700 | $ | 506,640 | $ | — | $ | 8,922,684 | ||||||||||||||||||
|
|
|
|
|
|
|
|
|
|
|
|
|
|
|
|
|
|
|
|||||||||||||||||||
F-31
Table of Contents
EASTERN BANK CORPORATION
NOTES TO CONSOLIDATED FINANCIAL STATEMENTS
| For the year ended December 31, 2019 | ||||||||||||||||||||||||||||||||||||
| Commercial and Industrial |
Commercial Real Estate |
Commercial Construction |
Business Banking |
Residential Real Estate |
Consumer Home Equity |
Other Consumer |
Other | Total | ||||||||||||||||||||||||||||
| (In thousands) | ||||||||||||||||||||||||||||||||||||
| Allowance for loan losses: |
||||||||||||||||||||||||||||||||||||
| Beginning balance |
$ | 19,321 | $ | 32,400 | $ | 4,606 | $ | 8,167 | $ | 7,059 | $ | 4,113 | $ | 4,600 | $ | 389 | $ | 80,655 | ||||||||||||||||||
| Charge-offs |
(1,123 | ) | — | — | (5,974 | ) | (66 | ) | (205 | ) | (2,131 | ) | — | (9,499 | ) | |||||||||||||||||||||
| Recoveries |
3,748 | 12 | — | 604 | 105 | 52 | 320 | — | 4,841 | |||||||||||||||||||||||||||
| Provision (benefit) |
(1,027 | ) | 2,318 | (1,182) | 5,463 | (718 | ) | 67 | 1,384 | (5 | ) | 6,300 | ||||||||||||||||||||||||
|
|
|
|
|
|
|
|
|
|
|
|
|
|
|
|
|
|
|
|||||||||||||||||||
| Ending balance |
$ | 20,919 | $ | 34,730 | $3,424 | $ | 8,260 | $ | 6,380 | $ | 4,027 | $ | 4,173 | $ | 384 | $ | 82,297 | |||||||||||||||||||
|
|
|
|
|
|
|
|
|
|
|
|
|
|
|
|
|
|
|
|||||||||||||||||||
| Ending balance: individually evaluated for impairment |
$ | 2,337 | $ | 40 | $ | — | $ | 571 | $ | 1,399 | $ | 322 | $ | — | $ | — | $ | 4,669 | ||||||||||||||||||
|
|
|
|
|
|
|
|
|
|
|
|
|
|
|
|
|
|
|
|||||||||||||||||||
| Ending balance: acquired with deteriorated credit quality |
$ | 936 | $ | — | $ | — | $ | — | $ | 256 | $ | — | $ | — | $ | — | $ | 1,192 | ||||||||||||||||||
|
|
|
|
|
|
|
|
|
|
|
|
|
|
|
|
|
|
|
|||||||||||||||||||
| Ending balance: collectively evaluated for impairment |
$ | 17,646 | $ | 34,690 | $ | 3,424 | $ | 7,689 | $ | 4,725 | $ | 3,705 | $ | 4,173 | $ | 384 | $ | 76,436 | ||||||||||||||||||
|
|
|
|
|
|
|
|
|
|
|
|
|
|
|
|
|
|
|
|||||||||||||||||||
| Loans ending balance: |
||||||||||||||||||||||||||||||||||||
| Individually evaluated for impairment |
$ | 32,370 | $ | 7,641 | $ | — | $ | 11,658 | $ | 29,532 | $ | 6,555 | $ | — | $ | — | $ | 87,756 | ||||||||||||||||||
| Acquired with deteriorated credit quality |
3,571 | 6,459 | — | — | 3,421 | — | — | — | 13,451 | |||||||||||||||||||||||||||
| Collectively evaluated for impairment |
1,606,243 | 3,521,341 | 273,774 | 759,840 | 1,395,677 | 926,533 | 402,431 | — | 8,885,839 | |||||||||||||||||||||||||||
|
|
|
|
|
|
|
|
|
|
|
|
|
|
|
|
|
|
|
|||||||||||||||||||
| Total loans by group |
$ | 1,642,184 | $ | 3,535,441 | $ | 273,774 | $ | 771,498 | $ | 1,428,630 | $ | 933,088 | $ | 402,431 | $ | — | $ | 8,987,046 | ||||||||||||||||||
|
|
|
|
|
|
|
|
|
|
|
|
|
|
|
|
|
|
|
|||||||||||||||||||
F-32
Table of Contents
EASTERN BANK CORPORATION
NOTES TO CONSOLIDATED FINANCIAL STATEMENTS
| For the year ended December 31, 2018 | ||||||||||||||||||||||||||||||||||||
| Commercial and Industrial |
Commercial Real Estate |
Commercial Construction |
Business Banking |
Residential Real Estate |
Consumer Home Equity |
Other Consumer |
Other | Total | ||||||||||||||||||||||||||||
| (In thousands) | ||||||||||||||||||||||||||||||||||||
| Allowance for loan losses: |
||||||||||||||||||||||||||||||||||||
| Beginning balance |
$ | 14,892 | $ | 30,807 | $ | 5,588 | $ | 6,497 | $ | 6,954 | $ | 4,040 | $ | 4,751 | $ | 582 | $ | 74,111 | ||||||||||||||||||
| Charge-offs |
(3,646 | ) | (49 | ) | — | (6,345 | ) | (27 | ) | (285 | ) | (2,109 | ) | — | (12,461 | ) | ||||||||||||||||||||
| Recoveries |
2,753 | 132 | — | 375 | 152 | 60 | 433 | — | 3,905 | |||||||||||||||||||||||||||
| Provision (benefit) |
5,322 | 1,510 | (982 | ) | 7,640 | (20 | ) | 298 | 1,525 | (193 | ) | 15,100 | ||||||||||||||||||||||||
|
|
|
|
|
|
|
|
|
|
|
|
|
|
|
|
|
|
|
|||||||||||||||||||
| Ending balance |
$ | 19,321 | $ | 32,400 | $ | 4,606 | $ | 8,167 | $ | 7,059 | $ | 4,113 | $ | 4,600 | $ | 389 | $ | 80,655 | ||||||||||||||||||
|
|
|
|
|
|
|
|
|
|
|
|
|
|
|
|
|
|
|
|||||||||||||||||||
| Ending balance: individually evaluated for impairment |
$ | 1,361 | $ | 38 | $ | — | $ | 154 | $ | 1,804 | $ | 337 | $ | — | $ | — | $ | 3,694 | ||||||||||||||||||
|
|
|
|
|
|
|
|
|
|
|
|
|
|
|
|
|
|
|
|||||||||||||||||||
| Ending balance: acquired with deteriorated credit quality |
$ | 239 | $ | 181 | $ | — | $ | — | $ | 393 | $ | — | $ | — | $ | — | $ | 813 | ||||||||||||||||||
|
|
|
|
|
|
|
|
|
|
|
|
|
|
|
|
|
|
|
|||||||||||||||||||
| Ending balance: collectively evaluated for impairment |
$ | 17,721 | $ | 32,181 | $ | 4,606 | $ | 8,013 | $ | 4,862 | $ | 3,776 | $ | 4,600 | $ | 389 | $ | 76,148 | ||||||||||||||||||
|
|
|
|
|
|
|
|
|
|
|
|
|
|
|
|
|
|
|
|||||||||||||||||||
| Loans ending balance: |
||||||||||||||||||||||||||||||||||||
| Individually evaluated for impairment |
$ | 13,954 | $ | 10,579 | $ | — | $ | 7,704 | $ | 27,713 | $ | 4,948 | $ | — | $ | — | $ | 64,898 | ||||||||||||||||||
| Acquired with deteriorated credit quality |
4,904 | 7,853 | — | — | 4,134 | — | — | — | 16,891 | |||||||||||||||||||||||||||
| Collectively evaluated for impairment |
1,639,907 | 3,192,686 | 313,209 | 733,234 | 1,398,917 | 944,462 | 551,799 | — | 8,774,214 | |||||||||||||||||||||||||||
|
|
|
|
|
|
|
|
|
|
|
|
|
|
|
|
|
|
|
|||||||||||||||||||
| Total loans by group |
$ | 1,658,765 | $ | 3,211,118 | $ | 313,209 | $ | 740,938 | $ | 1,430,764 | $ | 949,410 | $ | 551,799 | $ | — | $ | 8,856,003 | ||||||||||||||||||
|
|
|
|
|
|
|
|
|
|
|
|
|
|
|
|
|
|
|
|||||||||||||||||||
Management uses a methodology to systematically estimate the amount of loss incurred in the portfolio. Commercial real estate, commercial and industrial, commercial construction and business banking loans are evaluated using a loan rating system, historical losses and other factors which form the basis for estimating incurred losses. Portfolios of more homogeneous populations of loans, including residential mortgages and consumer loans, are analyzed as groups taking into account delinquency ratios, historical loss experience and charge-offs. For the purpose of estimating the allowance for loan losses, management segregates the loan portfolio into the categories noted in the above tables. Each of these loan categories possess unique risk characteristics such as the purpose of the loan, repayment source, and collateral. These characteristics are considered when determining the appropriate level of the allowance for each category. Some examples of these risk characteristics unique to each loan category include:
Commercial Lending
Commercial and industrial: The primary risk associated with commercial and industrial loans is the ability of borrowers to achieve business results consistent with those projected at origination. Collateral frequently consists of a first lien position on business assets including, but not limited to accounts receivable, inventory, airplanes and equipment. The primary repayment source is operating cash flow and, secondarily, the liquidation of assets. The Company often obtains personal guarantees from individuals holding material ownership in the borrowing entity.
Commercial real estate: Collateral values are established by independent third-party appraisals and evaluations. Primary repayment sources include operating income generated by the real estate, permanent debt refinancing, sale of the real estate
F-33
Table of Contents
EASTERN BANK CORPORATION
NOTES TO CONSOLIDATED FINANCIAL STATEMENTS
and, secondarily, by liquidation of the collateral. The Company often obtains personal guarantees from individuals holding material ownership in the borrowing entity.
Commercial construction: These loans are generally considered to present a higher degree of risk than other real estate loans and may be affected by a variety of factors, such as adverse changes in interest rates and the borrower’s ability to control costs and adhere to time schedules. Construction loans are underwritten utilizing feasibility studies, independent appraisal reviews, sensitivity analysis of absorption and lease rates and financial analysis of the developers and property owners. Construction loans are generally based upon estimates of costs and value associated with the completed project. Construction loan repayment is substantially dependent on the ability of the borrower to complete the project and obtain permanent financing.
Business banking: These loans are typically secured by all business assets or commercial real estate. Business banking originations include traditionally underwritten loans as well as partially automated scored loans. Business banking scored loans are determined by utilizing the Company’s proprietary decision matrix that has a number of quantitative factors including, but not limited to, a guarantor’s credit score, industry risk, and time in business. The Company also engages in Small Business Association (“SBA”) lending, both in the business banking and commercial banking divisions. The SBA guarantees reduce the Company’s loss due to default and are considered a credit enhancement to the loan structure.
Residential Lending
Residential real estate: These loans are made to borrowers who demonstrate the ability to repay principal and interest on a monthly basis. Underwriting considerations include, among others, income sources and their reliability, willingness to repay as evidenced by credit repayment history, financial resources (including cash reserves) and the value of the collateral. The Company maintains policy standards for minimum credit score and cash reserves and maximum loan to value consistent with a “prime” portfolio. Collateral consists of mortgage liens on 1-4 family residential dwellings. The Company does not originate or purchase sub-prime or other high-risk loans. Residential loans are originated either for sale to investors or retained in the Company’s loan portfolio. Decisions about whether to sell or retain residential loans are made based on the interest rate characteristics, pricing for loans in the secondary mortgage market, competitive factors and the Company’s capital needs.
Consumer Lending
Consumer home equity: Home equity lines of credit are granted for ten years with monthly interest-only repayment requirements. Full principal repayment is required at the end of the ten-year draw period. Home equity loans are term loans that require the monthly payment of principal and interest such that the loan will be fully amortized at maturity. Underwriting considerations are materially consistent with those utilized in residential real estate. Collateral consists of a senior or subordinate lien on owner-occupied residential property.
Other consumer: The Company’s policy and underwriting in this category include the following factors, among others: income sources and reliability, credit histories, term of repayment, and collateral value, as applicable.
Other consumer: These are typically granted on an unsecured basis, with the exception of airplane loans.
Credit Quality
Commercial Lending Credit Quality
The Company monitors credit quality indicators and utilizes portfolio scorecards to assess the risk of its commercial portfolio. Specifically, the Company utilizes a 12-point credit risk-rating system to manage risk and identify potential problem loans. Risk-rating assignments are based upon a number of quantitative and qualitative factors that are under continual review. Factors include cash flow, collateral coverage, liquidity, leverage, position within the industry, internal controls and management, financial reporting, and other considerations. The risk-rating categories are defined as follows:
F-34
Table of Contents
EASTERN BANK CORPORATION
NOTES TO CONSOLIDATED FINANCIAL STATEMENTS
0 Risk Rating - Unrated
Certain segments of the portfolios are not rated. These segments include airplane loans, business banking scored loan products, and other commercial loans managed by exception. Loans within this unrated loan segment are monitored by delinquency status; and for lines of credit greater than $100,000 in exposure, an annual review is conducted. The Company supplements performance data with current credit scores for the business banking portfolio on a quarterly basis. Unrated loans managed outside of airplane loans and business banking loans are generally restricted to commercial exposure less than $1 million with a line of credit component restricted to $350,000. Loans included in this category have qualification requirements that include risk rating of 6W or better at time of recommendation for unrated status, acceptable management of deposit accounts, and no known negative changes in management, operations or financial performance. Restricted from this category are lines of credit managed with borrowing base requirements.
For purposes of estimating the allowance for loan losses, unrated loans are considered in the same manner as pass rated loans.
1-6W Risk Rating – Pass
Loans with a risk-rating of 1-6W are classified as “Pass” and are comprised of loans that range from “substantially risk free” which indicates borrowers of unquestioned credit standing, well-established national companies with a very strong financial condition, and loans fully secured by cash, through “acceptable risk” which indicates acceptable rated loans that may be experiencing weak cash flow, impending lease rollover or minor liquidity concerns. The top end of the risk-rating category (6W) includes loans that, although contain the same risk-rating as those with a rating of 6, are being more closely monitored to determine if a downgrade is necessary.
7 Risk Rating – Special Mention (Potential Weakness)
Loans to borrowers in this category exhibit potential weaknesses or downward trends deserving management’s close attention. While potentially weak, no loss of principal or interest is envisioned. Included in this category are borrowers who are performing as agreed, are weak when compared to industry standards, may be experiencing an interim loss and may be in declining industries. An element of asset quality, financial flexibility or management is below average. Management and owners may have limited depth, particularly when operating under strained circumstances. The Company does not consider borrowers within this category as new business prospects. Borrowers rated special mention may find it difficult to obtain alternative financing from traditional bank sources.
8 Risk Rating – Substandard (Well-Defined Weakness)
Loans with a risk-rating of 8 exhibit well-defined weaknesses that, if not corrected, may jeopardize the orderly liquidation of the debt. A loan is classified as substandard if it is inadequately protected by the repayment capacity of the obligor or by the collateral pledged. Specifically, repayment under market rates and terms, or by the requirements under the existing loan documents, is in jeopardy, but no loss of principal or interest is envisioned. There is a possibility that a partial loss of principal and/or interest will occur in the future if the deficiencies are not corrected. Loss potential, while existing in the aggregate portfolio of substandard assets, does not have to exist in individual assets classified as substandard. Credits in this category often may have reported a loss in the most recent fiscal year end and are likely to continue to report losses in the interim period, or interim losses are expected to result in a fiscal year-end loss. Nonaccrual is possible, but not mandatory, in this class.
9 Risk Rating – Doubtful (Loss Probably)
Loans classified as doubtful have comparable weaknesses as found in the loans classified as substandard with the added provision that such weaknesses make collection of the debt in full (based on currently existing facts, conditions and values) highly questionable and improbable. Serious problems exist such that partial loss of principal is likely. The probability of loss exceeds 50%, however, because of reasonably specific pending factors that may work to strengthen the credit, estimated losses are deferred until a more exact status can be determined. Pending factors may include the sale of the company, a merger, capital injection, new profitable purchase orders, and refinancing plans. Specific reserves will be the amount identified after specific review. Nonaccrual is mandatory in this class.
F-35
Table of Contents
EASTERN BANK CORPORATION
NOTES TO CONSOLIDATED FINANCIAL STATEMENTS
10 Risk Rating – Loss
Loans to borrowers in this category are deemed incapable of repayment. Loans to such borrowers are considered uncollectable and of such little value that continuance as active assets of the Company is not warranted. This classification does not mean that the loans have no recovery or salvage value, but rather, it is not practical or desirable to defer writing off these assets even though partial recovery may occur in the future. Loans in this category have a recorded investment of $0 at the time of the downgrade.
The credit quality of the commercial loan portfolio is actively monitored and supported by a comprehensive credit approval process; and all large dollar transactions are sent for approval to a committee of seasoned business line and credit professionals. Risk ratings are periodically reviewed and the Company maintains an independent credit risk review function that reports directly to the Risk Management Committee of the Board of Directors. Credits that demonstrate significant deterioration in credit quality are transferred to a specialized group of seasoned workout officers for individual attention.
The following table details the internal risk-rating categories for the Company’s commercial and industrial, commercial real estate, commercial construction and business banking portfolios:
| As of March 31, 2020 | ||||||||||||||||||||||||
| (Unaudited) | ||||||||||||||||||||||||
| Category |
Risk Rating |
Commercial and Industrial |
Commercial Real Estate |
Commercial Construction |
Business Banking |
Total | ||||||||||||||||||
| (Dollars in thousands) | ||||||||||||||||||||||||
| Unrated |
0 | $ | 138,003 | $ | 43,087 | $ | 331 | $ | 441,266 | $ | 622,687 | |||||||||||||
| Pass |
1-6W | 1,420,104 | 3,202,991 | 261,873 | 298,902 | 5,183,870 | ||||||||||||||||||
| Special mention |
7 | 149,012 | 254,073 | 27,356 | 32,231 | 462,672 | ||||||||||||||||||
| Substandard |
8 | 37,972 | 20,485 | 3,575 | 7,517 | 69,549 | ||||||||||||||||||
| Doubtful |
9 | 26,031 | 3,085 | — | — | 29,116 | ||||||||||||||||||
| Loss |
10 | — | — | — | — | — | ||||||||||||||||||
|
|
|
|
|
|
|
|
|
|
|
|||||||||||||||
| Total |
$ | 1,771,122 | $ | 3,523,721 | $ | 293,135 | $ | 779,916 | $ | 6,367,894 | ||||||||||||||
|
|
|
|
|
|
|
|
|
|
|
|||||||||||||||
| As of December 31, | ||||||||||||||||||||||||||||||||||||||||||||
| Commercial and Industrial |
Commercial Real Estate |
Commercial Construction |
Business Banking | Total | ||||||||||||||||||||||||||||||||||||||||
| Category |
Risk Rating |
2019 | 2018 | 2019 | 2018 | 2019 | 2018 | 2019 | 2018 | 2019 | 2018 | |||||||||||||||||||||||||||||||||
| (Dollars in thousands) | ||||||||||||||||||||||||||||||||||||||||||||
| Unrated |
0 | $ | 150,226 | $ | 185,265 | $ | 48,266 | $ | 50,785 | $ | 331 | $ | — | $ | 445,201 | $ | 441,757 | $ | 644,024 | $ | 677,807 | |||||||||||||||||||||||
| Pass |
1-6W | 1,405,902 | 1,415,249 | 3,436,267 | 3,105,149 | 260,615 | 288,327 | 315,194 | 288,136 | 5,417,978 | 5,096,861 | |||||||||||||||||||||||||||||||||
| Special mention |
7 | 24,171 | 30,880 | 28,606 | 34,031 | 9,438 | 22,061 | 2,006 | 6,632 | 64,221 | 93,604 | |||||||||||||||||||||||||||||||||
| Substandard |
8 | 42,894 | 21,042 | 21,635 | 20,598 | 3,390 | 2,821 | 8,207 | 4,413 | 76,126 | 48,874 | |||||||||||||||||||||||||||||||||
| Doubtful |
9 | 18,991 | 6,329 | 667 | 555 | — | — | 890 | — | 20,548 | 6,884 | |||||||||||||||||||||||||||||||||
| Loss |
10 | — | — | — | — | — | — | — | — | — | — | |||||||||||||||||||||||||||||||||
|
|
|
|
|
|
|
|
|
|
|
|
|
|
|
|
|
|
|
|
|
|||||||||||||||||||||||||
| Total |
$ | 1,642,184 | $ | 1,658,765 | $ | 3,535,441 | $ | 3,211,118 | $ | 273,774 | $ | 313,209 | $ | 771,498 | $ | 740,938 | $ | 6,222,897 | $ | 5,924,030 | ||||||||||||||||||||||||
|
|
|
|
|
|
|
|
|
|
|
|
|
|
|
|
|
|
|
|
|
|||||||||||||||||||||||||
Residential and Consumer Lending Credit Quality
For the Company’s residential and consumer portfolios, the quality of the loan is best indicated by the repayment performance of an individual borrower. Updated appraisals, broker opinions of value and other collateral valuation methods are employed in the residential and consumer portfolios, typically for credits that are deteriorating. Delinquency status is determined using payment performance, while accrual status may be determined using a combination of payment performance, expected borrower viability and collateral value. Delinquent consumer loans are handled by a team of seasoned collection specialists.
F-36
Table of Contents
Asset Quality
The Company manages its loan portfolio with careful monitoring. As a general rule, loans more than 90 days past due with respect to principal and interest are classified as nonaccrual loans. Exceptions may be made if management believes that collateral held by the Company is clearly sufficient and in full satisfaction of both principal and interest, or the loan is accounted for as a PCI loan. Therefore, as permitted by banking regulations, certain consumer loans past due 90 days or more may continue to accrue interest. The Company may also use discretion regarding other loans over 90 days delinquent if the loan is well secured and in the process of collection. Nonaccrual loans and loans that are more than 90 days past due but still accruing interest are considered nonperforming loans.
Nonaccrual loans may be returned to an accrual status when principal and interest payments are no longer delinquent, and the risk characteristics of the loan have improved to the extent that there no longer exists a concern as to the collectability of principal and interest. Loans are considered past due based upon the number of days delinquent according to their contractual terms. Specifically, nonaccrual residential loans that have been restructured must perform for a period of six months before being considered for accrual status.
A loan is expected to remain on nonaccrual status until it becomes current with respect to principal and interest, the loan is liquidated, or the loan is determined to be uncollectible and is charged-off against the allowance for loan losses.
The following is a summary pertaining to the breakdown of the Company’s nonaccrual loans:
| As of March 31, | As of December 31, | |||||||||||
| 2020 | 2019 | 2018 | ||||||||||
| (Unaudited) | ||||||||||||
| (In thousands) | ||||||||||||
| Commercial and industrial |
$ | 26,389 | $ | 21,471 | $ | 6,551 | ||||||
| Commercial real estate |
4,534 | 4,120 | 3,344 | |||||||||
| Commercial construction |
— | — | — | |||||||||
| Business banking |
7,131 | 8,502 | 7,704 | |||||||||
| Residential real estate |
5,594 | 5,598 | 5,535 | |||||||||
| Consumer home equity |
3,409 | 2,137 | 2,461 | |||||||||
| Other consumer |
676 | 623 | 577 | |||||||||
|
|
|
|
|
|
|
|||||||
| Total nonaccrual loans |
$ | 47,733 | $ | 42,451 | $ | 26,172 | ||||||
|
|
|
|
|
|
|
|||||||
The following table shows the age analysis of past due loans as of the dates indicated:
| March 31, 2020 | ||||||||||||||||||||||||||||
| (Unaudited) | ||||||||||||||||||||||||||||
| 30-59 Days Past Due |
60-89 Days Past Due |
90 Days or More |
Total Past Due |
Current | Total Loans |
Recorded Investment > 90 Days and Accruing |
||||||||||||||||||||||
| (Dollars in thousands) | ||||||||||||||||||||||||||||
| Commercial and industrial |
$ | 1,178 | $ | 522 | $ | 392 | $ | 2,092 | $ | 1,769,030 | $ | 1,771,122 | $ | — | ||||||||||||||
| Commercial real estate |
497 | 1,264 | 1,558 | 3,319 | 3,520,402 | 3,523,721 | 1,345 | |||||||||||||||||||||
| Commercial construction |
1,886 | — | — | 1,886 | 291,249 | 293,135 | — | |||||||||||||||||||||
| Business banking |
6,759 | 1,514 | 5,482 | 13,755 | 766,161 | 779,916 | — | |||||||||||||||||||||
| Residential real estate |
12,747 | 3,692 | 2,848 | 19,287 | 1,400,716 | 1,420,003 | — | |||||||||||||||||||||
| Consumer home equity |
3,148 | 710 | 1,492 | 5,350 | 924,204 | 929,554 | 9 | |||||||||||||||||||||
| Other consumer |
3,775 | 546 | 676 | 4,997 | 364,655 | 369,652 | — | |||||||||||||||||||||
|
|
|
|
|
|
|
|
|
|
|
|
|
|
|
|||||||||||||||
| Total |
$ | 29,990 | $ | 8,248 | $ | 12,448 | $ | 50,686 | $ | 9,036,417 | $ | 9,087,103 | $ | 1,354 | ||||||||||||||
|
|
|
|
|
|
|
|
|
|
|
|
|
|
|
|||||||||||||||
F-37
Table of Contents
| December 31, 2019 | ||||||||||||||||||||||||||||
| 30-59 Days Past Due |
60-89 Days Past Due |
90 Days or More |
Total Past Due |
Current | Total Loans |
Recorded Investment > 90 Days and Accruing |
||||||||||||||||||||||
| (Dollars in thousands) | ||||||||||||||||||||||||||||
| Commercial and industrial |
$ | 1,407 | $ | — | $ | 963 | $ | 2,370 | $ | 1,639,814 | $ | 1,642,184 | $ | — | ||||||||||||||
| Commercial real estate |
1,290 | 100 | 1,856 | 3,246 | 3,532,195 | 3,535,441 | 1,315 | |||||||||||||||||||||
| Commercial construction |
— | — | — | — | 273,774 | 273,774 | — | |||||||||||||||||||||
| Business banking |
3,031 | 763 | 6,095 | 9,889 | 761,609 | 771,498 | — | |||||||||||||||||||||
| Residential real estate |
14,030 | 2,563 | 3,030 | 19,623 | 1,409,007 | 1,428,630 | — | |||||||||||||||||||||
| Consumer home equity |
2,497 | 430 | 1,636 | 4,563 | 928,525 | 933,088 | 9 | |||||||||||||||||||||
| Other consumer |
3,451 | 514 | 579 | 4,544 | 397,887 | 402,431 | — | |||||||||||||||||||||
|
|
|
|
|
|
|
|
|
|
|
|
|
|
|
|||||||||||||||
| Total |
$ | 25,706 | $ | 4,370 | $ | 14,159 | $ | 44,235 | $ | 8,942,811 | $ | 8,987,046 | $ | 1,324 | ||||||||||||||
|
|
|
|
|
|
|
|
|
|
|
|
|
|
|
|||||||||||||||
| December 31, 2018 | ||||||||||||||||||||||||||||
| 30-59 Days Past Due |
60-89 Days Past Due |
90 Days or More |
Total Past Due |
Current | Total Loans |
Recorded Investment > 90 Days and Accruing |
||||||||||||||||||||||
| (Dollars in thousands) | ||||||||||||||||||||||||||||
| Commercial and industrial |
$ | 296 | $ | 526 | $ | 2,326 | $ | 3,148 | $ | 1,655,617 | $ | 1,658,765 | $ | — | ||||||||||||||
| Commercial real estate |
2,547 | — | 2,069 | 4,616 | 3,206,502 | 3,211,118 | 410 | |||||||||||||||||||||
| Commercial construction |
— | — | — | — | 313,209 | 313,209 | — | |||||||||||||||||||||
| Business banking |
3,328 | 885 | 5,114 | 9,327 | 731,611 | 740,938 | — | |||||||||||||||||||||
| Residential real estate |
16,003 | 3,493 | 3,109 | 22,605 | 1,408,159 | 1,430,764 | — | |||||||||||||||||||||
| Consumer home equity |
3,449 | 811 | 2,392 | 6,652 | 942,758 | 949,410 | 9 | |||||||||||||||||||||
| Other consumer |
3,435 | 460 | 437 | 4,332 | 547,467 | 551,799 | — | |||||||||||||||||||||
|
|
|
|
|
|
|
|
|
|
|
|
|
|
|
|||||||||||||||
| Total |
$ | 29,058 | $ | 6,175 | $ | 15,447 | $ | 50,680 | $ | 8,805,323 | $ | 8,856,003 | $ | 419 | ||||||||||||||
|
|
|
|
|
|
|
|
|
|
|
|
|
|
|
|||||||||||||||
In the normal course of business, the Company may become aware of possible credit problems in which borrowers exhibit potential for the inability to comply with the contractual terms of their loans, but which currently do not yet meet the criteria for classification as nonperforming loans. However, based upon the Company’s past experiences, some of these loans with potential weaknesses will ultimately be restructured or placed in non-accrual status.
Troubled Debt Restructurings
In cases where a borrower experiences financial difficulty and the Company makes certain concessionary modifications to contractual terms, the loan is classified as a troubled debt restructured loan. The objective is to aid in the resolution of nonperforming loans by modifying the contractual obligation to avoid the possibility of foreclosure.
All TDR loans are considered impaired and therefore are subject to a specific review for impairment loss. The amount of impairment loss, if any, is recorded as a specific loss allocation to each individual loan in the allowance for loan losses. Commercial loans and residential loans that have been classified as TDRs and which subsequently default are reviewed to determine if the loan should be deemed collateral dependent. In such an instance, any shortfall between the value of the collateral and the book value of the loan is determined by measuring the recorded investment in the loan against the fair value of the collateral less costs to sell.
The Company’s policy is to have any TDR loans which are on nonaccrual status prior to being modified remain on nonaccrual status for approximately six months subsequent to being modified before management considers its return to accrual status. If the TDR loan is on accrual status prior to being modified, it is reviewed to determine if the modified loan should remain on accrual status.
F-38
Table of Contents
EASTERN BANK CORPORATION
NOTES TO CONSOLIDATED FINANCIAL STATEMENTS
The following table shows the TDR loans on accrual and nonaccrual status as of the dates indicated:
| March 31, 2020 | ||||||||||||||||||||||||
| (Unaudited) | ||||||||||||||||||||||||
| TDRs on Accrual Status | TDRs on Nonaccrual Status | Total TDRs | ||||||||||||||||||||||
| Number of Loans |
Balance of Loans |
Number of Loans |
Balance of Loans |
Number of Loans |
Balance of Loans |
|||||||||||||||||||
| (Dollars in thousands) | ||||||||||||||||||||||||
| Commercial and industrial |
2 | $ | 6,034 | 15 | $ | 24,721 | 17 | $ | 30,755 | |||||||||||||||
| Commercial real estate |
1 | 3,520 | 3 | 3,270 | 4 | 6,790 | ||||||||||||||||||
| Commercial construction |
— | — | — | — | — | — | ||||||||||||||||||
| Business banking |
2 | 3,127 | 1 | 183 | 3 | 3,310 | ||||||||||||||||||
| Residential real estate |
153 | 24,897 | 25 | 4,062 | 178 | 28,959 | ||||||||||||||||||
| Consumer home equity |
89 | 4,279 | 9 | 2,001 | 98 | 6,280 | ||||||||||||||||||
| Other consumer |
1 | 23 | — | — | 1 | 23 | ||||||||||||||||||
|
|
|
|
|
|
|
|
|
|
|
|
|
|||||||||||||
| Total |
248 | $ | 41,880 | 53 | $ | 34,237 | 301 | $ | 76,117 | |||||||||||||||
|
|
|
|
|
|
|
|
|
|
|
|
|
|||||||||||||
| December 31, 2019 | ||||||||||||||||||||||||
| TDRs on Accrual Status | TDRs on Nonaccrual Status | Total TDRs | ||||||||||||||||||||||
| Number of Loans |
Balance of Loans |
Number of Loans |
Balance of Loans |
Number of Loans |
Balance of Loans |
|||||||||||||||||||
| (Dollars in thousands) | ||||||||||||||||||||||||
| Commercial and industrial |
4 | $ | 10,899 | 14 | $ | 19,781 | 18 | $ | 30,680 | |||||||||||||||
| Commercial real estate |
1 | 3,520 | 3 | 3,338 | 4 | 6,858 | ||||||||||||||||||
| Commercial construction |
— | — | — | — | — | — | ||||||||||||||||||
| Business banking |
2 | 3,156 | 1 | 204 | 3 | 3,360 | ||||||||||||||||||
| Residential real estate |
152 | 25,093 | 27 | 3,977 | 179 | 29,070 | ||||||||||||||||||
| Consumer home equity |
89 | 5,955 | 5 | 600 | 94 | 6,555 | ||||||||||||||||||
|
|
|
|
|
|
|
|
|
|
|
|
|
|||||||||||||
| Total |
248 | $ | 48,623 | 50 | $ | 27,900 | 298 | $ | 76,523 | |||||||||||||||
|
|
|
|
|
|
|
|
|
|
|
|
|
|||||||||||||
| December 31, 2018 | ||||||||||||||||||||||||
| TDRs on Accrual Status | TDRs on Nonaccrual Status | Total TDRs | ||||||||||||||||||||||
| Number of Loans |
Balance of Loans |
Number of Loans |
Balance of Loans |
Number of Loans |
Balance of Loans |
|||||||||||||||||||
| (Dollars in thousands) | ||||||||||||||||||||||||
| Commercial and industrial |
3 | $ | 5,580 | 7 | $ | 4,184 | 10 | $ | 9,764 | |||||||||||||||
| Commercial real estate |
2 | 7,236 | 2 | 239 | 4 | 7,475 | ||||||||||||||||||
| Commercial construction |
— | — | — | — | — | — | ||||||||||||||||||
| Business banking |
— | — | 1 | 288 | 1 | 288 | ||||||||||||||||||
| Residential real estate |
133 | 24,033 | 25 | 3,104 | 158 | 27,137 | ||||||||||||||||||
| Consumer home equity |
62 | 4,616 | 7 | 332 | 69 | 4,948 | ||||||||||||||||||
|
|
|
|
|
|
|
|
|
|
|
|
|
|||||||||||||
| Total |
200 | $ | 41,465 | 42 | $ | 8,147 | 242 | $ | 49,612 | |||||||||||||||
|
|
|
|
|
|
|
|
|
|
|
|
|
|||||||||||||
The amount of specific reserve associated with the TDRs was $5.1 million, $3.2 million and $2.9 million at March 31, 2020 (unaudited) and December 31, 2019 and 2018, respectively. During the three months ended March 31, 2020 (unaudited) and the years ended December 31, 2019 and 2018, $0.2 million, $0.3 million and $0.5 million, respectively, in TDRs moved from nonaccrual to accrual. The amount of additional commitments to lend to borrowers who have been a party to a TDR was $0, $2.5 million and $0 at March 31, 2020 (unaudited) and December 31, 2019 and 2018, respectively.
F-39
Table of Contents
EASTERN BANK CORPORATION
NOTES TO CONSOLIDATED FINANCIAL STATEMENTS
The following table shows the modifications which occurred during the periods and the change in the recorded investment subsequent to the modifications occurring:
| Three Months Ended March 31, 2020 | Year Ended December 31, 2019 | Year Ended December 31, 2018 | ||||||||||||||||||||||||||||||||||
| (Unaudited) | ||||||||||||||||||||||||||||||||||||
| Number of Contracts |
Pre- Modification Outstanding Recorded Investment |
Post- Modification Outstanding Recorded Investment (1) |
Number of Contracts |
Pre- Modification Outstanding Recorded Investment |
Post- Modification Outstanding Recorded Investment (1) |
Number of Contracts |
Pre- Modification Outstanding Recorded Investment |
Post- Modification Outstanding Recorded Investment (1) |
||||||||||||||||||||||||||||
| (Dollars in thousands) | ||||||||||||||||||||||||||||||||||||
| Troubled debt restructurings: |
||||||||||||||||||||||||||||||||||||
| Commercial and industrial |
— | $ | — | $ | — | 16 | $ | 18,912 | $ | 19,212 | 7 | $ | 5,926 | $ | 6,786 | |||||||||||||||||||||
| Commercial real estate |
— | — | — | 2 | 3,277 | 3,277 | — | — | — | |||||||||||||||||||||||||||
| Commercial construction |
— | — | — | — | — | — | — | — | — | |||||||||||||||||||||||||||
| Business banking |
1 | 244 | 244 | 2 | 3,184 | 3,184 | — | — | — | |||||||||||||||||||||||||||
| Residential real estate |
8 | 414 | 419 | 11 | 2,659 | 2,696 | 14 | 2,235 | 2,278 | |||||||||||||||||||||||||||
| Consumer home equity |
1 | 24 | 24 | 9 | 2,053 | 2,392 | 10 | 1,122 | 1,128 | |||||||||||||||||||||||||||
|
|
|
|
|
|
|
|
|
|
|
|
|
|
|
|
|
|
|
|||||||||||||||||||
| Total |
10 | $ | 682 | $ | 687 | 40 | $ | 30,085 | $ | 30,761 | 31 | $ | 9,283 | $ | 10,192 | |||||||||||||||||||||
|
|
|
|
|
|
|
|
|
|
|
|
|
|
|
|
|
|
|
|||||||||||||||||||
| (1) | The post-modification balances represent the balance of the loan on the date of modification. These amounts may show an increase when modification includes capitalization of interest. |
At March 31, 2020 (unaudited) and December 31, 2019, the outstanding recorded investment of loans that were new to TDR during the period were $0.7 million and $36.2 million, respectively.
The following table shows the Company’s post-modification balance of TDRs listed by type of modification during the periods indicated:
| Three Months Ended March 31, |
Year Ended December 31, |
|||||||||||||||
| 2020 | 2019 | 2019 | 2018 | |||||||||||||
| (Unaudited) | ||||||||||||||||
| (In Thousands) | ||||||||||||||||
| Adjusted interest rate and extended maturity |
$ | — | $ | — | $ | 1,513 | $ | 1,338 | ||||||||
| Adjusted interest rate and principal deferred |
— | 321 | — | 715 | ||||||||||||
| Adjusted interest rate |
— | — | 3,352 | 676 | ||||||||||||
| Interest only/principal deferred |
— | — | 2,769 | 5,926 | ||||||||||||
| Extended maturity and interest only/principal deferred |
46 | — | — | 677 | ||||||||||||
| Additional underwriting - increased exposure |
— | — | 10,822 | — | ||||||||||||
| Subordination |
— | 11,032 | — | |||||||||||||
| Other |
641 | — | 1,273 | 860 | ||||||||||||
|
|
|
|
|
|
|
|
|
|||||||||
| Total |
$ | 687 | $ | 321 | $ | 30,761 | $ | 10,192 | ||||||||
|
|
|
|
|
|
|
|
|
|||||||||
F-40
Table of Contents
EASTERN BANK CORPORATION
NOTES TO CONSOLIDATED FINANCIAL STATEMENTS
The following table shows the loans that have been modified during the prior 12 months which have subsequently defaulted during the periods indicated. The Company considers a loan to have defaulted when it reaches 90 days past due or is transferred to nonaccrual:
| For the Three Months Ended March 31, | Year Ended December 31, | |||||||||||||||||||||||||||||||
| 2020 | 2019 | 2019 | 2018 | |||||||||||||||||||||||||||||
| (Unaudited) | ||||||||||||||||||||||||||||||||
| Number of Contracts |
Recorded Investment |
Number of Contracts |
Recorded Investment |
Number of Contracts |
Recorded Investment |
Number of Contracts |
Recorded Investment |
|||||||||||||||||||||||||
| (Dollars in thousands) |
||||||||||||||||||||||||||||||||
| Troubled debt restructurings that subsequently defaulted(1): |
||||||||||||||||||||||||||||||||
| Commercial and industrial |
2 | $ | 4,613 | — | $ | — | 10 | $ | 18,808 | — | $ | — | ||||||||||||||||||||
| Commercial real estate |
— | — | — | — | 2 | 3,125 | — | — | ||||||||||||||||||||||||
| Commercial construction |
— | — | — | — | — | — | — | — | ||||||||||||||||||||||||
| Consumer home equity |
1 | 1,335 | — | — | — | — | 1 | 116 | ||||||||||||||||||||||||
| Residential real estate |
— | — | — | — | — | — | 1 | 144 | ||||||||||||||||||||||||
|
|
|
|
|
|
|
|
|
|
|
|
|
|
|
|
|
|
|
|||||||||||||||
| Total |
3 | $ | 5,948 | — | $ | — | 12 | $ | 21,933 | 2 | $ | 260 | ||||||||||||||||||||
|
|
|
|
|
|
|
|
|
|
|
|
|
|
|
|
|
|
|
|||||||||||||||
| (1) | This table does not reflect any TDRs which were charged off during the periods indicated. |
During the year ended December 31, 2019, there were no TDR loans modified in the prior 12 months that were subsequently charged off. During the three months ended March 31, 2020 and 2019 (unaudited) and the year ended December 31, 2018, the total amount of TDRs that were modified in the prior 12 months and subsequently charged off was $0.4 million, $3.0 million and $1.5 million, respectively.
Impaired Loans
Impaired loans consist of all loans for which management has determined it is probable the Company will be unable to collect all amounts due according to the contractual terms of the loan agreements. Factors considered by management in determining impairment include payment status, collateral value, and the probability of collecting scheduled principal and interest payments when due.
The Company measures impairment of loans using a discounted cash flow method, the loan’s observable market price, or the fair value of the collateral if the loan is collateral dependent. The Company has defined the population of impaired loans to include certain nonaccrual loans, TDR loans and residential and home equity loans that have been partially charged off.
The following is a summary of information pertaining to the Company’s impaired loans as of the dates indicated:
| March 31, 2020 | ||||||||||||||||||||||||
| (Unaudited) | ||||||||||||||||||||||||
| Recorded Investment |
Unpaid Principal Balance |
Related Allowance |
Average Recorded Investment |
Total Interest Recognized |
Interest Income Recognized Using Cash Basis |
|||||||||||||||||||
| (Dollars in thousands) | ||||||||||||||||||||||||
| With no related allowance recorded: |
||||||||||||||||||||||||
| Commercial and industrial |
$ | 17,441 | $ | 18,287 | $ | — | $ | 20,880 | $ | 70 | $ | — | ||||||||||||
| Commercial real estate |
7,461 | 7,762 | — | 7,491 | 44 | — | ||||||||||||||||||
| Commercial construction |
— | — | — | — | — | — | ||||||||||||||||||
| Business banking |
2,060 | 3,352 | — | 2,286 | 17 | — | ||||||||||||||||||
| Residential real estate |
16,399 | 17,340 | — | 14,801 | 153 | 20 | ||||||||||||||||||
| Consumer home equity |
3,504 | 3,728 | — | 3,606 | 37 | 3 | ||||||||||||||||||
| Other consumer |
23 | 23 | — | 23 | — | — | ||||||||||||||||||
|
|
|
|
|
|
|
|
|
|
|
|
|
|||||||||||||
| Sub-total |
46,888 | 50,492 | — | 49,087 | 321 | 23 | ||||||||||||||||||
|
|
|
|
|
|
|
|
|
|
|
|
|
|||||||||||||
| With an allowance recorded: |
||||||||||||||||||||||||
| Commercial and industrial |
14,982 | 15,249 | 4,037 | 11,730 | — | — | ||||||||||||||||||
| Commercial real estate |
593 | 596 | 270 | 348 | — | — | ||||||||||||||||||
| Commercial construction |
— | — | — | — | — | — | ||||||||||||||||||
| Business banking |
8,198 | 12,309 | 453 | 8,782 | 15 | — | ||||||||||||||||||
| Residential real estate |
12,994 | 13,738 | 1,275 | 11,727 | 121 | 16 | ||||||||||||||||||
F-41
Table of Contents
EASTERN BANK CORPORATION
NOTES TO CONSOLIDATED FINANCIAL STATEMENTS
| March 31, 2020 | ||||||||||||||||||||||||
| (Unaudited) | ||||||||||||||||||||||||
| Recorded Investment |
Unpaid Principal Balance |
Related Allowance |
Average Recorded Investment |
Total Interest Recognized |
Interest Income Recognized Using Cash Basis |
|||||||||||||||||||
| (Dollars in thousands) | ||||||||||||||||||||||||
| Consumer home equity |
2,776 | 2,953 | 221 | 2,857 | 29 | 2 | ||||||||||||||||||
| Other consumer |
— | — | — | — | — | — | ||||||||||||||||||
|
|
|
|
|
|
|
|
|
|
|
|
|
|||||||||||||
| Sub-total |
39,543 | 44,845 | 6,256 | 35,444 | 165 | 18 | ||||||||||||||||||
|
|
|
|
|
|
|
|
|
|
|
|
|
|||||||||||||
| Total |
$ | 86,431 | $ | 95,337 | $ | 6,256 | $ | 84,531 | $ | 486 | $ | 41 | ||||||||||||
|
|
|
|
|
|
|
|
|
|
|
|
|
|||||||||||||
| March 31, 2019 | ||||||||||||||||||||||||
| (Unaudited) | ||||||||||||||||||||||||
| Recorded Investment |
Unpaid Principal Balance |
Related Allowance |
Average Recorded Investment |
Total Interest Recognized |
Interest Income Recognized Using Cash Basis |
|||||||||||||||||||
| (Dollars in thousands) | ||||||||||||||||||||||||
| With no related allowance recorded: |
||||||||||||||||||||||||
| Commercial and industrial |
$ | 8,977 | $ | 9,587 | $ | — | $ | 10,664 | $ | 80 | $ | — | ||||||||||||
| Commercial real estate |
12,051 | 12,270 | — | 10,909 | 116 | — | ||||||||||||||||||
| Commerical construction |
— | — | — | — | — | — | ||||||||||||||||||
| Business banking |
1,178 | 2,446 | — | 1,199 | — | — | ||||||||||||||||||
| Residential real estate |
11,423 | 12,177 | — | 10,373 | 105 | 11 | ||||||||||||||||||
| Consumer home equity |
2,047 | 2,059 | — | 1,895 | 23 | 1 | ||||||||||||||||||
| Other consumer |
— | — | — | — | — | — | ||||||||||||||||||
|
|
|
|
|
|
|
|
|
|
|
|
|
|||||||||||||
| Sub-total |
35,676 | 38,539 | — | 35,040 | 324 | 12 | ||||||||||||||||||
|
|
|
|
|
|
|
|
|
|
|
|
|
|||||||||||||
| With an allowance recorded: |
||||||||||||||||||||||||
| Commercial and industrial |
2,848 | 4,521 | 1,354 | 2,873 | — | — | ||||||||||||||||||
| Commercial real estate |
90 | 90 | 40 | 90 | — | — | ||||||||||||||||||
| Commerical construction |
— | — | — | — | — | — | ||||||||||||||||||
| Business banking |
7,236 | 11,077 | 221 | 6,561 | — | — | ||||||||||||||||||
| Residential real estate |
15,737 | 16,755 | 1,901 | 14,290 | 145 | 15 | ||||||||||||||||||
| Consumer home equity |
2,820 | 2,837 | 355 | 2,610 | 32 | 1 | ||||||||||||||||||
| Other consumer |
242 | 242 | 19 | 242 | — | — | ||||||||||||||||||
|
|
|
|
|
|
|
|
|
|
|
|
|
|||||||||||||
| Sub-total |
28,973 | 35,522 | 3,890 | 26,666 | 177 | 16 | ||||||||||||||||||
|
|
|
|
|
|
|
|
|
|
|
|
|
|||||||||||||
| Total |
$ | 64,649 | $ | 74,061 | $ | 3,890 | $ | 61,706 | $ | 501 | $ | 28 | ||||||||||||
|
|
|
|
|
|
|
|
|
|
|
|
|
|||||||||||||
| December 31, 2019 | ||||||||||||||||||||||||
| Recorded Investment |
Unpaid Principal Balance |
Related Allowance |
Average Recorded Investment |
Total Interest Recognized |
Interest Income Recognized Using Cash Basis |
|||||||||||||||||||
| (Dollars in thousands) | ||||||||||||||||||||||||
| With no related allowance recorded: |
||||||||||||||||||||||||
| Commercial and industrial |
$ | 22,074 | $ | 22,819 | $ | — | $ | 17,695 | $ | 615 | $ | — | ||||||||||||
| Commercial real estate |
7,553 | 7,808 | — | 9,987 | 179 | — | ||||||||||||||||||
| Commercial construction |
— | — | — | — | — | — | ||||||||||||||||||
| Business banking |
2,738 | 4,062 | — | 2,072 | 70 | — | ||||||||||||||||||
| Residential real estate |
16,517 | 17,858 | — | 15,501 | 603 | 68 | ||||||||||||||||||
| Consumer home equity |
3,666 | 3,697 | — | 2,869 | 121 | 3 | ||||||||||||||||||
|
|
|
|
|
|
|
|
|
|
|
|
|
|||||||||||||
| Sub-total |
52,548 | 56,244 | — | 48,124 | 1,588 | 71 | ||||||||||||||||||
|
|
|
|
|
|
|
|
|
|
|
|
|
|||||||||||||
F-42
Table of Contents
EASTERN BANK CORPORATION
NOTES TO CONSOLIDATED FINANCIAL STATEMENTS
| December 31, 2019 | ||||||||||||||||||||||||
| Recorded Investment |
Unpaid Principal Balance |
Related Allowance |
Average Recorded Investment |
Total Interest Recognized |
Interest Income Recognized Using Cash Basis |
|||||||||||||||||||
| (Dollars in thousands) | ||||||||||||||||||||||||
| With an allowance recorded: |
||||||||||||||||||||||||
| Commercial and industrial |
10,296 | 10,503 | 2,337 | 6,141 | — | — | ||||||||||||||||||
| Commercial real estate |
88 | 90 | 40 | 391 | — | — | ||||||||||||||||||
| Commercial construction |
— | — | — | — | — | — | ||||||||||||||||||
| Business banking |
8,920 | 13,176 | 571 | 7,730 | 86 | — | ||||||||||||||||||
| Residential real estate |
13,015 | 14,072 | 1,399 | 12,215 | 475 | 53 | ||||||||||||||||||
| Consumer home equity |
2,889 | 2,913 | 322 | 2,261 | 96 | 3 | ||||||||||||||||||
|
|
|
|
|
|
|
|
|
|
|
|
|
|||||||||||||
| Sub-total |
35,208 | 40,754 | 4,669 | 28,738 | 657 | 56 | ||||||||||||||||||
|
|
|
|
|
|
|
|
|
|
|
|
|
|||||||||||||
| Total |
$ | 87,756 | $ | 96,998 | $ | 4,669 | $ | 76,862 | $ | 2,245 | $ | 127 | ||||||||||||
|
|
|
|
|
|
|
|
|
|
|
|
|
|||||||||||||
| December 31, 2018 | ||||||||||||||||||||||||
| Recorded Investment |
Unpaid Principal Balance |
Related Allowance |
Average Recorded Investment |
Total Interest Recognized |
Interest Income Recognized Using Cash Basis |
|||||||||||||||||||
| (Dollars in thousands) | ||||||||||||||||||||||||
| With no related allowance recorded: |
||||||||||||||||||||||||
| Commercial and industrial |
$ | 10,466 | $ | 11,035 | $ | — | $ | 10,797 | $ | 429 | $ | — | ||||||||||||
| Commercial real estate |
10,364 | 10,554 | — | 8,993 | 328 | — | ||||||||||||||||||
| Commercial construction |
— | — | — | — | — | — | ||||||||||||||||||
| Business banking |
1,231 | 2,470 | — | 1,298 | — | — | ||||||||||||||||||
| Residential real estate |
11,779 | 12,767 | — | 11,880 | 439 | 31 | ||||||||||||||||||
| Consumer home equity |
2,102 | 2,115 | — | 1,944 | 81 | — | ||||||||||||||||||
|
|
|
|
|
|
|
|
|
|
|
|
|
|||||||||||||
| Sub-total |
35,942 | 38,941 | — | 34,912 | 1,277 | 31 | ||||||||||||||||||
|
|
|
|
|
|
|
|
|
|
|
|
|
|||||||||||||
| With an allowance recorded: |
||||||||||||||||||||||||
| Commercial and industrial |
3,488 | 5,110 | 1,361 | 5,647 | — | — | ||||||||||||||||||
| Commercial real estate |
215 | 215 | 38 | 919 | — | — | ||||||||||||||||||
| Commercial construction |
— | — | — | — | — | — | ||||||||||||||||||
| Business banking |
6,473 | 10,403 | 154 | 7,015 | — | — | ||||||||||||||||||
| Residential real estate |
15,934 | 17,272 | 1,804 | 16,072 | 594 | 42 | ||||||||||||||||||
| Consumer home equity |
2,846 | 2,862 | 337 | 2,629 | 110 | 1 | ||||||||||||||||||
|
|
|
|
|
|
|
|
|
|
|
|
|
|||||||||||||
| Sub-total |
28,956 | 35,862 | 3,694 | 32,282 | 704 | 43 | ||||||||||||||||||
|
|
|
|
|
|
|
|
|
|
|
|
|
|||||||||||||
| Total |
$ | 64,898 | $ | 74,803 | $ | 3,694 | $ | 67,194 | $ | 1,981 | $ | 74 | ||||||||||||
|
|
|
|
|
|
|
|
|
|
|
|
|
|||||||||||||
Purchased Credit Impaired Loans
The following table displays the outstanding and carrying amounts of PCI loans at the dates indicated:
| March 31, | December 31, | |||||||||||
| 2020 | 2019 | 2018 | ||||||||||
| (Unaudited) | ||||||||||||
| (In Thousands) | ||||||||||||
| Outstanding amount |
$ | 14,551 | $ | 15,149 | $ | 20,841 | ||||||
| Carrying amount |
12,846 | 13,451 | 16,891 | |||||||||
F-43
Table of Contents
EASTERN BANK CORPORATION
NOTES TO CONSOLIDATED FINANCIAL STATEMENTS
The excess of cash flows expected to be collected over the carrying amount of the loans, referred to as the “accretable yield,” is accreted into interest income over the life of the loans using the effective yield method. The following summarizes activity in the accretable yield for the PCI loan portfolio:
| Three Months Ended March 31, |
Year Ended December 31, |
|||||||||||||||
| 2020 | 2019 | 2019 | 2018 | |||||||||||||
| (Unaudited) | ||||||||||||||||
| (In thousands) | ||||||||||||||||
| Balance at beginning of period |
$ | 3,923 | $ | 6,161 | $ | 6,161 | $ | 7,618 | ||||||||
| Acquisition |
— | — | — | — | ||||||||||||
| Accretion |
(422 | ) | (573 | ) | (2,132 | ) | (2,559 | ) | ||||||||
| Other change in expected cash flows |
(155 | ) | (62 | ) | (898 | ) | (680 | ) | ||||||||
| Reclassification from non-accretable difference for loans with improved cash flows |
— | — | 792 | 1,782 | ||||||||||||
|
|
|
|
|
|
|
|
|
|||||||||
| Balance at end of period |
$ | 3,346 | $ | 5,526 | $ | 3,923 | $ | 6,161 | ||||||||
|
|
|
|
|
|
|
|
|
|||||||||
The estimate of cash flows expected to be collected is regularly re-assessed subsequent to acquisition. A decrease in expected cash flows in subsequent periods may indicate that the loan is impaired which would require the establishment of an allowance for loan losses by a charge to the provision for loan losses. An increase in expected cash flows in subsequent periods serves, first, to reduce any previously established allowance for loan losses by the increase in the present value of cash flows expected to be collected, and results in a recalculation of the amount of accretable yield for the loan. The adjustment of accretable yield due to an increase in expected cash flows is accounted for as a change in estimate. The additional cash flows expected to be collected are reclassified from the nonaccretable difference to the accretable yield, and the amount of periodic accretion is adjusted accordingly over the remaining life of the loans.
The following summarizes the impairment recorded through the allowance for loan losses for PCI loans subsequent to acquisition:
| Three Months Ended March 31, |
Year Ended December 31, |
|||||||||||||||
| 2020 | 2019 | 2019 | 2018 | |||||||||||||
| (Unaudited) | ||||||||||||||||
| (In thousands) | ||||||||||||||||
| Balance at beginning of period |
$ | 1,192 | $ | 813 | $ | 813 | $ | 761 | ||||||||
| Provision for loan losses |
— | — | 895 | 497 | ||||||||||||
| Reduction of the allowance(1) |
— | — | (516 | ) | (445 | ) | ||||||||||
|
|
|
|
|
|
|
|
|
|||||||||
| Balance at end of period |
$ | 1,192 | $ | 813 | $ | 1,192 | $ | 813 | ||||||||
|
|
|
|
|
|
|
|
|
|||||||||
| (1) | Reduction to a previously established allowance because it is probable that there is a significant increase in cash flows previously expected to be collected or actual cash flows are significantly greater than cash flows previously expected. |
Loan Participations
The Company occasionally purchases loan participations. These loan participations meet the same underwriting, credit and portfolio management standards as the Company’s other loans and are applied against the same criteria to determine the allowance for loan losses as other loans. As of March 31, 2020 (unaudited) and December 31, 2019, the Company held loan participation interests totaling $1.05 billion and $965.1 million, respectively.
F-44
Table of Contents
EASTERN BANK CORPORATION
NOTES TO CONSOLIDATED FINANCIAL STATEMENTS
The following table summarizes the Company’s loan participations:
| For the three months ended March 31, 2020 | For the year ended December 31, 2019 | |||||||||||||||||||||||||||||||
| (Unaudited) | ||||||||||||||||||||||||||||||||
| Balance | NPL Rate (%) |
Impaired (%) |
Gross Chargeoffs |
Balance | NPL Rate (%) |
Impaired (%) |
Gross Chargeoffs |
|||||||||||||||||||||||||
| (Dollars in thousands) | ||||||||||||||||||||||||||||||||
| Commercial and industrial |
$ | 662,888 | 2.45 | % | 2.45 | % | $ | — | $ | 586,346 | 2.76 | % | 2.76 | % | $ | — | ||||||||||||||||
| Commercial real estate |
311,114 | 0.00 | % | 0.00 | % | — | 314,487 | 0.00 | % | 0.00 | % | — | ||||||||||||||||||||
| Commercial construction |
76,923 | 0.00 | % | 0.00 | % | — | 64,259 | 0.00 | % | 0.00 | % | — | ||||||||||||||||||||
| Business banking |
53 | 0.00 | % | 0.00 | % | — | 57 | 0.00 | % | 0.00 | % | — | ||||||||||||||||||||
|
|
|
|
|
|
|
|
|
|||||||||||||||||||||||||
| Total loan participations |
$ | 1,050,978 | 1.55 | % | 1.55 | % | $ | — | $ | 965,149 | 1.68 | % | 1.68 | % | $ | — | ||||||||||||||||
|
|
|
|
|
|
|
|
|
|||||||||||||||||||||||||
5. Premises and Equipment
Premises and equipment as of March 31, 2020 (unaudited) and December 31, 2019 and 2018 were as follows:
| March 31, | December 31, | Estimated Useful Life |
||||||||||||||
| 2020 | 2019 | 2018 | ||||||||||||||
| (Unaudited) | ||||||||||||||||
| (In Thousands) |
(In Years) | |||||||||||||||
| Premises and equipment used in operations: |
||||||||||||||||
| Land |
$ | 7,410 | $ | 7,410 | $ | 7,960 | N/A | |||||||||
| Buildings |
57,358 | 57,075 | 56,295 | 5-30 | ||||||||||||
| Equipment |
57,579 | 57,720 | 62,775 | 3-5 | ||||||||||||
| Leasehold improvements |
35,492 | 35,447 | 35,808 | 5-25 | ||||||||||||
|
|
|
|
|
|
|
|||||||||||
| Total cost |
157,839 | 157,652 | 162,838 | |||||||||||||
| Accumulated depreciation and amortization |
(103,858 | ) | (101,085 | ) | (96,363 | ) | ||||||||||
|
|
|
|
|
|
|
|||||||||||
| Premises and equipment used in operations, net |
53,981 | 56,567 | 66,475 | |||||||||||||
| Premises and equipment held for sale(1) |
886 | 886 | — | |||||||||||||
|
|
|
|
|
|
|
|||||||||||
| Net premises and equipment |
$ | 54,867 | $ | 57,453 | $ | 66,475 | ||||||||||
|
|
|
|
|
|
|
|||||||||||
| (1) | The Company classified a branch location as held for sale. |
The Company had depreciation and amortization expense related to premises and equipment of $3.6 million and $3.9 million for the three months ended March 31, 2020 and 2019 (unaudited), respectively, and $15.9 million and $16.2 million during the years ended December 31, 2019 and 2018, respectively.
6. Goodwill and Other Intangibles
The following tables present the changes in the carrying amount of goodwill by reporting unit for the periods indicated:
| Three Months Ended March 31, 2020 | ||||||||||||
| (Unaudited) | ||||||||||||
| Banking Business |
Insurance Agency Business |
Net Carrying Amount |
||||||||||
| (In Thousands) | ||||||||||||
| Balance at beginning of period |
$ | 298,611 | $ | 70,420 | $ | 369,031 | ||||||
| Goodwill recorded during the period |
— | — | — | |||||||||
| Goodwill disposed of during the period |
— | — | — | |||||||||
|
|
|
|
|
|
|
|||||||
| Balance at end of period |
$ | 298,611 | $ | 70,420 | $ | 369,031 | ||||||
|
|
|
|
|
|
|
|||||||
F-45
Table of Contents
EASTERN BANK CORPORATION
NOTES TO CONSOLIDATED FINANCIAL STATEMENTS
| Year Ended December 31, 2019 | ||||||||||||
| Banking Business |
Insurance Agency Business |
Total | ||||||||||
| (In Thousands) | ||||||||||||
| Balance at beginning of year |
$ | 298,611 | $ | 70,420 | $ | 369,031 | ||||||
| Goodwill recorded during the year |
— | — | — | |||||||||
| Goodwill disposed of during the year |
— | — | — | |||||||||
|
|
|
|
|
|
|
|||||||
| Balance at end of year |
$ | 298,611 | $ | 70,420 | $ | 369,031 | ||||||
|
|
|
|
|
|
|
|||||||
| Year Ended December 31, 2018 | ||||||||||||
| Banking Business |
Insurance Agency Business |
Total | ||||||||||
| (In Thousands) | ||||||||||||
| Balance at beginning of year |
$ | 298,611 | $ | 63,326 | $ | 361,937 | ||||||
| Goodwill recorded during the year |
— | 7,666 | 7,666 | |||||||||
| Goodwill disposed of during the year(1) |
— | (572 | ) | (572 | ) | |||||||
|
|
|
|
|
|
|
|||||||
| Balance at end of year |
$ | 298,611 | $ | 70,420 | $ | 369,031 | ||||||
|
|
|
|
|
|
|
|||||||
| (1) | The Company sold a portion of its insurance agency reporting unit in 2018 and reduced goodwill by $0.6 million. |
The Company assesses goodwill for impairment at the reporting unit level on an annual basis or sooner if an event occurs or circumstances change which might indicate that the fair value of a reporting unit is below its carrying amount. The Company considered the current economic conditions including the potential impact of the Covid-19 pandemic as it pertains to the goodwill above and determined that there was no indication of impairment related to goodwill as of March 31, 2020 (unaudited). Additionally, the Company did not record any impairment charges during the years ended December 31, 2019 and 2018.
The following table presents a summary of the Company’s other intangible assets as of the periods indicated:
| March 31, | December 31, | |||||||||||||||||||||||||||||||||||
| 2020 | 2019 | 2018 | ||||||||||||||||||||||||||||||||||
| (Unaudited) | ||||||||||||||||||||||||||||||||||||
| Gross Carrying Amount |
Accumulated Amortization(1) |
Net Carrying Amount |
Gross Carrying Amount |
Accumulated Amortization(1) |
Net Carrying Amount |
Gross Carrying Amount(1) |
Accumulated Amortization(1) |
Net Carrying Amount |
||||||||||||||||||||||||||||
| (In Thousands) |
||||||||||||||||||||||||||||||||||||
| Insurance agency |
$ | 27,305 | $ | (19,908) | $ | 7,397 | $ | 27,305 | $ | (19,356 | ) | $ | 7,949 | $ | 27,305 | $ | (16,712 | ) | $ | 10,593 | ||||||||||||||||
| Core deposits |
6,579 | (5,974 | ) | 605 | 6,579 | (5,825 | ) | 754 | 6,579 | (4,927 | ) | 1,652 | ||||||||||||||||||||||||
|
|
|
|
|
|
|
|
|
|
|
|
|
|
|
|
|
|
|
|||||||||||||||||||
| Total |
$ | 33,884 | $ | (25,882 | ) | $ | 8,002 | $ | 33,884 | $ | (25,181 | ) | $ | 8,703 | $ | 33,884 | $ | (21,639 | ) | $ | 12,245 | |||||||||||||||
|
|
|
|
|
|
|
|
|
|
|
|
|
|
|
|
|
|
|
|||||||||||||||||||
| (1) | Excludes amounts that became fully amortized during the period. |
The amortization expense of the Company’s intangible assets was $0.7 million and $0.9 million for the three months ended March 31, 2020 and 2019 (unaudited), respectively, and $3.5 million and $3.9 million for the years ended December 31, 2019 and 2018, respectively.
The total weighted average amortization period for intangible assets is 9.6 years. The Company has estimated the useful life of its insurance agency-related intangible assets, comprising primarily of customer lists and non-compete agreements, and its core deposit identifiable intangible assets to be a weighted-average of ten years and eight years, respectively.
F-46
Table of Contents
EASTERN BANK CORPORATION
NOTES TO CONSOLIDATED FINANCIAL STATEMENTS
The estimated amortization expense for each of the five succeeding years is as follows:
| Years Ending December 31: | (In Thousands) | |||
| 2020 (nine months) |
$ | 2,099 | ||
| 2021 |
1,900 | |||
| 2022 |
1,406 | |||
| 2023 |
1,000 | |||
| 2024 |
730 | |||
The Company also considered the current economic conditions including the potential impact of the Covid-19 pandemic as it pertains to the intangible assets above and determined that there was no indication of impairment related to other intangible assets as of March 31, 2020 (unaudited).
7. Deposits
In order to manage reserve requirements at the Federal Reserve Bank of Boston the Company has established overnight programs which sweep certain demand and interest checking accounts into money market investment accounts. Reported deposit balances do not reflect the impact of the overnight sweep programs. At March 31, 2020 (unaudited) and December 31, 2019 and 2018, the Company swept $5.1 billion, $4.7 billion and $4.5 billion, respectively, from demand deposit and interest checking balances into money market investments for reserve requirement purposes.
Other time deposits of $100,000 and greater, including certificates of deposits of $100,000 and greater, at March 31, 2020 (unaudited) and December 31, 2019 totaled $155.6 million and $157.6 million, respectively.
The following table summarizes the certificate of deposits by maturity at December 31, 2019.
| (Dollars in Thousands) | ||||||||
| 2020 |
$ | 286,862 | 87.2 | % | ||||
| 2021 |
20,889 | 6.4 | % | |||||
| 2022 |
9,902 | 3.0 | % | |||||
| 2023 |
5,052 | 1.5 | % | |||||
| 2024 |
6,370 | 1.9 | % | |||||
| Thereafter |
64 | 0.0 | % | |||||
|
|
|
|
|
|||||
| $ | 329,139 | 100.00 | % | |||||
|
|
|
|
|
|||||
Certificates of deposit by maturity as of March 31, 2020 (unaudited) were not materially different from December 31, 2019.
Interest expense related to deposits held by the Company for the three months ended March 31, 2020 and 2019 (unaudited) was $5.4 million and $6.5 million respectively. Interest expense related to deposits held by the Company for the years ended December 31, 2019 and 2018, was $27.3 million and $17.4 million, respectively.
At March 31, 2020 (unaudited) and December 31, 2019 and 2018, securities with a carrying value of $30.4 million, $21.9 million and $29.0 million, respectively, were pledged to secure public deposits and for other purposes required by law. At March 31, 2020 (unaudited), securities pledged as collateral for deposits included Eastern Wealth Management cash accounts and municipal housing authority accounts. At December 31, 2019, securities pledged as collateral for deposits included a debtor in possession account that exceeded the FDIC insurance limit, Eastern Wealth Management cash accounts and municipal housing authority accounts.
The FDIC offers insurance coverage on deposits up to the federally insured limit of $250,000. The amount of time deposits equal to or greater than $250,000, as of March 31, 2020 (unaudited) and December 31, 2019 and 2018, is $79.3 million, $85.2 million and $197.2 million, respectively.
F-47
Table of Contents
EASTERN BANK CORPORATION
NOTES TO CONSOLIDATED FINANCIAL STATEMENTS
8. Borrowed Funds
Borrowed funds were comprised of the following:
| As of March 31, | As of December 31, | |||||||||||
| 2020 | 2019 | 2018 | ||||||||||
| (Unaudited) | ||||||||||||
| (In Thousands) | ||||||||||||
| Federal funds purchased |
$ | — | $ | 201,082 | $ | 168,776 | ||||||
| Federal Home Loan Bank advances |
15,070 | 18,964 | 137,286 | |||||||||
| Escrow deposits of borrowers |
16,357 | 15,349 | 14,875 | |||||||||
| Interest rate swap collateral funds |
— | — | 13,350 | |||||||||
|
|
|
|
|
|
|
|||||||
| $ | 31,427 | $ | 235,395 | $ | 334,287 | |||||||
|
|
|
|
|
|
|
|||||||
At March 31, 2020 (unaudited) and December 31, 2019, the Company had available and unused borrowing capacity of approximately $607.9 million and $637.0 million, respectively, at the Federal Reserve Discount Window.
Interest expense on borrowed funds was as follows:
| For the three months ended March 31, |
For the years ended December 31, |
|||||||||||||||
| 2020 | 2019 | 2019 | 2018 | |||||||||||||
| (Unaudited) | ||||||||||||||||
| (In Thousands) | ||||||||||||||||
| Federal funds purchased |
$ | 540 | $ | 1,021 | $ | 3,976 | $ | 3,384 | ||||||||
| Federal Home Loan Bank advances |
58 | 1,187 | 2,406 | 3,885 | ||||||||||||
| Escrow deposits of borrowers |
1 | 1 | 4 | 3 | ||||||||||||
| Interest rate swap collateral funds |
— | 83 | 66 | 466 | ||||||||||||
|
|
|
|
|
|
|
|
|
|||||||||
| $ | 599 | $ | 2,292 | $ | 6,452 | $ | 7,738 | |||||||||
|
|
|
|
|
|
|
|
|
|||||||||
A summary of FHLB of Boston advances, by maturities was as follows:
| As of March 31, | As of December 31, | |||||||||||||||||||||||
| 2020 | 2019 | 2018 | ||||||||||||||||||||||
| (Unaudited) | Amount |
Weighted- Average Interest Rate |
Amount | Weighted- Average Interest Rate |
||||||||||||||||||||
| Amount | Weighted- Average Rate |
|||||||||||||||||||||||
| (In Thousands) | ||||||||||||||||||||||||
| Within one year |
$ | — | 0.00 | % | $ | 4,946 | 1.81 | % | $ | 130,082 | 2.67 | % | ||||||||||||
| Over one year to three years |
171 | 0.16 | % | 193 | 0.17 | % | — | — | ||||||||||||||||
| Over three years to five years |
3,713 | 0.95 | % | 1,587 | 0.35 | % | 366 | 1.01 | % | |||||||||||||||
| Over five years |
11,186 | 1.23 | % | 12,238 | 1.39 | % | 6,838 | 1.86 | % | |||||||||||||||
|
|
|
|
|
|
|
|
|
|
|
|
|
|||||||||||||
| $ | 15,070 | 1.15 | % | $ | 18,964 | 1.40 | % | $ | 137,286 | 2.63 | % | |||||||||||||
|
|
|
|
|
|
|
|
|
|
|
|
|
|||||||||||||
Advances from the FHLB of Boston are secured by stock in FHLB of Boston, residential real estate loans, commercial real estate loans and government-sponsored residential mortgage-backed securities. The collateral value of residential real estate and commercial real estate loans securing these advances was $938.4 million and $575.5 million, respectively, at March 31, 2020 (unaudited) and $952.5 million and $150.1 million, respectively, at December 31, 2019. The collateral value of government-sponsored residential mortgage-backed securities was $0 million and $801.1 million at March 31, 2020 (unaudited) and December 31, 2019, respectively. At March 31, 2020 (unaudited) and December 31, 2019, the Bank had available and unused borrowing capacity of approximately $1.4 billion and $1.8 billion, respectively, with the FHLB of Boston.
As a member of the FHLB of Boston, the Company is required to hold FHLB of Boston stock. At March 31, 2020 (unaudited) and December 31, 2019 and 2018, the Company had investments in the FHLB of Boston of $8.8 million, $9.0 million and $18.0 million, respectively. At its discretion the FHLB of Boston may declare dividends on the stock. Included in other noninterest
F-48
Table of Contents
EASTERN BANK CORPORATION
NOTES TO CONSOLIDATED FINANCIAL STATEMENTS
income in the consolidated statements of income are dividends received of $0.1 million and $0.2 million during the three months ended March 31, 2020 and 2019 (unaudited), respectively, and $0.8 million and $1.2 million during the years ended December 31, 2019 and 2018, respectively.
9. Income Taxes
The following table sets forth information regarding the Company’s tax provision and applicable tax rates for the periods indicated:
| Three Months Ended | Year Ended | |||||||||||||||
| March 31, | December 31 | |||||||||||||||
| 2020 | 2019 | 2019 | 2018 | |||||||||||||
| (unaudited) | ||||||||||||||||
| (Dollars in thousands) | ||||||||||||||||
| Combined federal and state income tax provisions |
$ | 1,298 | $ | 9,678 | $ | 39,481 | $ | 34,884 | ||||||||
| Effective income tax rates |
13.3 | % | 22.7 | % | 22.6 | % | 22.1 | % | ||||||||
The Company’s provision for income taxes was $1.3 million and $9.7 million for the three months ended March 31, 2020 and 2019 (unaudited), respectively. The decrease in income tax expense was due primarily to lower pre-tax income during the three months ended March 31, 2020 (unaudited) compared to the three months ended March 31, 2019 (unaudited), while investment tax credits and other favorable permanent differences remained relatively constant.
The provision for income taxes is comprised of the following components for the years ended December 31:
| 2019 | 2018 | |||||||
| (In Thousands) | ||||||||
| Current tax expense |
||||||||
| Federal |
$ | 26,365 | $ | 26,793 | ||||
| State |
11,740 | 12,969 | ||||||
|
|
|
|
|
|||||
| Total current tax expense |
38,105 | 39,762 | ||||||
|
|
|
|
|
|||||
| Deferred tax expense (benefit) |
||||||||
| Federal |
782 | (1,360 | ) | |||||
| State |
594 | (3,518 | ) | |||||
|
|
|
|
|
|||||
| Total deferred tax expense (benefit) |
1,376 | (4,878 | ) | |||||
|
|
|
|
|
|||||
| Total income tax expense |
$ | 39,481 | $ | 34,884 | ||||
|
|
|
|
|
|||||
A reconciliation of the U.S. federal statutory rate to the Company’s effective income tax rate for the years ended December 31, was as follows:
| 2019 | 2018 | |||||||||||||||
| (In Thousands) | ||||||||||||||||
| Income tax expense at U.S. Federal rate |
$ | 36,662 | 21.00 | % | $ | 33,098 | 21.00 | % | ||||||||
| Increase (decrease) resulting from: |
||||||||||||||||
| State income tax, net of federal tax benefit |
9,744 | 5.58 | % | 7,466 | 4.74 | % | ||||||||||
| Amortization of qualified low-income housing investments |
4,782 | 2.74 | % | 2,750 | 1.74 | % | ||||||||||
| Tax credits |
(7,570 | ) | (4.34 | )% | (3,154 | ) | (2.00 | )% | ||||||||
| Tax-exempt income |
(3,923 | ) | (2.25 | )% | (4,269 | ) | (2.71 | )% | ||||||||
| Other, net |
(214 | ) | (0.12 | )% | (1,007 | ) | (0.64 | )% | ||||||||
|
|
|
|
|
|||||||||||||
| Actual income tax expense |
$ | 39,481 | 22.61 | % | $ | 34,884 | 22.13 | % | ||||||||
|
|
|
|
|
|||||||||||||
F-49
Table of Contents
EASTERN BANK CORPORATION
NOTES TO CONSOLIDATED FINANCIAL STATEMENTS
Significant components of the Company’s deferred tax assets and deferred tax liabilities at December 31 are presented in the table below:
| 2019 | 2018 | |||||||
| (In Thousands) | ||||||||
| Deferred tax assets: |
||||||||
| Allowance for loan losses |
$ | 25,641 | $ | 25,001 | ||||
| Pension and deferred compensation plans |
25,455 | 15,809 | ||||||
| Unrealized gain on available for sale securities |
— | 5,466 | ||||||
| Accrued expenses |
5,854 | 5,412 | ||||||
| Depreciation |
3,515 | 2,805 | ||||||
| Loan basis difference fair value adjustments |
1,949 | 2,483 | ||||||
| Charitable donation limitation carryover |
— | 778 | ||||||
| Other |
1,516 | 1,097 | ||||||
|
|
|
|
|
|||||
| Total deferred tax assets |
63,930 | 58,851 | ||||||
|
|
|
|
|
|||||
| Deferred tax liabilities: |
||||||||
| Amortization of intangibles |
13,400 | 13,373 | ||||||
| Unrealized gain on available for sale securities |
6,241 | — | ||||||
| Partnerships |
3,967 | 3,297 | ||||||
| Cash flow hedges |
6,109 | 1,168 | ||||||
| Trading securities |
3,316 | 891 | ||||||
| Other |
2,690 | 2,446 | ||||||
|
|
|
|
|
|||||
| Total deferred tax liabilities |
35,723 | 21,175 | ||||||
|
|
|
|
|
|||||
| Net deferred income tax assets |
$ | 28,207 | $ | 37,676 | ||||
|
|
|
|
|
|||||
The Tax Act lowered the corporate income tax rate from 35% to 21%. During the year ended December 31, 2017, the Company recorded a provisional amount to deferred tax expense of $7.2 million which was primarily due to a remeasurement of deferred tax assets and liabilities at the newly enacted rate of 21%. Management remeasured certain deferred tax assets and liabilities based on the rates at which they are expected to reverse in the future, which is generally 21%.
As of December 31, 2018, the Company completed its accounting for all the enactment-date income tax effects of the Act. The Company’s tax expense for the year ended December 31, 2018 included an increase of $0.2 million related to the provisional estimate recorded on the remeasurement of deferred tax assets and liabilities in the year ended December 31, 2017.
The Company believes that it is more likely than not that its deferred tax assets as of March 31, 2020 (unaudited) and December 31, 2019 will be realized. As such, there was no deferred tax asset valuation allowance at March 31, 2020 (unaudited) and December 31, 2019 and 2018.
The Company files tax returns in the U.S. federal jurisdiction and various states. At March 31, 2020 (unaudited) and December 31, 2019, the Company’s open tax years for examination by the Internal Revenue Services (“IRS”) were 2016, 2017 and 2018. The Company’s open tax years for examination by state tax authorities varies by state, but no years prior to 2013 are open. The Company believes that its income tax returns have been filed based upon applicable statutes, regulations and case law in effect at the time of filing, however the IRS and/or state jurisdiction, upon examination, could disagree with the Company’s interpretation.
Management has performed an evaluation of the Company’s uncertain tax positions and determined that a liability for unrecognized tax benefits at March 31, 2020 (unaudited) and December 31, 2019 and 2018 was not needed.
F-50
Table of Contents
EASTERN BANK CORPORATION
NOTES TO CONSOLIDATED FINANCIAL STATEMENTS
10. Low Income Housing Tax Credits and Other Tax Credit Investments
The Company has invested in several separate Low Income Housing Tax Credits (“LIHTC”) projects, also referred to as qualified affordable housing projects, which provide the Company with tax credits and operating loss tax benefits over a period of approximately 15 years. Typically, none of the original investment is expected to be repaid. The return on these investments is generally generated through tax credits and tax losses. The Company accounts for its investments in LIHTC projects using the proportional amortization method, under which it amortizes the initial cost of the investment in proportion to the amount of the tax credits and other tax benefits received and recognizes the net investment performance in the income statement as a component of income tax expense (benefit). The Company’s maximum exposure to loss in its investments in qualified affordable housing projects is limited to its carrying value included in other assets. The effects of the Tax Act on this proportional amortization method and carrying value of the existing LIHTC projects was considered and was deemed to be immaterial. The Company will continue to use the proportional amortization method on any new investments going forward.
The following table presents the Company’s investments in low income housing projects accounted for using the proportional amortization method for the periods indicated:
| Three months ended March 31, |
Year ended December 31, |
|||||||||||
| 2020 | 2019 | 2018 | ||||||||||
| (Unaudited) | ||||||||||||
| (In Thousands) | ||||||||||||
| Current recorded investment included in other assets |
$ | 41,473 | $ | 37,665 | $ | 32,446 | ||||||
| Commitments to fund qualified affordable housing projects included in recorded investment noted above |
17,865 | 18,042 | 14,391 | |||||||||
| Tax credits and benefits (1) |
1,519 | 5,962 | 2,891 | |||||||||
| Amortization of investments included in current tax expense (2) |
1,191 | 4,782 | 2,750 | |||||||||
| (1) | Amount reflects tax credits and tax benefits recognized in the consolidated statement of income for three months ended March 31, 2020 (unaudited) and the years ended December 31, 2019 and 2018 |
| (2) | Amount reflects amortization of qualified affordable housing projects for the years ended December 31, 2019 and 2018 |
The Company is the sole member of a tax credit investment company through which it consolidates a VIE. In 2015 the VIE made an equity investment to fund the construction of solar energy facilities in a manner to qualify for renewable energy investment tax credits. This equity investment is included in other assets on the consolidated balance sheet and totaled $4.2 million at March 31, 2020 (unaudited), and $4.2 million and $4.4 million in the years ended December 31, 2019 and 2018, respectively. The minority interest associated with this investment was immaterial at March 31, 2020 (unaudited) and December 31, 2019 and 2018. The Company will treat the investment tax credits received as a reduction of federal income taxes for the year in which the credit arises using the flow-through method (i.e., the credit flows directly through the statement of income in the year of purchase). The Company recorded $0.1 million of new markets tax credits in the three months ended March 31, 2020 (unaudited), and $0.4 million in both the years ended December 31, 2019 and 2018 as a result of this investment.
The Company accounts for its investments in other tax credit investment projects using either the cost method or equity method. These investments are included in other assets on the consolidated balance sheets and totaled $4.2 million, $4.3 million and $0.4 million at March 31, 2020 (unaudited) and December 31, 2019 and 2018, respectively. Investment tax credits received as a result of these investments amounted to $0.1 million in the three months ended March 31, 2020 (unaudited) and $2.3 million in the year ended December 31, 2019. No investment tax credit was received in the year ended December 31, 2018. The Company treats investment tax credits received for these investments as a reduction of federal income taxes for the year in which the credits arise using the flow-through method. There were no commitments outstanding for these projects at either year end.
11. Minimum Regulatory Capital Requirements
The Company is subject to various regulatory capital requirements administered by federal banking agencies, including U.S. Basel III. Failure to meet minimum capital requirements can initiate certain mandatory, and possibly additional discretionary,
F-51
Table of Contents
EASTERN BANK CORPORATION
NOTES TO CONSOLIDATED FINANCIAL STATEMENTS
actions by regulators that, if undertaken, could have a direct material effect on the Company’s consolidated financial statements. Under capital adequacy guidelines and the regulatory framework for prompt corrective action, the Company must meet specific capital guidelines that involve quantitative measures of the Company’s assets, liabilities, and certain off-balance sheet items as calculated under regulatory accounting practices. The Company’s capital amounts and classification are also subject to qualitative judgements by the regulators about components, risk weightings, and other factors.
Quantitative measures established by the regulators to ensure capital adequacy require the Company to maintain minimum capital amounts and ratios. All banking companies are required to have core capital (“Tier 1”) of at least 6% of risk-weighted assets, total capital of at least 8% of risk-weighted assets and a minimum of Tier 1 leverage ratio of 4% of adjusted average assets.
As of March 31, 2020 (unaudited) and December 31, 2019, the Bank was categorized as “well-capitalized” based on the regulatory framework for prompt corrective action. To be categorized as well-capitalized, the Company must maintain (1) a minimum of total risk-based capital ratio of 10%; (2) a minimum of Tier I risk-based capital ratio of 8%; (3) a minimum of common equity Tier 1 capital ratio of 6.5%; and (4) a minimum of Tier 1 leverage ratio of 5%. Management believes, that the Company met all capital adequacy requirements to which it is subject to as of March 31, 2020 (unaudited) and December 31, 2019 and 2018. There have been no conditions or events that management believes would cause a change in the Company’s categorization.
The Company’s actual capital amounts and ratios are presented in the following table:
| Actual | For Capital Adequacy |
To Be Well- Capitalized Under Prompt Corrective Action Provisions |
||||||||||||||||||||||
| Amount | Ratio | Amount | Ratio | Amount | Ratio | |||||||||||||||||||
| (In Thousands) | ||||||||||||||||||||||||
| As of March 31, 2020 (unaudited): |
||||||||||||||||||||||||
| Total regulatory capital (to risk-weighted assets) (unaudited) |
$ | 1,400,389 | 13.57 | % | $ | 825,771 | >8 | % | $ | 1,032,214 | >10 | % | ||||||||||||
| Tier 1 capital (to risk-weighted assets) (unaudited) |
1,282,205 | 12.42 | 619,328 | 6 | 825,771 | 8 | ||||||||||||||||||
| Common Equity Tier I capital (to risk-weighted assets) (unaudited) |
1,282,205 | 12.42 | 464,496 | 4.5 | 670,939 | 6.5 | ||||||||||||||||||
| Tier I capital (to average assets) (unaudited) |
1,282,205 | 11.28 | 454,713 | 4 | 568,391 | 5 | ||||||||||||||||||
| As of December 31, 2019: |
||||||||||||||||||||||||
| Total regulatory capital (to risk-weighted assets) |
$ | 1,365,391 | 13.56 | % | $ | 805,394 | >8 | % | $ | 1,006,742 | >10 | % | ||||||||||||
| Tier 1 capital (to risk-weighted assets) |
1,274,174 | 12.66 | 604,045 | 6 | 805,394 | 8 | ||||||||||||||||||
| Common Equity Tier I capital (to risk-weighted assets) |
1,274,174 | 12.66 | 453,034 | 4.5 | 654,382 | 6.5 | ||||||||||||||||||
| Tier I capital (to average assets) |
1,274,174 | 11.47 | 444,279 | 4 | 555,348 | 5 | ||||||||||||||||||
| As of December 31, 2018: |
||||||||||||||||||||||||
| Total regulatory capital (to risk-weighted assets) |
$ | 1,224,693 | 12.41 | % | $ | 789,488 | >8 | % | $ | 986,860 | >10 | % | ||||||||||||
| Tier 1 capital (to risk-weighted assets) |
1,135,755 | 11.51 | 592,116 | 6 | 789,488 | 8 | ||||||||||||||||||
| Common Equity Tier I capital (to risk-weighted assets) |
1,135,755 | 11.51 | 444,087 | 4.5 | 641,459 | 6.5 | ||||||||||||||||||
| Tier I capital (to average assets) |
1,135,755 | 10.39 | 437,410 | 4 | 546,763 | 5 | ||||||||||||||||||
The Company is subject to various capital requirements in connection with seller/servicer agreements that have been entered into with secondary market investors. Failure to maintain minimum capital requirements could result in an inability to originate and service loans for the respective investor and, therefore, could have a direct material effect on the Company’s financial statements. Management believes that the Company met all capital requirements in connection with seller/servicer agreements as of March 31, 2020 (unaudited) and December 31, 2019 and 2018.
F-52
Table of Contents
EASTERN BANK CORPORATION
NOTES TO CONSOLIDATED FINANCIAL STATEMENTS
12. Employee Benefits
Pension Plans
The Company provides pension benefits for its employees through membership in the Savings Banks Employees’ Retirement Association. The plan is a noncontributory, defined benefit plan. The Company’s employees become eligible after attaining age 21 and one year of service. Additionally, benefits become fully vested after three years of eligible service for individuals employed by the Company on or before October 31, 1989. Individuals employed subsequent to October 31, 1989 become fully vested after five years of eligible service. The Company’s annual contribution to the Defined Benefit Plan is based upon standards established by the Pension Protection Act. The contribution is based on an actuarial method intended to provide not only for benefits attributable to service to date, but also for those expected to be earned in the future.
SBERA offers a common and collective trust as the underlying investment structure for pension plans participating in the association. The target allocation mix for the common and collective trust portfolio calls for an equity-based investment deployment range of 43% to 57% of total common and collective trust portfolio assets. The remainder of the common and collective trust’s portfolio is allocated to fixed income securities with a target range of 15% to 25% and other investments, including global asset allocation and hedge funds, from 15% to 31%. The investment managers for the common and collective trust portfolio are selected by the trustees of SBERA through the association’s investment committee. A professional investment advisory firm is retained by the investment committee to provide allocation analysis, performance measurement, and to assist with manager searches. The overall investment objective is to diversify equity investments across a spectrum of investment types to limit risks from large market swings. The Defined Benefit Plan has a plan year end of October 31.
The Company has an unfunded Defined Benefit Supplemental Executive Retirement Plan that provides certain retired and currently employed officers with defined pension benefits in excess of qualified plan limits imposed by U.S. federal tax law. The DB SERP has a plan year end of December 31. In addition, the Company has an unfunded Benefit Equalization Plan to provide retirement benefits to certain employees whose retirement benefits under the qualified pension plan are limited per the Internal Revenue Code. The BEP has a plan year end of October 31. The Company also has an unfunded Outside Directors’ Retainer Continuance Plan that provides pension benefits to outside directors who retire from service. The Outside Directors’ Retainer Continuance Plan has a plan year end of December 31.
F-53
Table of Contents
EASTERN BANK CORPORATION
NOTES TO CONSOLIDATED FINANCIAL STATEMENTS
Obligations and Funded Status
The funded status and amounts recognized in the Company’s consolidated financial statements for the Defined Benefit Plan, the DB SERP, the BEP and the Outside Directors’ Retainer Continuance Plan are set forth in the following table:
| As of and for the years ended December 31, |
||||||||
| 2019 | 2018 | |||||||
| (In Thousands) | ||||||||
| Change in benefit obligation: |
||||||||
| Benefit obligation at beginning of the year |
$ | 302,317 | $ | 328,409 | ||||
| Service cost |
18,926 | 23,256 | ||||||
| Interest cost |
10,996 | 11,170 | ||||||
| Actuarial (gain) loss |
74,828 | (46,932 | ) | |||||
| Benefits paid |
(10,298 | ) | (13,586 | ) | ||||
|
|
|
|
|
|||||
| Benefit obligation at end of the year |
$ | 396,769 | $ | 302,317 | ||||
|
|
|
|
|
|||||
| Change in plan assets: |
||||||||
| Fair value of plan assets at beginning of year |
$ | 305,154 | $ | 335,369 | ||||
| Actual return (loss) on plan assets |
60,723 | (18,918 | ) | |||||
| Employer contribution |
23,300 | 2,289 | ||||||
| Benefits paid |
(10,298 | ) | (13,586 | ) | ||||
|
|
|
|
|
|||||
| Fair value of plan assets at end of year |
378,879 | 305,154 | ||||||
|
|
|
|
|
|||||
| (Unfunded) funded status |
$ | (17,890 | ) | $ | 2,837 | |||
|
|
|
|
|
|||||
| Reconciliation of funding status: |
||||||||
| Past service cost |
$ | (25 | ) | $ | (69 | ) | ||
| Unrecognized net loss |
(113,022 | ) | (82,542 | ) | ||||
| Prepaid benefit cost |
95,157 | 85,448 | ||||||
|
|
|
|
|
|||||
| (Unfunded) funded status |
$ | (17,890 | ) | $ | 2,837 | |||
|
|
|
|
|
|||||
| Accumulated benefit obligation |
$ | 290,429 | $ | 223,865 | ||||
|
|
|
|
|
|||||
| Amounts recognized in accumulated other comprehensive income (“AOCI”), net of tax: |
||||||||
| Prior service cost |
$ | (18 | ) | $ | (50 | ) | ||
| Net loss |
(81,251 | ) | (59,339 | ) | ||||
|
|
|
|
|
|||||
| Amounts recognized in AOCI |
$ | (81,269 | ) | $ | (59,389 | ) | ||
|
|
|
|
|
|||||
| Amounts in accumulated other comprehensive income expected to be recognized in net periodic benefit cost over the next fiscal year: |
||||||||
| Prior service cost |
$ | 18 | $ | 32 | ||||
| Net loss |
6,790 | 5,207 | ||||||
|
|
|
|
|
|||||
| Net amount |
$ | 6,808 | $ | 5,239 | ||||
|
|
|
|
|
|||||
In accordance with the Pension Protection Act, the Company is not required to make any contributions for the Defined Benefit Plan for the plan year beginning November 1, 2019.
During the three months ended March 31, 2020 (unaudited), the Company made contributions of $32.5 million.
Actuarial Assumptions
The assumptions used in determining the benefit obligations at December 31, 2019 and 2018 were as follows:
| Defined Benefit Plan | BEP | DB SERP | Outside Director’s Retainer Continuance Plan |
|||||||||||||||||||||||||||||
| 2019 | 2018 | 2019 | 2018 | 2019 | 2018 | 2019 | 2018 | |||||||||||||||||||||||||
| Discount rate |
3.16 | % | 4.25 | % | 3.15 | % | 4.25 | % | 2.72 | % | 4.25 | % | 2.86 | % | 4.25 | % | ||||||||||||||||
| Rate of increase in compensation levels |
5.25 | % | 5.25 | % | 5.25 | % | 5.25 | % | — | % | — | % | 3.00 | % | 3.00 | % | ||||||||||||||||
F-54
Table of Contents
EASTERN BANK CORPORATION
NOTES TO CONSOLIDATED FINANCIAL STATEMENTS
The assumptions used in determining the net periodic benefit cost for the years ended December 31, 2019 and 2018 were as follows:
| Defined Benefit Plan | ||||||||
| 2019 | 2018 | |||||||
| Discount rate - benefit cost |
4.25 | % | 3.50 | % | ||||
| Rate of Compensation increase |
5.25 | % | 5.25 | % | ||||
| Expected rate of return on plan assets |
7.50 | % | 7.75 | % | ||||
| BEP | ||||||||
| 2019 | 2018 | |||||||
| Discount rate - benefit cost |
4.25 | % | 3.5 | 0% | ||||
| Rate of Compensation increase |
5.25 | % | 5.25 | % | ||||
| Expected rate of return on plan assets |
— | % | — | % | ||||
| DB SERP | ||||||||
| 2019 | 2018 | |||||||
| Discount rate - benefit cost |
4.25 | % | 3.5 | 0% | ||||
| Rate of Compensation increase |
— | % | — | % | ||||
| Expected rate of return on plan assets |
— | % | — | % | ||||
| Outside Director’s Retainer Continuance Plan |
||||||||
| 2019 | 2018 | |||||||
| Discount rate - benefit cost |
4.25 | % | 3.5 | 0% | ||||
| Rate of Compensation increase |
3.00 | % | 3.00 | % | ||||
| Expected rate of return on plan assets |
— | % | — | % | ||||
In general, the Company has selected its assumptions with respect to the expected long-term rate of return based on prevailing yields on high quality fixed income investments increased by a premium for equity return expectations.
During the year ended December 31, 2018, upon the hiring of a new actuarial firm, the Company refined its methodology for determining the discount rate used in calculating the benefit obligation and the benefit cost for all of its defined benefit plans. This change was effective in calculating the benefit obligations as of December 31, 2018 and the benefit costs beginning during the year ended December 31, 2019. The Company now uses the spot rate approach whereby the individual spot rates on the FTSE above-median yield curve are applied to each corresponding year’s projected cash flow used to measure the respective plan’s service cost and interest cost. The Company believes that the new methodology more accurately determines each plan’s service cost and interest cost for the fiscal year versus using the single equivalent discount rate by strengthening the correlation between the projected cash flows and the corresponding discount rate used to measure those components of net periodic pension cost.
The Company accounted for this change as a change in accounting principle that is inseparable from a change in estimate and, accordingly, accounted for it prospectively. A total estimated benefit obligation of $302.3 million was calculated at December 31, 2018 under the new methodology. Under the prior methodology, a total estimated benefit obligation of $310.3 million would have been calculated at December 31, 2018.
The Company owns a percentage of the SBERA defined benefit common collective trust. Based upon this ownership percentage, plan assets managed by SBERA on behalf of the Company amounted to $378.9 million and $305.2 million at December 31, 2019 and 2018, respectively. Investments held by the common collective trust include Level 1, 2 and 3 assets such as: collective funds, equity securities, mutual funds, hedge funds and short-term investments. The Fair Value Measurements and Disclosures Topic of the FASB ASC stipulates that an asset’s fair value measurement level within the fair value hierarchy is based on the lowest level of any input that is significant to the fair value measurement. As such, the Company classifies its interest in the common collective trust as a Level 3 asset.
F-55
Table of Contents
EASTERN BANK CORPORATION
NOTES TO CONSOLIDATED FINANCIAL STATEMENTS
The table below presents a reconciliation of the Company’s interest in the SBERA common collective trust during the year ended December 31, 2019:
| (In Thousands) | ||||
| Balance at January 1, 2019 |
$ | 305,154 | ||
| Net realized and unrealized gains and (losses) |
60,723 | |||
| Contributions |
20,000 | |||
| Benefits Paid |
(6,998 | ) | ||
|
|
|
|||
| Balance at December 31, 2019 |
$ | 378,879 | ||
|
|
|
|||
Components of Net Periodic Benefit Cost
The components of net pension expense for the plans for the periods indicated are as follows:
| Three Months Ended March 31, |
Year Ended December 31, |
|||||||||||||||
| 2020 | 2019 | 2019 | 2018 | |||||||||||||
| (unaudited) | ||||||||||||||||
| (In Thousands) |
||||||||||||||||
| Components of net periodic benefit cost: |
||||||||||||||||
| Service cost |
$ | 6,232 | $ | 4,733 | $ | 18,926 | $ | 23,258 | ||||||||
| Interest cost |
2,616 | 2,750 | 10,996 | 11,170 | ||||||||||||
| Expected return on plan assets |
(7,425 | ) | (5,906 | ) | (23,617 | ) | (25,335 | ) | ||||||||
| Prior service cost |
6 | 11 | 44 | 44 | ||||||||||||
| Recognized net actuarial loss |
2,361 | 1,811 | 7,242 | 7,621 | ||||||||||||
|
|
|
|
|
|
|
|
|
|||||||||
| Net periodic benefit cost |
$ | 3,790 | $ | 3,399 | $ | 13,591 | $ | 16,758 | ||||||||
|
|
|
|
|
|
|
|
|
|||||||||
Service costs for the Defined Benefit Plan, the BEP, and the DB SERP are recognized within salaries and employee benefits in the statement of income. Service costs for the Outside Directors’ Retainer Continuance Plan are recognized within professional services in the statement of income.
Benefits expected to be paid
The following table summarizes estimated benefits to be paid from the Defined Benefit Plan and BEP for the plan years beginning on November 1, and the DB SERP and Outside Directors’ Retainer Continuance Plan for the plan years beginning January 1.
| (In Thousands) | ||||
| 2020 |
$ | 32,024 | ||
| 2021 |
24,355 | |||
| 2022 |
24,815 | |||
| 2023 |
26,447 | |||
| 2024 |
26,891 | |||
| In aggregate for 2025 - 2029 |
157,091 | |||
Rabbi trust investments
The Company consolidates a rabbi trust VIE which consists of investments that are used to fund certain executive non-qualified retirement benefits and deferred compensation. These rabbi trust investments consist primarily of cash and cash equivalents, U.S. government agency obligations, equity securities, mutual funds and other exchange-traded funds, and were recorded at fair value. Changes in fair value are recognized in noninterest income. The liabilities associated with these non-qualified plans and deferred compensation are recorded within other liabilities.
F-56
Table of Contents
EASTERN BANK CORPORATION
NOTES TO CONSOLIDATED FINANCIAL STATEMENTS
Assets held in rabbi trust accounts by plan type, at fair value, were as follows:
| As of December 31, | ||||||||
| 2019 | 2018 | |||||||
| (In Thousands) | ||||||||
| Deferred Compensation |
$ | 23,936 | $ | 21,249 | ||||
| DB SERP |
20,003 | 18,183 | ||||||
| DC SERP |
24,564 | 18,947 | ||||||
| Outside Directors’ Retainer Continuance Plan |
3,575 | 3,273 | ||||||
| Benefit Equalization Plan |
5,934 | 3,167 | ||||||
|
|
|
|
|
|||||
| $ | 78,012 | $ | 64,819 | |||||
|
|
|
|
|
|||||
The net unrealized gain on rabbi trust investments still held at the reporting date was $2.0 million and $7.7 million for the three months ended March 31, 2020 and 2019 (unaudited), respectively, and $13.2 million and $3.2 million for the years ended December 31, 2019 and 2018, respectively.
Employee Tax Deferred Incentive Plan
The Company has an employee tax deferred incentive plan (401(k)) under which the Company makes voluntary contributions within certain limitations. All employees who meet specified age and length of service requirements are eligible to participate in the 401(k) plan. The amount contributed by the Company is included in salaries and employee benefits expense. The amounts contributed for the years ended December 31, 2019 and 2018, were $4.2 million and $3.9 million, respectively.
Defined Contribution Supplemental Executive Retirement Plan
The Company has a defined contribution supplemental executive retirement plan, which allows certain senior officers to earn benefits calculated as a percentage of their compensation. The participant benefits are adjusted based upon a deemed investment performance of measurement funds selected by the participant. These measurement funds are for tracking purposes and are used only to track the performance of a mutual fund, market index, savings instrument, or other designated investment or portfolio of investments. The Company recorded expense related to the DC SERP of $1.3 million and $1.4 million in 2019 and 2018, respectively. The total amount due to participants under this plan was included in other liabilities on the Company’s balance sheet and amounted to $24.5 million and $18.6 million at December 31, 2019 and 2018, respectively.
Deferred Compensation
The Company sponsors three plans which allow for elective compensation deferrals by directors, trustees, and certain senior-level employees. Each plan allows its participants to designate deemed investments for deferred amounts from certain options which include diversified choices, such as exchange traded funds, mutual funds, and a deemed fund yielding the highest rate paid by the Company on deposit accounts each month. Portfolios with various risk profiles are available to participants with the approval of the Compensation Committee. The Company purchases and sells investments which track the deemed investment choices, so that it has available funds to meet its payment liabilities. Deferred amounts, adjusted for deemed investment performance, are paid at the time of a participant designated date or event, such as separation from service, death, or disability. The total amounts due to participants under the three plans were included in other liabilities on the Company’s balance sheet and amounted to $23.8 million and $21.0 million at December 31, 2019 and 2018, respectively.
13. Commitments and Contingencies
Financial Instruments with Off-Balance Sheet Risk
In order to meet the financing needs of its customers and to reduce its own exposure to fluctuations in interest rates, the Company is party to financial instruments with off-balance sheet risk in the normal course of business. These financial instruments include commitments to extend credit, standby letters of credit, and forward commitments to sell loans, all of which involve, to varying degrees, elements of credit and interest rate risk in excess of the amount recognized in the consolidated balance sheets. The contract or notional amounts of those instruments reflect the extent of involvement the Company has in each particular class of financial instruments.
F-57
Table of Contents
EASTERN BANK CORPORATION
NOTES TO CONSOLIDATED FINANCIAL STATEMENTS
Substantially all of the Company’s commitments to extend credit, which normally have fixed expiration dates or termination clauses, are contingent upon customers maintaining specific credit standards at the time of loan funding. Standby letters of credit are conditional commitments issued by the Company to guarantee the performance of a customer to a third party. In the event the customer does not perform in accordance with terms of agreement with the third party, the Company would be required to fund the commitment. The maximum potential amount of future payments the Company could be required to make is represented by the contractual amount of the commitment. The credit risk involved in issuing letters of credit is essentially the same as that involved in extending loan facilities to customers. For forward loan sale commitments, the contract or notional amount does not represent exposure to credit loss. The Company does not sell loans with recourse.
The following table summarizes the above financial instruments as of the dates indicated:
| March 31, | December 31, | |||||||||||
| 2020 | 2019 | 2018 | ||||||||||
| (Unaudited) | ||||||||||||
| (In Thousands) | ||||||||||||
| Commitments to extend credit |
$ | 3,575,509 | $ | 3,606,182 | $ | 3,283,069 | ||||||
| Standby letters of credit |
56,472 | 60,124 | 62,683 | |||||||||
| Forward commitments to sell loans |
114,673 | 21,357 | 12,613 | |||||||||
Lease Commitments
The Company leases certain real estate and equipment and office space under various noncancelable operating leases. At December 31, 2019, the Company and its subsidiaries were obligated under non-cancelable leases for minimum rentals in future periods as follows:
| (In Thousands) | ||||
| Years Ending December 31: |
||||
| 2020 |
$ | 13,958 | ||
| 2021 |
12,495 | |||
| 2022 |
10,114 | |||
| 2023 |
8,677 | |||
| 2024 |
5,733 | |||
| Thereafter |
8,556 | |||
|
|
|
|||
| $ | 59,533 | |||
|
|
|
|||
There has been no significant change in the future minimum lease payments payable by the Company since December 31, 2019 (unaudited).
Other Contingencies
The Company has been named a defendant in various legal proceedings arising in the normal course of business. In the opinion of management, based on the advice of legal counsel, the ultimate resolution of these proceedings will not have a material effect on the Company’s consolidated financial statements.
As a member of the Federal Reserve System, the Bank is required to maintain certain reserves of vault cash and/or deposits with the Federal Reserve Bank of Boston. However, in response to the Covid-19 pandemic, the Federal Reserve temporarily eliminated reserve requirements and therefore there was no minimum reserve requirement as of March 31, 2020. The amount of this reserve requirement included in cash and cash equivalents was approximately $3.7 million and $39.8 million on December 31, 2019 and 2018, respectively.
F-58
Table of Contents
EASTERN BANK CORPORATION
NOTES TO CONSOLIDATED FINANCIAL STATEMENTS
14. Derivative Financial Instruments
The Company uses derivative financial instruments to manage the Company’s interest rate risk resulting from the differences in the amount, timing, and duration of known or expected cash receipts and known or expected cash payments. Additionally, the Company enters into interest rate derivatives and foreign exchange contracts to accommodate the business requirements of its customers (“customer-related positions”) and risk participation agreements entered into as financial guarantees of performance on customer-related interest rate swap derivatives. Derivative instruments are carried at fair value in the Company’s financial statements. The accounting for changes in the fair value of a derivative instrument is dependent upon whether or not the instrument qualifies as a hedge for accounting purposes, and further, by the type of hedging relationship.
By using derivatives, the Company is exposed to credit risk to the extent that counterparties to the derivative contracts do not perform as required. Should a counterparty fail to perform under the terms of a derivative contract, the Company’s credit exposure on interest rate swaps is limited to the net positive fair value and accrued interest of all swaps with each counterparty plus any initial margin collateral posted. The Company seeks to minimize counterparty credit risk through credit approvals, limits, monitoring procedures, and obtaining collateral, where appropriate. As such, management believes the risk of incurring credit losses on derivative contracts with those counterparties is remote.
Interest Rate Positions
An interest rate swap is an agreement whereby one party agrees to pay a floating rate of interest on a notional principal amount in exchange for receiving a fixed rate of interest on the same notional amount, for a predetermined period of time, from a second party. The amounts relating to the notional principal amount are not actually exchanged. The Company has entered into interest rate swaps in which they pay floating and receive fixed interest in order to manage its interest rate risk exposure to the variability in interest cash flows on certain floating-rate commercial loans. The Company has interest rate swaps that effectively convert the floating rate one-month LIBOR interest payments received on the commercial loans to a fixed rate and consequently reduce the Bank’s exposure to variability in short-term interest rates. The Company also has interest rate swaps that are based on overnight indexed swap rates. These swaps are accounted for as cash flow hedges and therefore changes in fair value are included in other comprehensive income and reclassified into net income in the same period or periods during which the hedged forecasted transaction affects net income.
The following table reflects the Company’s derivative positions as of March 31, 2020 (unaudited) and December 31, 2019 and 2018 for interest rate swaps which qualify as cash flow hedges for accounting purposes.
| March 31, 2020 |
||||||||||||||||||||
| (Unaudited) | ||||||||||||||||||||
| Weighted Average Rate | ||||||||||||||||||||
| Notional Amount |
Weighted Average Maturity |
Current Rate Paid |
Receive Fixed Swap Rate |
Fair Value (1) | ||||||||||||||||
| (In Thousands) | (In Years) | (In Thousands) | ||||||||||||||||||
| Interest rate swaps on loans |
2,260,000 | 1.96 | 0.70 | % | 2.04 | % | 68 | |||||||||||||
|
|
|
|
|
|||||||||||||||||
| Total |
$ | 2,260,000 | $ | 68 | ||||||||||||||||
|
|
|
|
|
|||||||||||||||||
| December 31, 2019 |
||||||||||||||||||||
| Weighted Average Rate | ||||||||||||||||||||
| Notional Amount |
Weighted Average Maturity |
Current Rate Paid |
Receive Fixed Swap Rate |
Fair Value (1) | ||||||||||||||||
| (In Thousands) | (In Years) | (In Thousands) | ||||||||||||||||||
| Interest rate swaps on loans |
2,120,000 | 2.16 | 1.74 | % | 2.11 | % | (321 | ) | ||||||||||||
|
|
|
|
|
|||||||||||||||||
| Total |
$ | 2,120,000 | $ | (321 | ) | |||||||||||||||
|
|
|
|
|
|||||||||||||||||
F-59
Table of Contents
EASTERN BANK CORPORATION
NOTES TO CONSOLIDATED FINANCIAL STATEMENTS
| December 31, 2018 |
||||||||||||||||||||
| Weighted Average Rate | ||||||||||||||||||||
| Notional Amount |
Weighted Average Maturity |
Current Rate Paid |
Receive Fixed Swap Rate |
Fair Value (1) | ||||||||||||||||
| (In Thousands) | (In Years) | (In Thousands) | ||||||||||||||||||
| Interest rate swaps on loans |
660,000 | 2.58 | 2.46 | % | 2.68 | % | 475 | |||||||||||||
|
|
|
|
|
|||||||||||||||||
| Total |
$ | 660,000 | $ | 475 | ||||||||||||||||
|
|
|
|
|
|||||||||||||||||
| (1) | Fair value included net accrued interest receivable of $1.2 million at March 31, 2020 (unaudited) and $0.4 million and $0.1 million, respectively, at December 31, 2019 and 2018. |
Central banks around the world, including the Federal Reserve, have commissioned working groups of market participants and official sector representatives with the goal of finding suitable replacements for the London Interbank Offered Rate (“LIBOR”) based on observable market transactions because of the probable phase-out of LIBOR. It is expected that a transition away from the widespread use of LIBOR to alternative rates will occur over the course of the next few years. Although the full impact of a transition, including the potential or actual discontinuance of LIBOR publication, remains unclear, this change may have an adverse impact on the value of, return on and trading markets for a broad array of financial products, including any LIBOR-based securities, loans and derivatives that are included in the Company’s financial assets and liabilities. A transition away from LIBOR may also require extensive changes to the contracts that govern these LIBOR-based products, as well as the Company’s systems and processes.
The maximum amount of time over which the Company is currently hedging its exposure to the variability in future cash flows of forecasted transactions related to the receipt of variable interest on existing financial instruments is 3 years.
The Company expects approximately $30.9 million and $10.7 million to be reclassified into interest income from other comprehensive income related to the Company’s cash flow hedges in the next twelve months as of March 31, 2020 (unaudited) and December 31, 2019, respectively. This reclassification is due to anticipated payments that will be received on the swaps based upon the forward curve as of March 31, 2020 (unaudited) and December 31, 2019.
As of March 31, 2020 (unaudited) and December 31, 2019 and 2018, the Company’s exposure to CME and the fair value of interest rate swap derivatives which qualify as cash flow hedges that contain credit-risk related contingent features that are in a net liability position, which includes accrued interest but excludes any adjustment for nonperformance risk, was $0, $0.3 million and $0, respectively. In addition, at March 31, 2020 (unaudited) and December 31, 2019 and 2018, the Company had posted initial-margin collateral in the form of cash and a U.S. Treasury Note, to CME for these derivatives amounting to $23.9 million, $22.8 million and $5.9 million, respectively. The cash and U.S. Treasury Note were considered restricted assets and were included in cash and due from banks and in available for sale securities, respectively.
Customer-Related Positions
Interest rate swaps offered to commercial customers do not qualify as hedges for accounting purposes. These swaps allow the Company to retain variable rate commercial loans while allowing the commercial customer to synthetically fix the loan rate by entering into a variable-to-fixed rate interest rate swap. The Company believes that its exposure to commercial customer derivatives is limited to nonperformance by either the customer or the dealer because these contracts are simultaneously matched at inception with an offsetting dealer transaction.
Risk participation agreements are entered into as financial guarantees of performance on interest rate swap derivatives. The purchased (asset) or sold (liability) guarantee allow the Company to participate-out (fee paid) or participate-in (fee received) the risk associated with certain derivative positions executed with the borrower by the lead bank in a customer-related interest rate swap derivative.
Foreign exchange contracts consist of those offered to commercial customers and those entered into to hedge the Company’s foreign currency risk associated with a foreign-currency loan. Neither qualifies as a hedge for accounting purposes. These commercial customer derivatives are offset with matching derivatives with correspondent-bank
F-60
Table of Contents
EASTERN BANK CORPORATION
NOTES TO CONSOLIDATED FINANCIAL STATEMENTS
counterparties in order to minimize foreign exchange rate risk to the Company. Exposure with respect to these derivatives is largely limited to nonperformance by either the customer or the other counterparty. Neither the Company, nor the correspondent-bank counterparty are required to post collateral but each has established foreign-currency transaction limits to manage the exposure risk. The Company requires its customers to post collateral to minimize risk exposure.
The following table presents the Company’s customer-related derivative positions as of the dates indicated below for those derivatives not designated as hedging.
| March 31, 2020 | ||||||||
| (Unaudited) | ||||||||
| Number of Positions | Total Notional | |||||||
| (Dollars in Thousands) | ||||||||
| Interest rate swaps |
599 | $ | 3,675,250 | |||||
| Risk participation agreements |
65 | 279,683 | ||||||
| Foreign exchange contracts: |
||||||||
| Matched commercial customer book |
88 | 9,233 | ||||||
| Foreign currency loan |
22 | 7,288 | ||||||
| December 31, 2019 | ||||||||
| Interest rate swaps |
603 | $ | 3,749,474 | |||||
| Risk participation agreements |
67 | 299,576 | ||||||
| Foreign exchange contracts: |
||||||||
| Matched commercial customer book |
62 | 29,990 | ||||||
| Foreign currency loan |
23 | 7,310 | ||||||
| December 31, 2018 | ||||||||
| Interest rate swaps |
544 | $ | 3,154,181 | |||||
| Risk participation agreements |
34 | 163,903 | ||||||
| Foreign exchange contracts: |
||||||||
| Matched commercial customer book |
72 | 55,110 | ||||||
| Foreign currency loan |
— | — | ||||||
The level of interest rate swaps, risk participation agreements and foreign currency exchange contracts at the end of each period noted above was commensurate with the activity throughout those periods.
F-61
Table of Contents
EASTERN BANK CORPORATION
NOTES TO CONSOLIDATED FINANCIAL STATEMENTS
The table below presents the fair value of the Company’s derivative financial instruments, as well as their classification on the balance sheet for the periods indicated.
| Asset Derivatives | Liability Derivatives | |||||||||||||||||||||||||||||||
| Balance Sheet Location |
Fair Value as of March 31, 2020 |
Fair Value as of December 31, 2019 |
Fair Value as of December 31, 2018 |
Balance Sheet Location |
Fair Value as of March 31, 2020 |
Fair Value as of December 31, 2019 |
Fair Value as of December 31, 2018 |
|||||||||||||||||||||||||
| (Unaudited) | (Unaudited) | |||||||||||||||||||||||||||||||
| (In Thousands) | ||||||||||||||||||||||||||||||||
| Derivatives designated as hedging instruments |
||||||||||||||||||||||||||||||||
| Interest rate swaps |
Other assets | $ | 136 | $ | — | $ | 475 | Other liabilities | $ | 68 | $ | 321 | $ | — | ||||||||||||||||||
|
|
|
|
|
|
|
|
|
|
|
|
|
|||||||||||||||||||||
| Derivatives not designated as hedging instruments |
||||||||||||||||||||||||||||||||
| Customer-related positions: |
||||||||||||||||||||||||||||||||
| Interest rate swaps |
Other assets | $ | 163,166 | $ | 64,463 | $ | 33,696 | Other liabilities | $ | 49,699 | $ | 18,057 | $ | 26,256 | ||||||||||||||||||
| Risk participation agreements |
Other assets | 949 | 482 | 226 | Other liabilities | 1,374 | 606 | 267 | ||||||||||||||||||||||||
| Foreign currency exchange contracts – matched customer book |
Other assets | 75 | 469 | 547 | Other liabilities | 61 | 428 | 459 | ||||||||||||||||||||||||
| Foreign currency exchange contracts – foreign currency loan |
Other assets | 194 | — | — | Other liabilities | — | 203 | — | ||||||||||||||||||||||||
|
|
|
|
|
|
|
|
|
|
|
|
|
|||||||||||||||||||||
| $ | 164,384 | 65,414 | 34,469 | $ | 51,134 | 19,294 | 26,982 | |||||||||||||||||||||||||
|
|
|
|
|
|
|
|
|
|
|
|
|
|||||||||||||||||||||
| Total |
$ | 164,520 | $ | 65,414 | $ | 34,944 | $ | 51,202 | $ | 19,615 | $ | 26,982 | ||||||||||||||||||||
|
|
|
|
|
|
|
|
|
|
|
|
|
|||||||||||||||||||||
The table below presents the net effect of the Company’s derivative financial instruments on the consolidated income statements as well as the effect of the Company’s derivative financial instruments included in OCI as follows:
| For the Three Months Ended March 31, |
For the Year Ended December 31, |
|||||||||||||||
| 2020 | 2019 | 2019 | 2018 | |||||||||||||
| (Unaudited) | ||||||||||||||||
| (Dollars In Thousands) |
||||||||||||||||
| Derivatives designated as hedges: |
||||||||||||||||
| Gain (loss) in OCI on derivatives |
$ | 43,556 | $ | 5,860 | $ | 20,275 | $ | 5,354 | ||||||||
|
|
|
|
|
|
|
|
|
|||||||||
| Gain (loss) reclassified from OCI into interest income (effective portion) |
$ | 3,112 | 293 | $ | 2,698 | $ | 1,198 | |||||||||
|
|
|
|
|
|
|
|
|
|||||||||
| Derivatives not designated as hedges: |
||||||||||||||||
| Customer-related positions: |
||||||||||||||||
| Gain (loss) recognized in interest rate swap income |
$ | (6,280 | ) | $ | (1,227 | ) | $ | (2,833 | ) | $ | (550 | ) | ||||
| Gain (loss) recognized in interest rate swap income for risk participation agreements |
(301 | ) | 59 | (83 | ) | (35 | ) | |||||||||
| Gain (loss) recognized in other income for foreign currency exchange contracts: |
||||||||||||||||
| Matched commercial customer book |
(26 | ) | 1 | (47 | ) | 36 | ||||||||||
| Foreign currency loan |
397 | 8 | (203 | ) | — | |||||||||||
|
|
|
|
|
|
|
|
|
|||||||||
| Total gain (loss) for derivatives not designated as hedges |
$ | (6,210 | ) | $ | (1,159 | ) | $ | (3,166 | ) | $ | (549 | ) | ||||
|
|
|
|
|
|
|
|
|
|||||||||
The Company has agreements with its customer-related interest rate swap derivative counterparties that contain a provision whereby if the Company defaults on any of its indebtedness, including default where repayment of the indebtedness has not been accelerated by the lender, then the Company could also be declared in default on its derivative obligations.
F-62
Table of Contents
EASTERN BANK CORPORATION
NOTES TO CONSOLIDATED FINANCIAL STATEMENTS
The Company also has agreements with certain of its customer-related interest rate swap derivative correspondent-bank counterparties that contain a provision whereby if the Company fails to maintain its status as a well-capitalized institution, then the counterparty could terminate the derivative positions and the Company would be required to settle its obligations under the agreements.
The Company’s exposure related to its customer-related interest rate swap derivative consists of exposure on cleared derivative transactions and exposure on non-cleared derivative transactions.
Cleared derivative transactions are with CME and exposure is settled to market daily, with additional credit exposure related to initial-margin collateral pledged to CME at trade execution. At March 31, 2020 (unaudited) and December 31, 2019 and 2018, the Company’s exposure to CME for settled variation margin in excess of the customer-related interest rate swap termination values was $0, $1.5 million and $0, respectively. In addition, at March 31, 2020 (unaudited) and December 31, 2019, the Company had posted initial-margin collateral in the form of a U.S. Treasury Note amounting to $37.3 million and $27.6 million, respectively, to CME for these derivatives. At December 31, 2018, the Company posted initial-margin cash collateral of $11.6 million to CME for these derivatives. The cash and U.S. Treasury Note were considered restricted assets and were included in cash and due from banks and in available for sale securities, respectively.
At March 31, 2020 (unaudited) and December 31, 2019 the fair value of non-cleared customer-related interest rate swap derivatives that contain credit-risk related contingent features that are in a net liability position, which includes accrued interest but excludes any adjustment for nonperformance risk, related to these agreements was $49.2 million and $14.6 million, respectively. The Company has minimum collateral posting thresholds with its non-cleared customer-related interest rate swap derivative correspondent-bank counterparties to the extent that the Company has a liability position with the correspondent-bank counterparties. At March 31, 2020 (unaudited) and December 31, 2019, the Company had posted collateral in the form of cash amounting to $48.2 million and $22.2 million, respectively, which was considered to be a restricted asset and was included in other short-term investments. If the Company had breached any of these provisions at March 31, 2020 (unaudited) or December 31, 2019, it would have been required to settle its obligations under the agreements at the termination value. In addition, the Company had cross-default provisions with its commercial customer loan agreements which provide cross-collateralization with the customer loan collateral.
15. Balance Sheet Offsetting
Certain financial instruments, including derivatives, may be eligible for offset in the consolidated balance sheets and/or subject to master netting arrangements or similar agreements. The Company’s derivative transactions with upstream financial institution counterparties are generally executed under International Swaps and Derivative Association master agreements which include “right of set-off” provisions. In such cases there is generally a legally enforceable right to offset recognized amounts. However, the Company does not offset fair value amounts recognized for derivative instruments. The Company nets the amount recognized for the right to reclaim cash collateral against the obligation to return cash collateral arising from derivative instruments executed with the same counterparty under a master netting arrangement. Collateral legally required to be maintained at dealer banks by the Company is monitored and adjusted as necessary. As of March 31, 2020 (unaudited) and December 31, 2019, it was determined that no additional collateral would have to be posted to immediately settle these instruments.
F-63
Table of Contents
EASTERN BANK CORPORATION
NOTES TO CONSOLIDATED FINANCIAL STATEMENTS
The following table presents the Company’s asset and liability positions that were eligible for offset and the potential effect of netting arrangements on its financial position, as of the dates indicated:
| Gross Amounts Not Offset in the Statement of Financial Position |
||||||||||||||||||||||||
| Description |
Gross Amounts of Recognized Assets |
Gross Amounts Offset in the Statement of Financial Position |
Net Amounts of Assets Presented in the Statement of Financial Position |
Financial Instruments |
Cash Collateral Received |
Net Amount |
||||||||||||||||||
| (Dollars In Thousands) | ||||||||||||||||||||||||
| March 31, 2020 | ||||||||||||||||||||||||
| (Unaudited) | ||||||||||||||||||||||||
| Derivative Assets |
||||||||||||||||||||||||
| Interest rate swaps |
$ | 136 | $ | — | $ | 136 | $ | 68 | $ | — | $ | 68 | ||||||||||||
| Customer-related positions: |
||||||||||||||||||||||||
| Interest rate swaps |
163,166 | — | 163,166 | 6 | — | 163,160 | ||||||||||||||||||
| Risk participation agreements |
949 | — | 949 | — | — | 949 | ||||||||||||||||||
| Foreign currency exchange contracts-matched customer book |
75 | — | 75 | 23 | 5 | 47 | ||||||||||||||||||
| Foreign currency exchange contracts-foreign currency loan |
194 | — | 194 | — | — | 194 | ||||||||||||||||||
|
|
|
|
|
|
|
|
|
|
|
|
|
|||||||||||||
| $ | 164,520 | $ | — | $ | 164,520 | $ | 97 | $ | 5 | $ | 164,418 | |||||||||||||
|
|
|
|
|
|
|
|
|
|
|
|
|
|||||||||||||
| Derivative Liabilities |
||||||||||||||||||||||||
| Interest rate swaps |
$ | 68 | $ | — | $ | 68 | $ | 68 | $ | — | $ | — | ||||||||||||
| Customer-related positions: |
||||||||||||||||||||||||
| Interest rate swaps |
49,699 | — | 49,699 | 6 | 49,693 | — | ||||||||||||||||||
| Risk participation agreements |
1,374 | — | 1,374 | — | — | 1,374 | ||||||||||||||||||
| Foreign currency exchange contracts-matched customer book |
61 | — | 61 | 23 | — | 38 | ||||||||||||||||||
| Foreign currency exchange contracts-foreign currency loan |
— | — | — | — | — | — | ||||||||||||||||||
|
|
|
|
|
|
|
|
|
|
|
|
|
|||||||||||||
| $ | 51,202 | $ | — | $ | 51,202 | $ | 97 | $ | 49,693 | $ | 1,412 | |||||||||||||
|
|
|
|
|
|
|
|
|
|
|
|
|
|||||||||||||
F-64
Table of Contents
EASTERN BANK CORPORATION
NOTES TO CONSOLIDATED FINANCIAL STATEMENTS
| Gross Amounts Not Offset in the Statement of Financial Position |
||||||||||||||||||||||||
| Description |
Gross Amounts of Recognized Assets |
Gross Amounts Offset in the Statement of Financial Position |
Net Amounts of Assets Presented in the Statement of Financial Position |
Financial Instruments |
Cash Collateral Received |
Net Amount |
||||||||||||||||||
| (Dollars In Thousands) | ||||||||||||||||||||||||
| December 31, 2019 | ||||||||||||||||||||||||
| Derivative Assets |
||||||||||||||||||||||||
| Interest rate swaps |
$ | — | $ | — | $ | — | $ | — | $ | — | $ | — | ||||||||||||
| Customer-related positions: |
||||||||||||||||||||||||
| Interest rate swaps |
64,463 | — | 64,463 | 1,434 | — | 63,029 | ||||||||||||||||||
| Risk participation agreements |
482 | — | 482 | — | — | 482 | ||||||||||||||||||
| Foreign currency exchange contracts-matched customer book |
469 | — | 469 | 7 | 462 | — | ||||||||||||||||||
| Foreign currency exchange contracts-foreign currency loan |
— | — | — | — | — | — | ||||||||||||||||||
|
|
|
|
|
|
|
|
|
|
|
|
|
|||||||||||||
| $ | 65,414 | $ | — | $ | 65,414 | $ | 1,441 | $ | 462 | $ | 63,511 | |||||||||||||
|
|
|
|
|
|
|
|
|
|
|
|
|
|||||||||||||
| Derivative Liabilities |
||||||||||||||||||||||||
| Interest rate swaps |
$ | 321 | $ | — | $ | 321 | $ | 321 | $ | — | $ | — | ||||||||||||
| Customer-related positions: |
||||||||||||||||||||||||
| Interest rate swaps |
18,057 | — | 18,057 | 1,434 | 16,623 | — | ||||||||||||||||||
| Risk participation agreements |
606 | — | 606 | — | — | 606 | ||||||||||||||||||
| Foreign currency exchange contracts-matched customer book |
428 | — | 428 | 7 | — | 421 | ||||||||||||||||||
| Foreign currency exchange contracts-foreign currency loan |
203 | — | 203 | — | — | 203 | ||||||||||||||||||
|
|
|
|
|
|
|
|
|
|
|
|
|
|||||||||||||
| $ | 19,615 | $ | — | $ | 19,615 | $ | 1,762 | $ | 16,623 | $ | 1,230 | |||||||||||||
|
|
|
|
|
|
|
|
|
|
|
|
|
|||||||||||||
F-65
Table of Contents
EASTERN BANK CORPORATION
NOTES TO CONSOLIDATED FINANCIAL STATEMENTS
| Gross Amounts Not Offset in the Statement of Financial Position |
||||||||||||||||||||||||
| Description |
Gross Amounts of Recognized Assets |
Gross Amounts Offset in the Statement of Financial Position |
Net Amounts of Assets Presented in the Statement of Financial Position |
Financial Instruments |
Cash Collateral Received |
Net Amount |
||||||||||||||||||
| (Dollars In Thousands) | ||||||||||||||||||||||||
| December 31, 2018 | ||||||||||||||||||||||||
| Derivative Assets |
||||||||||||||||||||||||
| Interest rate swaps |
$ | 475 | $ | — | $ | 475 | $ | — | $ | — | $ | 475 | ||||||||||||
| Customer-related positions: |
||||||||||||||||||||||||
| Interest rate swaps |
33,696 | — | $ | 33,696 | 2,849 | 13,350 | 17,497 | |||||||||||||||||
| Risk participation agreements |
226 | 226 | 104 | — | 122 | |||||||||||||||||||
| Foreign currency exchange contracts |
547 | — | 547 | 236 | 311 | — | ||||||||||||||||||
|
|
|
|
|
|
|
|
|
|
|
|
|
|||||||||||||
| $ | 34,944 | $ | — | $ | 34,944 | $ | 3,189 | $ | 13,661 | $ | 18,094 | |||||||||||||
|
|
|
|
|
|
|
|
|
|
|
|
|
|||||||||||||
| Derivative Liabilities |
||||||||||||||||||||||||
| Customer-related positions: |
||||||||||||||||||||||||
| Interest rate swaps |
26,256 | — | 26,256 | 2,849 | 1,786 | 21,621 | ||||||||||||||||||
| Risk participation agreements |
267 | — | 267 | 104 | — | 163 | ||||||||||||||||||
| Foreign currency exchange contracts |
459 | — | 459 | 236 | — | 223 | ||||||||||||||||||
|
|
|
|
|
|
|
|
|
|
|
|
|
|||||||||||||
| $ | 26,982 | $ | — | $ | 26,982 | $ | 3,189 | $ | 1,786 | $ | 22,007 | |||||||||||||
|
|
|
|
|
|
|
|
|
|
|
|
|
|||||||||||||
16. Fair Value of Assets and Liabilities
The Company uses fair value measurements to record adjustments to certain assets and liabilities and to determine fair value disclosures. The fair value of a financial instrument is the price that would be received to sell an asset or paid to transfer a liability in an orderly transaction between market participants at the measurement date. Fair value is best determined based upon quoted market prices. However, in many instances, there are no quoted market prices for the Company’s various financial instruments. In cases where quoted market prices are not available, fair values are based on estimates using present value or other valuation techniques. Those techniques are significantly affected by the assumptions used, including the discount rate and estimates of future cash flows. Accordingly, the fair value estimates may not be realized in an immediate settlement of the instrument.
Fair value is a market-based measure considered from the perspective of a market participant rather than an entity-specific measure. Therefore, even when market assumptions are not readily available, the Company’s own assumptions are set to reflect those that the Company believes market participants would use in pricing the asset or liability at the measurement date. The Company uses prices and inputs that are current as of the measurement date, including during periods of market dislocation. In periods of market dislocation, the observability of prices and inputs may be reduced for many instruments. This condition could cause an instrument to be reclassified from Level 1 to Level 2 or from Level 2 to Level 3.
Fair value estimates are made at a specific point in time, based on relevant market information and information about the financial instrument. These estimates do not reflect any premium or discount that could result from offering for sale at one time the Company’s entire holdings of a particular financial instrument. Because no active market exists for a portion of the Company’s financial instruments, fair value estimates are based on judgements regarding future expected loss experience, current economic conditions, risk characteristics of various financial instruments, and other factors. These estimates are subjective in nature and involve uncertainties and matters of significant judgement, and therefore cannot be determined with precision. Changes in assumptions could significantly affect these estimates.
F-66
Table of Contents
EASTERN BANK CORPORATION
NOTES TO CONSOLIDATED FINANCIAL STATEMENTS
The following methods and assumptions were used by the Company in estimating fair value disclosures:
Cash and Cash Equivalents
For these financial instruments, which have original maturities of 90 days or less, their carrying amounts reported in the consolidated balance sheets approximate fair value.
Trading Securities
Trading securities consisted of fixed income municipal securities and were recorded at fair value. All fixed income securities were categorized as Level 2 as the valuations were estimated by a third-party pricing vendor using a valuation matrix with inputs including observable bond interest rate tables, recent transactions, and yield relationships.
Available for Sale Securities
Available for sale securities consisted of U.S. Treasury securities, U.S. government-sponsored residential mortgage-backed securities, state and municipal bonds, and others such as a qualified zone academy bond, and were recorded at fair value.
The Company’s U.S. Treasury securities are traded on active markets and therefore these securities were classified as Level 1.
The fair value of other U.S. government-sponsored residential mortgage-backed securities was estimated using either a matrix or benchmarks. The inputs used include benchmark yields, reported trades, broker/dealer quotes, and issuer spreads. These securities were categorized as Level 2.
Municipal bonds were classified as Level 2 for the same reasons described for the trading municipal securities.
The valuation technique for the qualified zone academy bond was a discounted cash flow methodology using market discount rates. The assumptions used included at least one significant model assumption or input that was unobservable, and therefore, this security was classified as Level 3.
Fair value was based on the value of one unit without regard to any premium or discount that may result from concentrations of ownership of a financial instrument, possible tax ramifications, or estimated transaction costs. The estimated fair value of the Company’s securities available for sale, by type, is disclosed in Note 3.
Loans Held for Sale
Fair value of loans held for sale, whose carrying amounts approximate fair value, was estimated using the anticipated market price based upon pricing indications provided by investor banks.
Loans
The fair value of commercial, commercial real estate, construction, and certain other consumer loans was estimated by discounting the contractual cash flows using interest rates currently being offered for loans with similar terms to borrowers of similar credit quality.
For residential real estate loans, auto loans, and consumer home equity lines and loans, fair value was estimated by discounting contractual cash flows adjusted for prepayment estimates using interest rates currently being offered for loans with similar terms to borrowers of similar credit quality.
Loans that are deemed to be impaired were recorded at the fair value of the underlying collateral, if the loan is collateral-dependent, or at a carrying value based upon expected cash flows discounted using the loan’s effective interest rate.
F-67
Table of Contents
EASTERN BANK CORPORATION
NOTES TO CONSOLIDATED FINANCIAL STATEMENTS
FHLB Stock
The fair value of FHLB stock approximates the carrying amount based on the redemption provisions of the FHLB.
Rabbi Trust Investments
Rabbi trust investments consisted primarily of cash and cash equivalents, U.S. Government agency obligations, equity securities, mutual funds and other exchange-traded funds, and were recorded at fair value and included in other assets. The purpose of these rabbi trust investments is to fund certain executive non-qualified retirement benefits and deferred compensation.
The fair value of other U.S. government agency obligations was estimated using either a matrix or benchmarks. The inputs used include benchmark yields, reported trades, broker/dealer quotes, and issuer spreads. These securities were categorized as Level 2. The equity securities and other exchange-traded funds were valued based on quoted prices from the market. The equities, mutual funds and exchange-traded funds traded in an active market were categorized as Level 1. Mutual funds at net asset value amounted to $17.0 million at March 31, 2020 (unaudited) and $16.2 million and $15.6 million at December 31, 2019 and 2018, respectively. There were no redemption restrictions on these mutual funds at the end of any period presented.
Bank-Owned Life Insurance
The fair value of bank-owned life insurance was based upon quotations received from bank-owned life insurance dealers.
Deposits
The fair value of deposits with no stated maturity, such as noninterest-bearing demand deposits, savings and interest checking accounts, and money market accounts, was equal to their carrying amount. The fair value of time deposits was based on the discounted value of contractual cash flows using current market interest rates.
The fair value estimates of deposits do not include the benefit that results from the low-cost funding provided by the deposit liabilities compared to the cost of borrowing funds in the wholesale market (core deposit intangibles).
Other Borrowed Funds
For other borrowed funds that mature in 90 days or less, the carrying amount reported in the consolidated balance sheets approximates fair value. For borrowed funds that mature in more than 90 days, the fair value was based on the discounted value of the contractual cash flows applying interest rates currently being offered in the market.
FHLB Advances
The fair value of FHLB advances was based on the discounted value of contractual cash flows. The discount rates used are representative of approximate rates currently offered on instruments with similar remaining maturities.
Escrow Deposits of Borrowers
The fair value of escrow deposits of borrowers, which have no stated maturity, approximates the carrying amount.
Interest Rate Swaps
The fair value of interest rate swaps was determined using discounted cash flow analysis on the expected cash flows of the interest rate swaps. This analysis reflects the contractual terms of the interest rate swaps, including the period of maturity, and uses observable market-based inputs, including interest rate curves and implied volatilities. In addition, for
F-68
Table of Contents
EASTERN BANK CORPORATION
NOTES TO CONSOLIDATED FINANCIAL STATEMENTS
customer-related interest rate swaps, the analysis reflects a credit valuation adjustment to reflect the Company’s own nonperformance risk and the respective counterparty’s nonperformance risk in the fair value measurements. The majority of inputs used to value its interest rate swaps fall within Level 2 of the fair value hierarchy, but the credit valuation adjustments associated with the interest rate swaps utilize Level 3 inputs, such as estimates of current credit spreads to evaluate the likelihood of default by the Company and its counterparties. However, at March 31, 2020 (unaudited) and December 31, 2019, the impact of the Level 3 inputs on the overall valuation of the interest rate swaps was deemed insignificant to the overall valuation. As a result, the interest rate swaps were categorized as Level 2 within the fair value hierarchy.
Risk Participations
The fair value of risk participations was determined based upon the total expected exposure of the derivative which considers the present value of cash flows discounted using market-based inputs and was categorized as Level 2 within the fair value hierarchy. The fair value also included a credit valuation adjustment which evaluates the credit risk of its counterparties by considering factors such as the likelihood of default by the counterparties, its net exposures, the remaining contractual life, as well as the amount of collateral securing the position. The change in value of derivative assets and liabilities attributable to credit risk was not significant during the reported periods.
Foreign Currency Forward Contracts
The fair values of foreign currency forward contracts were based upon the remaining expiration period of the contracts and bid quotations received from foreign exchange contract dealers, and were categorized as Level 2 within the fair value hierarchy.
F-69
Table of Contents
EASTERN BANK CORPORATION
NOTES TO CONSOLIDATED FINANCIAL STATEMENTS
The carrying amounts and estimated fair values of the Company’s financial instruments as of March 31, 2020 (unaudited) and December 31, 2019 and 2018 were as follows:
| As of March 31, | As of December 31, | |||||||||||||||||||||||
| 2020 (Unaudited) |
2019 | 2018 | ||||||||||||||||||||||
| Carrying Amount |
Fair Value | Carrying Amount |
Fair Value | Carrying Amount |
Fair Value | |||||||||||||||||||
| (Dollars In Thousands) | ||||||||||||||||||||||||
| Financial Assets |
||||||||||||||||||||||||
| Cash and cash equivalents |
$ | 766,449 | $ | 766,449 | $ | 362,602 | $ | 362,602 | $ | 259,708 | $ | 259,708 | ||||||||||||
| Trading securities |
652 | 652 | 961 | 961 | 52,899 | 52,899 | ||||||||||||||||||
| Securities available for sale |
1,549,927 | 1,549,927 | 1,508,236 | 1,508,236 | 1,455,898 | 1,455,898 | ||||||||||||||||||
| Loans held for sale |
2,843 | 2,843 | 26 | 26 | 22 | 22 | ||||||||||||||||||
| Loans, net of allowance for loan losses |
8,971,605 | 9,294,256 | 8,889,184 | 9,116,018 | 8,774,913 | 8,914,613 | ||||||||||||||||||
| Accrued interest receivable |
25,631 | 25,631 | 26,835 | 26,835 | 28,407 | 28,407 | ||||||||||||||||||
| FHLB stock |
8,805 | 8,805 | 9,027 | 9,027 | 17,959 | 17,959 | ||||||||||||||||||
| Rabbi trust investments |
68,251 | 68,251 | 78,012 | 78,012 | 64,819 | 64,819 | ||||||||||||||||||
| Bank-owned life insurance |
78,170 | 78,170 | 77,546 | 77,546 | 75,434 | 75,434 | ||||||||||||||||||
| Interest rate swap contracts |
||||||||||||||||||||||||
| Cash flow hedges - interest rate positions |
136 | 136 | — | — | 475 | 475 | ||||||||||||||||||
| Customer-related positions |
163,166 | 163,166 | 64,463 | 64,463 | 33,696 | 33,696 | ||||||||||||||||||
| Risk participation agreements |
949 | 949 | 482 | 482 | 226 | 226 | ||||||||||||||||||
| Foreign currency forward contracts |
||||||||||||||||||||||||
| Matched customer book |
75 | 75 | 469 | 469 | 547 | 547 | ||||||||||||||||||
| Foreign currency loan |
194 | 194 | — | — | — | — | ||||||||||||||||||
| Liabilities |
||||||||||||||||||||||||
| Deposits |
$ | 10,309,011 | $ | 10,308,452 | $ | 9,551,392 | $ | 9,548,889 | $ | 9,399,493 | $ | 9,394,359 | ||||||||||||
| Other borrowed funds |
— | — | 201,082 | 201,082 | 168,776 | 168,776 | ||||||||||||||||||
| FHLB advances |
15,070 | 14,641 | 18,964 | 18,188 | 137,286 | 136,738 | ||||||||||||||||||
| Escrow deposits of borrowers |
16,357 | 16,357 | 15,349 | 15,349 | 14,875 | 14,875 | ||||||||||||||||||
| Accrued interest payable |
817 | 817 | 1,712 | 1,712 | 2,176 | 2,176 | ||||||||||||||||||
| Interest rate swap contracts |
||||||||||||||||||||||||
| Cash flow hedges - interest rate positions |
68 | 68 | 321 | 321 | — | — | ||||||||||||||||||
| Customer-related positions |
49,699 | 49,699 | 18,057 | 18,057 | 26,256 | 26,256 | ||||||||||||||||||
| Risk participation agreements |
1,374 | 1,374 | 606 | 606 | 267 | 267 | ||||||||||||||||||
| Foreign currency forward contracts |
||||||||||||||||||||||||
| Matched customer book |
61 | 61 | 428 | 428 | 459 | 459 | ||||||||||||||||||
| Foreign currency loan |
— | — | 203 | 203 | — | — | ||||||||||||||||||
F-70
Table of Contents
EASTERN BANK CORPORATION
NOTES TO CONSOLIDATED FINANCIAL STATEMENTS
The following tables present the balances of assets and liabilities measured at fair value on a recurring basis as of March 31, 2020 (unaudited) and December 31, 2019 and 2018:
| Description |
Balance as of March 31, 2020 |
Quoted Prices in Active Markets for Identical Assets (Level 1) |
Significant Other Observable Inputs (Level 2) |
Significant Unobservable Inputs (Level 3) |
||||||||||||
| (Unaudited) | ||||||||||||||||
| (Dollars In Thousands) | ||||||||||||||||
| Assets |
||||||||||||||||
| Trading securities |
||||||||||||||||
| Municipal bonds |
$ | 652 | $ | — | $ | 652 | $ | — | ||||||||
| Securities available for sale |
||||||||||||||||
| U.S. Treasury securities |
61,235 | 61,235 | — | |||||||||||||
| Government-sponsored residential mortgage-backed securities |
1,203,489 | — | 1,203,489 | — | ||||||||||||
| State and municipal bonds and obligations |
278,954 | — | 278,954 | — | ||||||||||||
| Other bonds |
6,249 | — | — | 6,249 | ||||||||||||
| Rabbi trust investments |
68,251 | 52,860 | 15,391 | — | ||||||||||||
| Interest rate swap contracts |
||||||||||||||||
| Cash flow hedges - interest rate positions |
136 | 136 | ||||||||||||||
| Customer-related positions |
163,166 | — | 163,166 | — | ||||||||||||
| Risk participation agreements |
949 | — | 949 | — | ||||||||||||
| Foreign currency forward contracts |
— | |||||||||||||||
| Matched customer book |
75 | 75 | — | |||||||||||||
| Foreign currency loan |
194 | — | 194 | — | ||||||||||||
|
|
|
|
|
|
|
|
|
|||||||||
| Total |
$ | 1,783,350 | $ | 114,095 | $ | 1,663,006 | $ | 6,249 | ||||||||
|
|
|
|
|
|
|
|
|
|||||||||
| Liabilities |
||||||||||||||||
| Interest rate swap contracts |
||||||||||||||||
| Cash flow hedges - interest rate positions |
$ | 68 | $ | — | $ | 68 | $ | — | ||||||||
| Customer-related positions |
49,699 | — | 49,699 | — | ||||||||||||
| Risk participation agreements |
1,374 | — | 1,374 | — | ||||||||||||
| Foreign currency forward contracts |
— | |||||||||||||||
| Matched customer book |
61 | — | 61 | — | ||||||||||||
| Foreign currency loan |
— | — | — | — | ||||||||||||
|
|
|
|
|
|
|
|
|
|||||||||
| Total |
$ | 51,202 | $ | — | $ | 51,202 | $ | — | ||||||||
|
|
|
|
|
|
|
|
|
|||||||||
F-71
Table of Contents
EASTERN BANK CORPORATION
NOTES TO CONSOLIDATED FINANCIAL STATEMENTS
| Fair Value Measurements at Reporting Date Using | ||||||||||||||||
| Description |
Balance as of December 31, 2019 |
Quoted Prices in Active Markets for Identical Assets (Level 1) |
Significant Other Observable Inputs (Level 2) |
Significant Unobservable Inputs (Level 3) |
||||||||||||
| (Dollars In Thousands) | ||||||||||||||||
| Assets |
||||||||||||||||
| Trading securities |
||||||||||||||||
| Municipal bonds |
$ | 961 | $ | — | $ | 961 | $ | — | ||||||||
| U.S. Treasury notes |
— | — | — | — | ||||||||||||
| Securities available for sale |
||||||||||||||||
| U.S. Treasury securities |
50,420 | 50,420 | — | |||||||||||||
| Government-sponsored residential mortgage-backed securities |
1,167,968 | — | 1,167,968 | — | ||||||||||||
| State and municipal bonds and obligations |
283,538 | — | 283,538 | — | ||||||||||||
| Other bonds |
6,310 | — | — | 6,310 | ||||||||||||
| Rabbi trust investments |
78,012 | 63,945 | 14,067 | — | ||||||||||||
| Interest rate swap contracts |
||||||||||||||||
| Customer-related positions |
64,463 | — | 64,463 | — | ||||||||||||
| Risk participation agreements |
482 | — | 482 | — | ||||||||||||
| Foreign currency forward contracts |
— | |||||||||||||||
| Matched customer book |
469 | 469 | — | |||||||||||||
|
|
|
|
|
|
|
|
|
|||||||||
| Total |
$ | 1,652,623 | $ | 114,365 | $ | 1,531,948 | $ | 6,310 | ||||||||
|
|
|
|
|
|
|
|
|
|||||||||
| Liabilities |
||||||||||||||||
| Interest rate swap contracts |
||||||||||||||||
| Cash flow hedges - interest rate positions |
$ | 321 | $ | — | $ | 321 | $ | — | ||||||||
| Customer-related positions |
18,057 | — | 18,057 | — | ||||||||||||
| Risk participation agreements |
606 | — | 606 | — | ||||||||||||
| Foreign currency forward contracts |
||||||||||||||||
| Matched customer book |
428 | — | 428 | — | ||||||||||||
| Foreign currency loan |
203 | — | 203 | — | ||||||||||||
|
|
|
|
|
|
|
|
|
|||||||||
| Total |
$ | 19,615 | $ | — | $ | 19,615 | $ | — | ||||||||
|
|
|
|
|
|
|
|
|
|||||||||
F-72
Table of Contents
EASTERN BANK CORPORATION
NOTES TO CONSOLIDATED FINANCIAL STATEMENTS
| Fair Value Measurements at Reporting Date Using | ||||||||||||||||
| Description |
Balance as of December 31, 2018 |
Quoted Prices in Active Markets for Identical Assets (Level 1) |
Significant Other Observable Inputs (Level 2) |
Significant Unobservable Inputs (Level 3) |
||||||||||||
| (Dollars In Thousands) | ||||||||||||||||
| Assets |
||||||||||||||||
| Trading securities |
||||||||||||||||
| Municipal bonds |
$ | 52,899 | $ | — | $ | 52,899 | $ | — | ||||||||
| Securities available for sale |
||||||||||||||||
| Government-sponsored residential mortgage-backed securities |
1,136,137 | — | 1,136,137 | — | ||||||||||||
| State and municipal bonds and obligations |
313,716 | — | 313,716 | — | ||||||||||||
| Other bonds |
6,045 | — | — | 6,045 | ||||||||||||
| Rabbi trust investments |
64,819 | 54,754 | 10,065 | — | ||||||||||||
| Interest rate swap contracts |
||||||||||||||||
| Cash flow hedges - interest rate positions |
475 | 475 | ||||||||||||||
| Customer-related positions |
33,696 | — | 33,696 | — | ||||||||||||
| Risk participations |
226 | — | 226 | — | ||||||||||||
| Foreign currency forward contracts |
547 | — | 547 | — | ||||||||||||
|
|
|
|
|
|
|
|
|
|||||||||
| Total |
$ | 1,608,560 | $ | 54,754 | $ | 1,547,761 | $ | 6,045 | ||||||||
|
|
|
|
|
|
|
|
|
|||||||||
| Liabilities |
||||||||||||||||
| Interest rate swap contracts |
||||||||||||||||
| Cash flow hedges - interest rate positions |
$ | 26,256 | $ | — | $ | 26,256 | $ | — | ||||||||
| Risk participations |
267 | — | 267 | — | ||||||||||||
| Foreign currency forward contracts |
459 | — | 459 | — | ||||||||||||
|
|
|
|
|
|
|
|
|
|||||||||
| Total |
$ | 26,982 | $ | — | $ | 26,982 | $ | — | ||||||||
|
|
|
|
|
|
|
|
|
|||||||||
There were no transfers to or from Level 1, 2 and 3 during the three months ended March 31, 2020 (unaudited) and years ended December 31, 2019 or 2018.
For the fair value measurements which are classified as Level 3 within the fair value hierarchy, the Company’s Treasury and Finance groups determine the valuation policies and procedures. For the valuation of the qualified zone academy bond, the Company uses third-party valuation information. Management determined that no changes to the quantitative unobservable inputs were necessary. Management employs various techniques to analyze the valuation it receives from third parties, such as analyzing changes in market yields. Management reviews changes in fair value from period to period to ensure that values received from the third parties are consistent with their expectation of the market.
F-73
Table of Contents
EASTERN BANK CORPORATION
NOTES TO CONSOLIDATED FINANCIAL STATEMENTS
The table below presents a reconciliation for all assets and liabilities measured at fair value on a recurring basis using significant unobservable inputs (Level 3) during the three months ended March 31, 2020 (unaudited) and years ended December 31, 2019 and 2018:
| Securities Available for Sale |
||||
| (Dollars In Thousands) |
||||
| Balance at January 1, 2018 |
$ | 5,936 | ||
| Gains and losses (realized/unrealized): |
||||
| Included in net income |
109 | |||
|
|
|
|||
| Balance at December 31, 2018 |
6,045 | |||
| Gains and losses (realized/unrealized): |
||||
| Included in earnings |
28 | |||
| Included in other comprehensive income |
— | |||
|
|
|
|||
| Balance at March 31, 2019 (unaudited) |
$ | 6,073 | ||
|
|
|
|||
| Balance at January 1, 2019 |
$ | 6,045 | ||
| Gains and losses (realized/unrealized): |
||||
| Included in net income |
109 | |||
| Included in other comprehensive income |
156 | |||
|
|
|
|||
| Balance at December 31, 2019 |
6,310 | |||
|
|
|
|||
| Gains and losses (realized/unrealized): |
||||
| Included in earnings |
27 | |||
| Included in other comprehensive income |
(88 | ) | ||
|
|
|
|||
| Balance at March 31, 2020 (unaudited) |
$ | 6,249 | ||
|
|
|
|||
The Company may also be required, from time to time, to measure certain other assets on a nonrecurring basis in accordance with generally accepted accounting principles. The following table summarizes the fair value of assets and liabilities measured at fair value on a nonrecurring basis, as of March 31, 2020 (unaudited) and December 31, 2019 and 2018. The gain/(loss) represents the amount of write-down recorded during the three months ended March 31, 2020 (unaudited) and the years ended December 31, 2019 and 2018 on the assets held at the periods indicated.
| Fair Value Measurements at Reporting Date Using | ||||||||||||||||||||
| Description |
Balance as of March 31, 2020 |
Quoted Prices in Active Markets for Identical Assets (Level 1) |
Significant Other Observable Inputs (Level 2) |
Significant Unobservable Inputs (Level 3) |
Total Gains (Losses) |
|||||||||||||||
| (Unaudited) |
||||||||||||||||||||
| (Dollars In Thousands) | ||||||||||||||||||||
| Assets |
||||||||||||||||||||
| Other real estate owned |
$ | 40 | $ | — | $ | — | $ | 40 | $ | — | ||||||||||
| Collateral-dependent impaired loans whose fair value is based upon appraisals |
$ | 18,859 | $ | — | $ | — | $ | 18,859 | $ | (1,035 | ) | |||||||||
|
|
|
|
|
|
|
|
|
|
|
|||||||||||
| Total |
$ | 18,899 | $ | — | $ | — | $ | 18,899 | $ | (1,035 | ) | |||||||||
|
|
|
|
|
|
|
|
|
|
|
|||||||||||
| Fair Value Measurements at Reporting Date Using | ||||||||||||||||||||
| Description |
Balance as of December 31, 2019 |
Quoted Prices in Active Markets for Identical Assets (Level 1) |
Significant Other Observable Inputs (Level 2) |
Significant Unobservable Inputs (Level 3) |
Total Gains (Losses) |
|||||||||||||||
| (Dollars In Thousands) | ||||||||||||||||||||
| Assets |
||||||||||||||||||||
| Collateral-dependent impaired loans whose fair value is based upon appraisals |
$ | 4,261 | $ | — | $ | — | $ | 4,261 | $ | (1,089 | ) | |||||||||
|
|
|
|
|
|
|
|
|
|
|
|||||||||||
F-74
Table of Contents
EASTERN BANK CORPORATION
NOTES TO CONSOLIDATED FINANCIAL STATEMENTS
| Fair Value Measurements at Reporting Date Using | ||||||||||||||||||||
| Description |
Balance as of December 31, 2018 |
Quoted Prices in Active Markets for Identical Assets (Level 1) |
Significant Other Observable Inputs (Level 2) |
Significant Unobservable Inputs (Level 3) |
Total Gains (Losses) |
|||||||||||||||
| (Dollars In Thousands) | ||||||||||||||||||||
| Assets |
||||||||||||||||||||
| Other real estate owned |
$ | 35 | $ | — | $ | — | $ | 35 | $ | — | ||||||||||
| Collateral-dependent impaired loans whose fair value is based upon appraisals |
12,039 | — | — | 12,039 | (1,311 | ) | ||||||||||||||
|
|
|
|
|
|
|
|
|
|
|
|||||||||||
| Total |
$ | 12,074 | $ | — | $ | — | $ | 12,074 | $ | (1,311 | ) | |||||||||
|
|
|
|
|
|
|
|
|
|
|
|||||||||||
For the valuation of the other real estate owned and collateral-dependent impaired loans, the Company relies primarily on third-party valuation information from certified appraisers and values are generally based upon recent appraisals of the underlying collateral, brokers’ opinions based upon recent sales of comparable properties, estimated equipment auction or liquidation values, income capitalization, or a combination of income capitalization and comparable sales. Depending on the type of underlying collateral, valuations may be adjusted by management for qualitative factors such as economic factors and estimated liquidation expenses. The range of these possible adjustments may vary.
Impaired loans in which the reserve was established based upon expected cash flows discounted at the loan’s effective interest rate are not deemed to be measured at fair value.
17. Revenue from Contracts with Customers
The Company adopted the new revenue recognition standard under ASC 606 on January 1, 2019 using the modified retrospective approach. Revenue recognition remained substantially unchanged following adoption of ASC 606 and, therefore, there were no material changes to the Company’s consolidated financial statements at or for the year ended December 31, 2019, as a result of adopting the new guidance.
The Company derives a portion of its noninterest income from contracts with customers, as such, revenue from such arrangements is recognized when control of goods or services is transferred to the customer, in an amount that reflects the consideration to which the entity expects to be entitled in exchange for those goods or services. The Company considers the terms of the contract and all relevant facts and circumstances when applying this guidance. The Company measures revenue and timing of recognition by applying the following five steps:
| 1. | Identify the contract(s) with the customers |
| 2. | Identify the performance obligations |
| 3. | Determine the transaction price |
| 4. | Allocate the transaction price to the performance obligations |
| 5. | Recognize revenue when (or as) the entity satisfies a performance obligation |
The Company accounts for a contract when it has approval and commitment from both parties, the rights of the parties are identified, payment terms are identified, the contract has commercial substance and collectability of consideration is probable.
Performance obligations
The Company’s performance obligations are generally satisfied either at a point in time or over time, as services are rendered. Unsatisfied performance obligations at the report date are not material to the Company’s consolidated financial statements.
F-75
Table of Contents
EASTERN BANK CORPORATION
NOTES TO CONSOLIDATED FINANCIAL STATEMENTS
The Company has disaggregated its revenue within the scope of ASC 606 by type of service, as presented in the table below. These categories reflect how the nature, amount, timing, and uncertainty of revenue and cash flows are affected by economic factors.
| For the three months ended March 31, |
For the years ended December 31, |
|||||||||||||||
| 2020 | 2019 | 2019 | 2018 | |||||||||||||
| (Unaudited) | ||||||||||||||||
| (Dollars In Thousands) | ||||||||||||||||
| Insurance commissions |
$ | 27,477 | $ | 24,762 | $ | 90,587 | $ | 91,885 | ||||||||
| Service charges on deposit accounts |
6,098 | 6,404 | 27,043 | 26,897 | ||||||||||||
| Trust and investment advisory fees |
5,095 | 4,628 | 19,653 | 19,128 | ||||||||||||
| Debit card processing fees |
2,470 | 2,410 | 10,452 | 16,162 | ||||||||||||
| Other non-interest income |
2,052 | 1,874 | 8,483 | 9,981 | ||||||||||||
|
|
|
|
|
|
|
|
|
|||||||||
| Total noninterest income in-scope of |
43,192 | |
40,078 |
|
156,218 | 164,053 | ||||||||||
| Total noninterest income out-of-scope of ASC 606 |
(9,823) | 7,722 | 26,081 | 16,542 | ||||||||||||
|
|
|
|
|
|
|
|
|
|||||||||
| Total noninterest income |
$ | 33,369 | $ | 47,800 | $ | 182,299 | $ | 180,595 | ||||||||
|
|
|
|
|
|
|
|
|
|||||||||
Additional information related to each of the revenue streams is further noted below.
Insurance Commissions
The Company acts as an agent in offering property, casualty, and life and health insurance to both commercial and consumer customers though Eastern Insurance Group LLC. The Company earns a fixed commission on the sales of these products and services. The Company may also earn bonus commissions based upon meeting certain volume thresholds. In general, the Company recognizes commission revenues when earned based upon the effective date of the policy. For certain insurance products, the Company may also earn and recognize annual residual commissions commensurate with annual premiums being paid.
The Company also earns profit sharing, or contingency revenues from the insurers with whom the Company places business. These profit sharing revenues are performance bonuses from the insurers based upon certain performance metrics such as floors on written premiums, loss rates, and growth rates. Because the Company’s expectation of the ultimate profit sharing revenue amounts to be earned can vary from period to period, the Company does not recognize this revenue until it has concluded that, based on all the facts and information available, it is probable that a significant revenue reversal will not occur in future periods.
Insurance commissions earned but not yet received amounted to $3.3 million and $3.7 million as of March 31, 2020 and 2019 (unaudited), respectively, and $3.9 million and $4.6 million as of December 31, 2019 and 2018, respectively, and were included in other assets.
Deposit Service Charges
The Company offers various deposit account products to its customers governed by specific deposit agreements applicable to either personal customers or business customers. These agreements identify the general conditions and obligations of both parties and include standard information regarding deposit account-related fees.
Deposit account services include providing access to deposit accounts as well as access to the various deposit transactional services of the Company. These transactional services are primarily those that are identified in the standard fee schedule, and include, but are not limited to, services such as overdraft protection, wire transfer, and check collection. The Company charges monthly fixed service fees associated with the customer having access to the deposit account as well as
F-76
Table of Contents
EASTERN BANK CORPORATION
NOTES TO CONSOLIDATED FINANCIAL STATEMENTS
separate fixed fees associated with and at the time specific transactions are entered into by the customer. As such, the Company considers that its performance obligations are fulfilled when customers are provided deposit account access or when the requested deposit transaction is completed.
Cash Management
Cash management services are a subset of the deposit service charges revenue stream. These services include ACH transaction processing, positive pay, lockbox, and remote deposit services. These services are also governed by separate agreements entered into by the customer. The fee arrangement for these services is structured as a fixed fee per transaction which may be offset by earnings credits. An earnings credit is a discount that a customer receives based upon the investable balance in the applicable covered deposit account(s) for a given month. Earnings credits are only good for the given month. That is, if cash management fees for a given month are less than the month’s earnings credit, the remainder of the credit does not carry over to the following month. Cash management fees are recognized as revenue in the month that the services are provided. Cash Management fees earned but not yet received amounted to $0.8 million and $0.7 million, respectively, for the three months ended March 31, 2020 and 2019 (unaudited), and $0.8 million and $0.7 million for the years ended December 31, 2019 and 2018, respectively, and were included in other assets.
Debit Card Processing Fees
The Company provides debit cards to its customers which are authorized and settled through various card payment networks, and in exchange, the Company earns revenue as determined by each payment network’s interchange program. Regardless of the network that is utilized to authorize and settle the payment, the merchant that provides the product or service to the debit card holder is ultimately responsible for the interchange payment to the Company. Debit card processing fees are recognized as card transactions are settled within each network. Debit card processing fees earned but not yet received amounted to $0.3 million for the three months ended March 31, 2020 and 2019 (unaudited) and for the years ended December 31, 2019 and 2018 and were included in other assets.
Trust and Investment Advisory Fees
The Company offers investment management and trust services to individuals, institutions, small businesses and charitable institutions. Each investment management product is governed by its own contract along with a separate identifiable fee schedule unique to that product. The Company also offers additional services, such as estate settlement, financial planning, tax services, and other special services quoted at the customer’s request.
The asset management and/or custody fees are primarily based upon a percentage of the monthly valuation of the principal assets in the customer’s account. Customers are also charged a base fee which is prorated over a twelve-month period. Fees for additional or special services are generally fixed in nature and are charged as services are rendered. All revenue is recognized in correlation to the monthly management fee determinations or as transactional services are provided.
Other Noninterest Income
The Company earns various types of other noninterest income that fall within the scope of the new revenue recognition rules and have been aggregated into one general revenue stream in the table noted above. The amount includes, but is not limited to, the following types of revenue with customers: safe deposit rent, ATM surcharge fees, customer checkbook fees and insured cash sweep fee income. Individually, these sources of noninterest income are immaterial.
F-77
Table of Contents
EASTERN BANK CORPORATION
NOTES TO CONSOLIDATED FINANCIAL STATEMENTS
18. Other Comprehensive Income
The following tables present a reconciliation of the changes in the components of other comprehensive income (loss) for the dates indicated including the amount of income tax (expense) benefit allocated to each component of other comprehensive income (loss):
| Three Months Ended March 31, 2020 | ||||||||||||
| Pre Tax Amount |
Tax (Expense) Benefit |
After Tax Amount |
||||||||||
| (Unaudited) | ||||||||||||
| (Dollars in Thousands) | ||||||||||||
| Unrealized gains (losses) on securities available for sale: |
||||||||||||
| Change in fair value of securities available for sale |
$ | 33,802 | $ | (7,515 | ) | $ | 26,287 | |||||
| Less: reclassification adjustment for gains (losses) included in net income |
122 | (27 | ) | 95 | ||||||||
|
|
|
|
|
|
|
|||||||
| Net change in fair value of securities available for sale |
33,680 | (7,488 | ) | 26,192 | ||||||||
| Unrealized gains (losses) on cash flow hedges: |
||||||||||||
| Change in fair value of cash flow hedges |
43,556 | (12,244 | ) | 31,312 | ||||||||
| Less: net cash flow hedge losses reclassified into interest income |
3,112 | (875 | ) | 2,237 | ||||||||
|
|
|
|
|
|
|
|||||||
| Net change in fair value of cash flow hedges |
40,444 | (11,369 | ) | 29,075 | ||||||||
|
|
|
|
|
|
|
|||||||
| Total other comprehensive income |
$ | 74,124 | $ | (18,857 | ) | $ | 55,267 | |||||
|
|
|
|
|
|
|
|||||||
| Three Months Ended March 31, 2019 | ||||||||||||
| Pre Tax Amount |
Tax (Expense) Benefit |
After Tax Amount |
||||||||||
| (Unaudited) | ||||||||||||
| (Dollars in Thousands) | ||||||||||||
| Unrealized gains (losses) on securities available for sale: |
||||||||||||
| Change in fair value of securities available for sale |
$ | 32,129 | $ | (7,100 | ) | $ | 25,029 | |||||
| Less: reclassification adjustment for gains (losses) included in net income |
50 | (11 | ) | 39 | ||||||||
|
|
|
|
|
|
|
|||||||
| Net change in fair value of securities available for sale |
32,079 | (7,089 | ) | 24,990 | ||||||||
| Unrealized gains (losses) on cash flow hedges: |
||||||||||||
| Change in fair value of cash flow hedges |
5,860 | (1,647 | ) | 4,213 | ||||||||
| Less: net cash flow hedge losses reclassified into interest income |
293 | (82 | ) | 211 | ||||||||
|
|
|
|
|
|
|
|||||||
| Net change in fair value of cash flow hedges |
5,567 | (1,565 | ) | 4,002 | ||||||||
|
|
|
|
|
|
|
|||||||
| Total other comprehensive income |
$ | 37,646 | $ | (8,654 | ) | $ | 28,992 | |||||
|
|
|
|
|
|
|
|||||||
| Year Ended December 31, 2019 | ||||||||||||
| Pre Tax Amount |
Tax (Expense) Benefit |
After Tax Amount |
||||||||||
| (Dollars In Thousands) | ||||||||||||
| Unrealized gains (losses) on securities available for sale: |
||||||||||||
| Change in fair value of securities available for sale |
$ | 54,881 | $ | (12,166 | ) | $ | 42,715 | |||||
| Less: reclassification adjustment for gains (losses) included in net income |
2,016 | (459 | ) | 1,557 | ||||||||
|
|
|
|
|
|
|
|||||||
| Net change in fair value of securities available for sale |
52,865 | (11,707 | ) | 41,158 | ||||||||
| Unrealized gains (losses) on cash flow hedges: |
||||||||||||
| Change in fair value of cash flow hedges |
20,275 | (5,699 | ) | 14,576 | ||||||||
| Less: net cash flow hedge losses reclassified into interest income |
2,698 | (758 | ) | 1,940 | ||||||||
|
|
|
|
|
|
|
|||||||
| Net change in fair value of cash flow hedges |
17,577 | (4,941 | ) | 12,636 | ||||||||
| Defined benefit pension plans: |
||||||||||||
| (Amortization) of actuarial net loss |
(7,242 | ) | 2,036 | (5,206 | ) | |||||||
| Change in actuarial net loss |
37,722 | (10,603 | ) | 27,119 | ||||||||
| (Amortization) of prior service cost |
(44 | ) | 11 | (33 | ) | |||||||
|
|
|
|
|
|
|
|||||||
| Net change in actuarial net loss |
30,436 | (8,556 | ) | 21,880 | ||||||||
|
|
|
|
|
|
|
|||||||
| Total other comprehensive income |
$ | 40,006 | $ | (8,092 | ) | $ | 31,914 | |||||
|
|
|
|
|
|
|
|||||||
F-78
Table of Contents
EASTERN BANK CORPORATION
NOTES TO CONSOLIDATED FINANCIAL STATEMENTS
| Year Ended December 31, 2018 | ||||||||||||
| Pre Tax Amount |
Tax (Expense) Benefit |
After Tax Amount |
||||||||||
| (Dollars In Thousands) | ||||||||||||
| Unrealized gains (losses) on securities available for sale: |
||||||||||||
| Change in fair value of securities available for sale |
$ | (39,144 | ) | $ | 8,659 | $ | (30,485 | ) | ||||
| Less: reclassification adjustment for gains (losses) included in net income |
50 | (10 | ) | 40 | ||||||||
|
|
|
|
|
|
|
|||||||
| Net change in fair value of securities available for sale |
(39,194 | ) | 8,669 | (30,525 | ) | |||||||
| Unrealized gains (losses) on cash flow hedges: |
||||||||||||
| Change in fair value of cash flow hedges |
5,354 | (1,505 | ) | 3,849 | ||||||||
| Less: net cash flow hedge losses reclassified into interest income |
1,198 | (337 | ) | 861 | ||||||||
|
|
|
|
|
|
|
|||||||
| Net change in fair value of cash flow hedges |
4,156 | (1,168 | ) | 2,988 | ||||||||
| Defined benefit pension plans: |
||||||||||||
| (Amortization) of actuarial net loss |
(7,621 | ) | 2,142 | (5,479 | ) | |||||||
| Change in actuarial net loss |
(2,680 | ) | 754 | (1,926 | ) | |||||||
| (Amortization) of prior service cost |
(44 | ) | 12 | (32 | ) | |||||||
|
|
|
|
|
|
|
|||||||
| Net change in actuarial net loss |
(10,345 | ) | 2,908 | (7,437 | ) | |||||||
|
|
|
|
|
|
|
|||||||
| Total other comprehensive income |
$ | (24,693 | ) | $ | 4,593 | $ | (20,100 | ) | ||||
|
|
|
|
|
|
|
|||||||
Effective in 2018 and as a result of ASU 2018-02, Reporting Comprehensive Income, the Company elected to reclassify certain tax effects from accumulated other comprehensive income to retained earnings related to items that were stranded in comprehensive income as a result of the Tax Cut and Jobs Act. This served to increase retained earnings and decrease accumulated other comprehensive loss by $7.2 million.
F-79
Table of Contents
EASTERN BANK CORPORATION
NOTES TO CONSOLIDATED FINANCIAL STATEMENTS
The following table illustrates the changes in the balances of each component of accumulated other comprehensive income (loss), net of tax:
| Unrealized Gains and (Losses) on Available-for-Sale Securities |
Unrealized Gains and (Losses) on Cash Flow Hedges |
Defined Benefit Pension Items |
Total | |||||||||||||
| (Dollars in Thousands) | ||||||||||||||||
| Beginning balance: January 1, 2018 |
$ | 11,165 | $ | — | $ | 66,826 | $ | (55,661 | ) | |||||||
| Other comprehensive income (loss) before reclassifications |
(30,485 | ) | 3,849 | — | (26,636 | ) | ||||||||||
| Less: Amounts reclassified from accumulated other comprehensive income |
40 | 861 | 7,437 | (6,536 | ) | |||||||||||
|
|
|
|
|
|
|
|
|
|||||||||
| Net current-period other comprehensive income |
(30,525 | ) | 2,988 | (7,437 | ) | (20,100 | ) | |||||||||
|
|
|
|
|
|
|
|
|
|||||||||
| Ending balance: December 31, 2018 |
(19,360 | ) | 2,988 | 59,389 | (75,761 | ) | ||||||||||
|
|
|
|
|
|
|
|
|
|||||||||
| Other comprehensive income (loss) before reclassifications |
25,029 | 4,213 | — | 29,242 | ||||||||||||
| Less: Amounts reclassified from accumulated other comprehensive income |
39 | 211 | — | 250 | ||||||||||||
|
|
|
|
|
|
|
|
|
|||||||||
| Net current-period other comprehensive income |
24,990 | 4,002 | — | 28,992 | ||||||||||||
|
|
|
|
|
|
|
|
|
|||||||||
| Ending balance: March 31, 2019 (unaudited) |
$ | 5,630 | $ | 6,990 | $ | 59,389 | $ | (46,769 | ) | |||||||
|
|
|
|
|
|
|
|
|
|||||||||
| Beginning balance: January 1, 2019 |
$ | (19,360 | ) | $ | 2,988 | $ | 59,389 | $ | (75,761 | ) | ||||||
| Other comprehensive income (loss) before reclassifications |
42,715 | 14,576 | 27,119 | 30,172 | ||||||||||||
| Less: Amounts reclassified from accumulated other comprehensive income |
1,557 | 1,940 | 5,239 | (1,742 | ) | |||||||||||
|
|
|
|
|
|
|
|
|
|||||||||
| Net current-period other comprehensive income |
41,158 | 12,636 | 21,880 | 31,914 | ||||||||||||
|
|
|
|
|
|
|
|
|
|||||||||
| Ending balance: December 31, 2019 |
$ | 21,798 | $ | 15,624 | $ | 81,269 | $ | (43,847 | ) | |||||||
|
|
|
|
|
|
|
|
|
|||||||||
| Other comprehensive income (loss) before reclassifications |
26,287 | 31,312 | — | 57,599 | ||||||||||||
| Less: Amounts reclassified from accumulated other comprehensive income |
95 | 2,237 | — | 2,332 | ||||||||||||
|
|
|
|
|
|
|
|
|
|||||||||
| Net current-period other comprehensive income |
26,192 | 29,075 | — | 55,267 | ||||||||||||
|
|
|
|
|
|
|
|
|
|||||||||
| Ending balance: March 31, 2020 (unaudited) |
$ | 47,990 | $ | 44,699 | $ | 81,269 | $ | 11,420 | ||||||||
|
|
|
|
|
|
|
|
|
|||||||||
F-80
Table of Contents
EASTERN BANK CORPORATION
NOTES TO CONSOLIDATED FINANCIAL STATEMENTS
The following table illustrates the significant amounts reclassified out of each component of accumulated other comprehensive income, net of tax, during the year ended December 31, 2019:
| December 31, 2019 | ||||||
| Details about Accumulated Other Comprehensive Income Components |
Amount Reclassified from Accumulated Other Comprehensive Income |
Affected Line Item in the Statement | ||||
| (Dollars In Thousands) | ||||||
| Unrealized gains and losses on available-for-sale securities | $ | 2,016 | Gain/(loss) on sale of securities | |||
|
|
|
|||||
| 2,016 | Total before tax | |||||
| (459 | ) | Tax (expense) or benefit | ||||
|
|
|
|||||
| $ | 1,557 | Net of tax | ||||
|
|
|
|||||
| Unrealized gains and losses on cash flow hedges | $ | 2,698 | Interest income | |||
|
|
|
|||||
| 2,698 | Total before tax | |||||
| (758 | ) | Tax (expense) or benefit | ||||
|
|
|
|||||
| $ | 1,940 | Net of tax | ||||
|
|
|
|||||
| Amortization of defined benefit pension items | $ | 7,242 | Net periodic pension cost - see | |||
| Prior service cost | 44 | Employee Benefits footnote | ||||
|
|
|
|||||
| 7,286 | Total before tax | |||||
| (2,047 | ) | Tax expense or (benefit) | ||||
|
|
|
|||||
| $ | 5,239 | Net of tax | ||||
|
|
|
|||||
| Total reclassifications for the period | $ | (1,742 | ) | |||
|
|
|
|||||
| December 31, 2018 | ||||||
| Unrealized gains and losses on available-for-sale securities |
$ | 50 | Gain/(loss) on sale of securities | |||
|
|
|
|||||
| 50 | Total before tax | |||||
| (10 | ) | Tax (expense) or benefit | ||||
|
|
|
|||||
| $ | 40 | Net of tax | ||||
|
|
|
|||||
| Unrealized gains and losses on cash flow hedges |
$ | 1,198 | Interest income | |||
|
|
|
|||||
| 1,198 | Total before tax | |||||
| (337 | ) | Tax (expense) or benefit | ||||
|
|
|
|||||
| $ | 861 | Net of tax | ||||
|
|
|
|||||
| Amortization of defined benefit pension items |
$ | 7,621 | Net periodic pension cost - see | |||
| Prior service cost |
44 | Employee Benefits footnote | ||||
|
|
|
|||||
| 7,665 | Total before tax | |||||
| (2,154 | ) | Tax expense or (benefit) | ||||
|
|
|
|||||
| $ | 5,511 | Net of tax | ||||
|
|
|
|||||
| Total reclassifications for the period |
$ | (4,610 | ) | |||
|
|
|
|||||
19. Segment Reporting
The Company’s primary reportable segment is its banking business, which offers a range of commercial, retail, wealth management and banking services, and consists primarily of attracting deposits from the general public and investing those deposits, together with borrowings and funds generated from operations, to originate loans in a variety of sectors and to invest in securities. Revenue from the banking business consists primarily of interest earned on loans and investment securities. In addition to its banking business reportable segment, the Company has an insurance agency business reportable
F-81
Table of Contents
EASTERN BANK CORPORATION
NOTES TO CONSOLIDATED FINANCIAL STATEMENTS
segment, which consists of insurance-related activities, acting as an independent agent in offering commercial, personal and employee benefits insurance products to individual and commercial clients. Revenue from the insurance agency business consists primarily of commissions on sales of insurance products and services.
Results of operations and selected financial information by segment and reconciliation to the consolidated financial statements as of and for the three months ended March 31, 2020 and 2019 (unaudited) and as of and for the years ended December 31, 2019 and 2018 was as follows:
| As of and for the three months ended March 31, 2020 | ||||||||||||||||
| (Unaudited) | ||||||||||||||||
| Banking Business |
Insurance Agency Business |
Other/ Eliminations |
Total | |||||||||||||
| (Dollars In Thousands) | ||||||||||||||||
| Net interest income |
$ | 100,146 | $ | — | $ | — | $ | 100,146 | ||||||||
| Provision for loan losses |
28,600 | — | — | 28,600 | ||||||||||||
|
|
|
|
|
|
|
|
|
|||||||||
| Net interest income after provision for loan losses |
71,546 | — | — | 71,546 | ||||||||||||
| Noninterest income |
6,868 | 26,523 | (22 | ) | 33,369 | |||||||||||
| Noninterest expense |
78,465 | 17,642 | (935 | ) | 95,172 | |||||||||||
|
|
|
|
|
|
|
|
|
|||||||||
| Income before provision for income taxes |
(51 | ) | 8,881 | 913 | 9,743 | |||||||||||
| Income tax (benefit) provision |
(1,214 | ) | 2,512 | — | 1,298 | |||||||||||
|
|
|
|
|
|
|
|
|
|||||||||
| Net income |
$ | 1,163 | $ | 6,369 | $ | 913 | $ | 8,445 | ||||||||
|
|
|
|
|
|
|
|
|
|||||||||
| Total assets |
$ | 12,221,799 | $ | 182,564 | $ | (60,609 | ) | $ | 12,343,754 | |||||||
|
|
|
|
|
|
|
|
|
|||||||||
| Total liabilities |
$ | 10,696,509 | $ | 45,120 | $ | (60,609 | ) | $ | 10,681,020 | |||||||
|
|
|
|
|
|
|
|
|
|||||||||
| As of and for the three months ended March 31, 2019 | ||||||||||||||||
| (Unaudited) | ||||||||||||||||
| Banking Business |
Insurance Agency Business |
Other/ Eliminations |
Total | |||||||||||||
| (Dollars In Thousands) | ||||||||||||||||
| Net interest income |
$ | 102,672 | $ | — | $ | — | $ | 102,672 | ||||||||
| Provision for loan losses |
3,000 | — | — | 3,000 | ||||||||||||
|
|
|
|
|
|
|
|
|
|||||||||
| Net interest income after provision for loan losses |
99,672 | — | — | 99,672 | ||||||||||||
| Noninterest income |
22,262 | 25,559 | (21 | ) | 47,800 | |||||||||||
| Noninterest expense |
85,890 | 19,868 | (929 | ) | 104,829 | |||||||||||
|
|
|
|
|
|
|
|
|
|||||||||
| Income before provision for income taxes |
36,044 | 5,691 | 908 | 42,643 | ||||||||||||
| Income tax provision |
8,059 | 1,619 | — | 9,678 | ||||||||||||
|
|
|
|
|
|
|
|
|
|||||||||
| Net income |
$ | 27,985 | $ | 4,072 | $ | 908 | $ | 32,965 | ||||||||
|
|
|
|
|
|
|
|
|
|||||||||
| Total assets |
$ | 11,221,425 | $ | 154,448 | $ | (44,895 | ) | $ | 11,330,978 | |||||||
|
|
|
|
|
|
|
|
|
|||||||||
| Total liabilities |
$ | 9,851,901 | $ | 28,874 | $ | (44,895 | ) | $ | 9,835,880 | |||||||
|
|
|
|
|
|
|
|
|
|||||||||
F-82
Table of Contents
EASTERN BANK CORPORATION
NOTES TO CONSOLIDATED FINANCIAL STATEMENTS
| As of and for the year ended December 31, 2019 | ||||||||||||||||
| Banking Business |
Insurance Agency Business |
Other/ Eliminations |
Total | |||||||||||||
| (Dollars In Thousands) | ||||||||||||||||
| Net interest income |
$ | 411,264 | $ | — | $ | — | $ | 411,264 | ||||||||
| Provision for loan losses |
6,300 | — | — | 6,300 | ||||||||||||
|
|
|
|
|
|
|
|
|
|||||||||
| Net interest income after provision for loan losses |
404,964 | — | — | 404,964 | ||||||||||||
| Noninterest income |
89,840 | 92,705 | (246 | ) | 182,299 | |||||||||||
| Noninterest expense |
337,323 | 79,043 | (3,682 | ) | 412,684 | |||||||||||
|
|
|
|
|
|
|
|
|
|||||||||
| Income before provision for income taxes |
157,481 | 13,662 | 3,436 | 174,579 | ||||||||||||
| Income tax provision |
35,542 | 3,939 | — | 39,481 | ||||||||||||
|
|
|
|
|
|
|
|
|
|||||||||
| Net income |
$ | 121,939 | $ | 9,723 | $ | 3,436 | $ | 135,098 | ||||||||
|
|
|
|
|
|
|
|
|
|||||||||
| Total assets |
$ | 11,515,117 | $ | 165,965 | $ | (52,307 | ) | $ | 11,628,775 | |||||||
|
|
|
|
|
|
|
|
|
|||||||||
| Total liabilities |
$ | 10,046,189 | $ | 34,740 | $ | (52,307 | ) | $ | 10,028,622 | |||||||
|
|
|
|
|
|
|
|
|
|||||||||
| As of and for the year ended December 31, 2018 | ||||||||||||||||
| Banking Business |
Insurance Agency Business |
Other/ Eliminations |
Total | |||||||||||||
| (Dollars In Thousands) | ||||||||||||||||
| Net interest income |
$ | 390,044 | $ | — | $ | — | $ | 390,044 | ||||||||
| Provision for loan losses |
15,100 | — | — | 15,100 | ||||||||||||
|
|
|
|
|
|
|
|
|
|||||||||
| Net interest income after provision for loan losses |
374,944 | — | — | 374,944 | ||||||||||||
| Noninterest income |
86,596 | 94,233 | (234 | ) | 180,595 | |||||||||||
| Noninterest expense |
326,956 | 73,852 | (2,880 | ) | 397,928 | |||||||||||
|
|
|
|
|
|
|
|
|
|||||||||
| Income before provision for income taxes |
134,584 | 20,381 | 2,646 | 157,611 | ||||||||||||
| Income tax provision |
29,313 | 5,571 | — | 34,884 | ||||||||||||
|
|
|
|
|
|
|
|
|
|||||||||
| Net income |
$ | 105,271 | $ | 14,810 | $ | 2,646 | $ | 122,727 | ||||||||
|
|
|
|
|
|
|
|
|
|||||||||
| Total assets |
$ | 11,265,752 | $ | 152,832 | $ | (40,297) | $ | 11,378,287 | ||||||||
|
|
|
|
|
|
|
|
|
|||||||||
| Total liabilities |
$ | 9,954,112 | $ | 31,331 | $ | (40,297 | ) | $ | 9,945,146 | |||||||
|
|
|
|
|
|
|
|
|
|||||||||
20. Related Parties
The Company has, and expects to have in the future, related party transactions in the ordinary course of business. The transactions include, but are not limited to, lending activities and deposits services with directors and executive officers of the Company and their affiliates. Based on the Company’s assessment, such transactions are consistent with prudent banking practices and are within applicable banking regulations. Further details relating to certain party transactions are outlined below:
At March 31, 2020 (unaudited) and December 31, 2019 and 2018, the amount of deposits from related parties held by the Company totaled $14.0 million, $8.3 million and $7.0 million, respectively.
The amount of loans with related parties at March 31, 2020 (unaudited) and December 31, 2019 and 2018 were $21.0 million, $15.5 million and $7.4 million, respectively.
21. Leases (unaudited)
The Company leases certain office space and equipment under various noncancelable operating leases. These leases have original terms ranging from 1 year to 25 years. Operating lease liabilities and ROU assets are recognized at the lease
F-83
Table of Contents
EASTERN BANK CORPORATION
NOTES TO CONSOLIDATED FINANCIAL STATEMENTS
commencement date based on the present value of the future minimum lease payments over the lease term. Operating lease liabilities are recorded within other liabilities and ROU assets are recorded within other assets in the Company’s consolidated balance sheets.
As of March 31, 2020, the Company had the following related to operating leases:
| As of March 31, 2020 |
||||
| (unaudited) (in thousands) |
||||
| Right-of-use assets |
$ | 89,729 | ||
| Lease liabilities |
$ | 93,301 | ||
The following table is a summary of the Company’s components of net lease cost for the three months ended March 31, 2020:
| Three months ended March 31, 2020 |
||||
| (unaudited) (in thousands) |
||||
| Operating lease cost |
$ | 3,613 | ||
| Finance lease cost |
2 | |||
| Variable lease cost |
522 | |||
|
|
|
|||
| Total lease cost |
$ | 4,137 | ||
|
|
|
|||
The rent expense under real estate operating leases for the three months ended March 31, 2019 and the years ended December 31, 2019 and 2018, amounted to $3.6 million, $16.2 million and $14.3 million, respectively. The rent expense under equipment operating leases for the three months ended March 31, 2019 and the years ended December 31, 2019 and 2018, amounted to $0.2 million, $0.7 million and $0.7 million, respectively.
During the three months ended March 31, 2020 (unaudited) the Company made $3.5 million in cash payments for operating and finance lease payments.
Finance leases are not material and are included in other assets, net in the Company’s consolidated balance sheets.
Supplemental balance sheet information related to operating leases as of March 31, 2020 is as follows:
| As of March 31, 2020 |
||||
| (unaudited) | ||||
| Weighted-average remaining lease term (in years) |
9.04 | |||
| Weighted-average discount rate |
2.64 | % | ||
22. Subsequent Events
For its consolidated financial statements as of December 31, 2019 and for the year then ended, the Company evaluated subsequent events through May 4th, 2020, the date on which those financial statements were issued.
In March 2020, the World Health Organization categorized Coronavirus Disease 2019 (“Covid-19”) as a pandemic, and the President of the United States declared the Covid-19 outbreak a national emergency.
As of the date of this filing, the Company cannot reasonably estimate the length or severity of this pandemic, but currently anticipates a significant impact on the financial results during the year ending December 31, 2020 and beyond. Since March, the pandemic has already impacted both the banking and insurance agency segments, and such impact will likely be greater in the future if conditions persist.
The Company believes that the short and long term economic consequences of Covid-19 to our customers will be significant, and that the health care issues of the pandemic will significantly change the way we conduct our business and operate in the future.
F-84
Table of Contents
EASTERN BANK CORPORATION
NOTES TO CONSOLIDATED FINANCIAL STATEMENTS
Among other impacts, the Company expects the impact to its financial results during the year ending December 31, 2020 to include the following: (i) a significant increase in its loan loss provisions and, over time, significant increases in its loan charge-offs, (ii) a significant increase in loan modifications and deferrals that could decrease its cash flow and interest income, (iii) a significant reduction in its net interest income and net interest margin, due to the dramatic interest rate reductions enacted by the Federal Reserve in March 2020 in response to the Covid-19 pandemic and other economic conditions, (iv) reduced fees as it waives certain fees for its customers impacted by the Covid-19 pandemic and (v) higher operating costs related to its workforce transitioning to working remotely and an increase in its investments to loan workout and recovery activities. Further, the Covid-19 pandemic could result in impairments to the Company’s goodwill and other intangible assets.
23. Subsequent Events (unaudited)
For its consolidated financial statements as of March 31, 2020 and the three months then ended, the Company evaluated subsequent events through June 18, 2020, the date on which those financial statements were issued.
On March 27, 2020 the Coronavirus Aid, Relief, and Economic Security Act (the “CARES” Act”) was passed to address the economic effects of the Covid-19 pandemic. The CARES Act appropriated $349 billion for “paycheck protection loans” through the Payroll Protection Program (“PPP”). Subsequent to March 31, 2020 the Company participated in the government-sponsored PPP, helping to deploy stimulus funds to small businesses within the community. Through May 31, 2020, the Company has originated approximately 7,900 PPP loans for its customers and selected prospects, representing $1.1 billion of aggregate PPP loans. The SBA has communicated a fee structure for the banks originating these loans, although the Company is waiting for final instructions and the payment for these fees. Based on what the SBA has communicated as of the date the consolidated financial statements were issued, the Company estimates it will receive between approximately $30.0 million and $35.0 million in loan origination fees on these loans, which will be recognized as income over the life of the respective loan.
Additionally, the Company has been offering needs based payment relief options for commercial and small business loans, residential mortgages, and home equity loans and lines of credit and monitors loan modification requests daily. These modifications will require credit judgment to determine if the modifications were made directly in response to the Covid-19 pandemic and categorized as TDRs.
The Company continues to believe that the short and long term economic consequences of the Covid-19 pandemic to our customers will be significant, and that the health care issues of the pandemic will significantly change the way the Company conducts its business and operates in the future.
Plan of Reorganization
On June 12, 2020, the Board of Trustees of the Company adopted a Plan of Conversion (the “Plan”). Pursuant to the Plan, the Company proposes to reorganize from a mutual holding company into a publicly traded stock form of organization. In connection with the reorganization, the Company will transfer to Eastern Bankshares, Inc., a recently formed Massachusetts corporation, 100% of the Bank’s common stock, and immediately thereafter the Company will merge into Eastern Bankshares, Inc. Pursuant to the Plan, Eastern Bankshares, Inc. will issue shares of common stock in a public offering. Eastern Bankshares, Inc. will offer 100% of its outstanding common stock to the Company’s eligible depositors, the employee stock ownership plan (“ESOP”) and certain other persons. Eastern Bankshares, Inc. will determine the range of the offering value and the number of shares of common stock to be issued based upon an independent appraiser’s valuation. The stock will be priced at $10.00 per share. In addition, the Boards of Directors of Eastern Bankshares, Inc. and the Company have adopted an ESOP, which is permitted to subscribe for up to 8% of the common stock to be outstanding following the completion of the reorganization and the offering. The Plan provides for Eastern Bankshares, Inc. to donate to the Eastern Bank Charitable Foundation immediately after the offering a number of shares of authorized but previously unissued shares of Eastern Bankshares, Inc. common stock equal to 4% of the number of shares of common stock that will be issued and outstanding immediately after the offering (including the shares donated to the Foundation) (the “Stock Donation”). The Plan is subject to the approval of the Board of Governors of the Federal Reserve System and the Massachusetts Commissioner of Banks. The Company may not implement the Plan unless it receives the approval of both a majority of all of the Company’s corporators and a majority of the Company’s independent corporators (who must constitute not less than 60% of all corporators). The Stock Donation is subject to a separate corporator vote on the same terms.
F-85
Table of Contents
No person has been authorized to give any information or to make any representation other than as contained in this prospectus and, if given or made, such other information or representation must not be relied upon as having been authorized by Eastern Bankshares, Inc., Eastern Bank or Eastern Bank Corporation. This prospectus does not constitute an offer to sell or a solicitation of an offer to buy any of the securities offered hereby to any person in any jurisdiction in which such offer or solicitation is not authorized or in which the person making such offer or solicitation is not qualified to do so, or to any person to whom it is unlawful to make such offer or solicitation in such jurisdiction. Neither the delivery of this prospectus nor any sale hereunder shall under any circumstances create any implication that there has been no change in the affairs of Eastern Bankshares, Inc. or Eastern Bank since any of the dates as of which information is furnished herein or since the date hereof.
Up to 175,375,000 shares
(Subject to Increase to up to 201,681,250 shares)
(Proposed Holding Company for
Eastern Bank)
COMMON STOCK
par value $0.01 per share
PROSPECTUS
[DATE], 2020
These securities are not deposits or accounts and are not federally insured or guaranteed.
Until [DATE], 2020, all dealers that effect transactions in these securities, whether or not participating in this offering, may be required to deliver a prospectus. This is in addition to the obligation of dealers to deliver a prospectus when acting as underwriters and with respect to their unsold allotments or subscriptions.
Table of Contents
THE FOLLOWING PAGES CONSTITUTE THE 401(k) PROSPECTUS SUPPLEMENT
OF EASTERN BANKSHARES, INC. AND THE EASTERN BANK 401(k) PLAN.
SUCH PROSPECTUS SUPPLEMENT WILL ACCOMPANY
THE PROSPECTUS OF EASTERN BANKSHARES, INC.
PROVIDED TO ALL PARTICIPANTS IN THE EASTERN BANK 401(k) PLAN.
Table of Contents
Prospectus Supplement
EASTERN BANK 401(k) PLAN
Offering of Participation Interests in up to 11,141,591 Shares of

Common Stock
Eastern Bankshares, Inc., a Massachusetts corporation, is offering shares of its common stock for sale at $10.00 per share in connection with the conversion of Eastern Bank Corporation, a mutual holding company, from the mutual to stock form of organization. The shares will be offered to depositors of Eastern Bank, as well as to Eastern Bank’s tax-qualified plans and to its officers, employees, directors, trustees, corporators and members of its community. Eastern Bankshares, Inc. has never offered common stock for sale to the public, and consequently, this will be an initial stock offering (“offering”) of Eastern Bankshares, Inc.’s common stock. We expect the common stock will trade on the Nasdaq Global Select Market under the symbol “EBC.”
In connection with the offering, participants in the Eastern Bank 401(k) Plan (the “401(k) Plan”) will have the opportunity to invest a portion of their accounts in common stock in their 401(k) Plan accounts. Based upon the value of the 401(k) Plan assets at May 31, 2020, the trustee of the 401(k) Plan could purchase up to 11,141,591 shares of common stock, at the purchase price of $10.00 per share. This prospectus supplement relates to the election of 401(k) Plan participants to invest a portion of their 401(k) Plan accounts in “participation interests” in the 401(k) Plan representing an indirect ownership interest in common stock at the time of the offering.
Before you consider investing, you should read the prospectus of Eastern Bankshares, Inc. dated [DATE], 2020, which is provided with this prospectus supplement. It contains detailed information regarding the offering of Eastern Bankshares, Inc. and the financial condition, results of operations and business of Eastern Bankshares, Inc. and Eastern Bank. This prospectus supplement provides information regarding the 401(k) Plan. You should read this prospectus supplement together with the prospectus and keep both for future reference.
For a discussion of risks that you should consider, see “Risk Factors” in this prospectus supplement, “Risk Factors” beginning on page 19 of the accompanying prospectus and “Notice of Your Rights Concerning Employer Securities” in this prospectus supplement.
The interests in the 401(k) Plan and the offering of the shares of common stock have not been approved or disapproved by the Board of Governors of the Federal Reserve System, the Massachusetts Commissioner of Banks, the Federal Deposit Insurance Corporation, the Securities and Exchange Commission or any other federal or state agency. Any representation to the contrary is a criminal offense.
The securities offered by this prospectus supplement are not deposit or savings accounts and are not insured or guaranteed by the Federal Deposit Insurance Corporation or any other government agency or the Depositors Insurance Fund.
This prospectus supplement may be used only in connection with offers and sales by Eastern Bankshares, Inc. in the offering of common stock acquired by the 401(k) Plan. No one may use this prospectus supplement to reoffer or resell interests in shares of common stock acquired through the 401(k) Plan.
You should rely only on the information contained in this prospectus supplement and the prospectus. Eastern Bankshares, Inc., Eastern Bank and the 401(k) Plan have not authorized anyone to provide you with different information.
This prospectus supplement does not constitute an offer to sell or solicitation of an offer to buy any securities in any jurisdiction to any person to whom it is unlawful to make an offer or solicitation in that jurisdiction. Neither the delivery of this prospectus supplement and the accompanying prospectus nor any sale of common stock shall under any circumstances imply that there has been no change in the affairs of Eastern Bankshares, Inc., Eastern Bank, or the 401(k) Plan since the date of this prospectus supplement, or that the information contained in this prospectus supplement or incorporated by reference is correct as of any time after the date of this prospectus supplement.
The date of this prospectus supplement is [DATE], 2020.
Table of Contents
| 1 | ||||
| 1 | ||||
| 1 | ||||
| 2 | ||||
| 2 | ||||
| 3 | ||||
| 4 | ||||
| 4 | ||||
| 4 | ||||
| 4 | ||||
| 7 | ||||
| 7 | ||||
| 7 | ||||
| 7 | ||||
| 8 | ||||
| 8 | ||||
| 8 | ||||
| 8 | ||||
| 9 | ||||
| 9 | ||||
| 9 | ||||
| 10 | ||||
| 11 | ||||
| 15 | ||||
| 15 | ||||
| 15 | ||||
| 16 | ||||
| 16 | ||||
| 17 | ||||
| 17 | ||||
| Securities and Exchange Commission Reporting and Short-Swing Profit Liability |
17 | |||
| 18 | ||||
| 18 | ||||
Table of Contents
In addition to considering the material risks disclosed under “Risk Factors” beginning on page 19 of the accompanying prospectus, you should also consider the following:
If you elect to purchase common stock using your 401(k) Plan account balance and the offering is oversubscribed, you will bear the risk of price changes in the investment funds of the 401(k) Plan.
If you elect to subscribe for common stock using your 401(k) Plan account balance, you will be required to make such transfers either (i) on the website of the 401(k) Plan third party administrator, Empower Retirement, or (ii) by calling the Empower Customer Service Center at (888) 826-4015 and speaking to a customer service representative who will assist you in making your election to sell a percentage of each of your designated investment funds within your 401(k) Plan account. Once you complete this election, the amount(s) you elect to transfer to purchase shares in the offering will be held in the “Eastern Bankshares IPO Election” account until the conclusion of the offering and purchase of the shares by the 401(k) Plan. If the offering is oversubscribed (i.e., there are more orders for common stock than shares available for sale in the offering) and the 401(k) Plan trustee cannot use any or all of the funds you allocate to the Eastern Bankshares IPO Election account to subscribe for common stock, the funds that cannot be invested in common stock, and any interest earned on such funds, will be transferred to the qualified default investment alternative in the 401(k) Plan for your expected retirement date (your “QDIA fund”). You will then be entitled to either leave the transferred amount in your QDIA fund or transfer it into other funds in the 401(k) Plan. During the period from the date you make your election to purchase common stock through the date that the offering closes and the stock is acquired by the 401(k) Plan, you will bear the risk of price changes in the other investment funds in the 401(k) Plan with respect to amounts that cannot be used to purchase common stock due to the oversubscription. It is possible that while your funds are being held in the Eastern Bankshares IPO Election account pending the close of the offering, the other investment funds in your account may have increased in value more than the amount of any interest you may have earned on the funds in the Eastern Bankshares IPO Election account. See “The Offering—Purchases in the Offering and Oversubscriptions” in this prospectus supplement.
| Eastern Bank is offering participants of the 401(k) Plan an opportunity to purchase common stock of Eastern Bankshares, Inc. in a subscription and community offering. A “participation interest” represents your indirect ownership of shares of common stock that is acquired by the 401(k) Plan pursuant to your election, and is equal to one share of common stock. In this prospectus supplement, “participation interests” are referred to as shares of Eastern Bankshares, Inc. common stock. At the purchase price of $10.00 per share, the 401(k) Plan may acquire up to 11,141,591 shares of common stock in the offering, based on the fair market value of the 401(k) Plan’s assets as of May 31, 2020. Participants will have the opportunity to make a “one-time election” to purchase shares in the offering.
Only employees of Eastern Bank and its wholly-owned subsidiary, Eastern Insurance Group LLC, may become participants in the 401(k) Plan and only participants, including former employees of Eastern Bank and Eastern Insurance Group LLC, who are still participants in the 401(k) Plan, may purchase participation interests in shares of common stock through the 401(k) Plan.
Your investment in shares of common stock in connection with the offering is subject to the purchase priorities listed below.
Information regarding the 401(k) Plan is contained in this prospectus supplement and information with respect to the financial condition, results of operations and business of Eastern Bankshares, Inc. and Eastern Bank is contained in the accompanying prospectus. The address of the principal executive office of Eastern Bankshares, Inc. and Eastern Bank is 265 Franklin Street, Boston, Massachusetts 02110. Eastern Bank’s telephone number at this address is 1 (800)-EASTERN (327-8376). |
Table of Contents
2
Table of Contents
3
Table of Contents
4
Table of Contents
| inadvertently log out before completing all of the transfers that you wish to make from your existing investments into the Eastern Bankshares IPO Election account. Please note, however, that each election you make to transfer from one of your existing investment accounts into the Eastern Bankshares IPO Election account will be irrevocable and cannot be changed until the offering has concluded. | ||
|
• Your election is subject to a minimum purchase of 25 shares, which equals $250.
• Your election, plus any order you placed outside the 401(k) Plan, are together subject to a maximum purchase of 200,000 shares, which equals $2,000,000. Please see the accompanying prospectus for additional purchase limitations.
• The election period for the 401(k) Plan opens [401K OPEN DATE] and closes at 4:00 p.m., Eastern Time, on [401K CLOSE DATE] (the “401(k) Plan Offering Period”).
• Your election to purchase common stock in the offering through the 401(k) Plan can be made on-line by logging in to your account on the Empower Retirement web-site or by calling Empower Retirement’s Customer Service Center. After your election is made and that portion that you elected to be transferred to the Eastern Bankshares IPO Election account is transferred, it will be rounded down to the closest dollar amount divisible by $10.00, and will be used by the trustee to subscribe for shares of common stock sold in the offering. This difference will remain in the Eastern Bankshares IPO Election account until the formal closing of the offering has been completed, several weeks after the election period ends. At that time, the common stock purchased based on your election will be transferred to the Eastern Bankshares Stock Account and any remaining funds will be transferred out of the Eastern Bankshares IPO Election account to the applicable QDIA fund, based on your expected retirement date. You will then have the opportunity to transfer the amount to any other funds you select.
• The amount you elect to transfer to the Eastern Bankshares IPO Election account will be held separately until the offering closes. Therefore, this money is not available for distributions, loans or withdrawals until the offering is completed, which is expected to be several weeks after the closing of the subscription offering period.
• During the offering period, you will continue to have the ability to transfer amounts that are not directed to purchase common stock among all the other investment funds in the 401(k) Plan. However, you will not be permitted to change the investment amounts that you designated to be used to purchase common stock. This election is irrevocable until the close of the offering.
• Following the formal closing of the offering, your purchased shares of common stock will be transferred to the Eastern Bankshares Stock Account and will be allocated to your account.
Follow these steps to make your election to use all or part of your account balance in the 401(k) Plan to purchase shares of common stock in the offering.
• Go to www.empowermyretirement.com and log into your 401(k) Plan account. In the log-in box, enter your Username and Password to sign onto your account. Once you have entered your Username and Password, click the Sign In box. If you haven’t logged on to the website before, follow these steps first:
• Log on to www.empowermyretirement.com and select Register.
• Choose the I do not have a PIN tab.
• Follow the prompts to create your username and password. |
5
Table of Contents
|
• If Empower does not have your e-mail or phone number on file from Eastern Bank, or if you have another account with Empower Retirement (with a former employer, for example), you will need to call the Empower Customer Service Center at (888) 826-4015 to access your new plan account.
• Once you have created your plan account you may sign into your account and make your purchase election. | ||
|
• Once you have signed in, you will be directed to the Account Overview page. On the Account Overview page, go to the left-hand navigator bar, under the INVESTMENTS menu and click on “View/Manage My Investments”
• You will be directed to the “My Investments” page. Go the bottom right corner of your “My Investments” page and click on “Change My Investments.”
• You will be directed to the page “How would you like to change your investments?” On this page, select “Change how my current balance is invested” and click “Continue.”
• In the “Transfer From” section, select a fund you wish to move funds from to the Eastern Bankshares IPO Election account. You may indicate a specified dollar amount or percentage. If you want to transfer a percentage of the amount in that fund/investment, enter the percentage you would like to transfer “From” the fund/investment. If you would like to transfer a dollar amount, click on “Advanced Transfer Features” and choose “dollars,” then enter the amount you would like to transfer “From” the fund/investment. When you have completed transferring “From” the investment, choose “Continue.”
• All of the funds that you transferred “From” other investments must be transferred “To” the Eastern Bankshares IPO Election account. The total percentage must be 100% or, if transferring dollars, all of the dollars must be transferred “To” the Eastern Bankshares IPO Election account. The Eastern Bankshares IPO Election account is invested in a money market investment that will hold the funds until the offering is concluded.
• When you have completed making the transfer from your existing fund to the Eastern Bankshares IPO Election account, click “Review Transfer(s)” then review your transfer elections. If you are satisfied with your election, click “Submit.” If you are not satisfied, you can click “Start Over” to modify your election. You will be taken to a confirmation page. Please review your transaction for accuracy, if you need to make changes, click on “Cancel” or “Start Over” or “Previous” to make changes. If the information is correct, click on the box, “I confirm the information above and authorize Empower Retirement to process this request.” You will receive a communication in your Message Center confirming your transaction.
• If you wish to transfer amounts from more than one fund/investment to the Eastern Bankshares IPO Election account, you will have to repeat the steps above until you have transferred the total percentage or dollars that you wish to invest in the Eastern Bankshares IPO Election account.
• Alternatively, if you wish, you may call the Empower Retirement Customer Service Center at (888) 826-4015 and they can execute your transfer elections for you.
• You must also complete the 401(k) Plan Stock Information Form in one of two ways:
• If you are a current employee, complete the electronic form by going online through the Eastern Bank intranet to 401kstockinformationform.easternbank.com and follow the prompts.
• If you are not an employee or otherwise not able to complete the electronic form, complete the paper form that you received with this prospectus supplement and return a copy to Jennifer Porter by hand delivery, regular mail, by fax to (781) 477-1382 or by scanning and e-mailing it to 401kstockinformation_DL@easternbank.com no later than XX:00 p.m., Eastern Time, on [DATE], 2020. |
6
Table of Contents
7
Table of Contents
DESCRIPTION OF THE 401(k) PLAN
Eastern Bank originally adopted the 401(k) Plan effective as of January 1, 1992, and has periodically amended and restated the 401(k) Plan, with the most recent amendment and restatement effective as of April 1, 2019. Eastern Insurance Group LLC, commenced participation in the 401(k) Plan in 2019. The 401(k) Plan is a tax-qualified plan established in accordance with the requirements under Section 401(a) and Section 401(k) of the Internal Revenue Code of 1986, as amended (the “Code”).
Eastern Bank intends that the 401(k) Plan, in form and operation, will comply with the requirements under Section 401(a) and Section 401(k) of the Code. Eastern Bank will adopt any amendments to the 401(k) Plan that may be necessary to ensure the continuing qualified status of the 401(k) Plan under the Code and applicable Treasury Regulations.
Employee Retirement Income Security Act. The 401(k) Plan is an “individual account plan” other than a “money purchase pension plan” within the meaning of ERISA. As such, the 401(k) Plan is subject to all of the provisions of Title I (Protection of Employee Benefit Rights) and Title II (Amendments to the Code Relating to Retirement Plans) of ERISA, except for the funding requirements contained in Part 3 of Title I of ERISA which by their terms do not apply to an individual account plan (other than a money purchase plan). The 401(k) Plan is not subject to Title IV (Plan Termination Insurance) of ERISA. The funding requirements contained in Title IV of ERISA are not applicable to participants or beneficiaries under the 401(k) Plan.
Reference to Full Text of 401(k) Plan. The following portions of this prospectus supplement summarize certain provisions of the 401(k) Plan. They are not complete and are qualified in their entirety by the full text of the 401(k) Plan. Copies of the 401(k) Plan and/or the Summary Plan Description to the 401(k) Plan are available to all employees by filing a request with the 401(k) Plan administrator (the “Plan Administrator”) at 195 Market Street, Lynn, Massachusetts 01901. You are urged to read carefully the full text of the 401(k) Plan.
Employees of Eastern Bank and Eastern Insurance Group LLC, other than excluded employees (please refer to the 401(k) Plan Summary Plan Description for those categories of employees who are excluded), are eligible to participate by making elective deferrals in the 401(k) Plan upon attainment of age 21 and the completion of 90 days of service. An eligible employee who satisfies these requirements will be entitled to participate commencing in the next payroll period. Part time, temporary or seasonal employees scheduled to work less than 1,000 hours per year will also be eligible, but only if they complete a year of “eligibility service”, which is a full 12-month period following an employment date (or an anniversary of that date) in which 1,000 paid hours is credited.
In addition, and regardless of work schedule or whether they are deferring, employees who are both age 21 and have one year of eligibility service (as defined above), will be entitled to share in a “safe harbor non-elective contribution” commencing on the first payroll period after satisfying these eligibility requirements. The plan year (“Plan Year”) is January 1 to December 31.
As of May 31, 2020, there were approximately 2,250 employees and former employees of Eastern Bank and Eastern Insurance Group LLC, eligible to participate in the 401(k) Plan.
Contributions Under the 401(k) Plan
Elective Deferrals. You are permitted to defer from 1% to 75% of your eligible compensation, subject to certain restrictions imposed by the Code, and to have that amount contributed to the 401(k) Plan on your behalf. You may make elective deferrals on a pre-tax basis or on an after-tax basis. After-tax deferrals are referred to as “Roth deferrals.”
| • | Pre-Tax Deferrals. If you elect to make pre-tax deferrals, then your taxable income is reduced by the deferral contributions so you pay less federal income tax. However, when you receive your distributions from the 401(k) Plan, those distributions (including both the original deferrals, plus earnings on the deferrals) will be subject to federal income tax. |
| • | Roth Deferrals. If you elect to make Roth deferrals, the deferrals are subject to federal income taxes in the year of the deferral. However, the deferrals, and in certain cases, the earnings on the Roth deferrals are not subject to federal income tax when distributed to you. |
For purposes of elective deferrals, your eligible “plan compensation” is based on your taxable base salary, overtime and commissions, while a participant in the 401(k) Plan. In accordance with Internal Revenue Service (“IRS”) limitations, the
8
Table of Contents
annual compensation of each participant taken into account under the 401(k) Plan, for 2020, is limited to $285,000 (as may be increased annually by the IRS). You may elect to modify the amount contributed to the 401(k) Plan by making a new elective deferral election in accordance with the 401(k) Plan’s procedures, as of the beginning of each payroll period.
Catch-Up Deferrals. In addition to Elective Deferrals, participants who will be age 50 or older during the Plan Year, may also make so-called “catch-up deferrals.” For the 2020 Plan Year, catch-up deferrals are limited to $6,500. The catch-up deferral limit may change from year to year.
Safe Harbor Non-Elective Contributions. Eastern Bank will make a safe harbor non-elective contribution to employees who satisfy the eligibility requirements for the safe harbor non-elective contribution (i.e., who have attained age 21 and have 1,000 of service in an eligibility year). The safe harbor non-elective contribution is equal to 3% of plan compensation, provided that for purposes of the safe harbor non-elective contribution, plan compensation in excess of $185,000 (as indexed) payable to the Eastern Insurance Group LLC insurance sales force is not included. You do not have to be employed on the last day of the plan year or have a minimum number of hours of service in order to share in the safe harbor non-elective contribution. Each year, Eastern Bank reserves the right not to make a safe harbor contribution.
Rollover Contributions. You are permitted to make rollover contributions to the 401(k) Plan.
Limitations on Employee Elective Deferrals. For the 401(k) Plan Year beginning January 1, 2020, the amount of your elective deferral before-tax contributions may not exceed $19,500 per calendar year. In addition, if you will be at least 50 years old in 2020, you will be able to make a “catch-up” deferral of up to $6,500 in addition to the $19,500 limit. The elective deferral and “catch-up” deferral limit may be adjusted periodically by law, based on changes in the cost of living. Contributions in excess of these limits, including your deferrals to other tax-qualified plans, are known as excess deferrals. If you defer amounts in excess of these limitations, as applicable to you, your gross income for federal income tax purposes will include the excess in the year of the deferral. In addition, unless the excess deferral is distributed before April 15 of the following year, it will be taxed again in the year distributed.
Contribution Limit. Generally, the law imposes a maximum limit on the amount of contributions you may receive under the 401(k) Plan and any other defined contribution plan maintained by your employer. This limit applies to all contributions to the 401(k) Plan and to any other defined contribution plan maintained by your employer (subject to certain special rules for contributions to leveraged employee stock ownership plans), including your elective deferrals and all other employer contributions made on your behalf during the year, excluding earnings and any transfers/rollovers. For the 401(k) Plan Year beginning January 1, 2020, this total cannot exceed the lesser of $57,000 or 100% of your annual compensation. Catch-up deferrals are not counted for this purpose.
Benefits Under the 401(k) Plan
Vesting. At all times, you have a fully vested, non-forfeitable interest in the elective deferral contributions you have made to the 401(k) Plan. Employer safe harbor non-elective contributions, if made, are also 100% vested.
Withdrawals and Distributions from the 401(k) Plan
Applicable federal law requires the 401(k) Plan to impose substantial restrictions on the right of a 401(k) Plan participant to withdraw amounts held for his or her benefit under the 401(k) Plan prior to the participant’s termination of employment with the employer.
Withdrawals upon Termination. You may request a distribution from your account following your termination of employment. Following your termination, you may elect to leave your account balance in the 401(k) Plan and defer commencement of receipt of your vested balance until no later than April 1 of the calendar year following the calendar year in which you attain age 72 (for persons who attained age 701⁄2 prior to January 1, 2020, the age limit is 701⁄2). As a result of the recently passed Coronavirus Aid, Relief and Economic Securities (“CARES”) Act, no distribution (i.e., referred to as the “required minimum distribution”) is required to be distributed for the 2020 calendar year.
Withdrawal upon Disability. If you are disabled in accordance with the definition of disability under the 401(k) Plan, you will be entitled to the same withdrawal rights as if you had terminated your employment.
Withdrawal upon Death. If you die while you are a participant in the 401(k) Plan, the value of your entire account will be payable to your beneficiary in accordance with the terms of 401(k) Plan.
9
Table of Contents
In-Service Distribution. While employed, you are eligible to receive an in-service distribution of your elective deferrals from your account after your attainment of age 591⁄2. You may receive an in-service withdrawal of your rollover contributions, if any, at any time.
Hardship. In the event you incur a financial hardship, you may request an in-service withdrawal of a portion of your 401(k) Plan account, in accordance with the procedures set forth in the 401(k) Plan. For further information on distributions due to financial hardship, please contact the Empower Retirement Customer Service Center at (888) 826-4015.
Loans. You are eligible to obtain a loan from the 401(k) Plan, in accordance with Eastern Bank’s established loan procedures. For further information on the loan process and procedures, please request a copy of the Loan Policy from the Plan Administrator.
Form of Distribution. The normal form of benefit under the 401(k) Plan is a lump-sum distribution. Alternatively, when you are eligible for a distribution, you can request distributions in installment payments (not to exceed the life expectancy of you and your designated beneficiary). After your separation from service, you can also request an “ad-hoc” distribution of all or any part of your account or of specified accounts under the 401(k) Plan, subject to any reasonable limits regarding timing and amounts as the Plan Administrator may impose.
Investment of Contributions and Account Balances
All amounts credited to your accounts under the 401(k) Plan are held in the 401(k) Plan trust (the “Trust”) which is administered by Great-West Trust Company, LLC. However, in connection with the offering, a sub-trust will be initially established to hold the common stock in the Eastern Bankshares Stock Account. Great-West Trust Company, LLC will be the custodian of the Trust and certain senior executives of Eastern Bank, including the following persons: Robert F. Rivers, Quincy Miller, James B. Fitzgerald, Kathleen C. Henry and Nancy Huntington Stager will be the trustees of the sub-trust.
You are currently provided the opportunity to direct the investment of your account into one of the following investment options:
Vanguard Target Retirement Income Inv
Vanguard Target Retirement 2015 Inv
Vanguard Target Retirement 2020 Inv
Vanguard Target Retirement 2025 Inv
Vanguard Target Retirement 2030 Inv
Vanguard Target Retirement 2035 Inv
Vanguard Target Retirement 2040 Inv
Vanguard Target Retirement 2045 Inv
Vanguard Target Retirement 2050 Inv
Vanguard Target Retirement 2055 Inv
Vanguard Target Retirement 2060 Inv
Vanguard Target Retirement 2065 Inv
American Funds EuroPacific Growth R6
JPMorgan Emerging Markets Equity R6
Vanguard Developed Markets Index Admiral
DFA Intl Sustainability Core 1
Conestoga Small Cap Institutional
DFA US SmallCap Value Fund
Vanguard Small Cap Idex Adm
Hartford MidCap R6
Dodge & Cox Stock Fund
T Rowe Price Blue Chip Growth I
Vanguard 500 Index Admiral
DFA US Sustainability Core 1
Artisan High Income Instl
Dodge & Cox Income Fund
Vanguard Short-Term Corporate Bd Idx. Adm
Vanguard Short-Term Treasury Idx Admiral
Vanguard Total Bond Market Index Inst.
Vanguard Treasury Money Mrkt Inv.
10
Table of Contents
Performance History and Description of Funds
The following provides performance data with respect to the investment options available under the 401(k) Plan as of June 30, 2020, based on year-to-date, one year, three year, five year and ten year total returns (i.e., income plus appreciation):
| YTD Returns as of June 30, 2020 % |
Total Returns as of June 30, 2020 | |||||||||||||||||||
| Fund Name |
1 Year % |
3 Years % |
5 Years % |
10 Years* % |
||||||||||||||||
| Vanguard Target Retirement Income Inv |
1.46 | 5.69 | 5.39 | 4.93 | 5.84 | |||||||||||||||
| Vanguard Target Retirement 2015 Inv |
0.79 | 5.45 | 5.78 | 5.47 | 7.55 | |||||||||||||||
| Vanguard Target Retirement 2020 Inv |
(0.58 | ) | 5.09 | 6.09 | 5.96 | 8.31 | ||||||||||||||
| Vanguard Target Retirement 2025 Inv |
(1.46 | ) | 4.82 | 6.33 | 6.29 | 8.88 | ||||||||||||||
| Vanguard Target Retirement 2030 Inv |
(2.33 | ) | 4.40 | 6.42 | 6.47 | 9.37 | ||||||||||||||
| Vanguard Target Retirement 2035 Inv |
(3.24 | ) | 3.94 | 6.45 | 6.62 | 9.84 | ||||||||||||||
| Vanguard Target Retirement 2040 Inv |
(4.11 | ) | 3.46 | 6.50 | 6.76 | 10.08 | ||||||||||||||
| Vanguard Target Retirement 2045 Inv |
(4.90 | ) | 2.97 | 6.41 | 6.79 | 10.10 | ||||||||||||||
| Vanguard Target Retirement 2050 Inv |
(4.90 | ) | 3.02 | 6.42 | 6.79 | 10.10 | ||||||||||||||
| Vanguard Target Retirement 2055 Inv |
(4.95 | ) | 2.95 | 6.40 | 6.77 | 9.55 | ||||||||||||||
| Vanguard Target Retirement 2060 Inv |
(4.95 | ) | 2.95 | 6.39 | 6.76 | 9.16 | ||||||||||||||
| Vanguard Target Retirement 2065 Inv |
(5.03 | ) | 2.84 | N/A | N/A | 6.17 | ||||||||||||||
| American Funds EuroPacific Gr R6 |
(4.77 | ) | 3.17 | 4.76 | 4.90 | 7.48 | ||||||||||||||
| JPMorgan Emerging Markets Equity R6 |
(2.91 | ) | 5.72 | 8.05 | 8.28 | 5.72 | ||||||||||||||
| Vanguard Developed Markets Index Admiral |
(10.76 | ) | 4.26 | 0.88 | 2.46 | 6.09 | ||||||||||||||
| DFA Intl Sustainability Core 1 |
(10.74 | ) | (3.19 | ) | 0.97 | 2.78 | 6.08 | |||||||||||||
| Conestoga Small Cap Institutional |
2.09 | 3.68 | 13.69 | 13.61 | 15.39 | |||||||||||||||
| DFA US SmallCap Value Fund |
(25.45 | ) | (20.34 | ) | (6.52 | ) | (1.56 | ) | 7.70 | |||||||||||
| Vanguard Small Cap Index Adm |
(11.42 | ) | (5.60 | ) | 3.99 | 5.40 | 11.59 | |||||||||||||
| Hartford MidCap R6 |
(5.17 | ) | (0.01 | ) | 9.04 | 9.39 | 13.40 | |||||||||||||
| Dodge & Cox Stock Fund |
(14.98 | ) | (6.21 | ) | 2.99 | 5.93 | 11.71 | |||||||||||||
| T. Rowe Price Blue Chip Growth I |
11.07 | 19.52 | 19.12 | 16.33 | 18.30 | |||||||||||||||
| Vanguard 500 Index Admiral |
(3.10 | ) | 7.47 | 10.69 | 10.69 | 13.95 | ||||||||||||||
| DFA US Sustainability Core 1 |
(4.54 | ) | 5.80 | 9.72 | 9.50 | 13.43 | ||||||||||||||
| Artisan High Income Instl |
(3.23 | ) | 1.40 | 4.05 | 5.69 | 5.21 | ||||||||||||||
| Dodge & Cox Income Fund |
5.28 | 8.38 | 5.38 | 4.74 | 4.53 | |||||||||||||||
| Vanguard Short-Term Corporate Bd Idx Adm |
3.03 | 5.15 | 3.77 | 3.20 | 3.12 | |||||||||||||||
| Vanguard Short-Term Treasury Idx Admiral |
2.98 | 4.10 | 2.64 | 1.79 | 1.26 | |||||||||||||||
| Vanguard Total Bond Market Index Inst |
6.36 | 8.98 | 5.36 | 4.32 | 3.79 | |||||||||||||||
| Vanguard Treasury Money Mrkt Inv |
0.44 | 1.40 | 1.62 | 1.08 | 0.55 | |||||||||||||||
| * | Or since inception, if less than 10 years. |
The following is a description of each of the 401(k) Plan’s investment funds and other investments:
Vanguard Target Retirement Income. The investment seeks to provide current income and some capital appreciation. The fund invests in other Vanguard mutual funds according to an asset allocation strategy designed for investors currently in retirement. Its indirect bond holdings are a diversified mix of short-, intermediate-, and long-term U.S. government, U.S. agency, and investment-grade U.S. corporate bonds; inflation-protected public obligations issued by the U.S. Treasury; mortgage-backed and asset-backed securities; and government, agency, corporate, and securitized investment-grade foreign bonds issued in currencies other than the U.S. dollar.
Vanguard Target Retirement 2015. The investment seeks to provide capital appreciation and current income consistent with its current asset allocation. The fund invests in other Vanguard mutual funds according to an asset allocation strategy designed for investors planning to retire and leave the workforce in or within a few years of 2015 (the target year). The fund’s asset allocation will become more conservative over time, meaning that the percentage of assets allocated to stocks will decrease while the percentage of assets allocated to bonds and other fixed income investments will increase.
11
Table of Contents
Vanguard Target Retirement 2020. The investment seeks to provide capital appreciation and current income consistent with its current asset allocation. The fund invests in other Vanguard mutual funds according to an asset allocation strategy designed for investors planning to retire and leave the workforce in or within a few years of 2020 (the target year). The fund’s asset allocation will become more conservative over time, meaning that the percentage of assets allocated to stocks will decrease while the percentage of assets allocated to bonds and other fixed income investments will increase.
Vanguard Target Retirement 2025. The investment seeks to provide capital appreciation and current income consistent with its current asset allocation. The fund invests in other Vanguard mutual funds according to an asset allocation strategy designed for investors planning to retire and leave the workforce in or within a few years of 2025 (the target year). The fund’s asset allocation will become more conservative over time, meaning that the percentage of assets allocated to stocks will decrease while the percentage of assets allocated to bonds and other fixed income investments will increase.
Vanguard Target Retirement 2030. The investment seeks to provide capital appreciation and current income consistent with its current asset allocation. The fund invests in other Vanguard mutual funds according to an asset allocation strategy designed for investors planning to retire and leave the workforce in or within a few years of 2030 (the target year). The fund’s asset allocation will become more conservative over time, meaning that the percentage of assets allocated to stocks will decrease while the percentage of assets allocated to bonds and other fixed income investments will increase.
Vanguard Target Retirement 2035. The investment seeks to provide capital appreciation and current income consistent with its current asset allocation. The fund invests in other Vanguard mutual funds according to an asset allocation strategy designed for investors planning to retire and leave the workforce in or within a few years of 2035 (the target year). The fund’s asset allocation will become more conservative over time, meaning that the percentage of assets allocated to stocks will decrease while the percentage of assets allocated to bonds and other fixed income investments will increase.
Vanguard Target Retirement 2040. The investment seeks to provide capital appreciation and current income consistent with its current asset allocation. The fund invests in other Vanguard mutual funds according to an asset allocation strategy designed for investors planning to retire and leave the workforce in or within a few years of 2040 (the target year). The fund’s asset allocation will become more conservative over time, meaning that the percentage of assets allocated to stocks will decrease while the percentage of assets allocated to bonds and other fixed income investments will increase.
Vanguard Target Retirement 2045. The investment seeks to provide capital appreciation and current income consistent with its current asset allocation. The fund invests in other Vanguard mutual funds according to an asset allocation strategy designed for investors planning to retire and leave the workforce in or within a few years of 2045 (the target year). The fund’s asset allocation will become more conservative over time, meaning that the percentage of assets allocated to stocks will decrease while the percentage of assets allocated to bonds and other fixed income investments will increase.
Vanguard Target Retirement 2050. The investment seeks to provide capital appreciation and current income consistent with its current asset allocation. The fund invests in other Vanguard mutual funds according to an asset allocation strategy designed for investors planning to retire and leave the workforce in or within a few years of 2050 (the target year). The fund’s asset allocation will become more conservative over time, meaning that the percentage of assets allocated to stocks will decrease while the percentage of assets allocated to bonds and other fixed income investments will increase.
Vanguard Target Retirement 2055. The investment seeks to provide capital appreciation and current income consistent with its current asset allocation. The fund invests in other Vanguard mutual funds according to an asset allocation strategy designed for investors planning to retire and leave the workforce in or within a few years of 2055 (the target year). The fund’s asset allocation will become more conservative over time, meaning that the percentage of assets allocated to stocks will decrease while the percentage of assets allocated to bonds and other fixed income investments will increase.
Vanguard Target Retirement 2060. The investment seeks to provide capital appreciation and current income consistent with its current asset allocation. The fund invests in other Vanguard mutual funds according to an asset allocation strategy designed for investors planning to retire and leave the workforce in or within a few years of 2060 (the target year). The fund’s asset allocation will become more conservative over time, meaning that the percentage of assets allocated to stocks will decrease while the percentage of assets allocated to bonds and other fixed income investments will increase.
Vanguard Target Retirement 2065. The investment seeks to provide capital appreciation and current income consistent with its current asset allocation. The fund invests in other Vanguard mutual funds according to an asset allocation
12
Table of Contents
strategy designed for investors planning to retire and leave the workforce in or within a few years of 2065 (the target year). The fund’s asset allocation will become more conservative over time, meaning that the percentage of assets allocated to stocks will decrease while the percentage of assets allocated to bonds and other fixed income investments will increase.
American Funds EuroPacific GR R6. The investment seeks long-term growth of capital. The fund invests primarily in common stocks of issuers in Europe and the Pacific Basin that the investment adviser believes have the potential for growth. Growth stocks are stocks that the investment adviser believes have the potential for above-average capital appreciation. It normally will invest at least 80% of its net assets in securities of issuers in Europe and the Pacific Basin. The fund may invest a portion of its assets in common stocks and other securities of companies in emerging markets.
JPMorgan Emerging Markets Equity R6. The investment seeks to provide high total return. The fund invests at least 80% of the value of its assets in equity securities and equity-related instruments that are tied economically to emerging markets. “Assets” means net assets, plus the amount of borrowings for investment purposes. It may invest in securities denominated in U.S. dollars, other major reserve currencies, such as the euro, yen and pound sterling, and currencies of other countries in which it can invest.
Vanguard Developed Markets Index Admiral. The investment seeks to track the performance of the FTSE Developed All Cap ex US Index. The fund employs an indexing investment approach designed to track the performance of the FTSE Developed All Cap ex US Index, a market-capitalization-weighted index that is made up of approximately 3,885 common stocks of large-, mid-, and small-cap companies located in Canada and the major markets of Europe and the Pacific region. The adviser attempts to replicate the target index by investing all, or substantially all, of its assets in the stocks that make up the index, holding each stock in approximately the same proportion as its weighting in the index.
DFA Intl Sustainability Core 1. The investment seeks long-term capital appreciation. The Advisor intends to purchase securities of companies associated with developed market countries that the Advisor has designated as approved markets. As a non-fundamental policy, under normal circumstances, the fund will invest at least 80% of its net assets in equity securities. It may gain exposure to companies associated with approved markets by purchasing equity securities in the form of depositary receipts, which may be listed or traded outside the issuer’s domicile country.
Conestoga Small Cap Institutional. The investment seeks long-term growth of capital. Under normal market circumstances, the fund invests at least 80% of its net assets in equity securities of small-cap companies. Equity securities include American depositary receipts (“ADRs”), convertible securities, foreign and domestic common and preferred stocks, rights and warrants.
DFA US Small Cap Value Fund. The investment seeks to achieve long-term capital appreciation. The fund normally will invest at least 80% of its net assets in securities of small cap U.S. companies. It may purchase or sell futures contracts and options on futures contracts for U.S. equity securities and indices, to adjust market exposure based on actual or expected cash inflows to or outflows from the Portfolio.
Vanguard Small Cap Index Adm. The investment seeks to track the performance of a benchmark index that measures the investment return of small-capitalization stocks. The fund employs an indexing investment approach designed to track the performance of the CRSP US Small Cap Index, a broadly diversified index of stocks of small U.S. companies. The advisor attempts to replicate the target index by investing all, or substantially all, of its assets in the stocks that make up the index, holding each stock in approximately the same proportion as its weighting in the index.
Hartford Midcap R6. The investment seeks long-term growth of capital. The fund invests at least 80% of its assets in common stocks of mid-capitalization companies. The sub-adviser defines mid-capitalization companies as companies with market capitalizations within the collective range of the Russell Midcap and S&P MidCap 400 Indices.
Dodge & Cox Stock Fund. The investment seeks long-term growth of principal and income; a secondary objective is to achieve a reasonable current income. The fund invests primarily in a diversified portfolio of equity securities. It will invest at least 80% of its total assets in equity securities, including common stocks, depositary receipts evidencing ownership of common stocks, preferred stocks, securities convertible into common stocks, and securities that carry the right to buy common stocks. The fund may invest up to 20% of its total assets in U.S. dollar-denominated securities of non-U.S. issuers traded in the United States that are not in the S&P 500.
13
Table of Contents
T. Rowe Price Blue Chip Growth I. The investment seeks long-term capital growth; income is a secondary objective. The fund will normally invest at least 80% of its net assets (including any borrowings for investment purposes) in the common stocks of large and medium-sized blue chip growth companies. It focuses on companies with leading market positions, seasoned management, and strong financial fundamentals. The fund may sell securities for a variety of reasons, such as to secure gains, limit losses, or redeploy assets into more promising opportunities.
Vanguard 500 Index Admiral. The investment seeks to track the performance of a benchmark index that measures the investment return of large-capitalization stocks. The fund employs an indexing investment approach designed to track the performance of the Standard & Poor’s 500 Index, a widely recognized benchmark of U.S. stock market performance that is dominated by the stocks of large U.S. companies. The advisor attempts to replicate the target index by investing all, or substantially all, of its assets in the stocks that make up the index, holding each stock in approximately the same proportion as its weighting in the index.
DFA US Sustainability Core 1. The investment seeks long-term capital appreciation. The Portfolio purchases a broad and diverse group of securities of U.S. companies with a greater emphasis on small capitalization, value, and high profitability companies as compared to their representation in the U.S. Universe, while adjusting the composition of the Portfolio based on sustainability impact considerations. It also may purchase or sell futures contracts and options on futures contracts for U.S. equity securities and indices, to adjust market exposure based on actual or expected cash inflows to or outflows from the Portfolio.
Artisan High Income Instl. The investment seeks to provide total return through a combination of current income and capital appreciation. Under normal circumstances, the fund will invest primarily in instruments that are rated, at the time of purchase, below investment grade (below BBB- by Standard & Poor’s Rating Services (“S&P”) or Fitch, Inc. (“Fitch”) or below Baa3 by Moody’s Investors Service, Inc. (“Moody’s”)), or comparably rated by another nationally recognized statistical rating organization (“NRSRO”), or unrated but determined by Artisan Partners to be of comparable quality.
Dodge & Cox Income Fund. The investment seeks a high and stable rate of current income, consistent with long-term preservation of capital. The fund invests in a diversified portfolio of bonds and other debt securities. Under normal circumstances, the fund will invest at least 80% of its total assets in (1) investment-grade debt securities and (2) cash equivalents. “Investment grade” means securities rated Baa3 or higher by Moody’s Investors Service, or BBB- or higher by Standard & Poor’s Ratings Group or Fitch Ratings, or equivalently rated by any nationally recognized statistical rating organization, or, if unrated, deemed to be of similar quality by Dodge & Cox.
Vanguard Short Term Corporate Bd Idx Adm. The investment seeks to track the performance of a market-weighted corporate bond index with a short-term dollar-weighted average maturity. The fund employs an indexing investment approach designed to track the performance of the Bloomberg Barclays U.S. 1-5 Year Corporate Bond Index. This index includes U.S. dollar-denominated, investment-grade, fixed-rate, taxable securities issued by industrial, utility, and financial companies, with maturities between 1 and 5 years. Under normal circumstances, at least 80% of the fund’s assets will be invested in bonds included in the index.
Vanguard Short-Term Treasury Idx Admiral. The investment seeks to track the performance of a market-weighted Treasury index with a short-term dollar-weighted average maturity. The fund employs an indexing investment approach designed to track the performance of the Bloomberg Barclays US Treasury 1-3 Year Bond Index. This index includes fixed income securities issued by the U.S. Treasury (not including inflation-protected securities), all with maturities between 1 and 3 years. At least 80% of the fund’s assets will be invested in bonds included in the index.
Vanguard Total Bond Market Index Inst. The investment seeks the performance of Bloomberg Barclays U.S. Aggregate Float Adjusted Index. Bloomberg Barclays U.S. Aggregate Float Adjusted Index represents a wide spectrum of public, investment-grade, taxable, fixed income securities in the United States-including government, corporate, and international dollar-denominated bonds, as well as mortgage-backed and asset-backed securities-all with maturities of more than 1 year. All of its investments will be selected through the sampling process, and at least 80% of its assets will be invested in bonds held in the index.
Vanguard Treasury Money Mkt Inv. The investment seeks to provide current income while maintaining liquidity and a stable share price of $1. The fund invests solely in high-quality, short-term money market securities whose interest and principal payments are backed by the full faith and credit of the U.S. government. At least 80% of the fund’s assets will be
14
Table of Contents
invested in U.S. Treasury securities; the remainder of the assets may be invested in securities issued by U.S. governmental agencies. The fund maintains a dollar-weighted average maturity of 60 days or less and a dollar-weighted average life of 120 days or less.
Eastern Bankshares Stock Account
In connection with the offering, the 401(k) Plan now offers the Eastern Bankshares Stock Account as an additional choice to the investment options described above. The Eastern Bankshares Stock Account invests primarily in the shares of common stock of Eastern Bankshares, Inc. In connection with the offering, you may, in the manner described earlier, direct the trustee to invest up to 50% of your 401(k) Plan account or $250 in the Eastern Bankshares Stock Account.
As of the date of this prospectus supplement, there is no established market for the common stock of Eastern Bankshares, Inc. Accordingly, there is no record of the historical performance of the Eastern Bankshares Stock Account. Performance of the Eastern Bankshares Stock Account depends on a number of factors, including the financial condition and profitability of Eastern Bankshares, Inc. and Eastern Bank and market conditions for shares of the common stock of Eastern Bankshares, Inc. generally.
Investments in the Eastern Bankshares Stock Account involve special risks common to investments in the shares of common stock of Eastern Bankshares, Inc. In making a decision to invest a part of your account balance in the Eastern Bankshares Stock Account, you should carefully consider the information set forth on page 17 of this prospectus supplement under “Notice of Your Rights Concerning Employer Securities — The Importance of Diversifying Your Retirement Savings.”
For a discussion of material risks you should consider, see “Risk Factors” beginning on page 19 of the accompanying prospectus and the section of this prospectus supplement called “Notice of Your Rights Concerning Employer Securities” below.
Administration of the 401(k) Plan
The Trustee and Custodian. The trustee of the 401(k) Plan is Great-West Trust Company, LLC. (“Great-West”). However, the Trustee of the sub-trust for the Eastern Bankshares Stock Account will be certain senior executives of Eastern Bank, including the following persons: Robert F. Rivers, Quincy Miller, James B. Fitzgerald, Kathleen C. Henry and Nancy Huntington Stager. Great-West will be the custodian of the shares of common stock of Eastern Bankshares, Inc. held in the Eastern Bankshares Stock Account.
401(k) Plan Administrator. Pursuant to the terms of the 401(k) Plan, the 401(k) Plan is administered by the Plan Administrator, which is Eastern Bank. The address of the 401(k) Plan administrator is 195 Market Street, Lynn, Massachusetts 01901, telephone number (781) 598-7878. The 401(k) Plan administrator is responsible for the administration of the 401(k) Plan, interpretation of the provisions of the 401(k) Plan, prescribing procedures for filing applications for benefits, preparation and distribution of information explaining the 401(k) Plan, maintenance of 401(k) Plan records, books of account and all other data necessary for the proper administration of the 401(k) Plan, preparation and filing of all returns and reports relating to the 401(k) Plan which are required to be filed with the U.S. Department of Labor and the IRS, and for all disclosures required to be made to participants, beneficiaries and others under Sections 104 and 105 of ERISA.
Reports to 401(k) Plan Participants. The Plan Administrator will provide you a statement at least quarterly showing the balance in your account as of the end of that period, the amount of contributions allocated to your account for that period, and any adjustments to your account to reflect earnings or losses (if any).
Eastern Bank intends to continue the 401(k) Plan indefinitely. Nevertheless, Eastern Bank may terminate the 401(k) Plan at any time. If the 401(k) Plan is terminated in whole or in part, then regardless of other provisions in the 401(k) Plan, you will have a fully vested interest in your accounts. Eastern Bank reserves the right to make any amendment or amendments to the 401(k) Plan which do not cause any part of the Trust to be used for, or diverted to, any purpose other than the exclusive benefit of participants or their beneficiaries; provided, however, that Eastern Bank may make any amendment it determines necessary or desirable, with or without retroactive effect, to comply with ERISA.
15
Table of Contents
Merger, Consolidation or Transfer
In the event of the merger or consolidation of the 401(k) Plan with another plan, or the transfer of the Trust assets to another plan, the 401(k) Plan requires that you would, if either the 401(k) Plan or the other plan terminates, receive a benefit immediately after the merger, consolidation or transfer which is equal to or greater than the benefit you would have been entitled to receive immediately before the merger, consolidation or transfer, if the 401(k) Plan had then terminated.
Federal Income Tax Consequences
The following is a brief summary of the material federal income tax aspects of the 401(k) Plan. You should not rely on this summary as a complete or definitive description of the material federal income tax consequences relating to the 401(k) Plan. Statutory provisions change, as do their interpretations, and their application may vary in individual circumstances. Finally, the consequences under applicable state and local income tax laws may not be the same as under the federal income tax laws. Consult your tax advisor with respect to any distribution from the 401(k) Plan and transactions involving the 401(k) Plan.
As a “tax-qualified retirement plan,” the Code affords the 401(k) Plan special tax treatment, including:
| (1) | the sponsoring employer is allowed an immediate tax deduction for the amount contributed to the 401(k) Plan each year; |
| (2) | participants pay no current income tax on elective deferrals, other than Roth deferrals, contributed by the employer on their behalf (Roth deferrals are taxed in the year deferred); |
| (3) | earnings of the 401(k) Plan are tax-deferred, thereby permitting the tax-free accumulation of income and gains on investments; and |
| (4) | amounts distributed from the 401(k) Plan are generally taxed at ordinary income tax rates at the time of distribution. |
Roth deferrals and earnings on Roth deferrals that are distributed in a qualifying distribution receive special tax treatment (see the discussion on Roth deferrals under the section on “Description of the 401(k) Plan—Contributions Under the 401(k) Plan”) In addition, special tax treatment is afforded to shares of common stock of Eastern Bankshares, Inc. distributed in a lump sum distribution after termination of employment. (See the discussion below under “Federal Income Tax Consequences—Common Stock Included in Lump-Sum Distribution.”)
Eastern Bank will administer the 401(k) Plan to comply with the requirements of the Code as of the applicable effective date of any change in the law.
Lump-Sum Distribution. A distribution from the 401(k) Plan to a participant or the beneficiary of a participant will qualify as a lump-sum distribution if it is made within one taxable year, on account of the participant’s death, disability or separation from service, or after the participant attains age 591⁄2, and consists of the balance credited to participants under the 401(k) Plan and all other profit sharing plans, if any, maintained by Eastern Bank. The portion of any lump-sum distribution required to be included in your taxable income for federal income tax purposes consists of the entire amount of the lump-sum distribution, less the amount of after-tax contributions, if any, you have made to this 401(k) Plan and any other profit sharing plans maintained by Eastern Bank, which is included in the distribution.
Common Stock Included in Lump-Sum Distribution. If a lump-sum distribution includes common stock of Eastern Bankshares, Inc., the distribution generally will be taxed in the manner described above, except that the total taxable amount may be reduced by the amount of any “net unrealized appreciation” with respect to the common stock; that is, the excess of the fair market value of the common stock at the time of the distribution over its cost (or other basis) to the trust. The tax basis of the common stock, for purposes of computing gain or loss on its subsequent sale, equals the value of the common stock at the time of distribution, less the amount of net unrealized appreciation. Any gain on a subsequent sale or other taxable disposition of common stock, to the extent of the amount of net unrealized appreciation at the time of distribution, will constitute long-term capital gain, regardless of the holding period of the common stock. Any gain on a subsequent sale or other taxable disposition of common stock, in excess of the amount of net unrealized appreciation at the time of distribution, will also be considered long-term capital gain. The recipient of a distribution may elect to include the amount of any net unrealized appreciation in the total taxable amount of the distribution, to the extent allowed by regulations to be issued by the IRS.
16
Table of Contents
Distributions: Rollovers and Direct Transfers to Another Qualified Plan or to an IRA. You may roll over virtually all distributions from the 401(k) Plan to another qualified plan or to an individual retirement account in accordance with the terms of the other plan or account.
Notice of Your Rights Concerning Employer Securities
Federal law provides specific rights concerning investments in employer securities. Because you may in the future have investments in the common stock under the 401(k) Plan, you should take the time to read the following information carefully.
Your Rights Concerning Employer Securities. The 401(k) Plan allows you to elect to move any portion of your account that is invested in the common stock from that investment into other investment alternatives under the 401(k) Plan. You may contact the 401(k) Plan administrator shown above for specific information regarding this right, including how to make this election. In deciding whether to exercise this right, you will want to give careful consideration to the information below that describes the importance of diversification. All of the investment options under the 401(k) Plan are available to you if you decide to diversify out of your investment in the common stock.
The Importance of Diversifying Your Retirement Savings. To help achieve long-term retirement security, you should give careful consideration to the benefits of a well-balanced and diversified investment portfolio. Spreading your assets among different types of investments can help you achieve a favorable rate of return, while minimizing your overall risk of losing money. This is because market or other economic conditions that cause one category of assets, or one particular security, to perform very well often cause another asset category, or another particular security, to perform poorly. If you invest more than 20% of your retirement savings in any one company or industry, your savings may not be properly diversified. Although diversification is not a guarantee against loss, it is an effective strategy to help you manage investment risk.
In deciding how to invest your retirement savings, you should take into account all of your assets, including any retirement savings outside of the 401(k) Plan. No single approach is right for everyone because, among other factors, individuals have different financial goals, different time horizons for meeting their goals, and different tolerance for risk. Therefore, you should carefully consider the rights described here and how these rights affect the amount of money that you invest in common stock through the 401(k) Plan.
It is also important to periodically review your investment portfolio, your investment objectives, and the investment options under the 401(k) Plan to help ensure that your retirement savings will meet your retirement goals.
Additional ERISA Considerations
As noted above, the 401(k) Plan is subject to certain provisions of ERISA, including special provisions relating to control over the 401(k) Plan’s assets by participants and beneficiaries. The 401(k) Plan’s feature that allows you to direct the investment of your account balances is intended to satisfy the requirements of Section 404(c) of ERISA relating to control over 401(k) Plan assets by a participant or beneficiary. The effect of this is two-fold. First, you will not be deemed a “fiduciary” because of your exercise of investment discretion. Second, no person who otherwise is a fiduciary, such as Eastern Bank, the Plan Administrator, or the Trustee is liable under the fiduciary responsibility provisions of ERISA for any loss which results from your exercise of control over the assets in your 401(k) Plan account.
Because you will be entitled to invest a portion of your account balance in the 401(k) Plan in common stock, the regulations under Section 404(c) of ERISA require that the 401(k) Plan establish procedures that ensure the confidentiality of your decision to purchase, hold, or sell employer securities, except to the extent that disclosure of such information is necessary to comply with federal or state laws not preempted by ERISA. These regulations also require that your exercise of voting and similar rights with respect to the common stock be conducted in a way that ensures the confidentiality of your exercise of these rights.
Securities and Exchange Commission Reporting and Short-Swing Profit Liability
Section 16 of the Securities Exchange Act of 1934 imposes reporting and liability requirements on officers, directors, and persons beneficially owning more than 10% of public companies, such as Eastern Bankshares, Inc. Section 16(a) of the Securities Exchange Act of 1934 requires the filing of reports of beneficial ownership. Within 10 days of becoming an
17
Table of Contents
officer, director or person beneficially owning more than 10% of the shares of Eastern Bankshares, Inc., a Form 3 reporting initial beneficial ownership must be filed with the Securities and Exchange Commission. Changes in beneficial ownership, such as purchases, sales and gifts generally must be reported periodically, either on a Form 4 within two business days after the change occurs, or annually on a Form 5 within 45 days after the close of Eastern Bankshares, Inc.’s fiscal year. Discretionary transactions in and beneficial ownership of the common stock by officers, directors and persons beneficially owning more than 10% of common stock generally must be reported to the Securities and Exchange Commission by such individuals.
In addition to the reporting requirements described above, Section 16(b) of the Securities Exchange Act of 1934 provides for the recovery by Eastern Bankshares, Inc. of profits realized by an officer, director or any person beneficially owning more than 10% of the common stock resulting from non-exempt purchases and sales of the common stock within any six-month period.
The Securities and Exchange Commission has adopted rules that provide exemptions from the profit recovery provisions of Section 16(b) for all transactions in employer securities within an employee benefit plan, provided certain requirements are met. These requirements generally involve restrictions upon the timing of elections to acquire or dispose of employer securities for the accounts of Section 16(b) persons.
Except for distributions of common stock due to death, disability, retirement, termination of employment or under a qualified domestic relations order, persons affected by Section 16(b) are required to hold shares of common stock distributed from the 401(k) Plan for six months following such distribution and are prohibited from directing additional purchases of common stock for six months after receiving such a distribution.
Financial Information Regarding 401(k) Plan Assets
Financial information representing the net assets available for 401(k) Plan benefits and the change in net assets available for 401(k) Plan benefits at [DATE], 2020, is available upon written request to the 401(k) Plan administrator at the address shown above.
The validity of the issuance of the common stock has been passed upon by Nutter, McClennen & Fish, LLP , which has acted as special counsel to Eastern Bankshares, Inc. in connection with Eastern Bankshares, Inc.’s offering.
18
Table of Contents
PART II: INFORMATION NOT REQUIRED IN PROSPECTUS
Item 13: Other Expenses of Issuance and Distribution
| Amount (1) | ||||||
| * |
Registrant’s Legal Fees and Expenses | $ | 2,300,000 | |||
| * |
Registrant’s Accounting Fees and Expenses | $ | 1,700,000 | |||
| * |
Registrant’s State Tax Advisory Fees | $ | — | |||
| * |
Marketing Agent Fees | $ | 16,000,000 | |||
| * |
Records Management Fees and Expenses | $ | — | |||
| * |
Appraisal Fee and Expenses | $ | 400,000 | |||
| * |
Printing, Postage, Mailing and EDGAR Fees | $ | 2,500,000 | |||
| * |
Filing Fees (Nasdaq, FINRA, SEC and Commonwealth of Massachusetts) | $ | 1,327,000 | |||
| * |
Transfer Agent Fees and Expenses | $ | — | |||
| * |
Business Plan Fees and Expenses | $ | 100,000 | |||
| * |
Data Processing Fees and Expenses | $ | — | |||
| * |
Other | $ | — | |||
|
|
|
|||||
| * |
Total | $ | 24,327,000 | |||
|
|
|
|||||
| * | Estimated |
| (1) | Fees are estimated at the adjusted maximum of the offering range. |
Item 14. Indemnification of Directors and Officers
Article VI, Section 6.4.6 of the Amended and Restated Articles of Organization of Eastern Bankshares, Inc. (the “Corporation”) sets forth circumstances under which directors of the Corporation may have limited liability which they incur in their capacities as such:
6.4.6 LIMITATION OF LIABILITY OF DIRECTORS. No Director of the Corporation shall have personal liability to the Corporation or its shareholders for monetary damages for breach of his or her fiduciary duty as a Director notwithstanding any provision of law imposing such liability, provided that this provision shall not eliminate or limit the liability of a Director (a) for any breach of the Director’s duty of loyalty to the corporation or its shareholders, (b) for acts or omissions not in good faith or which involve intentional misconduct or a knowing violation of law, (c) for improper distributions under Section 6.40 of the Act, or (d) for any transaction from which the Director derived an improper personal benefit; and provided, further, however, that the Corporation shall not make any indemnification payment prohibited by Section 18(k) of the Federal Deposit Insurance Act or the regulations promulgated thereunder by the Federal Deposit Insurance Corporation. No amendment to or repeal of the provisions of this paragraph shall apply to or have any effect on the liability or alleged liability of any Director of the Corporation for or with respect to any act or failure to act of such Director occurring prior to such amendment or repeal. If the General Laws of Massachusetts are hereafter amended to further eliminate or limit the personal liability of Directors or to authorize corporate action to further eliminate or limit such liability, then the liability of the Directors of this Corporation shall be eliminated or limited to the fullest extent then permitted by the General Laws of Massachusetts as so amended.
Article VI of the Bylaws of the Corporation sets forth circumstances under which directors and officers of the Corporation may be insured or indemnified against liability which they incur in their capacities as such:
II-1
Table of Contents
ARTICLE VI
INDEMNIFICATION
Section 6.01 Definitions. For purposes of this Article:
(a) “Director” and “Officer” mean, respectively, any Director or Officer of the Corporation who serves or has served in such capacity, and any other person who serves or has served on any committee of the Corporation or as a director or officer of any of its subsidiaries, and any heirs or personal representatives of such person.
(b) “Non-Officer Employee” means any person who serves or has served as an employee of the Corporation or any subsidiary but who is not or was not a Director or Officer, and any heirs or personal representatives of such person.
(c) “Proceeding” means any action, suit or proceeding, civil or criminal, brought or threatened in or before any court, tribunal, administrative or legislative body or agency and any claim which could be the subject of a Proceeding.
(d) “Expenses” means any liability fixed by a judgment, order, decree or award in a Proceeding, any amount reasonably paid in settlement of a Proceeding and any professional fees or disbursements or other expenses reasonable incurred in a Proceeding.
Section 6.02 Indemnified Parties. Except as provided in Section 6.04 and Section 6.05 of this Article VI, each Director and Officer shall be indemnified by the Corporation against any and all expenses incurred by any such Director or Officer in connection with any Proceeding in which such Director or Officer is involved as a result of serving or having served (a) as a Director, Officer or employee of the Corporation (or a corporator, trustee or officer of Eastern Bank Corporation), (b) in any capacity with respect to any employee benefit plan sponsored by the Corporation or any wholly-owned subsidiary of the Corporation, (c) as a director, officer or employee of any majority-owned subsidiary of the Corporation, or (d) in any capacity with any other corporation, organization, partnership, joint venture, trust or other entity at the request or direction of the Corporation or any majority-owned subsidiary of the Corporation.
Section 6.03 Non-Officer Employees. Except as provided in Section 6.04 and Section 6.05 of this Article VI, each Non-Officer Employee of the Corporation may, in the discretion of the Board of Directors, be indemnified by the Corporation against any and all Expenses incurred by such Non-Officer Employee in connection with any Proceeding in which such Non-Officer Employee is involved as a result of serving or having served (a) as an employee of the Corporation or any subsidiary, (b) in any capacity with respect to any employee benefit plan sponsored by the Corporation or any wholly-owned subsidiary of the Corporation, (c) as a Director, Officer or Employee of any majority-owned subsidiary of the Corporation, or (d) in any capacity with any other corporation, organization, partnership, joint venture, trust or other entity at the request or direction of the Corporation or any majority-owned subsidiary of the Corporation.
Section 6.04 Service at the Request or Direction of Corporation or Majority-Owned Subsidiary. The Corporation shall not be obligated to indemnify any Director, Officer or Non-Officer Employee with respect to serving or having served in any of the capacities described in Section 6.02(d) or Section 6.03(d) of this Article VI unless the following two conditions are met: (a) such service was requested or directed in each specific case by the Chief Executive Officer of the Corporation (or by the chief executive officer of a majority-owned subsidiary) or by a vote of the Board of Directors prior to the occurrence of the event to which the indemnification relates, and (b) the Corporation maintains insurance coverage for the type of indemnification sought. The Corporation shall not be liable for indemnification under Section 6.02(d) or Section 6.03(d) of this Article VI for any amount in excess of the proceeds of insurance received with respect to such coverage as the Corporation in its discretion may elect to carry. The Corporation may, but shall not be required to, maintain insurance coverage with respect to indemnification under Section 6.02(d) or Section 6.03(d) of this Article VI. Notwithstanding any other provision of this Section 6.04, but subject to Section 6.05 of this Article VI, the Board of Directors may, but shall not be required to, indemnify a Director, Officer or Non-Officer Employee under Section 6.02(d) or Section 6.03(d) of this Article VI as to a Proceeding even if one or both of the two conditions specified in Section 6.04 of this Article VI have not been met and even if the amount of the indemnification exceeds the amount of the proceeds of any insurance which the Corporation may have elected to carry, provided that the Board of Directors in its discretion determines it to be in the best interests of the Corporation to do so.
Section 6.05 Good Faith. Except as otherwise provided in this Article VI, the Corporation shall indemnify to the fullest extent permitted by law an Director, Officer or an Non-Officer employee who is a party to the Proceeding under Section 6.02 or Section 6.03 of this Article VI if (A) (i) he or she conducted himself or herself in good faith, and (ii) he or she
II-2
Table of Contents
reasonably believed that his or her conduct was in the best interests of the Corporation or the entity for which he or she is an officer or director or that his or her conduct was, at least, not opposed to such best interests, and (iii) in the case of any criminal proceeding, he or she had no reasonable cause to believe his or her conduct was unlawful; or (B) he or she engaged in conduct for which he or she would not be liable under applicable provision of the MBCA. In the event that a Proceeding is compromised or settled so as to impose any liability or obligation upon an Officer or Non-Officer Employee, no indemnification shall be provided to said person with respect to a matter if there is a determination that with respect to such matter that such person did not act in a manner required for indemnification under Section 6.05 of this Article VI. The determination shall be made by a majority vote of those Directors who are not involved in such Proceeding. However, if more than half of the Directors are involved in such Proceeding, the determination shall be made by a majority vote of a committee of three disinterested Directors chosen at a regular or special meeting of the Board of Directors to make such determination; provided, however, that if there are less than three (3) disinterested Directors, the determination shall be made by an independent legal counsel selected by the disinterested Directors or, if none, by a majority vote of the Board of Directors at a regular or special meeting of the Board of Directors.
Section 6.06 Prior to Final Disposition. Any indemnification provided under this Article VI, in the case of a Director or Officer shall include, and in the case of a Non-Officer Employee may in the discretion of the Board of Directors include, payment by the Corporation of Expenses incurred in defending a Proceeding in advance of the final disposition of such Proceeding upon receipt of an undertaking by such Director, Officer or Non-Officer Employee to repay such payment if such person shall be adjudicated or determined to be not entitled to indemnification under this Article VI.
Section 6.07 Insurance. The Corporation may, but shall not be required to, purchase and maintain insurance to protect itself and any Director, Officer or Non-Officer Employee against any liability of any character asserted against or incurred by the Corporation or any such person, or arising out of any such status, whether or not the Corporation would have the power to indemnify such person against such liability by law or under the provisions of this Article VI.
Section 6.08 Application of this Article.
(a) This Article VI shall not limit the Corporation’s power to (1) pay or reimburse expenses incurred by Director, Officer or Non-Officer Employee in connection with his or her appearance as a witness in a proceeding at a time when he or she is not a party or (2) indemnify, advance expenses to or provide or maintain insurance on behalf of an employee or agent.
(b) The indemnification and advancement of expenses provided by, or granted pursuant to, this Article VI shall not be considered exclusive of any other right to which those seeking indemnification or advancement of expenses may be entitled.
(c) Each person who is or becomes an Officer shall be deemed to have served or to have continued to serve in such capacity in reliance upon the indemnity provided for in the Article. All rights to indemnification under this Article shall be deemed to be provided by a contract between the Corporation and the person who serves as an officer at any time while these bylaws and the relevant provisions of the MBCA are in effect. Any repeal or modification thereof shall not affect any rights or obligations then existing.
(d) If any provision or provisions of this Article VI shall be held to be invalid, illegal or unenforceable as applied to any person or entity or circumstance for any reason whatsoever, then, to the fullest extent permitted by law, the validity, legality and enforceability of such provisions in any other circumstance and of the remaining provisions of this Article VI (including, without limitation, each portion of any sentence of this Article VI containing any such provision held to be invalid, illegal or unenforceable that is not itself held to be invalid, illegal or unenforceable) and the application of such provision to other persons or entities and circumstances shall not in any way be affected or impaired thereby.
(e) If the laws of the Commonwealth of Massachusetts are hereafter amended from time to time to increase the scope of permitted indemnification, indemnification hereunder shall be provided to the fullest extent permitted or required by any such amendment.
(f) Nothing in this Article shall be construed as authorizing the indemnification of any Director, Officer or any Non-Officer Employee for Proceedings or Expenses that would be prohibited by federal banking laws or regulations including applicable provisions of 12 CFR Section 359.
Item 15. Recent Sales of Unregistered Securities
Not Applicable.
II-3
Table of Contents
Item 16. Exhibits and Financial Statement Schedules:
The exhibits and financial statement schedules filed as part of this registration statement are as follows:
| (a) | List of Exhibits |
| † | Management contract or compensation plan or arrangement. |
| # | Previously filed. |
| * | To be filed by amendment. |
II-4
Table of Contents
| (b) | Financial Statement Schedules |
No financial statement schedules are filed because the required information is not applicable or is included in the consolidated financial statements or related notes.
Item 17. Undertakings
The undersigned Registrant hereby undertakes:
(1) To file, during any period in which it offers or sales are being made, a post-effective amendment to this registration statement:
(i) To include any prospectus required by Section 10(a)(3) of the Securities Act of 1933;
(ii) To reflect in the prospectus any facts or events arising after the effective date of the registration statement (or the most recent post-effective amendment thereof) which, individually or in the aggregate, represent a fundamental change in the information set forth in the registration statement. Notwithstanding the foregoing, any increase or decrease in volume of securities offered (if the total dollar value of securities offered would not exceed that which was registered) and any deviation from the low or high end of the estimated maximum offering range may be reflected in the form of prospectus filed with the Commission pursuant to Rule 424(b) if, in the aggregate, the changes in volume and price represent no more than a 20 percent change in the maximum aggregate offering price set forth in the “Calculation of Registration Fee” table in the effective registration statement; and
(iii) To include any material information with respect to the plan of distribution not previously disclosed in the registration statement or any material change to such information in the registration statement.
(2) That, for the purpose of determining any liability under the Securities Act of 1933, each such post-effective amendment shall be deemed to be a new registration statement relating to the securities offered therein, and the offering of such securities at that time shall be deemed to be the initial bona fide offering thereof.
(3) To remove from registration by means of a post-effective amendment any of the securities being registered which remain unsold at the termination of the offering.
(4) That, for the purpose of determining liability of the registrant under the Securities Act of 1933 to any purchaser in the initial distribution of the securities:
The undersigned registrant undertakes that in a primary offering of securities of the undersigned registrant pursuant to this registration statement, regardless of the underwriting method used to sell the securities to the purchaser, if the securities are offered or sold to such purchaser by means of any of the following communications, the undersigned registrant will be a seller to the purchaser and will be considered to offer or sell such securities to such purchaser:
(i) Any preliminary prospectus or prospectus of the undersigned registrant relating to the offering required to be filed pursuant to Rule 424 (§230.424 of this chapter);
(ii) Any free writing prospectus relating to the offering prepared by or on behalf of the undersigned registrant or used or referred to by the undersigned registrant;
(iii) The portion of any other free writing prospectus relating to the offering containing material information about the undersigned registrant or its securities provided by or on behalf of the undersigned registrant; and
(iv) Any other communication that is an offer in the offering made by the undersigned registrant to the purchaser.
(5) That, for purposes of determining any liability under the Securities Act of 1933, the information omitted from the form of prospectus filed as part of this registration statement in reliance upon Rule 430A and contained in a form of prospectus filed by the registrant pursuant to Rule 424(b)(1) or (4) or 497(h) under the Securities Act shall be deemed to be part of this registration statement as of the time it was declared effective.
(6) That, for the purpose of determining any liability under the Securities Act of 1933, each post-effective amendment that contains a form of prospectus shall be deemed to be a new registration statement relating to the securities offered therein, and the offering of such securities at that time shall be deemed to be the initial bona fide offering thereof.
II-5
Table of Contents
(7) The undersigned registrant hereby undertakes to provide to the underwriter at the closing specified in the underwriting agreement, certificates in such denominations and registered in such names as required by the underwriter to permit prompt delivery to each purchaser.
(8) Insofar as indemnification for liabilities arising under the Securities Act of 1933 may be permitted to directors, officers and controlling persons of the registrant pursuant to the foregoing provisions, or otherwise, the registrant has been advised that in the opinion of the Securities and Exchange Commission such indemnification is against public policy as expressed in the Act, and is, therefore, unenforceable. In the event that a claim for indemnification against such liabilities (other than the payment by the registrant of expenses incurred or paid by a director, officer or controlling person of the registrant in the successful defense of any action, suit or proceeding) is asserted by such director, officer or controlling person in connection with the securities being registered, the registrant will, unless in the opinion of its counsel the matter has been settled by controlling precedent, submit to a court of appropriate jurisdiction the question whether such indemnification by it is against public policy as expressed in the Act and will be governed by the final adjudication of such issue.
II-6
Table of Contents
Signatures
Pursuant to the requirements of the Securities Act of 1933, the registrant has duly caused this registration statement to be signed on its behalf by the undersigned, thereunto duly authorized in the City of Boston, Commonwealth of Massachusetts on July 23, 2020.
| EASTERN BANKSHARES, INC. | ||
| By: | /s/ Robert F. Rivers | |
| Robert F. Rivers | ||
| Chief Executive Officer | ||
| (Duly Authorized Representative) | ||
Table of Contents
Pursuant to the requirements of the Securities Act of 1933, this registration statement has been signed by the following persons in the capacities and on the dates indicated.
| Signatures |
Title |
Date | ||
| /s/ Robert F. Rivers Robert F. Rivers |
Chief Executive Officer and Chair of the Board (Principal Executive Officer) | July 23, 2020 | ||
| * James B. Fitzgerald |
Chief Financial Officer (Principal Financial Officer) |
July 23, 2020 | ||
| * David A. Ahlquist |
Principal Accounting Officer | July 23, 2020 | ||
| * Richard E. Holbrook |
Director | July 23, 2020 | ||
| * Richard C. Bane |
Director | July 23, 2020 | ||
| * Luis A. Borgen |
Director | July 23, 2020 | ||
| * Joseph T. Chung |
Director | July 23, 2020 | ||
| * Paul M. Connolly |
Director | July 23, 2020 | ||
| * Bari A. Harlam |
Director | July 23, 2020 | ||
| * Diane S. Hessan |
Director | July 23, 2020 | ||
| * Peter K. Markell |
Director | July 23, 2020 | ||
| * Greg A. Shell |
Director |
July 23, 2020 | ||
| * Paul D. Spiess |
Director |
July 23, 2020 | ||
*By Power of Attorney
*/s/ Robert F. Rivers
Attorney-in-Fact