Attached files
| file | filename |
|---|---|
| EX-99.1 - EX-99.1 - VALMONT INDUSTRIES INC | pressrelease20200627.htm |
| 8-K - 8-K - VALMONT INDUSTRIES INC | vmi-20200722.htm |

Valmont Industries, Inc. Second Quarter Earnings Presentation July 23, 2020
Disclosure Regarding Forward-Looking Statements These slides contain (and the accompanying oral discussion will contain) “forward-looking statements” within the meaning of the Private Securities Litigation Reform Act of 1995. Such statements involve known and unknown risks, uncertainties and other factors that could cause the actual results of the Company to differ materially from the results expressed or implied by such statements, including general economic and business conditions, conditions affecting the industries served by the Company and its subsidiaries including the continuing and developing effects of COVID-19 including the effects of the outbreak on the general economy and the specific economic effects on the Company’s business and that of its customers and suppliers, competitor responses to the Company’s products and services, the overall market acceptance of such products and services, the integration of acquisitions and other factors disclosed in the Company’s periodic reports filed with the Securities and Exchange Commission. Consequently such forward-looking statements should be regarded as the Company’s current plans, estimates and beliefs. The Company does not undertake and specifically declines any obligation to publicly release the results of any revisions to these forward-looking statements that may be made to reflect any future events or circumstances after the date of such statements or to reflect the occurrence of anticipated or unanticipated events. 2 | July 23, 2020 | Valmont Industries, Inc. | 2Q 2020 Earnings Presentation

STEVE KANIEWSKI PRESIDENT & CHIEF EXECUTIVE OFFICER 3 | July 23, 2020 | Valmont Industries, Inc. | 2Q 2020 Earnings Presentation
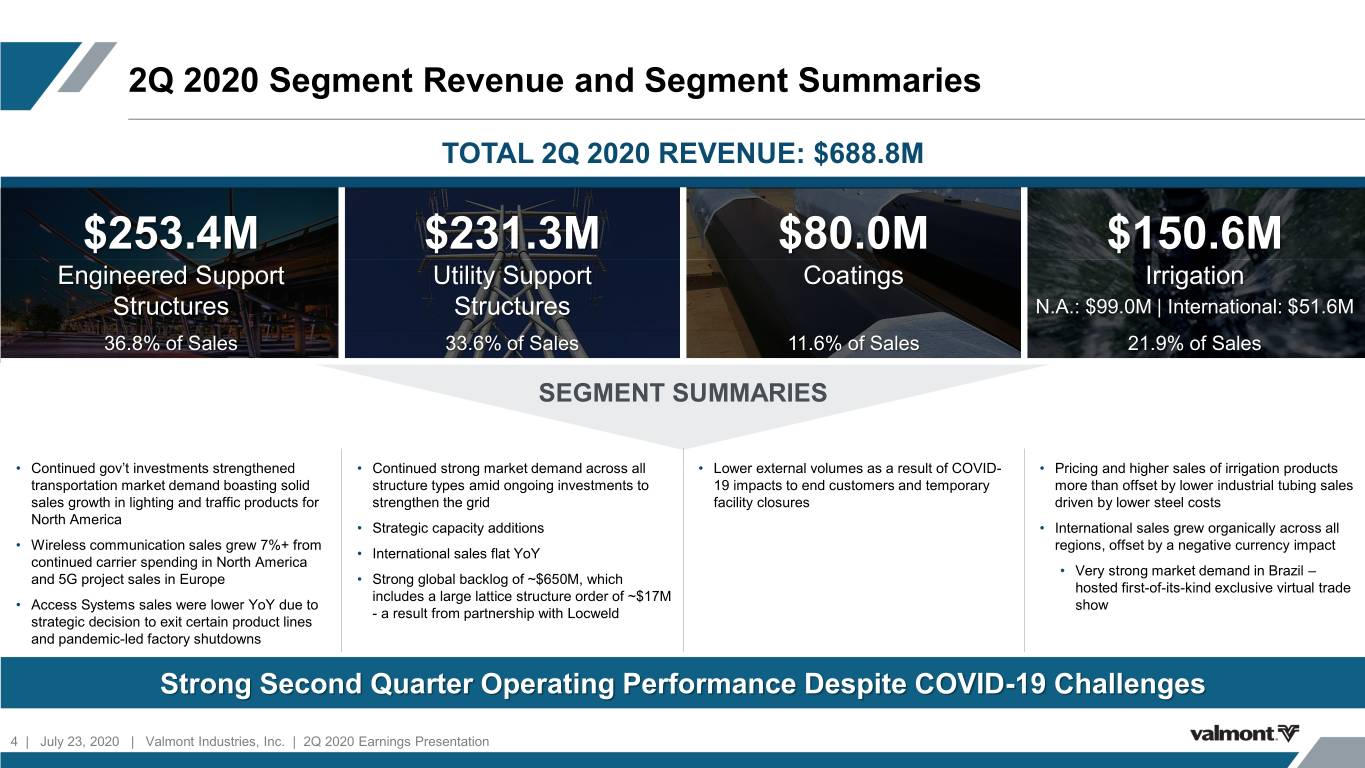
2Q 2020 Segment Revenue and Segment Summaries TOTAL 2Q 2020 REVENUE: $688.8M $253.4M $231.3M $80.0M $150.6M Engineered Support Utility Support Coatings Irrigation Structures Structures N.A.: $99.0M | International: $51.6M 36.8% of Sales 33.6% of Sales 11.6% of Sales 21.9% of Sales SEGMENT SUMMARIES • Continued gov’t investments strengthened • Continued strong market demand across all • Lower external volumes as a result of COVID- • Pricing and higher sales of irrigation products transportation market demand boasting solid structure types amid ongoing investments to 19 impacts to end customers and temporary more than offset by lower industrial tubing sales sales growth in lighting and traffic products for strengthen the grid facility closures driven by lower steel costs North America • Strategic capacity additions • International sales grew organically across all • Wireless communication sales grew 7%+ from regions, offset by a negative currency impact • International sales flat YoY continued carrier spending in North America • Very strong market demand in Brazil – and 5G project sales in Europe • Strong global backlog of ~$650M, which hosted first-of-its-kind exclusive virtual trade includes a large lattice structure order of ~$17M • Access Systems sales were lower YoY due to show - a result from partnership with Locweld strategic decision to exit certain product lines and pandemic-led factory shutdowns Strong Second Quarter Operating Performance Despite COVID-19 Challenges 4 | July 23, 2020 | Valmont Industries, Inc. | 2Q 2020 Earnings Presentation

Further Advancing Adjacent Market Growth and Technology Leadership Completed Two Strategic Acquisitions Strengthening Valley Insights • AI crop monitoring and detection service, in partnership with Prospera Technologies, which utilizes imagery to detect crop health issues to alert a grower to problem areas for remediation • Expanded service in 4 states Background Background • Reached goal to monitor 5M acres, 6 months ahead of schedule • Purchased majority stake in leading provider of • Acquired 100% of assets for niche, subscription- solar energy solutions for Brazilian ag market based ag technology and remote sensing and • 300+ growers on 4,800 fields benefit from our industry-leading monitoring solution in the U.S. market • Delivering a first-to-market, advanced solar service technology power and data monitoring solution to growers • Expands global connected devices to ~102k, • Conducting field tests using sensors mounted to Valley irrigation and YTD technology sales grew $32M+ as we Strategy continue to invest in advanced technology machines • Expand services globally through strength of ‒ Sensors collect high-resolution images Valley dealer network ‒ Captures greater detail than drone, aerial or satellite • Provide a distributed generation solution for imagery at a much lower cost profile powering pivots to optimize operational efficiency ‒ Key to roadmap to transform center pivot to an with unmatched monitoring solutions from Valmont autonomous crop management machine Solar Solutions • Strong collaboration effort with world-class dealer network – • Offers innovative irrigation solutions where electric grid lacks and/or generation sources are critical to acceleration and market adoption not viable (e.g., Africa, Middle East, and other developing markets) Remain Focused on Acquisitions and Investments that Provide Strategic Value to Customers 5 | July 23, 2020 | Valmont Industries, Inc. | 2Q 2020 Earnings Presentation

Strong Execution of COVID-19 Pandemic Plan and Safety Protocols Valmont implemented enhanced protocols in response to COVID-19, including recommendations and requirements issued by the Centers for Disease Control and Prevention (“CDC”), World Health Organization (“WHO”) and local, state and national health authorities, to protect our employees, customers, suppliers and communities https://www.valmont.com/coronavirus-communication ENHANCED PROTOCOLS IN OUR FACILITIES Prohibited all domestic and international non-essential travel for all employees Increased frequency of disinfecting high-touch areas and high-traffic common areas Reinforced hand washing and infection control training Implemented safe distancing procedures and processes in all production facilities and administrative work areas Provided additional personal protective equipment and cleaning supplies Implemented processes to track and isolate employees who report or show COVID-19 symptoms or exposure Implemented actions to screen, limit or prohibit non-essential visitors to all facilities Implemented remote work strategy for administrative teams Engaged with legal counsel in all jurisdictions where Valmont operates to ensure compliance with local mandates Implemented security protocols for necessary site shutdowns 6 | July 23, 2020 | Valmont Industries, Inc. | 2Q 2020 Earnings Presentation
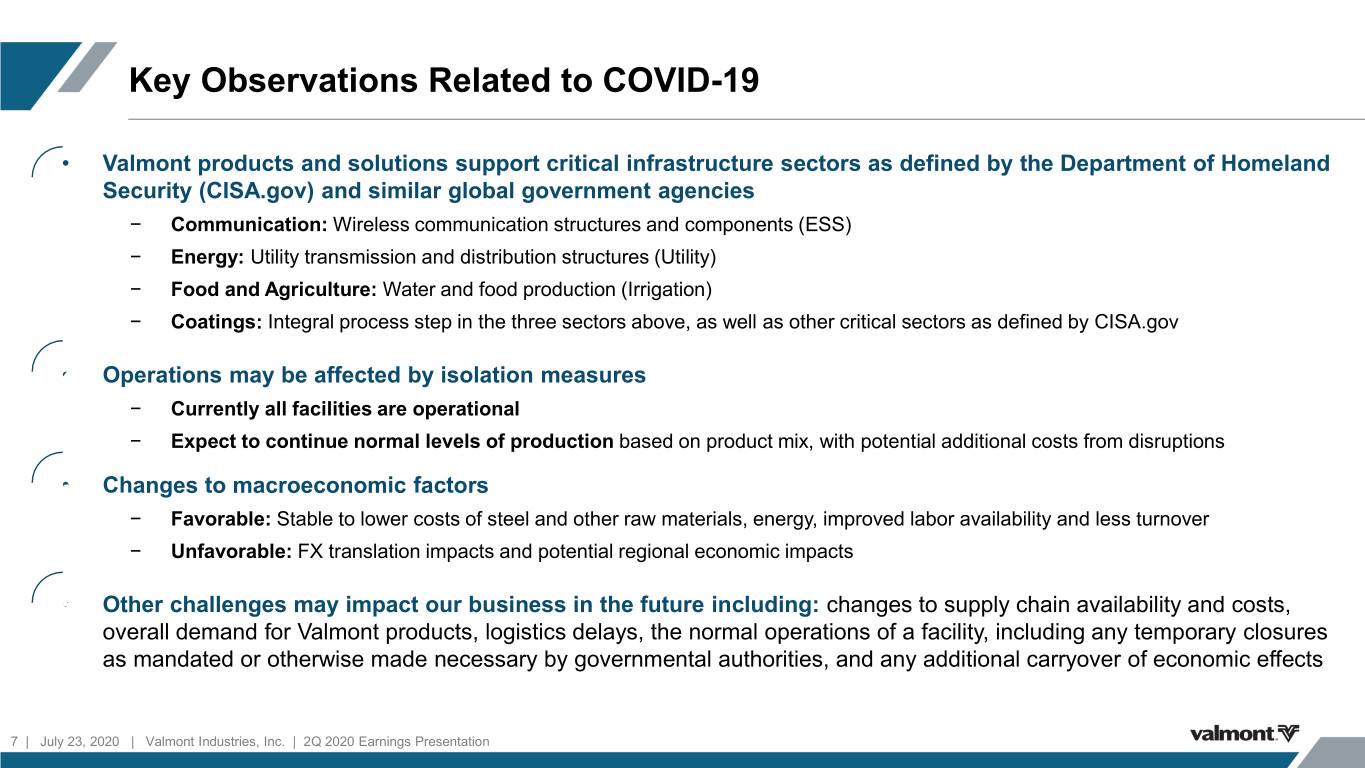
Key Observations Related to COVID-19 • Valmont products and solutions support critical infrastructure sectors as defined by the Department of Homeland 01 Security (CISA.gov) and similar global government agencies − Communication: Wireless communication structures and components (ESS) − Energy: Utility transmission and distribution structures (Utility) − Food and Agriculture: Water and food production (Irrigation) − Coatings: Integral process step in the three sectors above, as well as other critical sectors as defined by CISA.gov 02• Operations may be affected by isolation measures − Currently all facilities are operational − Expect to continue normal levels of production based on product mix, with potential additional costs from disruptions 03• Changes to macroeconomic factors − Favorable: Stable to lower costs of steel and other raw materials, energy, improved labor availability and less turnover − Unfavorable: FX translation impacts and potential regional economic impacts 04• Other challenges may impact our business in the future including: changes to supply chain availability and costs, overall demand for Valmont products, logistics delays, the normal operations of a facility, including any temporary closures as mandated or otherwise made necessary by governmental authorities, and any additional carryover of economic effects 7 | July 23, 2020 | Valmont Industries, Inc. | 2Q 2020 Earnings Presentation
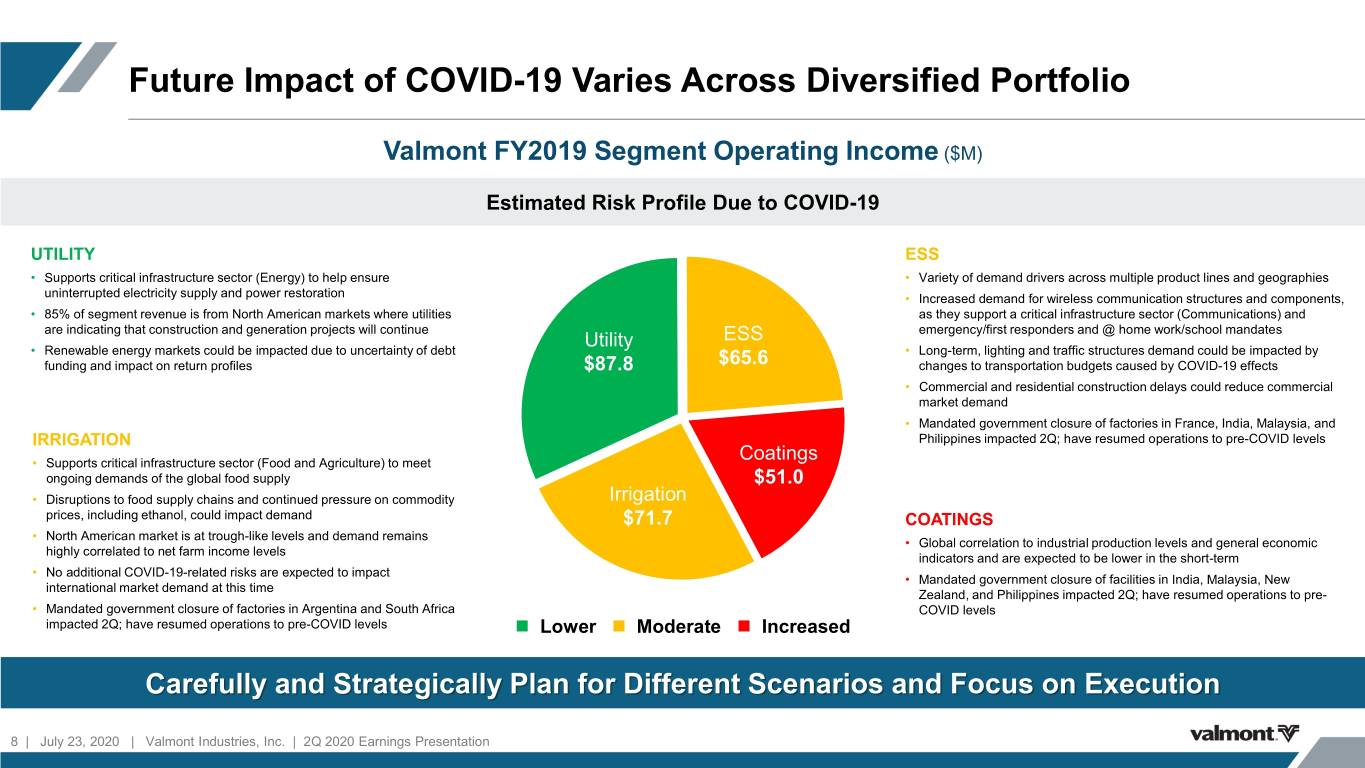
Future Impact of COVID-19 Varies Across Diversified Portfolio Valmont FY2019 Segment Operating Income ($M) Estimated Risk Profile Due to COVID-19 UTILITY ESS • Supports critical infrastructure sector (Energy) to help ensure • Variety of demand drivers across multiple product lines and geographies uninterrupted electricity supply and power restoration • Increased demand for wireless communication structures and components, • 85% of segment revenue is from North American markets where utilities as they support a critical infrastructure sector (Communications) and are indicating that construction and generation projects will continue ESS emergency/first responders and @ home work/school mandates • Renewable energy markets could be impacted due to uncertainty of debt Utility • Long-term, lighting and traffic structures demand could be impacted by funding and impact on return profiles $87.8 $65.6 changes to transportation budgets caused by COVID-19 effects • Commercial and residential construction delays could reduce commercial market demand • Mandated government closure of factories in France, India, Malaysia, and IRRIGATION Philippines impacted 2Q; have resumed operations to pre-COVID levels • Supports critical infrastructure sector (Food and Agriculture) to meet Coatings ongoing demands of the global food supply $51.0 • Disruptions to food supply chains and continued pressure on commodity Irrigation prices, including ethanol, could impact demand $71.7 COATINGS • North American market is at trough-like levels and demand remains • Global correlation to industrial production levels and general economic highly correlated to net farm income levels indicators and are expected to be lower in the short-term • No additional COVID-19-related risks are expected to impact • Mandated government closure of facilities in India, Malaysia, New international market demand at this time Zealand, and Philippines impacted 2Q; have resumed operations to pre- • Mandated government closure of factories in Argentina and South Africa COVID levels impacted 2Q; have resumed operations to pre-COVID levels Lower Moderate Increased Carefully and Strategically Plan for Different Scenarios and Focus on Execution 8 | July 23, 2020 | Valmont Industries, Inc. | 2Q 2020 Earnings Presentation

AVNER APPLBAUM EVP & CHIEF FINANCIAL OFFICER 9 | July 23, 2020 | Valmont Industries, Inc. | 2Q 2020 Earnings Presentation
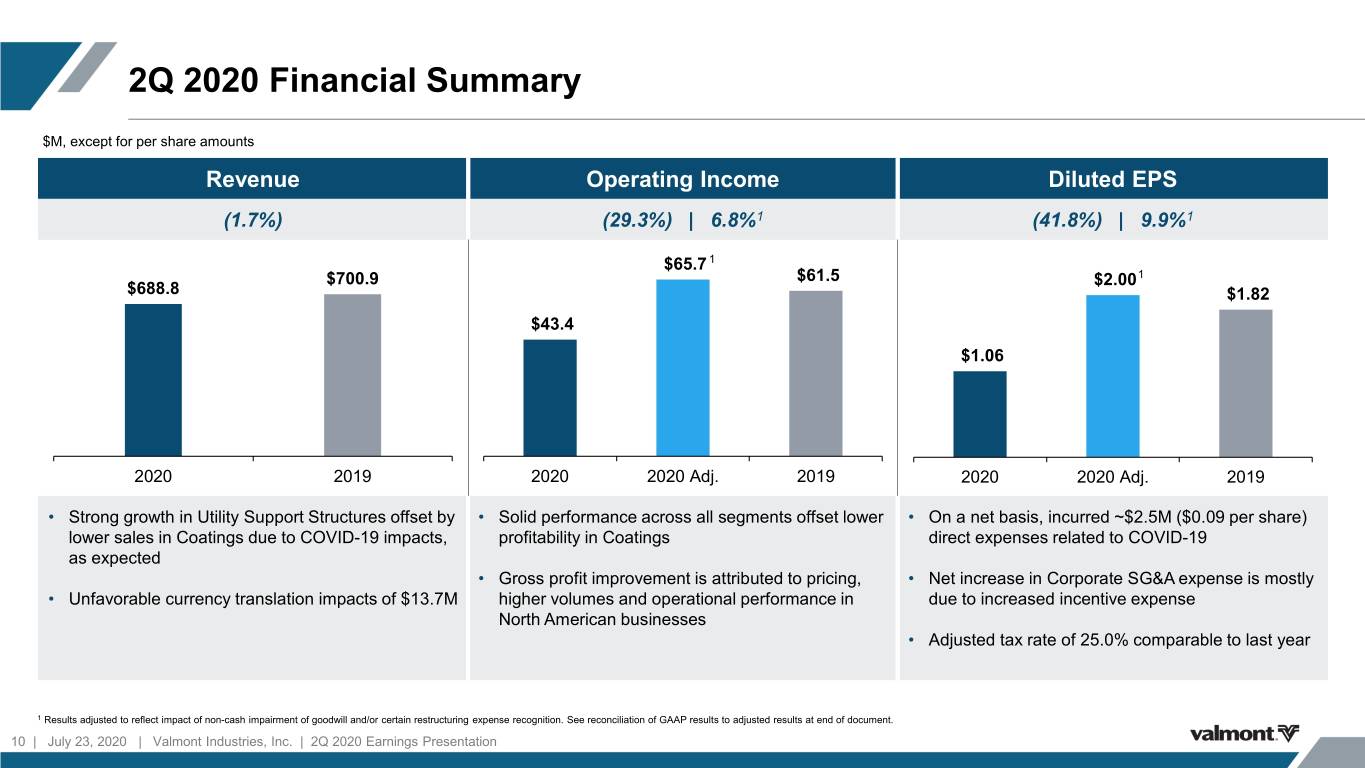
2Q 2020 Financial Summary $M, except for per share amounts Revenue Operating Income Diluted EPS (1.7%) (29.3%) | 6.8%1 (41.8%) | 9.9%1 $65.7 1 $700.9 $61.5 $2.00 1 $688.8 $1.82 $43.4 $1.06 2020 2019 2020 2020 Adj. 2019 2020 2020 Adj. 2019 • Strong growth in Utility Support Structures offset by • Solid performance across all segments offset lower • On a net basis, incurred ~$2.5M ($0.09 per share) lower sales in Coatings due to COVID-19 impacts, profitability in Coatings direct expenses related to COVID-19 as expected • Gross profit improvement is attributed to pricing, • Net increase in Corporate SG&A expense is mostly • Unfavorable currency translation impacts of $13.7M higher volumes and operational performance in due to increased incentive expense North American businesses • Adjusted tax rate of 25.0% comparable to last year 1 Results adjusted to reflect impact of non-cash impairment of goodwill and/or certain restructuring expense recognition. See reconciliation of GAAP results to adjusted results at end of document. 10 | July 23, 2020 | Valmont Industries, Inc. | 2Q 2020 Earnings Presentation

2Q Results | Engineered Support Structures ($M) Key Statistics Revenue Operating Income 2019 Revenue1 $ 257.5 (5.8) $22.9 2 Volume $248.8 $257.5 $20.9 Pricing/Mix 2.0 Acquisitions/Divestiture 1.2 $4.8 Currency Translation (6.1) 1 2020 Revenue $ 248.8 2020 2019 2020 2020 Adj. 2019 COMMENTARY • Continued pricing discipline and strong volumes in North American markets whereas international markets impacted margins as a result of facility closures in France and India • Sales of Access Systems products were lower YoY driven by volumes from strategically exiting the non-core supply and install product offering, continued end market weakness and COVID-19 impact; recorded $16.6M of pre-tax non-cash impairment charges against goodwill and trade names1 • Excluding impairment charges, 2Q profitability improved both QoQ and YoY 1 Net sales after intersegment eliminations. 2 Results adjusted to reflect impact of non-cash impairment of goodwill and/or certain restructuring expense recognition. See reconciliation of GAAP results to adjusted results at end of document. 11 | July 23, 2020 | Valmont Industries, Inc. | 2Q 2020 Earnings Presentation

2Q Results | Utility Support Structures ($M) Key Statistics Revenue Operating Income 2019 Revenue1 $ 209.1 $228.5 2 Volume 14.3 $209.1 $25.3 $21.7 Pricing/Mix 3.6 $16.0 Acquisitions/Divestiture 1.8 Currency Translation (0.3) 1 2020 Revenue $ 228.5 2020 2019 2020 2020 Adj. 2019 COMMENTARY • Sales grew 10.2% YoY driven by significantly higher volumes from robust market demand and strategic capacity additions, and favorable pricing • Operating income was higher YoY driven by: ‒ Strong volumes ‒ Improved operational performance ‒ Improved international profitability 1 Net sales after intersegment eliminations 2 Results adjusted to reflect impact of non-cash impairment of goodwill and/or certain restructuring expense recognition. See reconciliation of GAAP results to adjusted results at end of document. 12 | July 23, 2020 | Valmont Industries, Inc. | 2Q 2020 Earnings Presentation
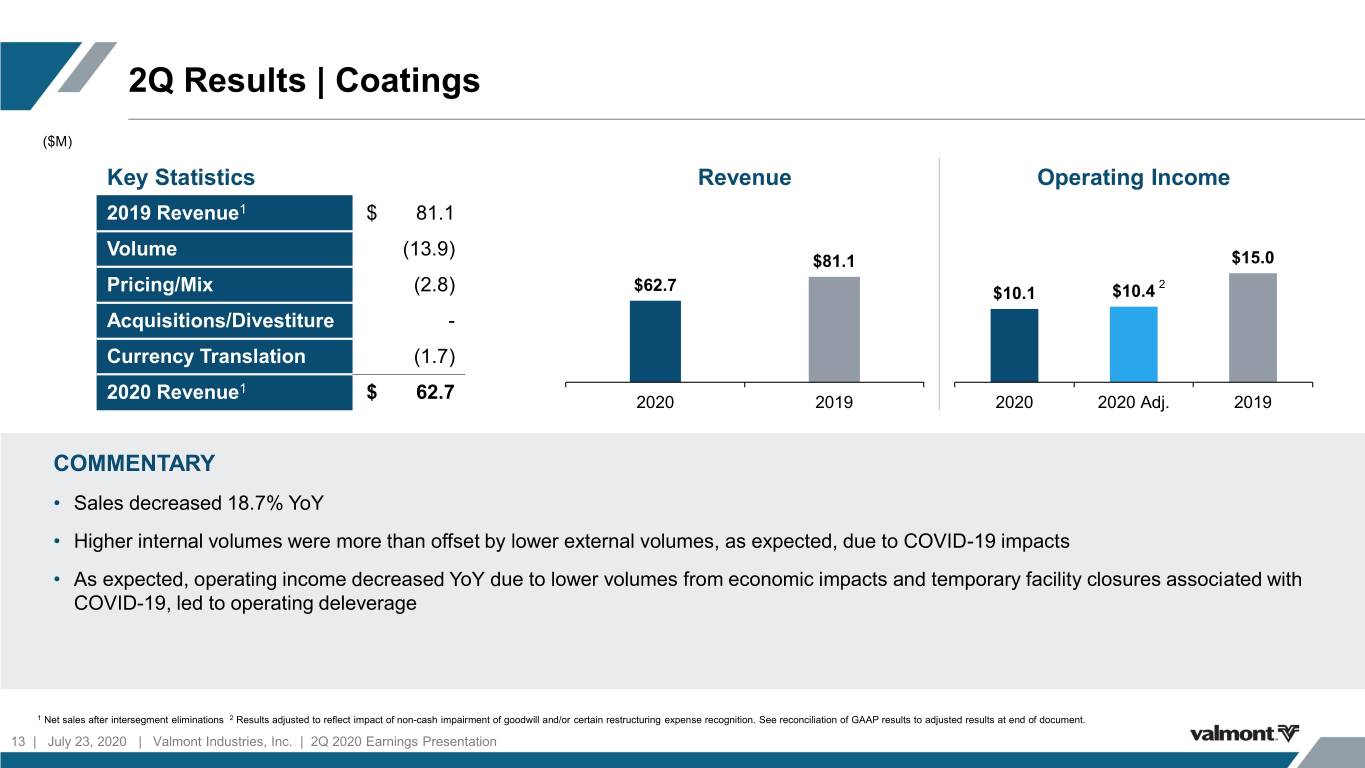
2Q Results | Coatings ($M) Key Statistics Revenue Operating Income 2019 Revenue1 $ 81.1 Volume (13.9) $81.1 $15.0 2 Pricing/Mix (2.8) $62.7 $10.1 $10.4 Acquisitions/Divestiture - Currency Translation (1.7) 1 2020 Revenue $ 62.7 2020 2019 2020 2020 Adj. 2019 COMMENTARY • Sales decreased 18.7% YoY • Higher internal volumes were more than offset by lower external volumes, as expected, due to COVID-19 impacts • As expected, operating income decreased YoY due to lower volumes from economic impacts and temporary facility closures associated with COVID-19, led to operating deleverage 1 Net sales after intersegment eliminations 2 Results adjusted to reflect impact of non-cash impairment of goodwill and/or certain restructuring expense recognition. See reconciliation of GAAP results to adjusted results at end of document. 13 | July 23, 2020 | Valmont Industries, Inc. | 2Q 2020 Earnings Presentation

2Q Results | Irrigation ($M) Key Statistics Revenue Total Operating Income 2019 Revenue1 $ 153.2 Volume 3.3 $97.2 $100.8 $22.4 $21.5 Pricing/Mix (2.0) $51.6 $52.4 Acquisitions/Divestiture (0.1) Currency Translation (5.6) North America International 1 2020 Revenue $ 148.8 2020 2019 2020 2019 COMMENTARY • Global sales decreased 3.0% YoY due to unfavorable currency impacts of $5.6M; higher sales of irrigation products were offset by lower industrial tubing sales ‒ North American sales down 3.7% YoY; pricing and higher sales of irrigation products were more than offset by lower industrial tubing sales driven by steel cost deflation ‒ International sales down 1.5% YoY; sales volumes increased ~10% excluding unfavorable currency impacts, led by continued strong demand in Brazil and higher sales in European markets • Operating income increased YoY; profitability improvement led by pricing and higher sales volumes 1 Net sales after intersegment eliminations. 14 | July 23, 2020 | Valmont Industries, Inc. | 2Q 2020 Earnings Presentation
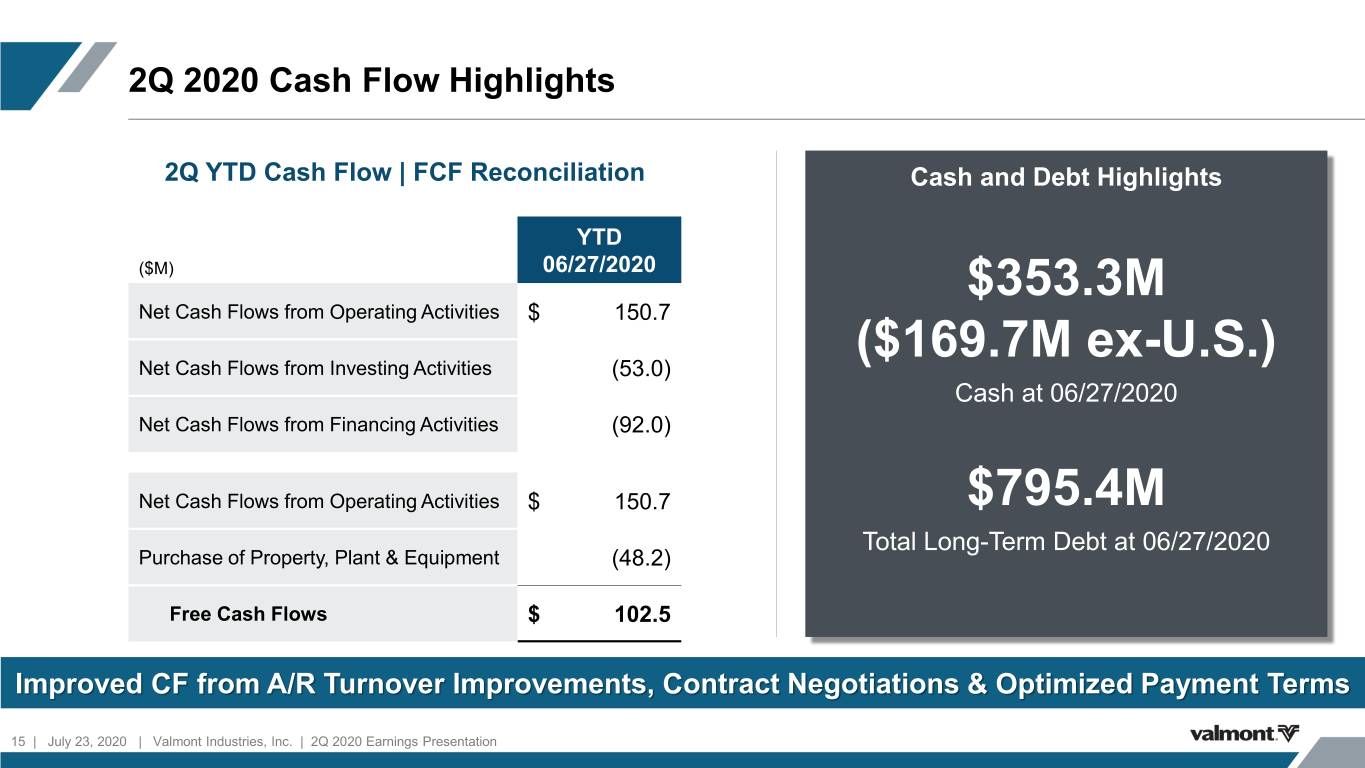
2Q 2020 Cash Flow Highlights 2Q YTD Cash Flow | FCF Reconciliation Cash and Debt Highlights YTD ($M) 06/27/2020 $353.3M Net Cash Flows from Operating Activities $ 150.7 Net Cash Flows from Investing Activities (53.0) ($169.7M ex-U.S.) Cash at 06/27/2020 Net Cash Flows from Financing Activities (92.0) Net Cash Flows from Operating Activities $ 150.7 $795.4M Total Long-Term Debt at 06/27/2020 Purchase of Property, Plant & Equipment (48.2) Free Cash Flows $ 102.5 Improved CF from A/R Turnover Improvements, Contract Negotiations & Optimized Payment Terms 15 | July 23, 2020 | Valmont Industries, Inc. | 2Q 2020 Earnings Presentation
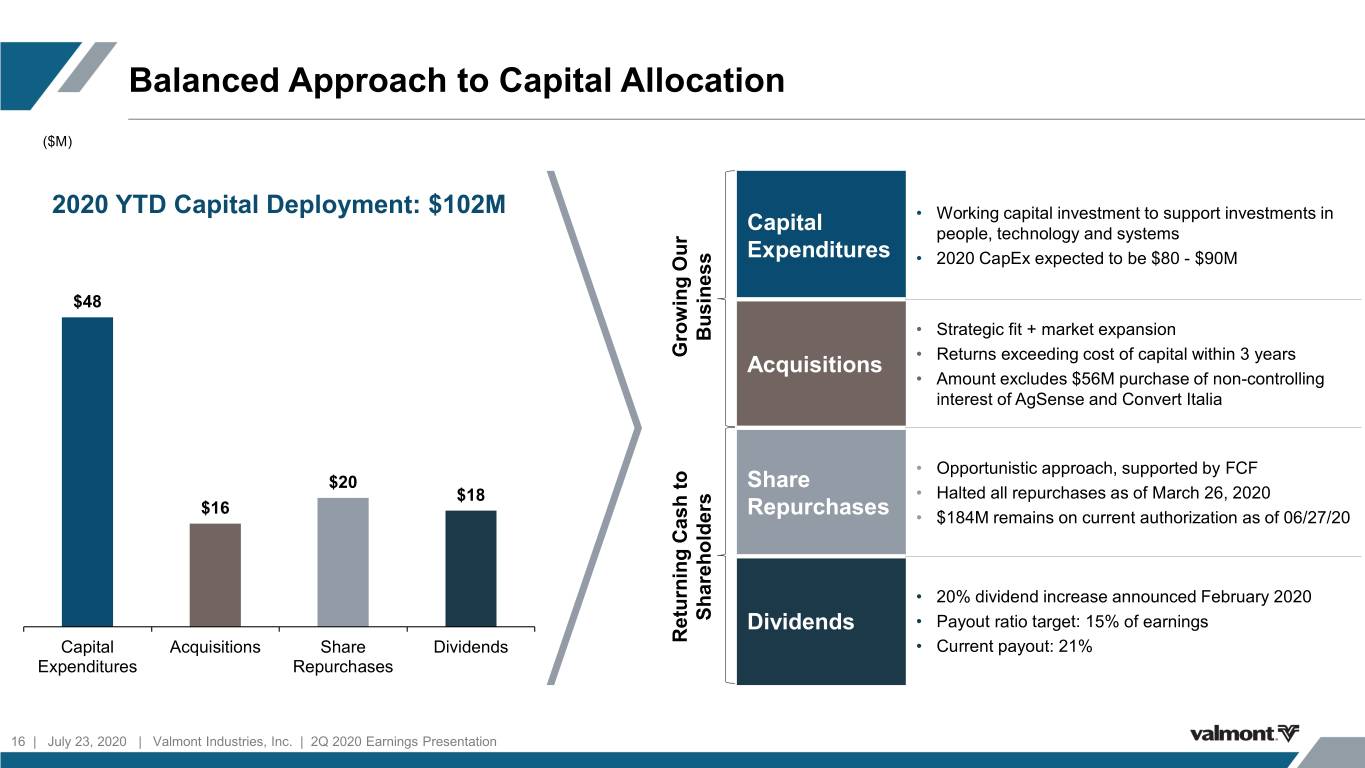
Balanced Approach to Capital Allocation ($M) 2020 YTD Capital Deployment: $102M • Working capital investment to support investments in Capital people, technology and systems Expenditures • 2020 CapEx expected to be $80 - $90M $48 • Strategic fit + market expansion Business Growing Our • Returns exceeding cost of capital within 3 years Acquisitions • Amount excludes $56M purchase of non-controlling interest of AgSense and Convert Italia • Opportunistic approach, supported by FCF $20 Share $18 • Halted all repurchases as of March 26, 2020 $16 Repurchases • $184M remains on current authorization as of 06/27/20 • 20% dividend increase announced February 2020 Shareholders Dividends • Payout ratio target: 15% of earnings Capital Acquisitions Share Dividends ReturningCash to • Current payout: 21% Expenditures Repurchases 16 | July 23, 2020 | Valmont Industries, Inc. | 2Q 2020 Earnings Presentation

Strong Balance Sheet and Liquidity to Endure COVID-19 Uncertainty AS OF JUNE 27, 2020 Cash ~$353.0M Available Credit under Revolving Credit Facility2 $545.0M Total Debt (Long-Term) $795.4M Cash ~$353.0M Shareholders’ Equity $1,126.8M Total Available Liquidity ~$878.0M Total Debt to Adj. EBITDA1 2.3x Net Debt to Adj. EBITDA1 1.3x ► Long-term debt of $795.4M, mostly fixed-rate, with long-dated maturities to 2044 and 2054 ► Capital allocation strategy has not changed, and the primary focus is to maintain liquidity to support operations and maintain investment grade credit rating − 2020E CapEx recalibrated from $100M - $125M to $80M - $90M − FCF expected to be positive due to stable costs of energy and raw material, possibly offset by lower revenue − Share repurchases halted out of an abundance of caution to preserve financial liquidity until COVID-19 impact is clear − Proactively drew down $75.0M of $600.0M revolving credit facility in early April; repaid in second quarter 1 See slide 35 for calculation of Adjusted EBITDA and Leverage Ratio. 2 $600M Total Revolver less borrowings and Standby LC”s of $55M. 17 | July 23, 2020 | Valmont Industries, Inc. | 2Q 2020 Earnings Presentation
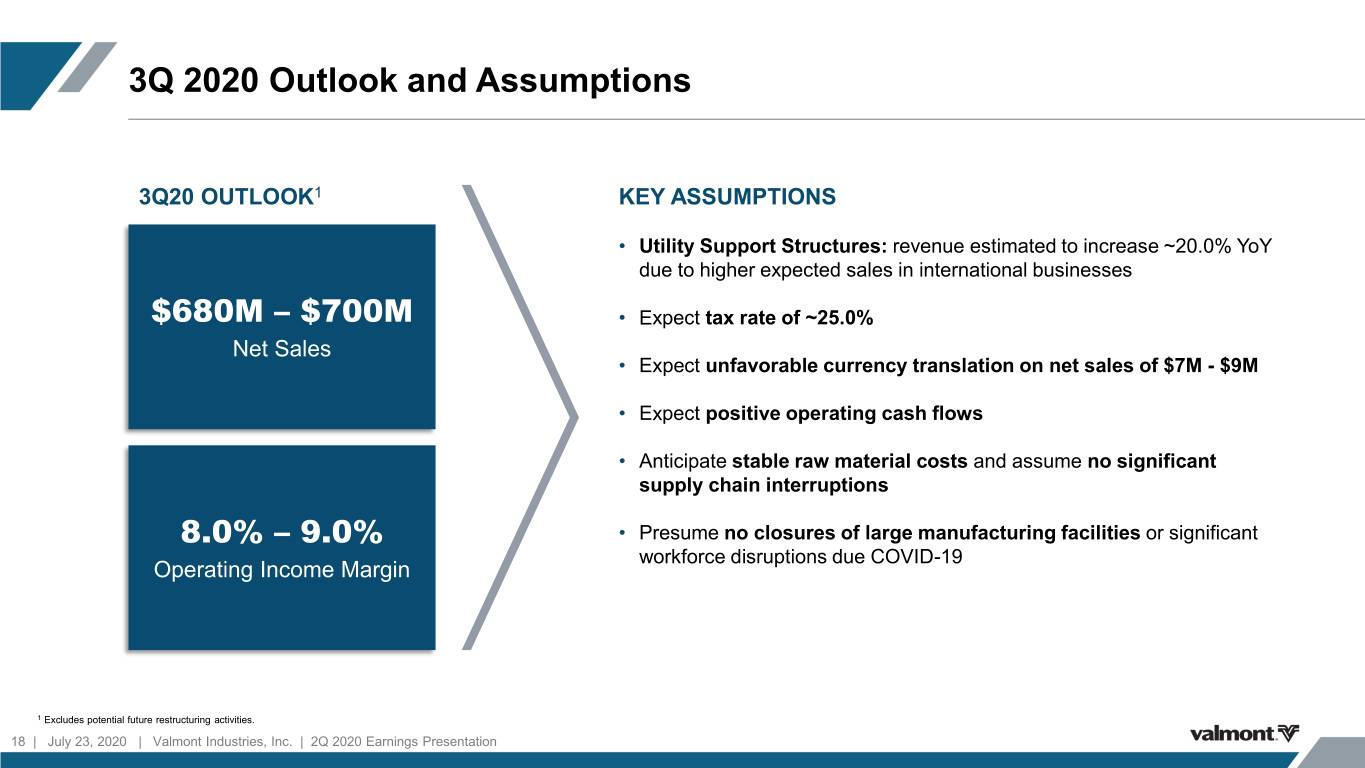
3Q 2020 Outlook and Assumptions 3Q20 OUTLOOK1 KEY ASSUMPTIONS • Utility Support Structures: revenue estimated to increase ~20.0% YoY due to higher expected sales in international businesses $680M – $700M • Expect tax rate of ~25.0% Net Sales • Expect unfavorable currency translation on net sales of $7M - $9M • Expect positive operating cash flows • Anticipate stable raw material costs and assume no significant supply chain interruptions 8.0% – 9.0% • Presume no closures of large manufacturing facilities or significant workforce disruptions due COVID-19 Operating Income Margin 1 Excludes potential future restructuring activities. 18 | July 23, 2020 | Valmont Industries, Inc. | 2Q 2020 Earnings Presentation
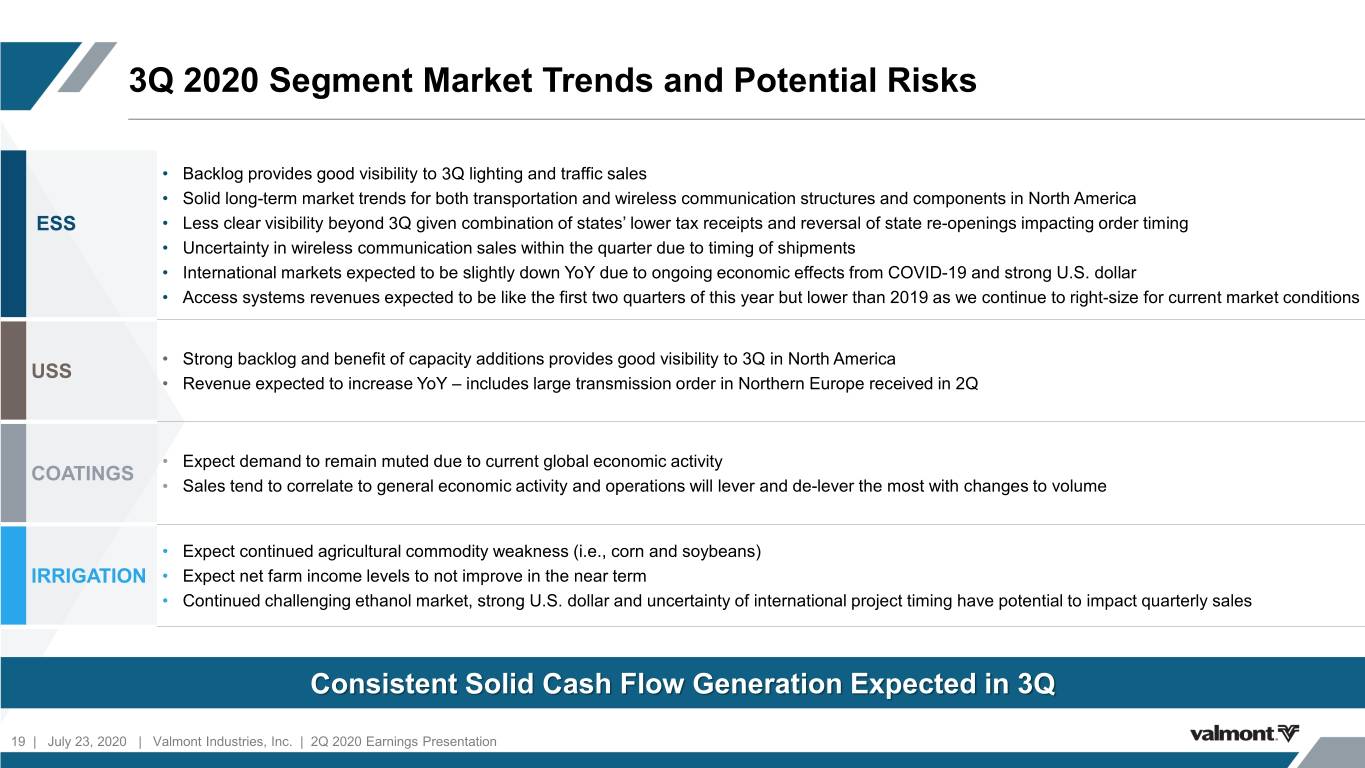
3Q 2020 Segment Market Trends and Potential Risks • Backlog provides good visibility to 3Q lighting and traffic sales • Solid long-term market trends for both transportation and wireless communication structures and components in North America ESS • Less clear visibility beyond 3Q given combination of states’ lower tax receipts and reversal of state re-openings impacting order timing • Uncertainty in wireless communication sales within the quarter due to timing of shipments • International markets expected to be slightly down YoY due to ongoing economic effects from COVID-19 and strong U.S. dollar • Access systems revenues expected to be like the first two quarters of this year but lower than 2019 as we continue to right-size for current market conditions • Strong backlog and benefit of capacity additions provides good visibility to 3Q in North America USS • Revenue expected to increase YoY – includes large transmission order in Northern Europe received in 2Q • Expect demand to remain muted due to current global economic activity COATINGS • Sales tend to correlate to general economic activity and operations will lever and de-lever the most with changes to volume • Expect continued agricultural commodity weakness (i.e., corn and soybeans) IRRIGATION • Expect net farm income levels to not improve in the near term • Continued challenging ethanol market, strong U.S. dollar and uncertainty of international project timing have potential to impact quarterly sales Consistent Solid Cash Flow Generation Expected in 3Q 19 | July 23, 2020 | Valmont Industries, Inc. | 2Q 2020 Earnings Presentation
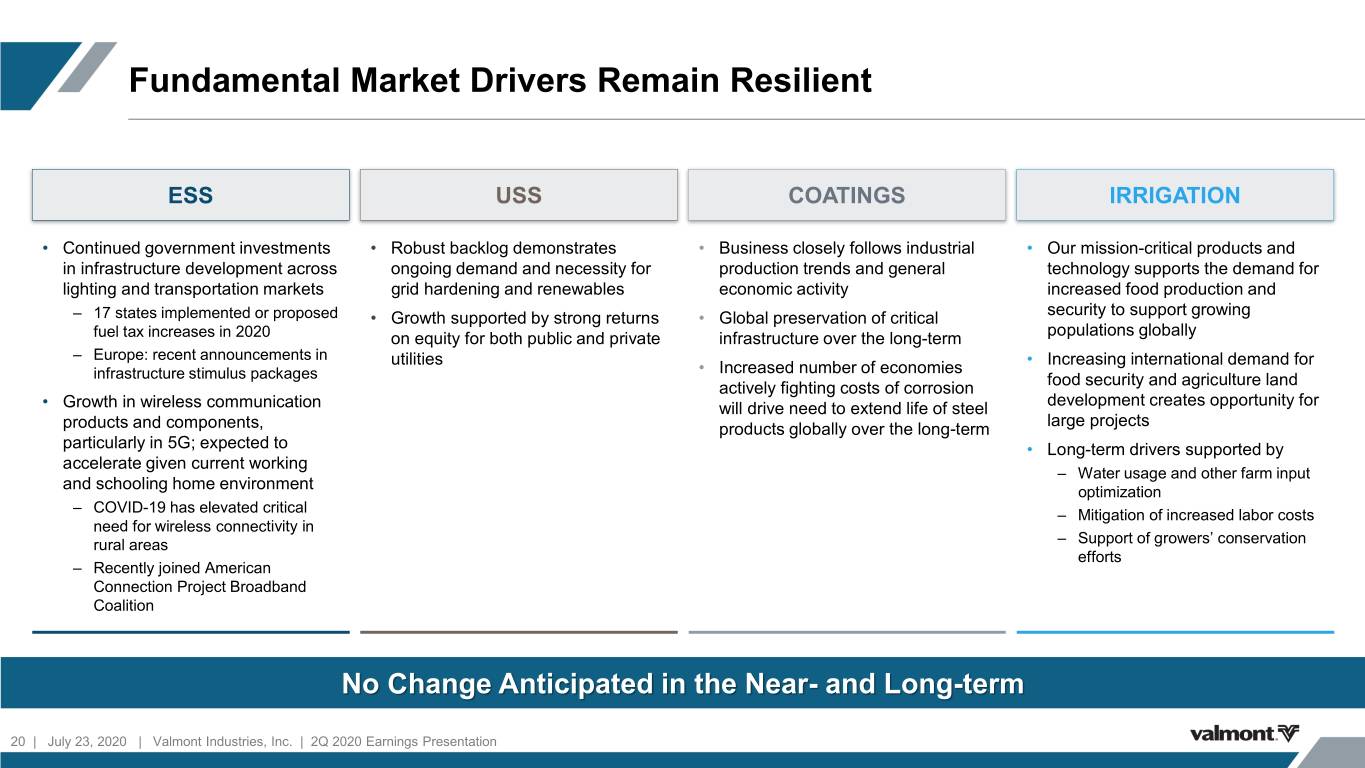
Fundamental Market Drivers Remain Resilient ESS USS COATINGS IRRIGATION • Continued government investments • Robust backlog demonstrates • Business closely follows industrial • Our mission-critical products and in infrastructure development across ongoing demand and necessity for production trends and general technology supports the demand for lighting and transportation markets grid hardening and renewables economic activity increased food production and ‒ 17 states implemented or proposed • Growth supported by strong returns • Global preservation of critical security to support growing fuel tax increases in 2020 on equity for both public and private infrastructure over the long-term populations globally ‒ Europe: recent announcements in utilities • Increasing international demand for infrastructure stimulus packages • Increased number of economies actively fighting costs of corrosion food security and agriculture land • Growth in wireless communication will drive need to extend life of steel development creates opportunity for products and components, products globally over the long-term large projects particularly in 5G; expected to • Long-term drivers supported by accelerate given current working ‒ Water usage and other farm input and schooling home environment optimization ‒ COVID-19 has elevated critical ‒ Mitigation of increased labor costs need for wireless connectivity in rural areas ‒ Support of growers’ conservation efforts ‒ Recently joined American Connection Project Broadband Coalition No Change Anticipated in the Near- and Long-term 20 | July 23, 2020 | Valmont Industries, Inc. | 2Q 2020 Earnings Presentation
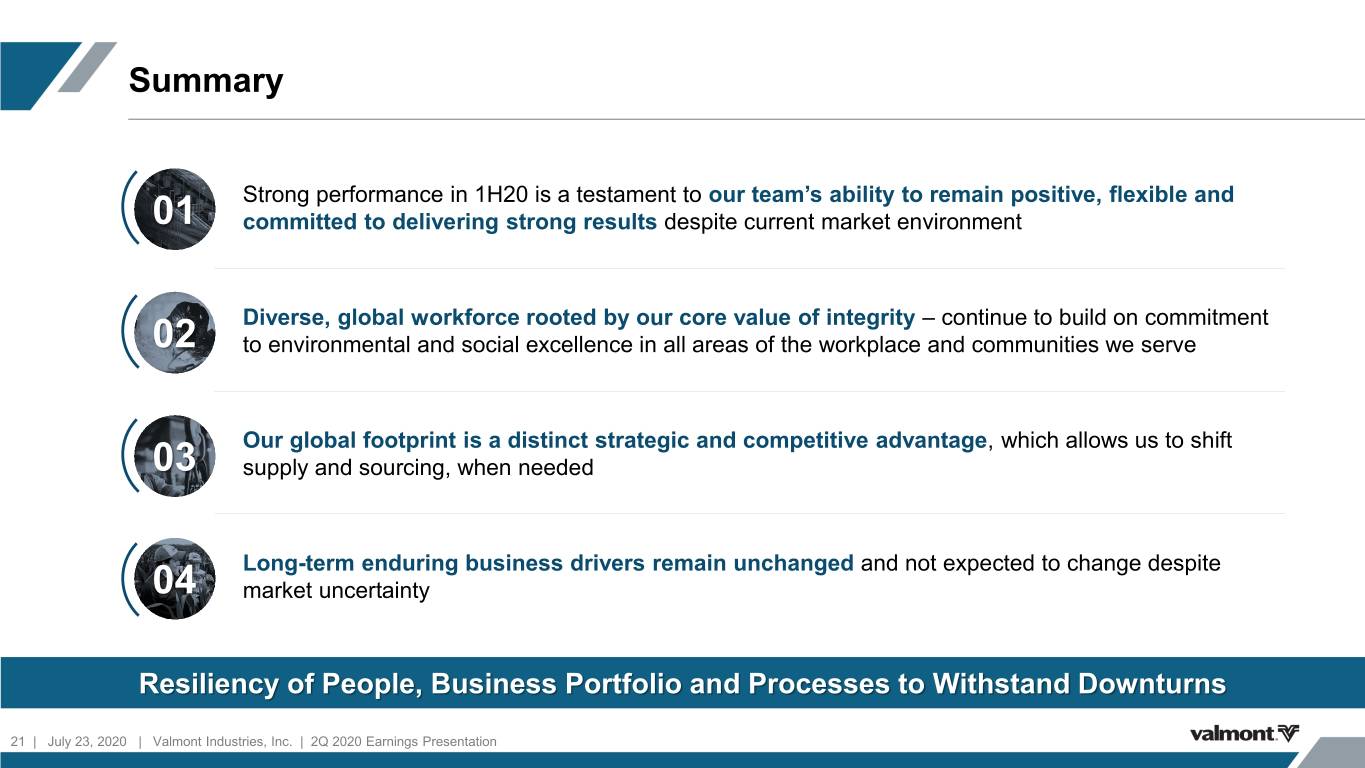
Summary Strong performance in 1H20 is a testament to our team’s ability to remain positive, flexible and 01 committed to delivering strong results despite current market environment Diverse, global workforce rooted by our core value of integrity – continue to build on commitment 02 to environmental and social excellence in all areas of the workplace and communities we serve Our global footprint is a distinct strategic and competitive advantage, which allows us to shift 03 supply and sourcing, when needed Long-term enduring business drivers remain unchanged and not expected to change despite 04 market uncertainty Resiliency of People, Business Portfolio and Processes to Withstand Downturns 21 | July 23, 2020 | Valmont Industries, Inc. | 2Q 2020 Earnings Presentation

Q&A 22 | July 23, 2020 | Valmont Industries, Inc. | 2Q 2020 Earnings Presentation

APPENDIX 23 | July 23, 2020 | Valmont Industries, Inc. | 2Q 2020 Earnings Presentation
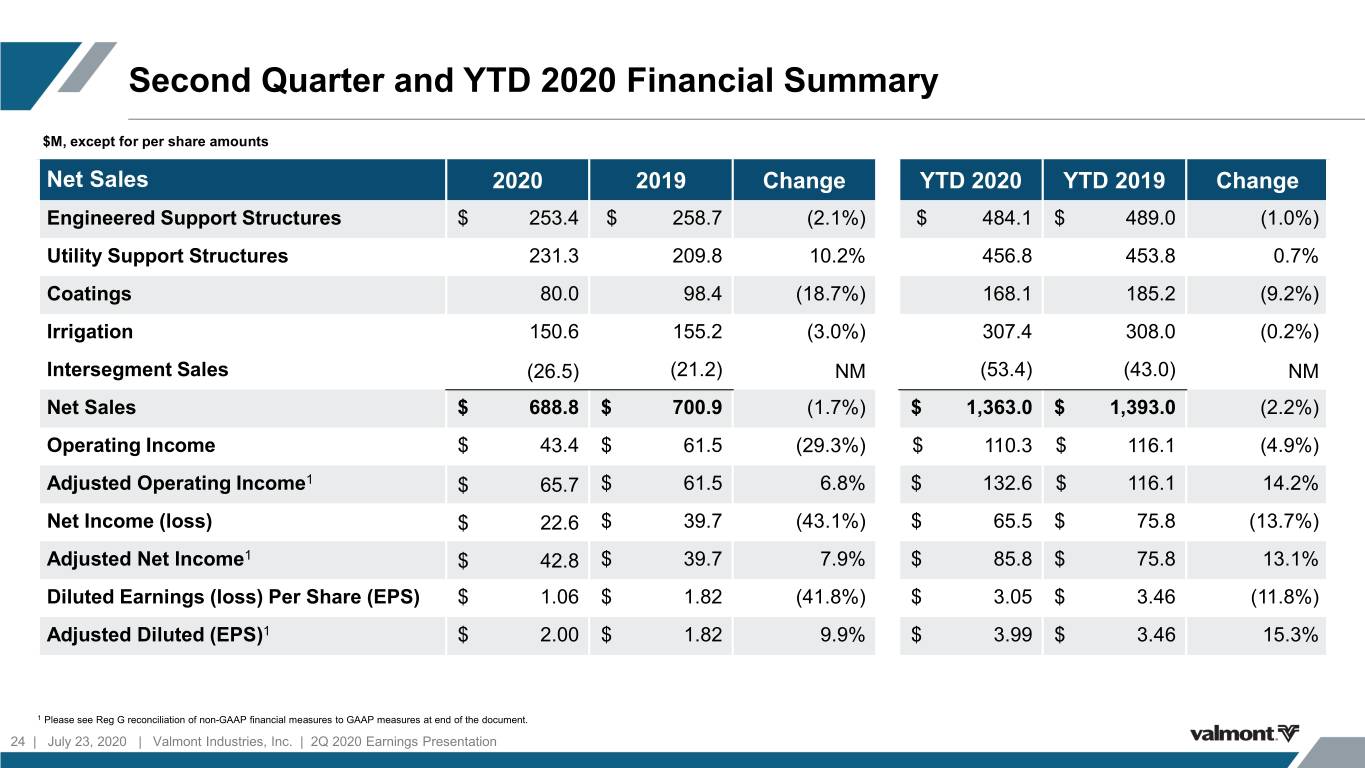
Second Quarter and YTD 2020 Financial Summary $M, except for per share amounts Net Sales 2020 2019 Change YTD 2020 YTD 2019 Change Engineered Support Structures $ 253.4 $ 258.7 (2.1%) $ 484.1 $ 489.0 (1.0%) Utility Support Structures 231.3 209.8 10.2% 456.8 453.8 0.7% Coatings 80.0 98.4 (18.7%) 168.1 185.2 (9.2%) Irrigation 150.6 155.2 (3.0%) 307.4 308.0 (0.2%) Intersegment Sales (26.5) (21.2) NM (53.4) (43.0) NM Net Sales $ 688.8 $ 700.9 (1.7%) $ 1,363.0 $ 1,393.0 (2.2%) Operating Income $ 43.4 $ 61.5 (29.3%) $ 110.3 $ 116.1 (4.9%) Adjusted Operating Income1 $ 65.7 $ 61.5 6.8% $ 132.6 $ 116.1 14.2% Net Income (loss) $ 22.6 $ 39.7 (43.1%) $ 65.5 $ 75.8 (13.7%) Adjusted Net Income1 $ 42.8 $ 39.7 7.9% $ 85.8 $ 75.8 13.1% Diluted Earnings (loss) Per Share (EPS) $ 1.06 $ 1.82 (41.8%) $ 3.05 $ 3.46 (11.8%) Adjusted Diluted (EPS)1 $ 2.00 $ 1.82 9.9% $ 3.99 $ 3.46 15.3% 1 Please see Reg G reconciliation of non-GAAP financial measures to GAAP measures at end of the document. 24 | July 23, 2020 | Valmont Industries, Inc. | 2Q 2020 Earnings Presentation
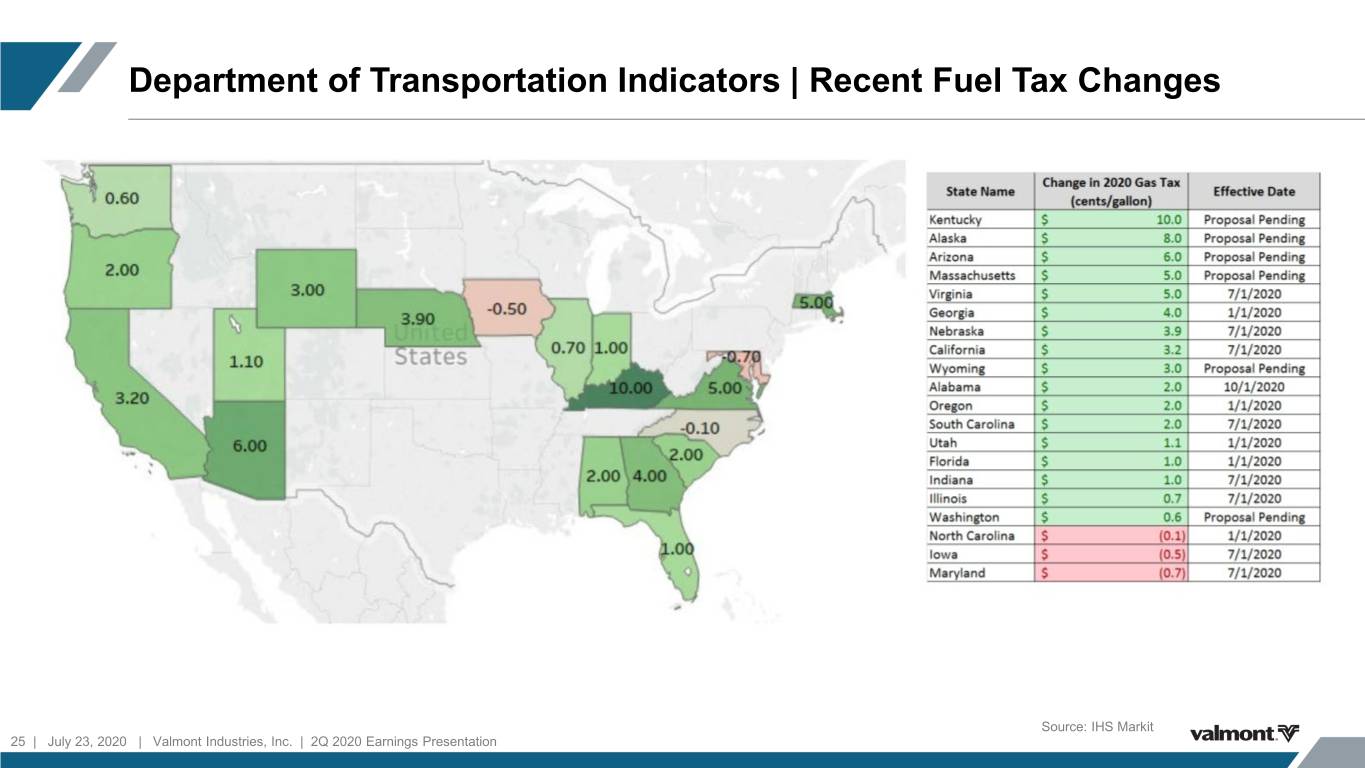
Department of Transportation Indicators | Recent Fuel Tax Changes Source: IHS Markit 25 | July 23, 2020 | Valmont Industries, Inc. | 2Q 2020 Earnings Presentation
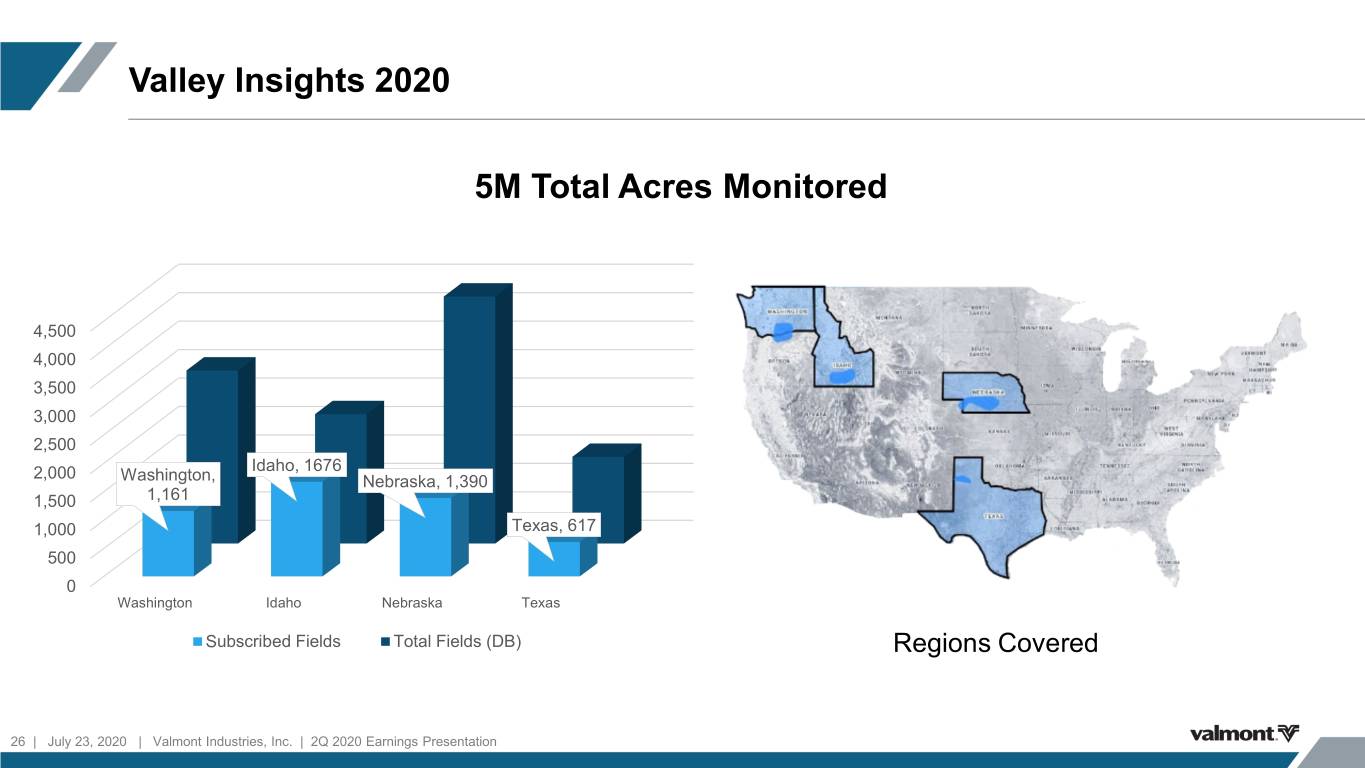
Valley Insights 2020 5M Total Acres Monitored 4,500 4,000 3,500 3,000 2,500 2,000 Idaho, 1676 Washington, Nebraska, 1,390 1,500 1,161 1,000 Texas, 617 500 0 Washington Idaho Nebraska Texas Subscribed Fields Total Fields (DB) Regions Covered 26 | July 23, 2020 | Valmont Industries, Inc. | 2Q 2020 Earnings Presentation
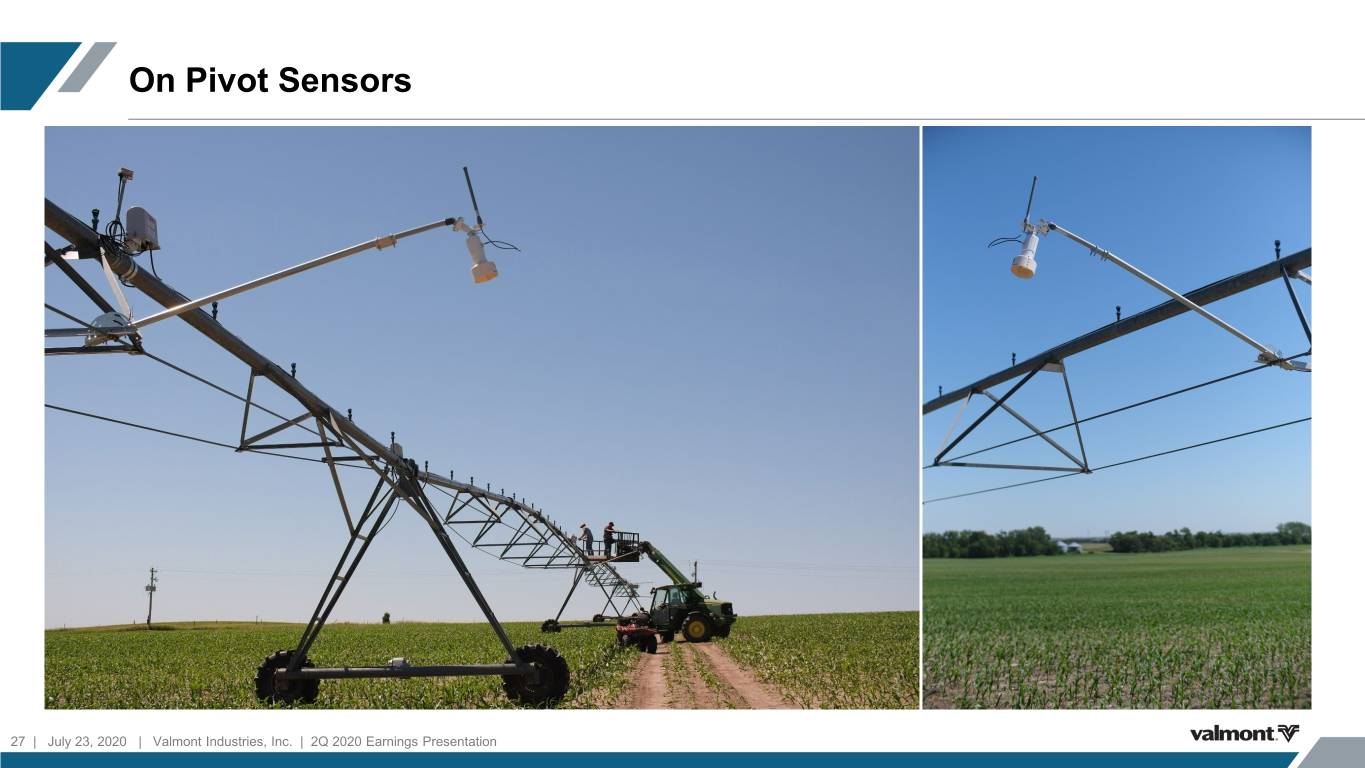
On Pivot Sensors 27 | July 23, 2020 | Valmont Industries, Inc. | 2Q 2020 Earnings Presentation
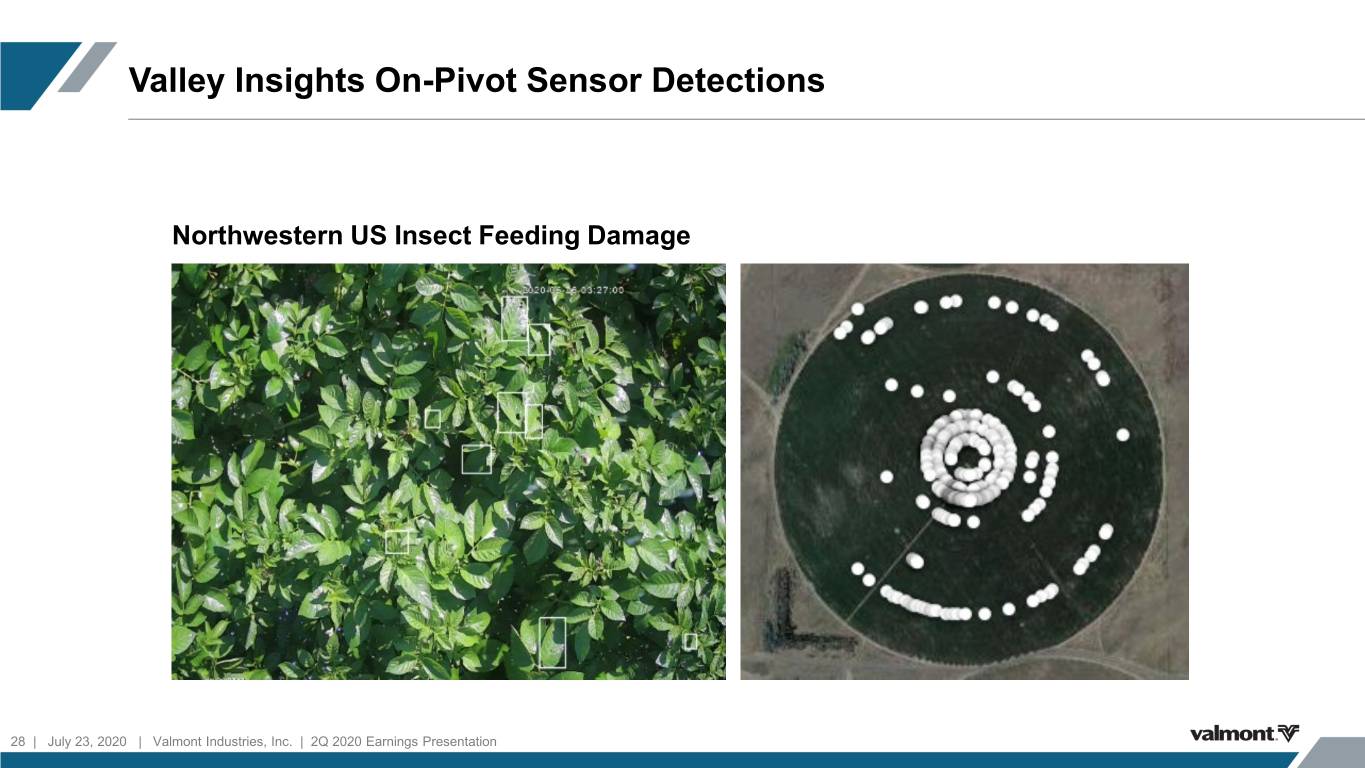
Valley Insights On-Pivot Sensor Detections Northwestern US Insect Feeding Damage 28 | July 23, 2020 | Valmont Industries, Inc. | 2Q 2020 Earnings Presentation
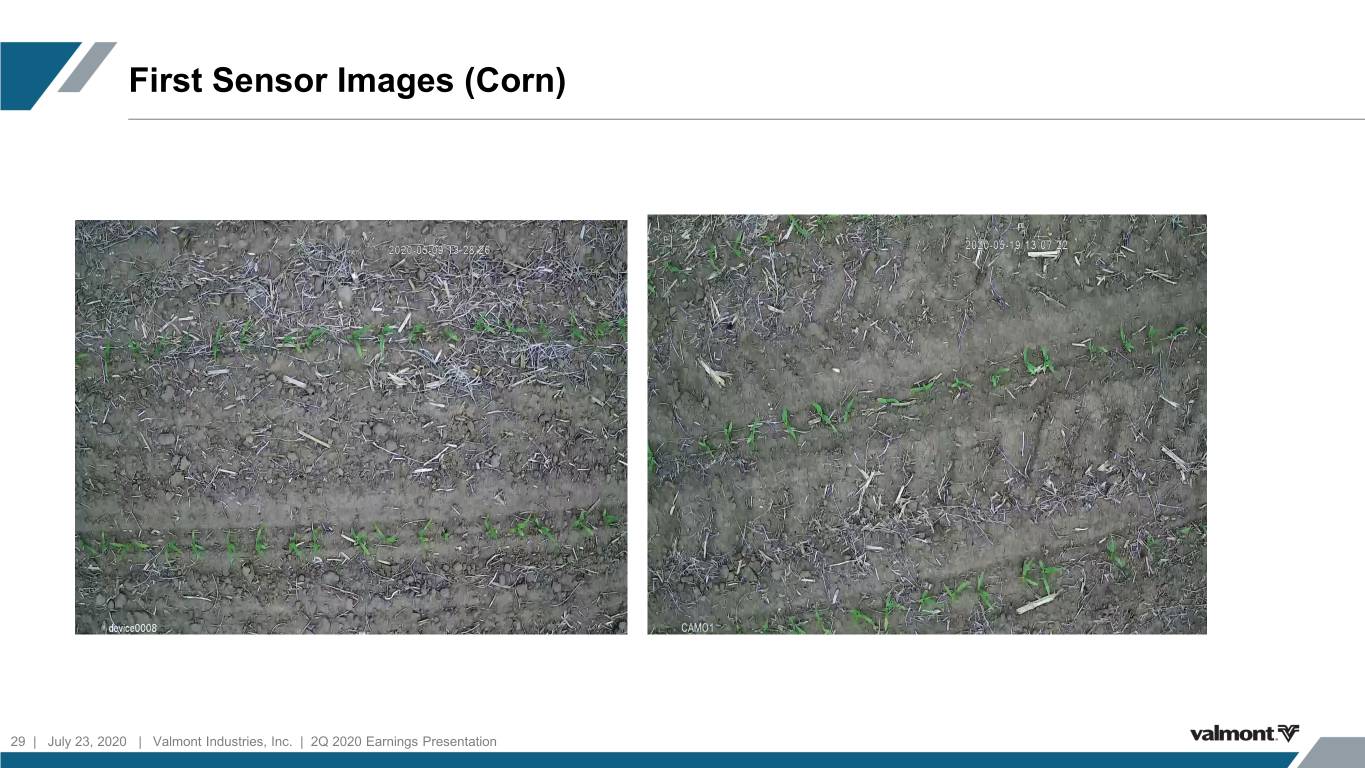
First Sensor Images (Corn) 29 | July 23, 2020 | Valmont Industries, Inc. | 2Q 2020 Earnings Presentation
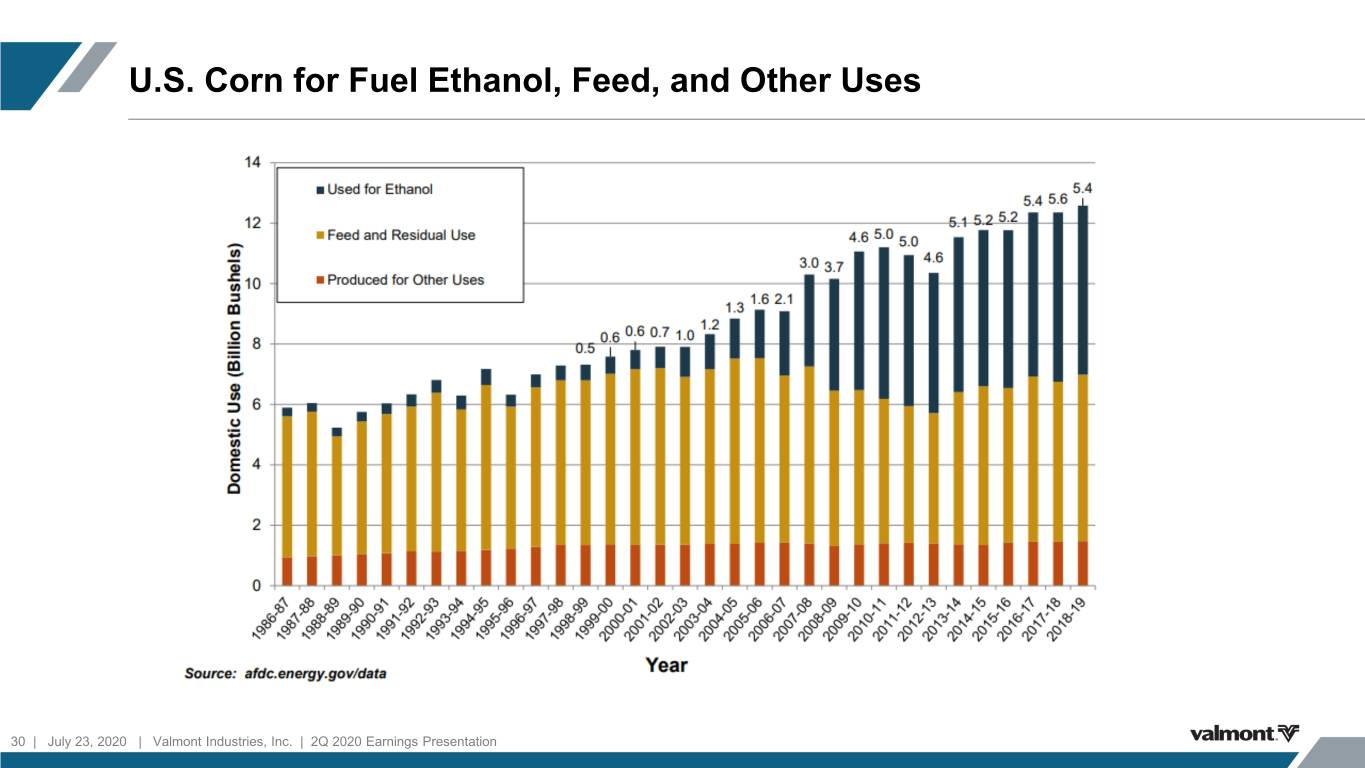
U.S. Corn for Fuel Ethanol, Feed, and Other Uses 30 | July 23, 2020 | Valmont Industries, Inc. | 2Q 2020 Earnings Presentation

U.S. Net Cash Farm Income by Year 31 | July 23, 2020 | Valmont Industries, Inc. | 2Q 2020 Earnings Presentation
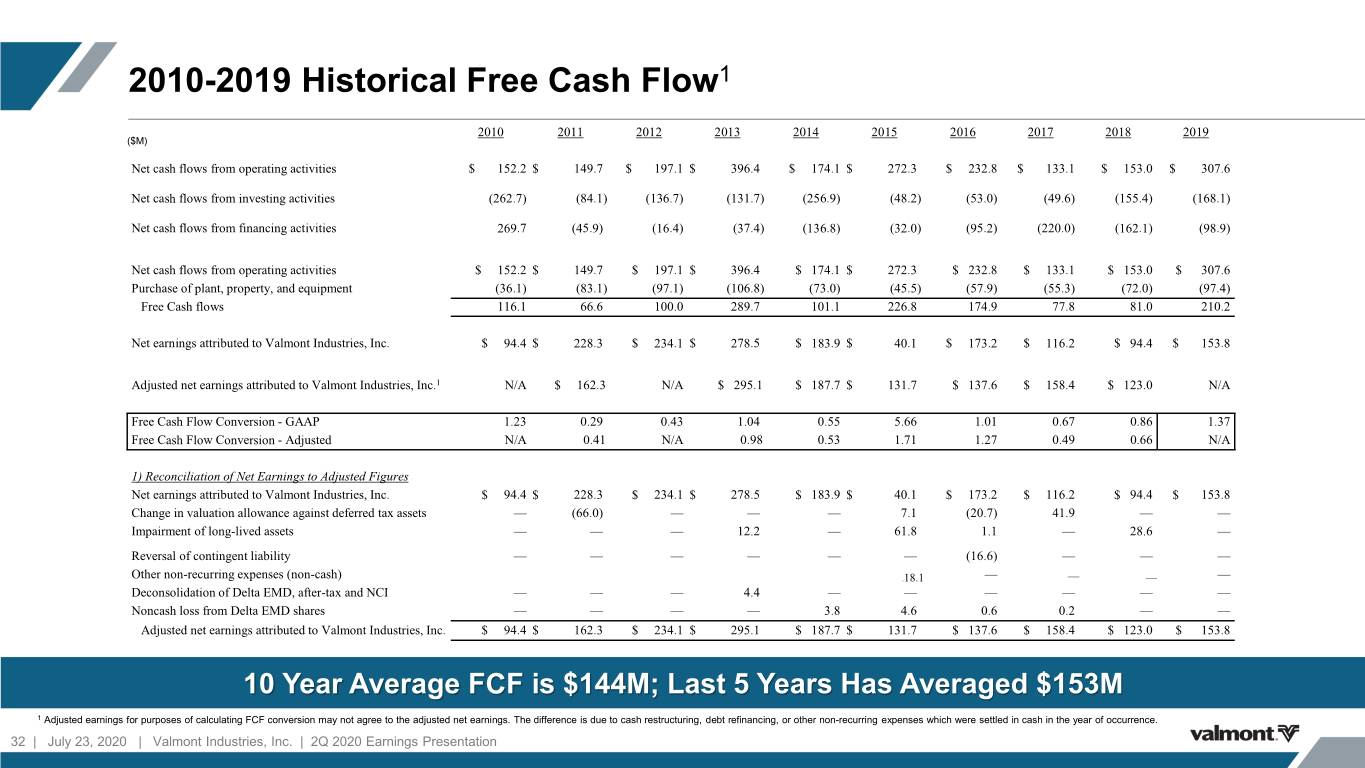
2010-2019 Historical Free Cash Flow1 2010 2011 2012 2013 2014 2015 2016 2017 2018 2019 ($M) Net cash flows from operating activities $ 152.2 $ 149.7 $ 197.1 $ 396.4 $ 174.1 $ 272.3 $ 232.8 $ 133.1 $ 153.0 $ 307.6 Net cash flows from investing activities (262.7) (84.1) (136.7) (131.7) (256.9) (48.2) (53.0) (49.6) (155.4) (168.1) Net cash flows from financing activities 269.7 (45.9) (16.4) (37.4) (136.8) (32.0) (95.2) (220.0) (162.1) (98.9) Net cash flows from operating activities $ 152.2 $ 149.7 $ 197.1 $ 396.4 $ 174.1 $ 272.3 $ 232.8 $ 133.1 $ 153.0 $ 307.6 Purchase of plant, property, and equipment (36.1) (83.1) (97.1) (106.8) (73.0) (45.5) (57.9) (55.3) (72.0) (97.4) Free Cash flows 116.1 66.6 100.0 289.7 101.1 226.8 174.9 77.8 81.0 210.2 Net earnings attributed to Valmont Industries, Inc. $ 94.4 $ 228.3 $ 234.1 $ 278.5 $ 183.9 $ 40.1 $ 173.2 $ 116.2 $ 94.4 $ 153.8 Adjusted net earnings attributed to Valmont Industries, Inc.1 N/A $ 162.3 N/A $ 295.1 $ 187.7 $ 131.7 $ 137.6 $ 158.4 $ 123.0 N/A Free Cash Flow Conversion - GAAP 1.23 0.29 0.43 1.04 0.55 5.66 1.01 0.67 0.86 1.37 Free Cash Flow Conversion - Adjusted N/A 0.41 N/A 0.98 0.53 1.71 1.27 0.49 0.66 N/A 1) Reconciliation of Net Earnings to Adjusted Figures Net earnings attributed to Valmont Industries, Inc. $ 94.4 $ 228.3 $ 234.1 $ 278.5 $ 183.9 $ 40.1 $ 173.2 $ 116.2 $ 94.4 $ 153.8 Change in valuation allowance against deferred tax assets — (66.0) — — — 7.1 (20.7) 41.9 — — Impairment of long-lived assets — — — 12.2 — 61.8 1.1 — 28.6 — Reversal of contingent liability — — — — — — (16.6) — — — Other non-recurring expenses (non-cash) 18.18.1 — — — — Deconsolidation of Delta EMD, after-tax and NCI — — — 4.4 — — — — — — Noncash loss from Delta EMD shares — — — — 3.8 4.6 0.6 0.2 — — Adjusted net earnings attributed to Valmont Industries, Inc. $ 94.4 $ 162.3 $ 234.1 $ 295.1 $ 187.7 $ 131.7 $ 137.6 $ 158.4 $ 123.0 $ 153.8 10 Year Average FCF is $144M; Last 5 Years Has Averaged $153M 1 Adjusted earnings for purposes of calculating FCF conversion may not agree to the adjusted net earnings. The difference is due to cash restructuring, debt refinancing, or other non-recurring expenses which were settled in cash in the year of occurrence. 32 | July 23, 2020 | Valmont Industries, Inc. | 2Q 2020 Earnings Presentation
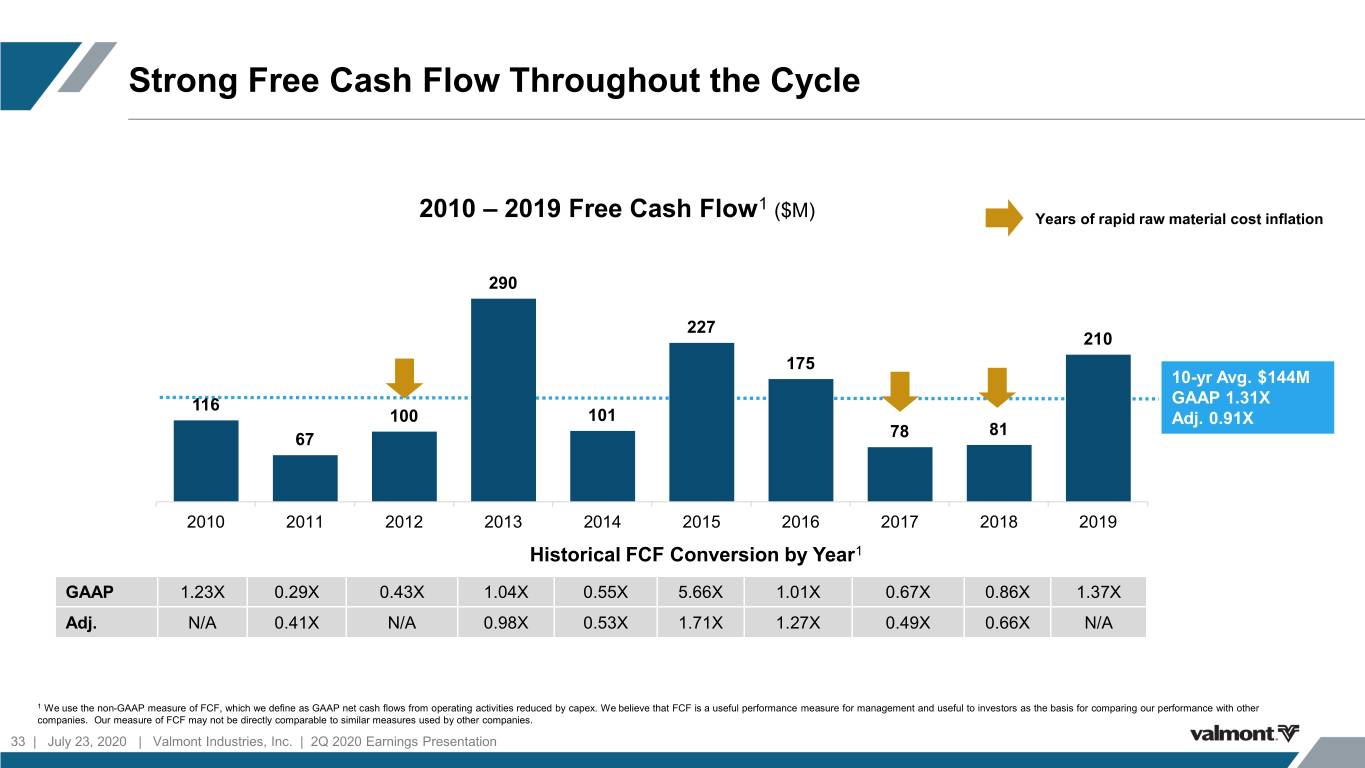
Strong Free Cash Flow Throughout the Cycle 1 2010 – 2019 Free Cash Flow ($M) Years of rapid raw material cost inflation 290 227 210 175 10-yr Avg. $144M 116 GAAP 1.31X 100 101 Adj. 0.91X 81 67 78 2010 2011 2012 2013 2014 2015 2016 2017 2018 2019 Historical FCF Conversion by Year1 GAAP 1.23X 0.29X 0.43X 1.04X 0.55X 5.66X 1.01X 0.67X 0.86X 1.37X Adj. N/A 0.41X N/A 0.98X 0.53X 1.71X 1.27X 0.49X 0.66X N/A 1 We use the non-GAAP measure of FCF, which we define as GAAP net cash flows from operating activities reduced by capex. We believe that FCF is a useful performance measure for management and useful to investors as the basis for comparing our performance with other companies. Our measure of FCF may not be directly comparable to similar measures used by other companies. 33 | July 23, 2020 | Valmont Industries, Inc. | 2Q 2020 Earnings Presentation
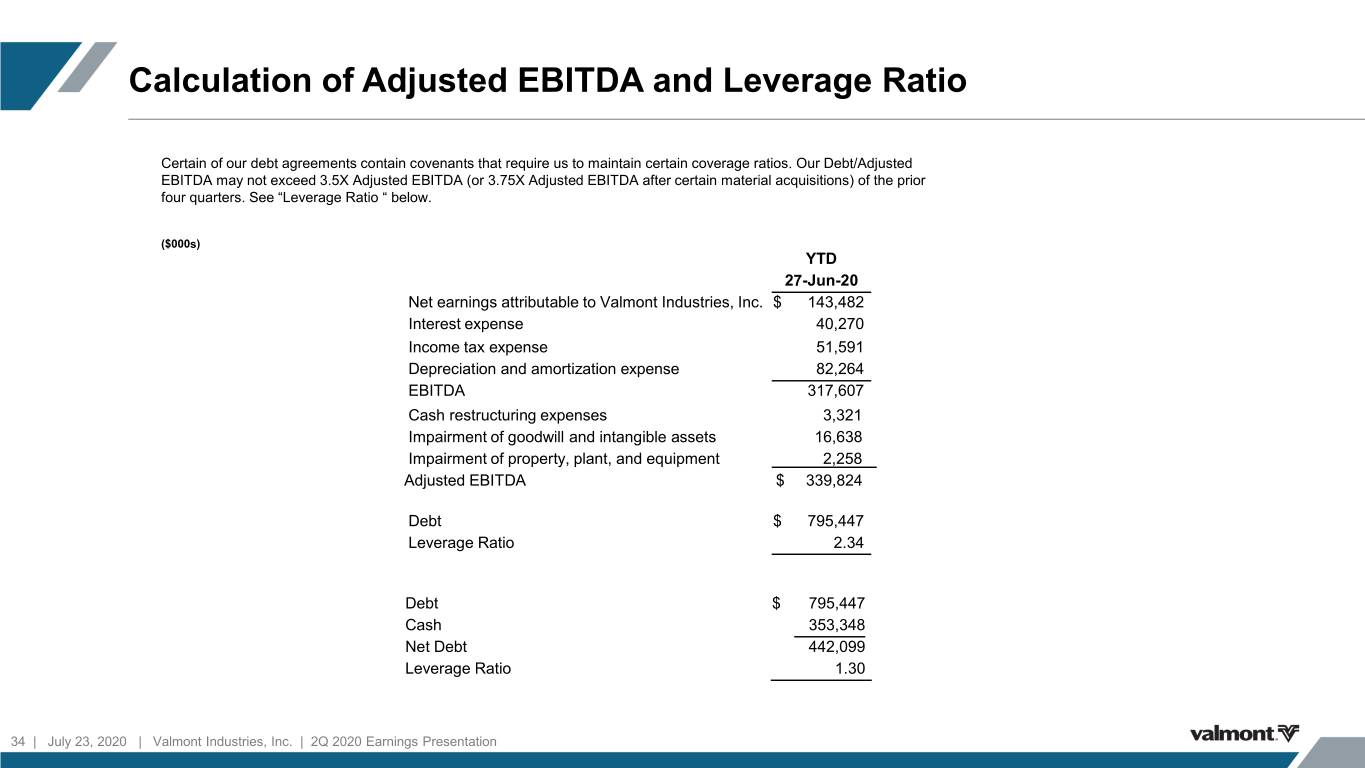
Calculation of Adjusted EBITDA and Leverage Ratio Certain of our debt agreements contain covenants that require us to maintain certain coverage ratios. Our Debt/Adjusted EBITDA may not exceed 3.5X Adjusted EBITDA (or 3.75X Adjusted EBITDA after certain material acquisitions) of the prior four quarters. See “Leverage Ratio “ below. ($000s) YTD 27-Jun-20 Net earnings attributable to Valmont Industries, Inc. $ 143,482 Interest expense 40,270 Income tax expense 51,591 Depreciation and amortization expense 82,264 EBITDA 317,607 Cash restructuring expenses 3,321 Impairment of goodwill and intangible assets 16,638 Impairment of property, plant, and equipment 2,258 Adjusted EBITDA $ 339,824 Debt $ 795,447 Leverage Ratio 2.34 Debt $ 795,447 Cash 353,348 Net Debt 442,099 Leverage Ratio 1.30 34 | July 23, 2020 | Valmont Industries, Inc. | 2Q 2020 Earnings Presentation
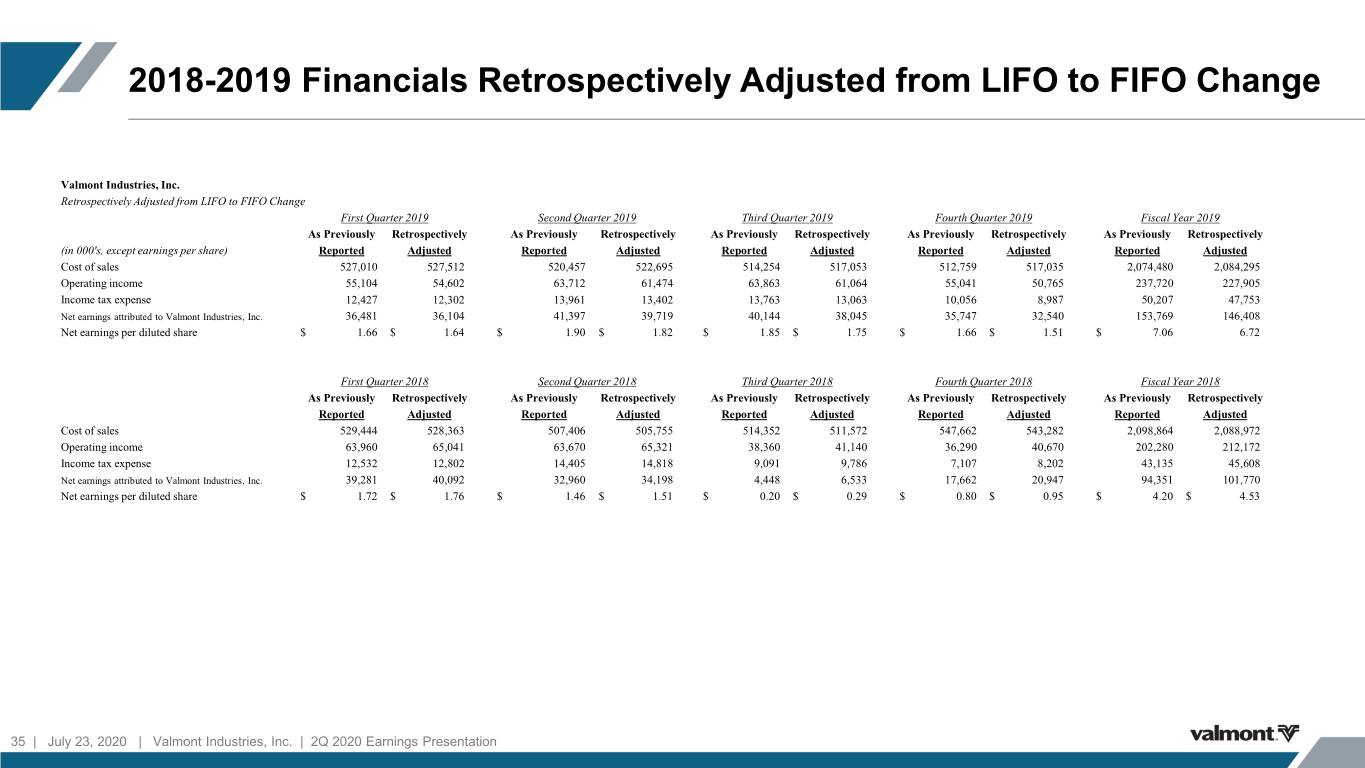
2018-2019 Financials Retrospectively Adjusted from LIFO to FIFO Change Valmont Industries, Inc. Retrospectively Adjusted from LIFO to FIFO Change First Quarter 2019 Second Quarter 2019 Third Quarter 2019 Fourth Quarter 2019 Fiscal Year 2019 As Previously Retrospectively As Previously Retrospectively As Previously Retrospectively As Previously Retrospectively As Previously Retrospectively (in 000's, except earnings per share) Reported Adjusted Reported Adjusted Reported Adjusted Reported Adjusted Reported Adjusted Cost of sales 527,010 527,512 520,457 522,695 514,254 517,053 512,759 517,035 2,074,480 2,084,295 Operating income 55,104 54,602 63,712 61,474 63,863 61,064 55,041 50,765 237,720 227,905 Income tax expense 12,427 12,302 13,961 13,402 13,763 13,063 10,056 8,987 50,207 47,753 Net earnings attributed to Valmont Industries, Inc. 36,481 36,104 41,397 39,719 40,144 38,045 35,747 32,540 153,769 146,408 Net earnings per diluted share $ 1.66 $ 1.64 $ 1.90 $ 1.82 $ 1.85 $ 1.75 $ 1.66 $ 1.51 $ 7.06 6.72 First Quarter 2018 Second Quarter 2018 Third Quarter 2018 Fourth Quarter 2018 Fiscal Year 2018 As Previously Retrospectively As Previously Retrospectively As Previously Retrospectively As Previously Retrospectively As Previously Retrospectively Reported Adjusted Reported Adjusted Reported Adjusted Reported Adjusted Reported Adjusted Cost of sales 529,444 528,363 507,406 505,755 514,352 511,572 547,662 543,282 2,098,864 2,088,972 Operating income 63,960 65,041 63,670 65,321 38,360 41,140 36,290 40,670 202,280 212,172 Income tax expense 12,532 12,802 14,405 14,818 9,091 9,786 7,107 8,202 43,135 45,608 Net earnings attributed to Valmont Industries, Inc. 39,281 40,092 32,960 34,198 4,448 6,533 17,662 20,947 94,351 101,770 Net earnings per diluted share $ 1.72 $ 1.76 $ 1.46 $ 1.51 $ 0.20 $ 0.29 $ 0.80 $ 0.95 $ 4.20 $ 4.53 35 | July 23, 2020 | Valmont Industries, Inc. | 2Q 2020 Earnings Presentation

Summary of Effect of Significant Non-Recurring Items on Reported Results ($000s) 36 | July 23, 2020 | Valmont Industries, Inc. | 2Q 2020 Earnings Presentation
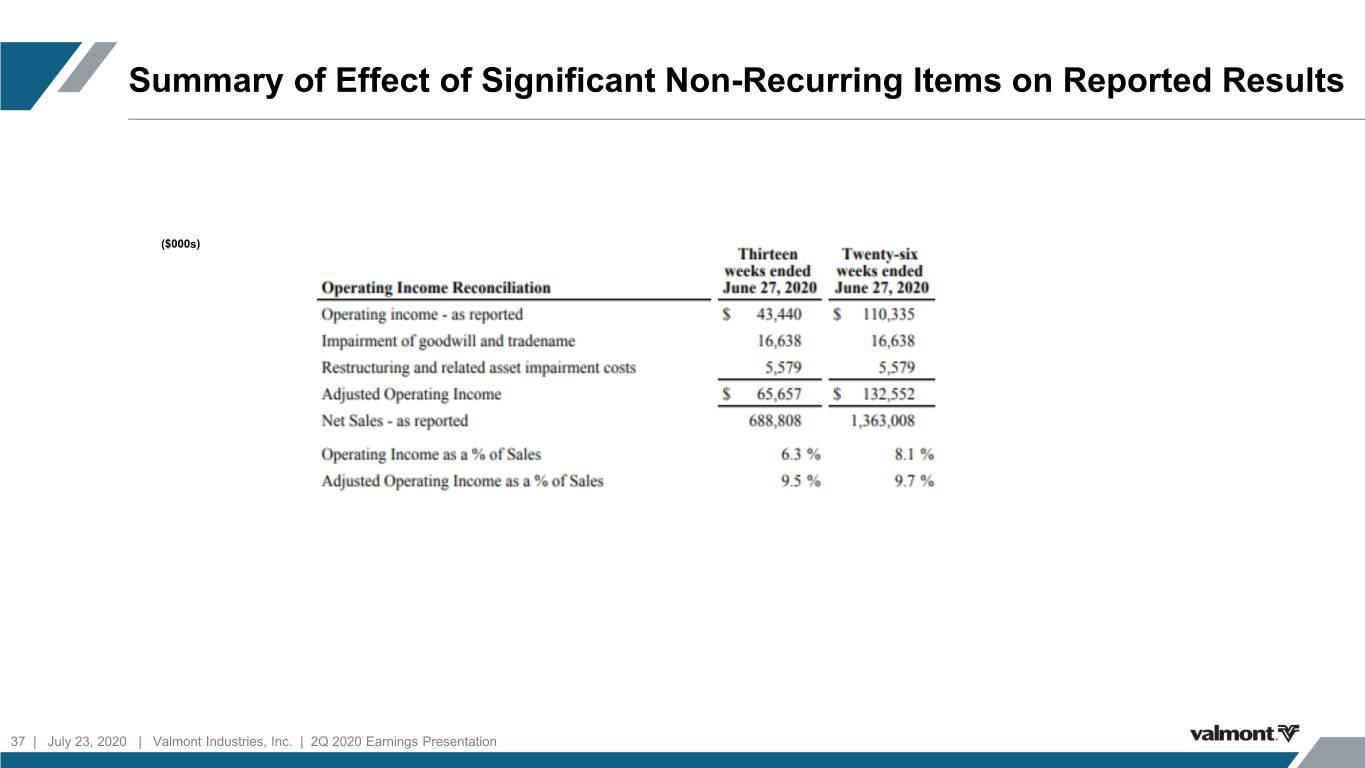
Summary of Effect of Significant Non-Recurring Items on Reported Results ($000s) 37 | July 23, 2020 | Valmont Industries, Inc. | 2Q 2020 Earnings Presentation

Summary of Effect of Significant Non-Recurring Items on Reported Results Engineered Support Structures • $16.6M pre-tax non-cash goodwill and ($000s) tradename impairment • Severance and cash restructuring expenses to exit product lines within access system Utility Support Structures • Severance and cash restructuring expenses to exit a product line within Offshore Wind • An asset impairment charge for a steel utility facility that is held-for-sale Coatings • Severance to close a small galvanizing site in North America 38 | July 23, 2020 | Valmont Industries, Inc. | 2Q 2020 Earnings Presentation
