Attached files
| file | filename |
|---|---|
| EX-99.1 - PRESS RELEASE - Midland States Bancorp, Inc. | exh_991.htm |
| 8-K - FORM 8-K - Midland States Bancorp, Inc. | f8k_072320.htm |
Exhibit 99.2

1 Midland States Bancorp, Inc. NASDAQ: MSBI Second Quarter 2020 Earnings Call

2 Forward - Looking Statements. This presentation may contain forward - looking statements within the meaning of the federal securities laws. Forward - looking statements expressing management’s current expectations, forecasts of future events or long - te rm goals may be based upon beliefs, expectations and assumptions of Midland’s management, and are generally identifiable by the use of words such as “believe,” “expect,” “anticipate,” “plan,” “intend,” “estimate,” “may,” “will,” “would,” “could,” “should” o r o ther similar expressions. All statements in this presentation speak only as of the date they are made, and Midland undertakes no obligation to update any statement. A number of factors, many of which are beyond the ability of Midland to control or predic t, could cause actual results to differ materially from those in its forward - looking statements including the effects of the Corona virus Disease 2019 (COVID - 19) pandemic, including its potential effects on the economic environment, our customers and our operations, as well as any changes to federal, state or local government laws, regulations or orders in connection with the pandemic. These risks and uncertainties should be considered in evaluating forward - looking statements, and undue reliance should not be placed o n such statements. Additional information concerning Midland and its businesses, including additional factors that could materi all y affect Midland’s financial results, are included in Midland’s filings with the Securities and Exchange Commission. Use of Non - GAAP Financial Measures. This presentation may contain certain financial information determined by methods other than in accordance with accounting principles generally accepted in the United States (“GAAP”). These non - GAAP financial measure s include “Adjusted Earnings,” “Adjusted Diluted Earnings Per Share,” “Adjusted Return on Average Assets,” “Adjusted Return on Average Shareholders’ Equity,” “Adjusted Return on Average Tangible Common Equity,” “Efficiency Ratio,” “Tangible Common Equ ity to Tangible Assets,” “Tangible Book Value Per Share,” and “Return on Average Tangible Common Equity.” The Company believes th at these non - GAAP financial measures provide both management and investors a more complete understanding of the Company’s funding profile and profitability. These non - GAAP financial measures are supplemental and are not a substitute for any analysis based on GAAP financial measures. Not all companies use the same calculation of these measures; therefore this presentation m ay not be comparable to other similarly titled measures as presented by other companies. Reconciliations of these non - GAAP measures are provided in the Appendix section of this presentation.

3 Overview of 2Q20 3 Positive Trends Across Multiple Business Lines 2Q20 Earnings Continued Progress on Strategic Initiatives • Wealth management AUA increased due to improved market performance • Equipment financing group had record quarter of loan closings • Strong quarter of residential mortgage banking revenue driven by demand for refinancings • Commercial FHA loan originations and revenue increased significantly from prior quarter • Further improvement in deposit mix with significant growth in lower - cost categories • Efficiency ratio (1) improved to 58.5% from 63.8% in prior quarter Stable Asset Quality • Slight increase in nonperforming loans • Significant decline in new loan deferral requests with most existing modifications not expected to require a second deferral • Allowance for credit losses strengthened to 0.97% of total loans • Net income of $12.6 million, or $0.53 diluted EPS • 2Q20 results include a $0.4 million loss on residential MSRs held for sale and $54,000 in integration and acquisition expenses, impacting diluted EPS by $0.02 Notes: (1) Represents a non - GAAP financial measure. See “Non - GAAP Reconciliation” in the appendix. Strong Balance Sheet Growth • Loan growth of 10.6% from the end of the prior quarter • Deposit growth of 6.3% from the end of the prior quarter

4 Paycheck Protection Program Overview Paycheck Protection Program (as of 6/30/20) Total Loans Funded $313.1 million Number of Loans 2,311 Average Loan Size $135,482 Loans Outstanding $276.0 million Average Fee 3.5% Total Fees $9.7 million Impact on 2Q20 Financials At or for the Three Months Ended 6/30/20 Metrics Excluding PPP Impact Total Loans $4.84 billion $4.56 billion Average Loans $4.70 billion $4.46 billion Net Interest Income FTE (1) $49.4 million $48.0 million Net Interest Margin (1) 3.32% 3.35% ACL/Total Loans 0.97% 1.02% 1. Loan fees and deferred loan origination costs being amortized over an estimated 24 - month life of PPP loans
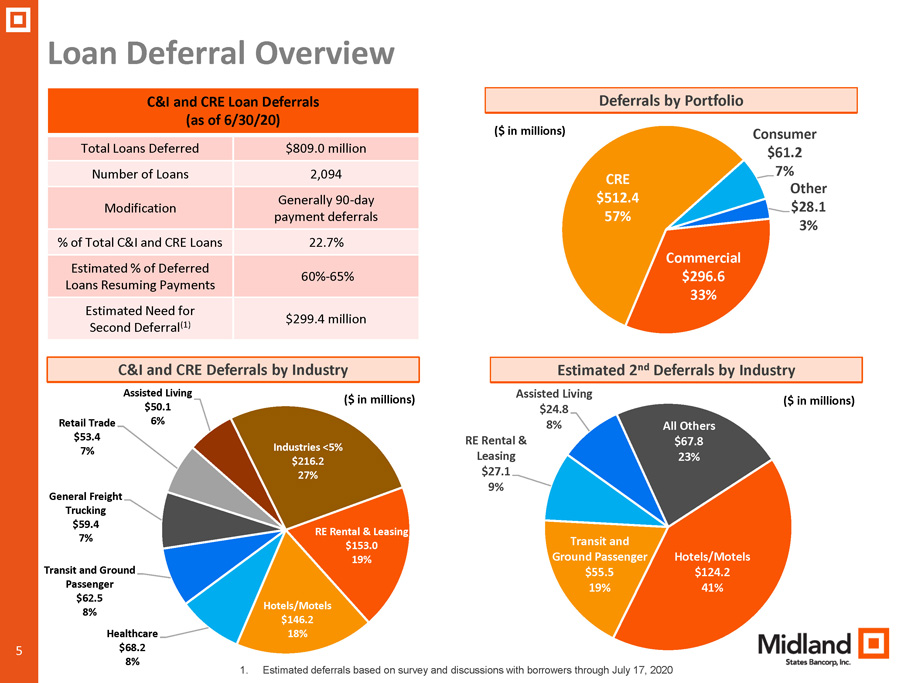
5 Loan Deferral Overview C&I and CRE Deferrals by Industry ($ in millions) Commercial $296.6 33% CRE $512.4 57% Consumer $61.2 7% Other $28.1 3% C&I and CRE Loan Deferrals (as of 6/30/20) Total Loans Deferred $809.0 million Number of Loans 2,094 Modification Generally 90 - day payment deferrals % of Total C&I and CRE Loans 22.7% Estimated % of Deferred Loans Resuming Payments 60% - 65% Estimated Need for Second Deferral (1) $299.4 million Deferrals by Portfolio RE Rental & Leasing $153.0 19% Hotels/Motels $146.2 18% Healthcare $68.2 8% Transit and Ground Passenger $62.5 8% General Freight Trucking $59.4 7% Retail Trade $53.4 7% Assisted Living $50.1 6% Industries <5% $216.2 27% ($ in millions) Estimated 2 nd Deferrals by Industry Hotels/Motels $124.2 41% Transit and Ground Passenger $55.5 19% RE Rental & Leasing $27.1 9% Assisted Living $24.8 8% All Others $67.8 23% ($ in millions) 1. Estimated deferrals based on survey and discussions with borrowers through July 17, 2020

6 2Q 2020 1Q 2020 2Q 2019 Commercial loans and leases $ 1,856 $ 1,439 $ 1,149 Commercial real estate 1,495 1,508 1,524 Construction and land development 208 208 250 Residential real estate 509 548 552 Consumer 771 673 597 Total Loans $ 4,839 $ 4,376 $ 4,074 Loan Portfolio Total Loans and Average Loan Yield • Total loans increased $463.2 million, or 10.6% from prior quarter, to $4.84 billion • Increase primarily attributable to growth in commercial and consumer portfolios; partially offset by declines in the commercial real estate and residential real estate portfolios • PPP loans contributed $276.0 million to loan growth • Equipment finance balances increased $78.2 million, or 11.6%, from March 31, 2020 • $104.8 million increase in warehouse credit line utilization by commercial FHA loan originator Loan Portfolio Mix (in millions, as of quarter - end) (in millions, as of quarter - end) $4,074 $4,329 $4,401 $4,376 $4,839 5.32% 5.31% 5.22% 5.01% 4.64% 2Q 2019 3Q 2019 4Q 2019 1Q 2020 2Q 2020 Total Loans Average Loan Yield
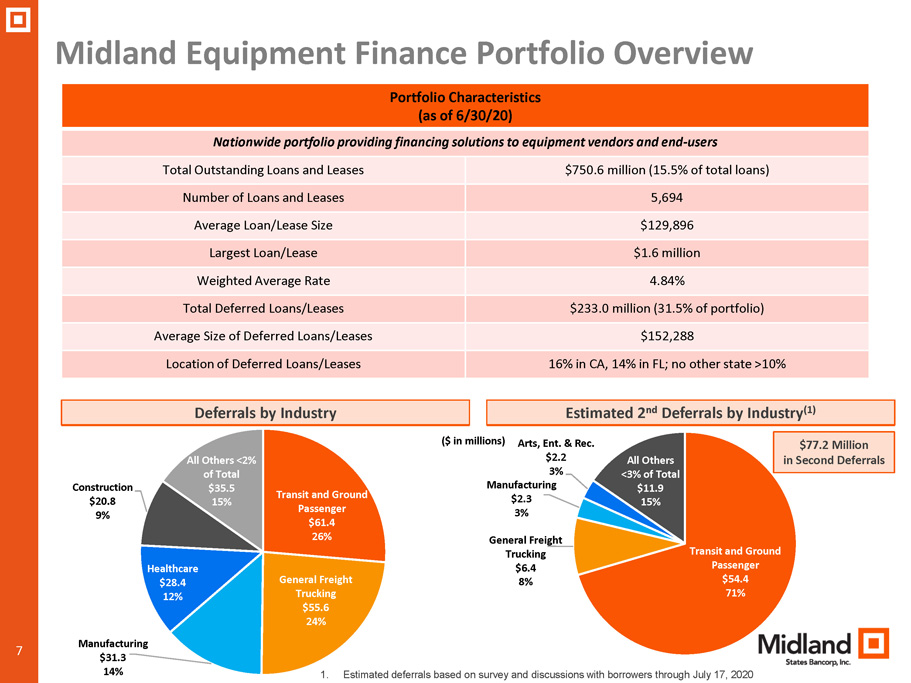
7 Midland Equipment Finance Portfolio Overview ($ in millions) Portfolio Characteristics (as of 6/30/20) Nationwide portfolio providing financing solutions to equipment vendors and end - users Total Outstanding Loans and Leases $750.6 million (15.5% of total loans) Number of Loans and Leases 5,694 Average Loan/Lease Size $129,896 Largest Loan/Lease $1.6 million Weighted Average Rate 4.84% Total Deferred Loans/Leases $233.0 million (31.5% of portfolio) Average Size of Deferred Loans/Leases $152,288 Location of Deferred Loans/Leases 16% in CA, 14% in FL; no other state >10% Estimated 2 nd Deferrals by Industry (1) Avg. FICO Score 604 Transit and Ground Passenger $61.4 26% General Freight Trucking $55.6 24% Manufacturing $31.3 14% Healthcare $28.4 12% Construction $20.8 9% All Others <2% of Total $35.5 15% Deferrals by Industry Transit and Ground Passenger $54.4 71% General Freight Trucking $6.4 8% Manufacturing $2.3 3% Arts, Ent. & Rec. $2.2 3% All Others <3% of Total $11.9 15% $77.2 Million in Second Deferrals 1. Estimated deferrals based on survey and discussions with borrowers through July 17, 2020

8 Hotel/Motel Portfolio Overview Estimated 2 nd Deferrals by Chain Scale ($ in millions) Upper Midscale Chain $96.4 78% Upscale Chain $16.7 13% Midscale Chain $10.0 8% Other $1.0 1% Portfolio Characteristics (CRE & C&I) (as of 6/30/20) Total Outstanding $172.5 million (3.6% of total loans) Number of Loans 57 Average Loan Size $3.0 million Largest Loan $11.1 million Average LTV 54% Total Deferred Loans $146.2 million (84.8% of portfolio) Average LTV of Deferred Loans 52% Estimated Need for 2 nd Deferral $124.1 million Portfolio by State IL $93.9 54% MO $55.2 32% WI $11.1 7% CO $11.1 6% Other $1.2 1%

9 GreenSky Consumer Loan Portfolio Overview Delinquency Rate (greater than 60 days) Portfolio Characteristics (as of 6/30/20) Total Outstanding $680.5 million (14.1% of total loans) Number of Loans 297,241 Average Loan Size $2,289 Average FICO Score 746 Total Deferred Loans $35.8 million (5.3% of portfolio) ▪ Average FICO score of 746 ▪ No losses to MSBI in 9 year history of the portfolio ▪ Portfolio can be sold to provide liquidity; Loan sales were executed at par in May and June 2020 Prime Credit 0.81% 0.66% 0.61% 0.50% 0.47% 0.34% Jan 2020 Feb 2020 Mar 2020 Apr 2020 May 2020 Jun 2020 ▪ Cash flow waterfall structure » Cash flow from portfolio covers servicing fee, credit losses and our target margin » Excess cash flow is an incentive fee to GreenSky that could be used to cover additional losses » GreenSky received incentive fees in 17 of past 18 months including every month in 2020 ▪ Escrow deposits » Escrow deposits absorb losses in excess of cash flow waterfall » Escrow account totaled $29.5 million at 6/30/20 or 4.3% of the portfolio Credit Enhancement
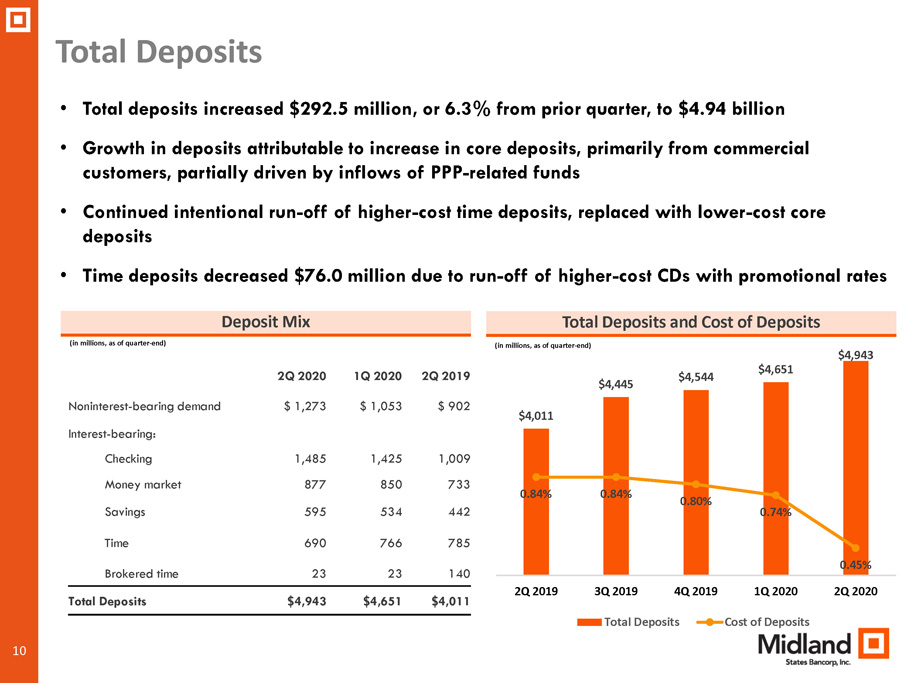
10 2Q 2020 1Q 2020 2Q 2019 Noninterest - bearing demand $ 1,273 $ 1,053 $ 902 Interest - bearing: Checking 1,485 1,425 1,009 Money market 877 850 733 Savings 595 534 442 Time 690 766 785 Brokered time 23 23 140 Total Deposits $4,943 $4,651 $4,011 Total Deposits Total Deposits and Cost of Deposits • Total deposits increased $292.5 million, or 6.3% from prior quarter, to $4.94 billion • Growth in deposits attributable to increase in core deposits, primarily from commercial customers, partially driven by inflows of PPP - related funds • Continued intentional run - off of higher - cost time deposits, replaced with lower - cost core deposits • Time deposits decreased $76.0 million due to run - off of higher - cost CDs with promotional rates Deposit Mix (in millions, as of quarter - end) (in millions, as of quarter - end) $4,011 $4,445 $4,544 $4,651 $4,943 0.84% 0.84% 0.80% 0.74% 0.45% 2Q 2019 3Q 2019 4Q 2019 1Q 2020 2Q 2020 Total Deposits Cost of Deposits

11 $3.4 $3.1 $3.6 $2.2 $1.8 $46.1 $49.5 $48.7 $46.7 $49.0 2Q 2019 3Q 2019 4Q 2019 1Q 2020 2Q 2020 NII Accretion Income 0.25% 0.20% 0.23% 0.16% 0.12% 3.76% 3.70% 3.56% 3.48% 3.32% 2Q 2019 3Q 2019 4Q 2019 1Q 2020 2Q 2020 NIM Accretion Income • Net interest income increased 5.0% from the prior quarter due to lower cost of funds and higher average loan balances • Excluding the impact of accretion income, net interest margin declined 12 basis points • Decline in net interest margin was primarily attributable to excess liquidity invested in lower - yielding earning assets and the addition of low - interest PPP loans, which collectively had an 18 bps impact on NIM in 2Q20 • 29 basis point decline in cost of deposits partially offset decline in earning asset yields • PPP loan fees amortized over 24 month term of loans Net Interest Income/Margin Net Interest Margin Net Interest Income (in millions)

12 Factors Impacting Net Interest Margin in 3Q20 • $107.1 million in time deposits scheduled to mature in 3Q20 with weighted average rate of 1.36% • $183.3 million in money market accounts at teaser rates of 1.60% scheduled to reprice in 3Q20 • $31.1 million in subordinated debt moved to floating rate in June 2020, resulting in reduction of approximately 130 bps in 3Q20 • Building liquidity on balance sheet will continue to put pressure on NIM going forward • PPP loans will positively impact NIM upon forgiveness

13 $5.50 $6.00 $5.38 $5.68 $5.70 2Q 2019 3Q 2019 4Q 2019 1Q 2020 2Q 2020 $3,126 $3,281 $3,410 $2,968 $3,254 2Q 2019 3Q 2019 4Q 2019 1Q 2020 2Q 2020 • During 2Q20, assets under administration increased $286.2 million, primarily due to market performance • Total Wealth Management revenue was up slightly from prior quarter • Fees increased due to improved market performance, partially offset by reduction in trust fees related to tax preparation from prior quarter Wealth Management Wealth Management Revenue Assets Under Administration (in millions) (in millions )

14 Noninterest Income • Noninterest income increased 125.6% from prior quarter, which included an $8.5 million impairment of commercial mortgage servicing rights (“MSRs”) • Excluding the impact of the impairment of commercial MSRs, noninterest income increased 13.5% primarily due to higher commercial FHA and residential mortgage banking revenue • Increase was offset by lower retail banking fees including service charges and overdraft fees due to the impact of COVID - 19 pandemic Noninterest Income (in millions) $19.6 $19.6 $19.0 $17.1 $19.4 2Q 2019 3Q 2019 4Q 2019 1Q 2020 2Q 2020 All Other Community Banking Revenue Residential Mortgage Commercial FHA Wealth Management Notes: (1) Represents service charges, interchange revenue, net gain (loss) on sale of investment securities, and other income (2) Excludes $8.5 million impairment of commercial mortgage servicing rights (1) (2)

15 Noninterest Expense and Operating Efficiency • Efficiency Ratio (1) was 58.5% in 2Q20 vs. 63.8% in 1Q20 • Adjustments to non - interest expense: • Excluding these adjustments, noninterest expense declined $0.6 million on a linked - quarter basis • Decrease in noninterest expense was primarily attributable to lower salaries and employee benefits expense resulting from staffing level adjustments made in 1Q20 Noninterest Expense and Efficiency Ratio (1) (Noninterest expense in millions) $(0.2) $5.2 $5.2 $1.7 $0.4 $40.2 $48.0 $46.3 $42.7 $40.8 61.6% 60.6% 59.5% 63.8% 58.5% 2Q 2019 3Q 2019 4Q 2019 1Q 2020 2Q 2020 Total Noninterest Expense Adjustments to Noninterest Expense Efficiency Ratio Notes: (1) Represents a non - GAAP financial measure. See “Non - GAAP Reconciliation” in the appendix. ($ in millions) 2Q20 1Q20 Integration and acquisition related expenses ($0.05) ($1.0) Loss on repurchase of subordinated debt - ($0.2) Loss on MSRs held for sale $(0.4) $(0.5)

16 Asset Quality NCO / Average Loans • Nonperforming loans/total loans declined to 1.25% from 1.33% at the end of the prior quarter • Net charge - offs of $3.1 million, or 0.26% of average loans • Provision for loan losses of $11.6 million in 2Q20 primarily reflects changes in portfolio and a continued downgrade in economic forecast due to the impact of COVID - 19 pandemic • At 6/30/20, approximately 96% of ACL was allocated to general reserves Nonperforming Loans / Total Loans (Total Loans as of quarter - end) 1.24% 1.04% 0.96% 1.33% 1.25% 2Q 2019 3Q 2019 4Q 2019 1Q 2020 2Q 2020 0.12% 0.49% 0.20% 1.18% 0.26% 2Q 2019 3Q 2019 4Q 2019 1Q 2020 2Q 2020

17 Changes in Allowance for Credit Losses ACL 3/31/20 ACL 6/30/20 Specific Reserves Portfolio Changes Economic Factors ▪ Changes to specific reserves ▪ New loans ▪ Changes in credit quality including risk downgrades and deferrals ▪ Aging of existing portfolio ▪ Other charge - offs and recoveries ▪ Changes to macro - economic variables and forecasts ▪ Changes to other economic qualitative factors ($ in thousands)
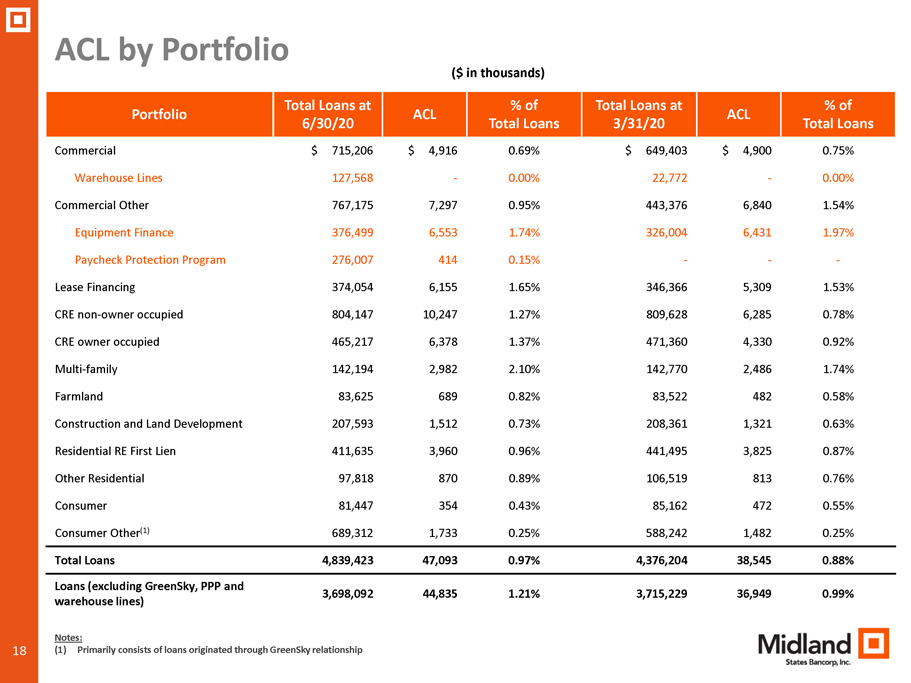
18 ACL by Portfolio Portfolio Total Loans at 6/30/20 ACL % of Total Loans Total Loans at 3/31/20 ACL % of Total Loans Commercial $ 715,206 $ 4,916 0.69% $ 649,403 $ 4,900 0.75% Warehouse Lines 127,568 - 0.00% 22,772 - 0.00% Commercial Other 767,175 7,297 0.95% 443,376 6,840 1.54% Equipment Finance 376,499 6,553 1.74% 326,004 6,431 1.97% Paycheck Protection Program 276,007 414 0.15% - - - Lease Financing 374,054 6,155 1.65% 346,366 5,309 1.53% CRE non - owner occupied 804,147 10,247 1.27% 809,628 6,285 0.78% CRE owner occupied 465,217 6,378 1.37% 471,360 4,330 0.92% Multi - family 142,194 2,982 2.10% 142,770 2,486 1.74% Farmland 83,625 689 0.82% 83,522 482 0.58% Construction and Land Development 207,593 1,512 0.73% 208,361 1,321 0.63% Residential RE First Lien 411,635 3,960 0.96% 441,495 3,825 0.87% Other Residential 97,818 870 0.89% 106,519 813 0.76% Consumer 81,447 354 0.43% 85,162 472 0.55% Consumer Other (1) 689,312 1,733 0.25% 588,242 1,482 0.25% Total Loans 4,839,423 47,093 0.97% 4,376,204 38,545 0.88% Loans (excluding GreenSky, PPP and warehouse lines) 3,698,092 44,835 1.21% 3,715,229 36,949 0.99% ($ in thousands) Notes: (1) Primarily consists of loans originated through GreenSky relationship

19 Outlook and Near - Term Priorities • Maintain strong capital and liquidity positions to continue supporting clients and communities through the duration of the COVID - 19 pandemic • Continue executing on technology initiatives to improve customer experience, reduce expenses and increase operational efficiencies » New online residential mortgage application portal » Improvements to mobile banking app » Implementation of new customer experience tool to gather and evaluate customer survey data » New online account opening tool launching in 3Q20 • Continued evaluation of all areas of operations to reduce expenses 19

20 APPENDIX
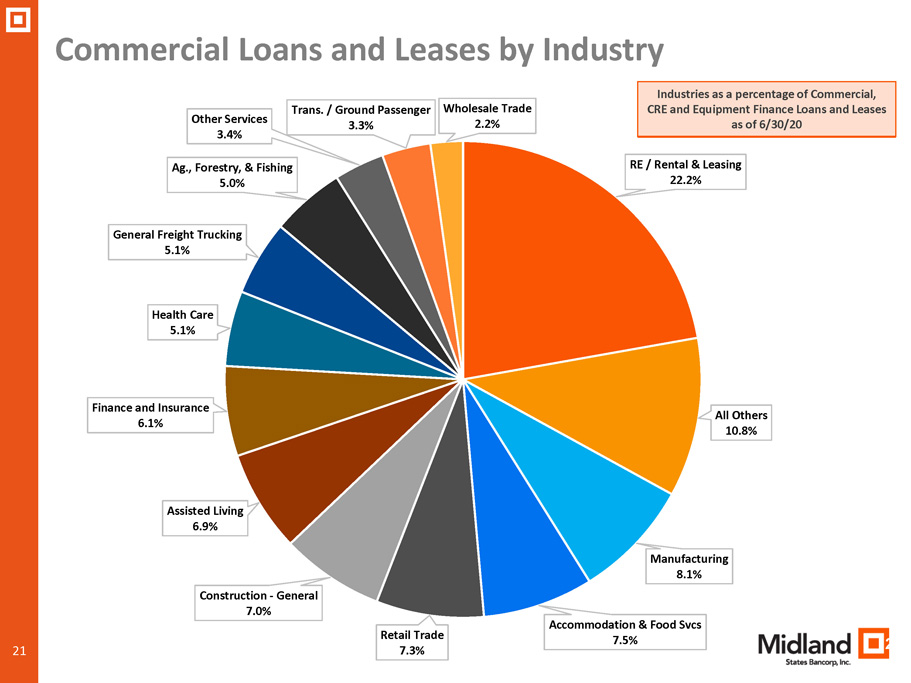
21 Commercial Loans and Leases by Industry 21 RE / Rental & Leasing 22.2% All Others 10.8% Manufacturing 8.1% Accommodation & Food Svcs 7.5% Retail Trade 7.3% Construction - General 7.0% Assisted Living 6.9% Finance and Insurance 6.1% Health Care 5.1% General Freight Trucking 5.1% Ag., Forestry, & Fishing 5.0% Other Services 3.4% Trans. / Ground Passenger 3.3% Wholesale Trade 2.2% Industries as a percentage of Commercial, CRE and Equipment Finance Loans and Leases as of 6/30/20

22 Commercial Real Estate Portfolio by Collateral Type 22 Retail 15.1% All Others 12.3% Assisted Living 10.9% Multi - Family 9.6% Hotel/Motel 9.3% Industrial / Warehouse 9.0% Office 6.5% Residential 1 - 4 Family 6.2% Farmland 3.9% Medical Building 3.7% C - Store / Gas Station 3.4% Developed Land 2.8% Car Dealerships 2.5% Raw Land 2.2% Mixed Use / Other 2.1% Church 0.5% Collateral type as a percentage of the Commercial Real Estate and Construction Portfolio as of 6/30/20

23 Capital and Liquidity Overview Capital Ratios (as of 6/30/20) Liquidity Sources (as of 6/30/20) 6.67% 8.44% 7.75% 9.71% 13.67% 11.28% 9.01% 11.28% 12.05% 0.00% 5.00% 10.00% 15.00% TCE/TA Tier 1 Common Tier 1 Leverage Tier 1 RBC Total RBC Consolidated Bank Level ($ in millions) Cash and Cash Equivalents $ 519.9 Unpledged Securities 435.0 FHLB Committed Liquidity 329.4 FRB Discount Window Availability 57.2 Primary Liquidity 1,341.5 FRB – PPP Liquidity Facility (1) 250.0 Secondary Liquidity 250.0 Total Estimated Liquidity $ 1,591.5 Conditional Funding Based on Market Conditions Additional Credit Facility $ 250.0 Brokered CDs (additional capacity) $ 500.0 (1) Enrolled in PPP facility – loans available to submit Other Liquidity Holding Company Cash Position of $62.9 Million

24 Adjusted Earnings Reconciliation (dollars in thousands, except per share data) Income before income taxes - GAAP $ 15,993 $ 2,005 $ 16,071 $ 16,670 $ 21,394 Adjustments to noninterest income: Gain on sales of investment securities, net - - 635 25 14 Other 11 (13) (6) - (23) Total adjustments to noninterest income 11 (13) 629 25 (9) Adjustments to noninterest expense: Loss (gain) on mortgage servicing rights held for sale 391 496 95 (70) (515) Loss on repurchase of subordinated debt - 193 1,778 - - Integration and acquisition expenses 54 1,031 3,332 5,292 286 Total adjustments to noninterest expense 445 1,720 5,205 5,222 (229) Adjusted earnings pre tax 16,427 3,738 20,647 21,867 21,174 Adjusted earnings tax 3,543 932 4,537 5,445 4,978 Adjusted earnings - non-GAAP 12,884 2,806 16,110 16,422 16,196 Preferred stock dividends, net - - - (22) 34 Adjusted earnings available to common shareholders - non-GAAP $ 12,884 $ 2,806 $ 16,110 $ 16,444 $ 16,162 Adjusted diluted earnings per common share $ 0.55 $ 0.11 $ 0.64 $ 0.66 $ 0.66 Adjusted return on average assets 0.78 % 0.19 % 1.04 % 1.09 % 1.16 % Adjusted return on average shareholders' equity 8.20 % 1.73 % 9.71 % 10.01 % 10.33 % Adjusted return on average tangible common equity 12.14 % 2.53 % 14.15 % 14.52 % 15.19 % MIDLAND STATES BANCORP, INC. RECONCILIATIONS OF NON-GAAP FINANCIAL MEASURES For the Quarter Ended 2020 2020 2019 2019 2019 June 30, March 31, December 31, September 30, June 30,
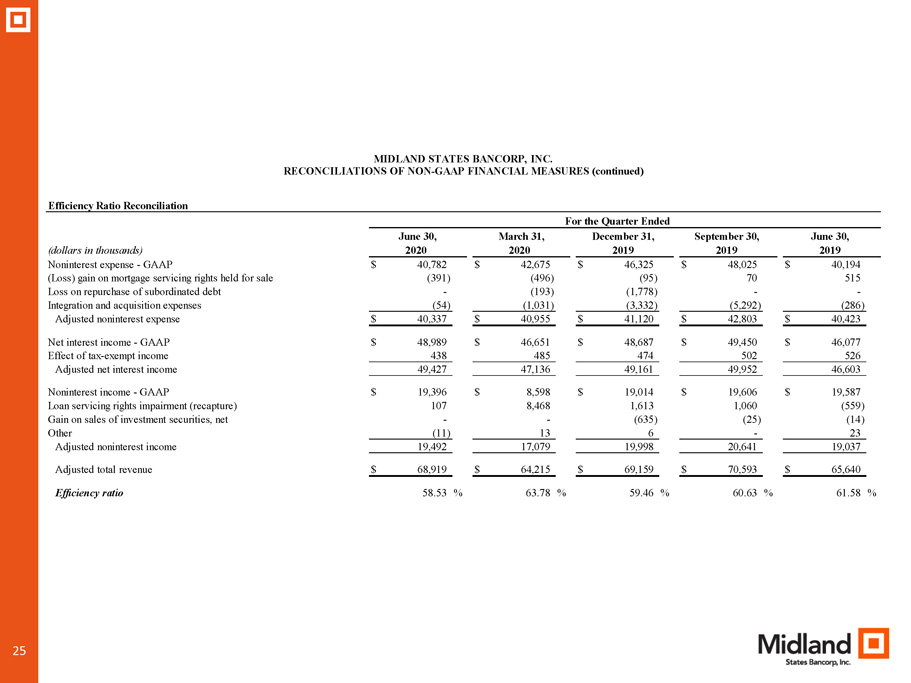
25 Efficiency Ratio Reconciliation (dollars in thousands) Noninterest expense - GAAP $ 40,782 $ 42,675 $ 46,325 $ 48,025 $ 40,194 (Loss) gain on mortgage servicing rights held for sale (391) (496) (95) 70 515 Loss on repurchase of subordinated debt - (193) (1,778) - - Integration and acquisition expenses (54) (1,031) (3,332) (5,292) (286) Adjusted noninterest expense $ 40,337 $ 40,955 $ 41,120 $ 42,803 $ 40,423 Net interest income - GAAP $ 48,989 $ 46,651 $ 48,687 $ 49,450 $ 46,077 Effect of tax-exempt income 438 485 474 502 526 Adjusted net interest income 49,427 47,136 49,161 49,952 46,603 Noninterest income - GAAP $ 19,396 $ 8,598 $ 19,014 $ 19,606 $ 19,587 Loan servicing rights impairment (recapture) 107 8,468 1,613 1,060 (559) Gain on sales of investment securities, net - - (635) (25) (14) Other (11) 13 6 - 23 Adjusted noninterest income 19,492 17,079 19,998 20,641 19,037 Adjusted total revenue $ 68,919 $ 64,215 $ 69,159 $ 70,593 $ 65,640 Efficiency ratio 58.53 % 63.78 % 59.46 % 60.63 % 61.58 % MIDLAND STATES BANCORP, INC. RECONCILIATIONS OF NON-GAAP FINANCIAL MEASURES (continued) For the Quarter Ended 2020 2020 2019 2019 2019 June 30, March 31, December 31, September 30, June 30,

26 Tangible Common Equity to Tangible Assets Ratio and Tangible Book Value Per Share (dollars in thousands, except per share data) Shareholders' Equity to Tangible Common Equity Total shareholders' equity—GAAP $ 633,589 $ 631,160 $ 661,911 $ 655,522 $ 639,888 Adjustments: Preferred stock - - - - (2,684) Goodwill (172,796) (172,796) (171,758) (171,074) (164,673) Other intangibles, net (31,495) (33,124) (34,886) (36,690) (33,893) Tangible common equity $ 429,298 $ 425,240 $ 455,267 $ 447,758 $ 438,638 Total Assets to Tangible Assets: Total assets—GAAP $ 6,644,498 $ 6,208,230 $ 6,087,017 $ 6,113,904 $ 5,546,055 Adjustments: Goodwill (172,796) (172,796) (171,758) (171,074) (164,673) Other intangibles, net (31,495) (33,124) (34,886) (36,690) (33,893) Tangible assets $ 6,440,207 $ 6,002,310 $ 5,880,373 $ 5,906,140 $ 5,347,489 Common Shares Outstanding 22,937,296 23,381,496 24,420,345 24,338,748 23,897,038 Tangible Common Equity to Tangible Assets 6.67 % 7.08 % 7.74 % 7.58 % 8.20 % Tangible Book Value Per Share $ 18.72 $ 18.19 $ 18.64 $ 18.40 $ 18.36 Return on Average Tangible Common Equity (ROATCE) (dollars in thousands) Net income available to common shareholders $ 12,569 $ 1,549 $ 12,792 $ 12,677 $ 16,321 Average total shareholders' equity—GAAP $ 631,964 $ 652,701 $ 658,497 $ 651,162 $ 628,730 Adjustments: Preferred stock - - - (814) (2,708) Goodwill (172,796) (171,890) (171,082) (166,389) (164,673) Other intangibles, net (32,275) (33,951) (35,745) (34,519) (34,689) Average tangible common equity $ 426,893 $ 446,860 $ 451,670 $ 449,440 $ 426,660 ROATCE 11.84 % 1.39 % 11.24 % 11.19 % 15.34 % MIDLAND STATES BANCORP, INC. RECONCILIATIONS OF NON-GAAP FINANCIAL MEASURES (continued) As of June 30, March 31, December 31, September 30, June 30, 2020 2020 2019 2019 2019 For the Quarter Ended 2020 2020 2019 2019 2019 June 30, March 31, December 31, September 30, June 30,