Attached files
| file | filename |
|---|---|
| EX-99.1 - EXHIBIT 99.1 - Mahwah Bergen Retail Group, Inc. | tm2024948d1_ex99-1.htm |
| 8-K - FORM 8-K - Mahwah Bergen Retail Group, Inc. | tm2024948-1_8k.htm |
Exhibit 99.2
 |
HIGHLY CONFIDENTIAL PROVIDED PURSUANT TO LENDER NDA ascenaretailgroup, inc. LenderPresentation June 2020 |
 |
HIGHLY CONFIDENTIAL PROVIDED PURSUANT TO LENDER NDA Executive Summary ▪ After conducting a broad review of ascena and its strategic alternatives throughout 2019, in early 2020, Management developed a go-forward strategy to grow the business and enhance future profitability ▪ In connection with the COVID-19 pandemic, Management reevaluated the business and refined perspectives on the optimal go-forward operating model ▪ The revised business plan (the “Strategic Plan”) has been developed, in part, as a response to post-COVID-19 operating trends and focuses on capitalizing on the shift to omni-channel sales throughout the retail landscape ▪ The Strategic Plan will allow ascena to accelerate its return to growth and profitability through a number of significant initiatives ─ Significant store fleet portfolio rationalization ─ Strategic plan focused on three brands – LOFT, Ann Taylor and Lane Bryant (the “Core Brands”) ─ Evaluating alternatives for Justice and Catherines businesses ─ Realignment of distribution capabilities ─ Reduction of SG&A expenses of over $350 million 2 |
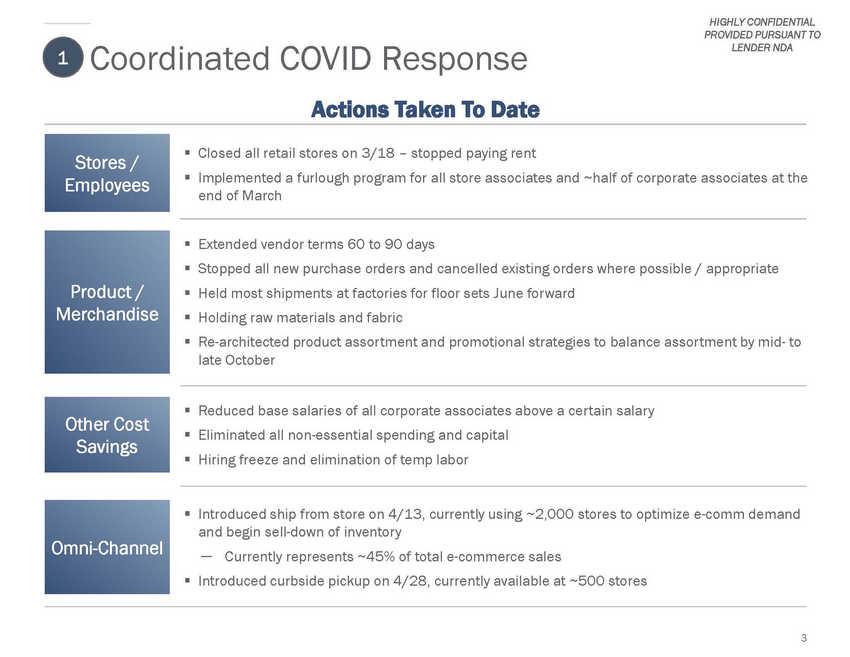 |
HIGHLY CONFIDENTIAL PROVIDED PURSUANT TO LENDER NDA Coordinated COVID Response Actions Taken To Date 1 ▪ ▪ Closed all retail stores on 3/18 – stopped paying rent Implemented a furlough program for all store associates and ~half of corporate associates at the end of March Stores / Employees ▪ ▪ ▪ ▪ ▪ Extended vendor terms 60 to 90 days Stopped all new purchase orders and cancelled existing orders where possible / appropriate Held most shipments at factories for floor sets June forward Holding raw materials and fabric Re-architected product assortment and promotional strategies to balance assortment by mid-to late October Product / Merchandise ▪ ▪ ▪ Reduced base salaries of all corporate associates above a certain salary Eliminated all non-essential spending and capital Hiring freeze and elimination of temp labor Other Cost Savings ▪ Introduced ship from store on 4/13, currently using ~2,000 stores to optimize e-comm demand and begin sell-down of inventory Omni-Channel ─ Currently represents ~45% of total e-commerce sales ▪ Introduced curbside pickup on 4/28, currently available at ~500 stores 3 |
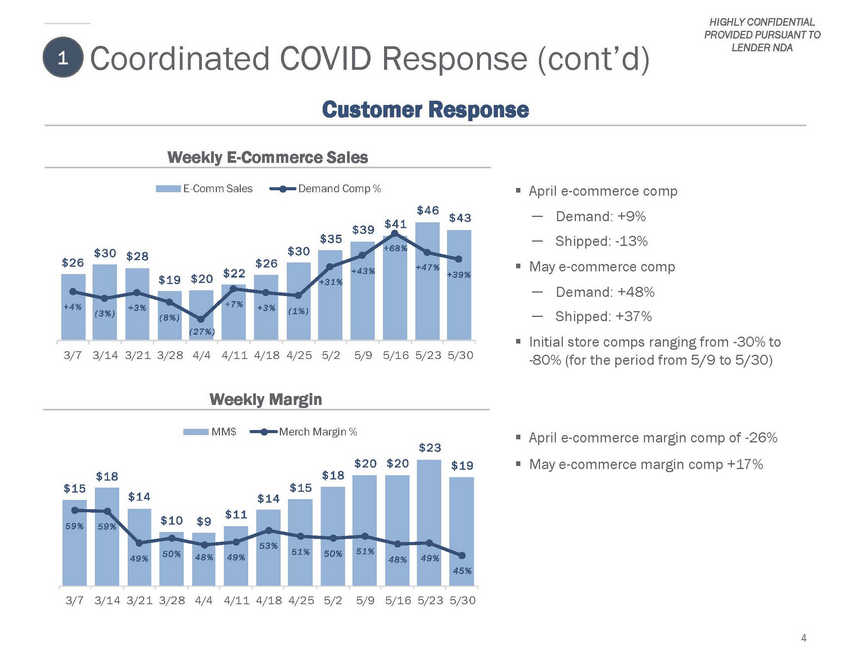 |
HIGHLY CONFIDENTIAL PROVIDED PURSUANT TO LENDER NDA Coordinated COVID Response (cont’d) Customer Response 1 Weekly E-Commerce Sales E-Comm Sales Demand Comp % ▪ April e-commerce comp $46 ─ ─ Demand: +9% Shipped: -13% $43 $35 $26 $26 ▪ May e-commerce comp $22 $20 $19 ─ ─ Demand: +48% Shipped: +37% ▪ Initial store comps ranging from -30% to -80% (for the period from 5/9 to 5/30) 3/7 3/1 4 3/2 1 3/2 8 4/4 4/1 1 4/1 8 4/2 5 5/2 5/9 5/1 6 5/2 3 5/3 0 Weekly Margin MM$ Merch Margin % ▪ ▪ April e-commerce margin comp of -26% May e-commerce margin comp +17% $23 $19 3/7 3/1 4 3/2 1 3/2 8 4/4 4/1 1 4/1 8 4/2 5 5/2 5/9 5/1 6 5/2 3 5/3 0 4 $20 $20 $18$18 $14$14 $10$9$11 5 3 % 4 9 % 5 0 % 4 8 % 4 9 % 5 1 % 5 0 %5 1 %4 8 % 4 9 % $15$15 5 9 % 5 9 % 4 5 % $39 $41 + 4 7 % + 3 9 % + 6 8 % + 4 3 % $30 $28$30 + 3 1 % ( 3 % ) ( 1 % ) + 3 % + 4 % + 3 % + 7 % ( 8 % ) ( 2 7 % ) |
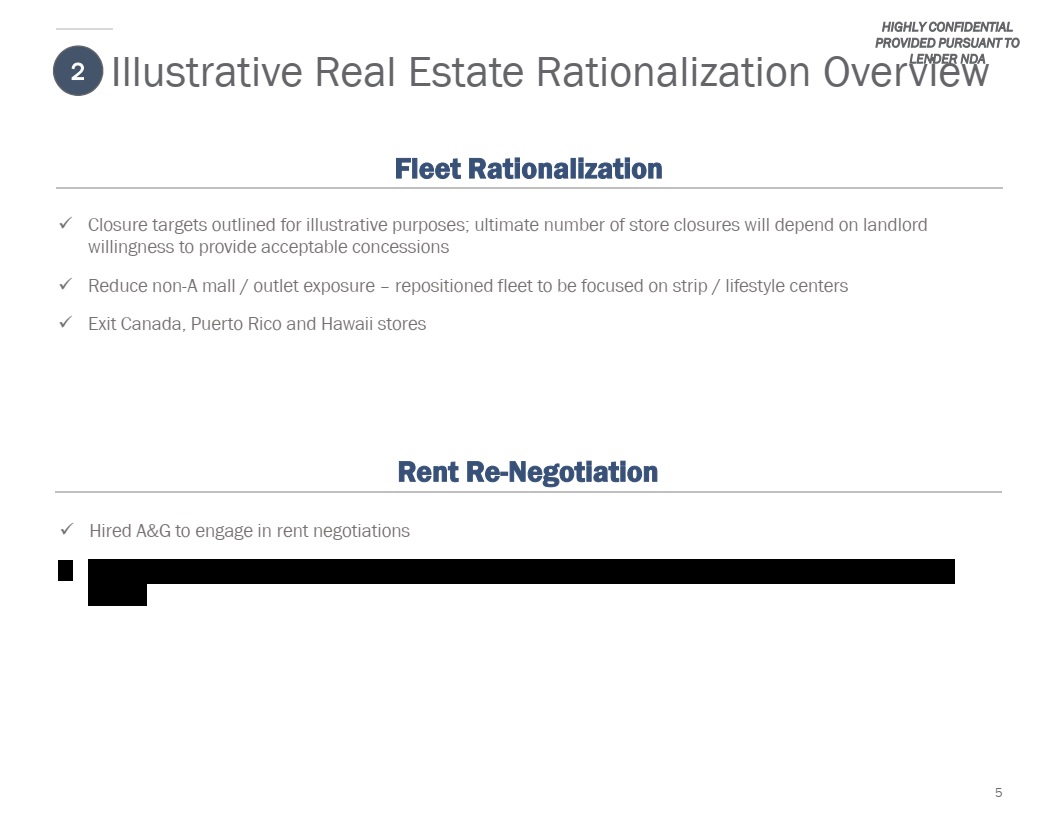 |
HIGHLY CONFIDENTIAL PROVIDED PURSUANT TO OvervLENiDeER NwDA Illustrative Real Estate Rationalization 2 Fleet Rationalization ✓ Closure targets outlined for illustrative purposes; ultimate number of store closures will depend on landlord willingness to provide acceptable concessions ✓ ✓ Reduce non-A mall / outlet exposure – repositioned fleet to be focused on strip / lifestyle centers Exit Canada, Puerto Rico and Hawaii stores Rent Re-Negotiation ✓ ✓ Hired A&G to engage in rent negotiations Preliminary analysis assumes successful rent reductions at ~15% of stores which results in ~$18.5MM of rent savings 5 |
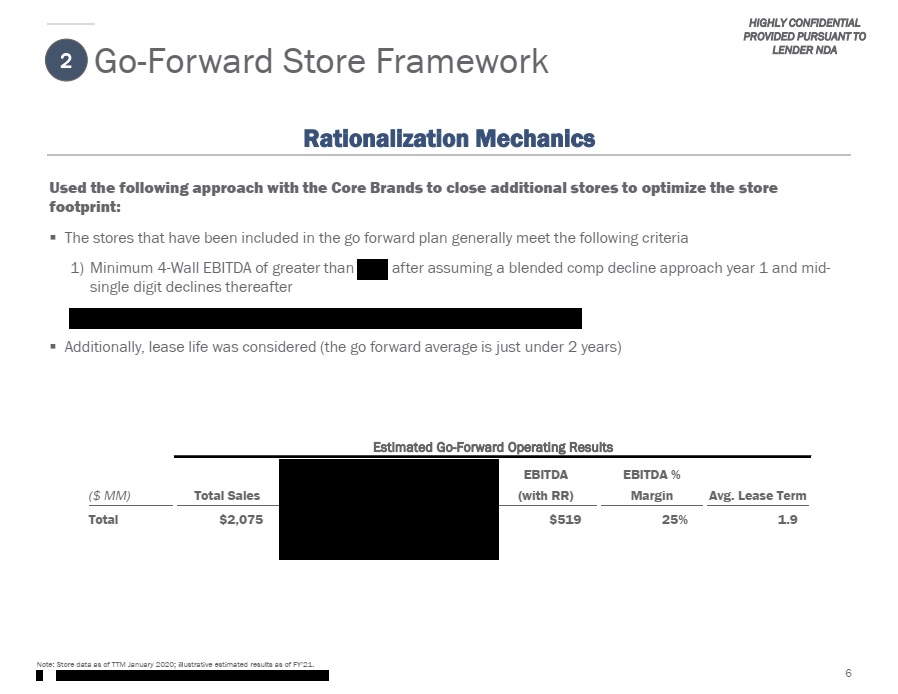 |
HIGHLY CONFIDENTIAL PROVIDED PURSUANT TO LENDER NDA Go-Forward Store Framework 2 Rationalization Mechanics Used the following approach with the Core Brands to close additional stores to optimize the store footprint: ▪ The stores that have been included in the go forward plan generally meet the following criteria 1) Minimum 4-Wall EBITDA of greater than 20% after assuming a blended comp decline approach year 1 and mid-single digit declines thereafter 2) Strategic Stores (to protect a market) majority of which have EBITDA >10% Additionally, lease life was considered (the go forward average is just under 2 years) ▪ Estimated Go-Forward Operating Results Rent Reduction Estimate EBITDA (with RR) EBITDA % Margin (1) ($ MM) Total Sales Adj. Occupancy Avg. Lease Term Total $2,075 $283 ($19) $519 25% 1.9 Note: Store data as of TTM January 2020; illustrative estimated results as of FY’21. 1)Adj. Occupancy defined as cash occupancy expense less estimated rent reduction 6 |
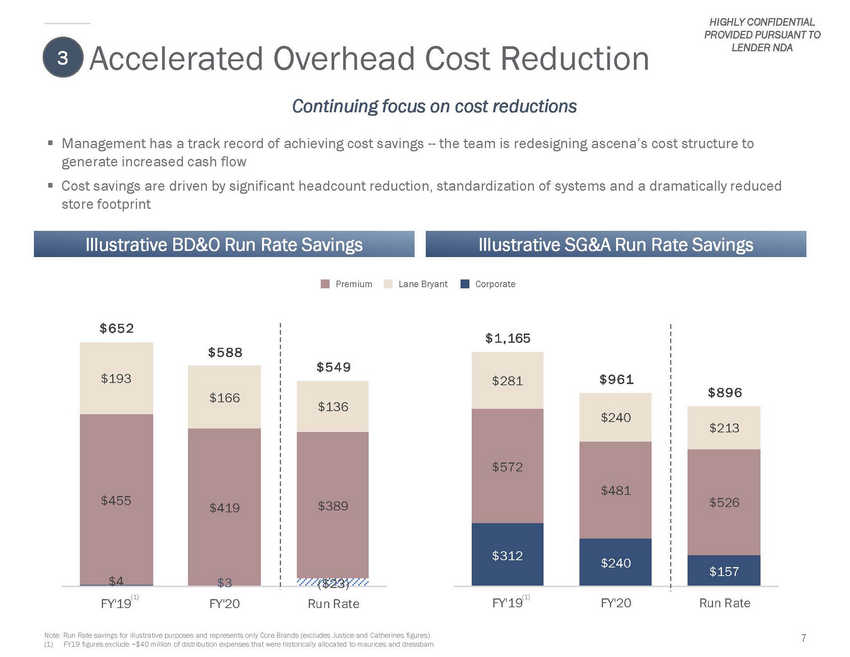 |
HIGHLY CONFIDENTIAL PROVIDED PURSUANT TO LENDER NDA Accelerated Overhead Cost Reduction Continuing focus on cost reductions 3 ▪ Management has a track record of achieving cost savings --the team is redesigning ascena’s cost structure to generate increased cash flow Cost savings are driven by significant headcount reduction, standardization of systems and a dramatically reduced store footprint ▪ Illustrative BD&O Run Rate Savings Illustrative SG&A Run Rate Savings Premium Lane Bryant Corporate (1) (1) FY'19 FY'20 Run Rate FY'19 FY'20 Run Rate Note: Run Rate savings for illustrative purposes and represents only Core Brands (excludes Justice and Catherines figures). (1) FY19 figures exclude ~$40 million of distribution expenses that were historically allocated to maurices and dressbarn 7 $ 1 , 165 $ 8 9 6 $281 $ 9 6 1 $240 $572 $213 $481 $526 $312 $240 $157 $ 6 5 2 $ 5 4 9 ($23) $193 $ 5 8 8 $166 $455 $4 $419 $3 $136 $389 |
 |
HIGHLY CONFIDENTIAL PROVIDED PURSUANT TO LENDER NDA Overview of Consolidated Financials ▪ Our previous business plan was abruptly disrupted in March due to the COVID-19 pandemic and Management, with the Board’s oversight, reassessed the go forward business in light of the expected significant shift in consumer behavior that would result from the pandemic, including: – Greater preference to shop digitally (on-line ship to home and pick-up in store) – Larger declines in store traffic – Reduced number of retail stores, especially in enclosed malls ▪ The Strategic Plan is built on three Core Brands – LOFT, Ann Taylor and Lane Bryant – For this plan Justice and Catherines are considered non-core brands ▪ The consolidated financials roll up the core brand-level forecasts and incorporate certain corporate cost assumptions ▪ FY 2020 total sales comp is now projected to decline by ~36% primarily driven by stores being closed for several months, offset by a modestly positive e-commerce comp of ~5% ▪ FY 2021 and FY 2022 sales comps are distorted due to store closures and recovery of customer traffic post re-opening – Expected margin compression throughout FY2021 related to an expected heavily promotional environment results in negative EBITDA of ~$230 million with a subsequent return to margin normalization and the full run-rate impact of initiatives, related to certain corporate cost reductions, leads to ~$270 million of positive EBITDA ▪ With the decision to explore a Chapter 11 process, the Company will be able to more efficiently optimize its cost structure and store fleet with significant planned store closures which drives meaningful occupancy and store savings ▪ Beginning in FY 2023 and throughout the rest of the forecast period, total comps are projected to be positive, driven by continued growth in e-commerce penetration, offsetting negative but improving store comps as recent trends in traffic moderate going forward – Increase in marketing spend to ~6% of sales is expected to support and enhance topline growth trajectory across core brands and channels – Continued investments in IT to drive customer analytics and personalization 8 |
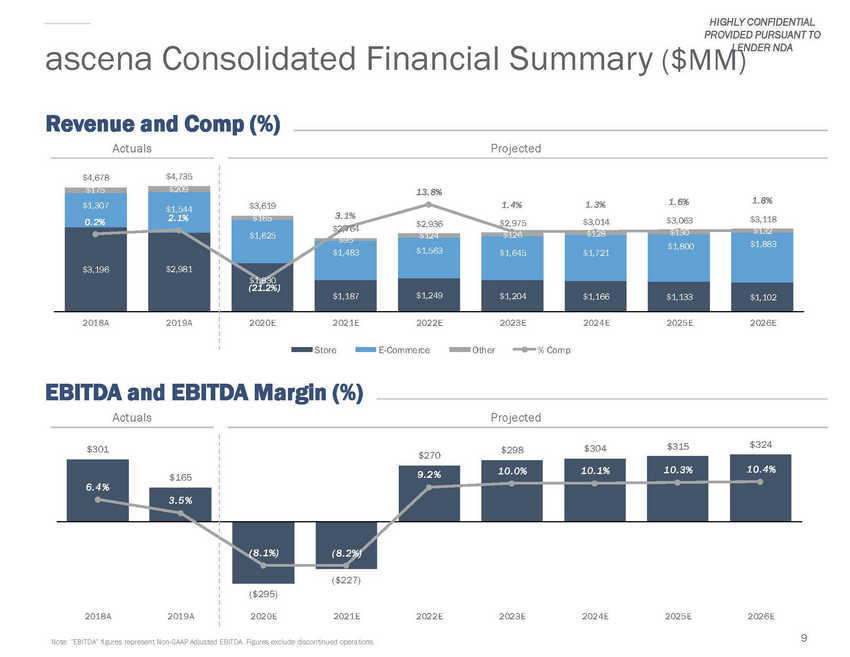 |
HIGHLY CONFIDENTIAL PROVIDED PURSUANT TO LENDER NDA ($MM) ascena Consolidated Financial Summary Revenue and Actuals Comp (%) Projected 3. 1% $3,118 ( 21.2%) Store E-Commerce Other % Comp EBITDA and Actuals EBITDA Margin (%) Projected $324 $315 9 Note: “EBITDA” figures represent Non-GAAP Adjusted EBITDA. Figures exclude discontinued operations. $301 $270$298$304 1 0 . 3% 1 0 . 4% 6 . 4 % $165 1 0 . 0% 1 0 . 1% 9 . 2 % 3 . 5 % 2018A 2019A ( 8 . 1%) ( 8 . 2%) ($227) ($295) 2020E 2021E 2022E 2023E 2024E 2025E 2026E $4,678 $4,735 13. 8% $3,619 1. 4% 1. 3% 1. 6% 1. 8% $1,307 0. 2% $1,544 2. 1% $1,625 $2,764 $2,936 $2,975 $3,014 $3,063 $3,196 $1,883 $2,981 $1,563 $1,645 $1,721 $1,800 $1,483 $1 30 $1,187 $1,249 $1,204 $1,166 $1,133 $1,102 2018A 2019A 2020E 2021E 2022E 2023E 2024E 2025E 2026E |
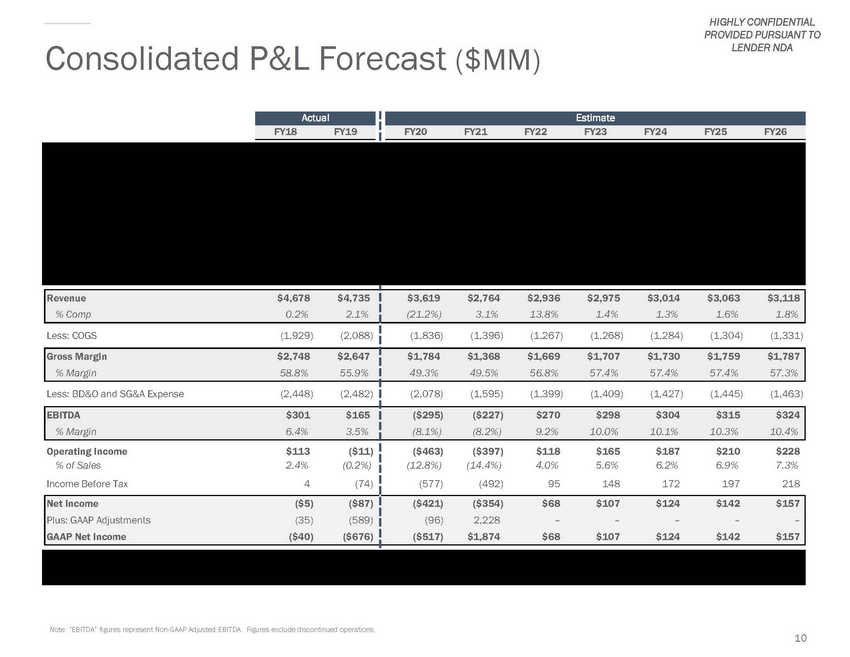 |
HIGHLY CONFIDENTIAL PROVIDED PURSUANT TO LENDER NDA Consolidated P&L Forecast ($MM) Note: “EBITDA” figures represent Non-GAAP Adjusted EBITDA. Figures exclude discontinued operations. 10 Net Store Sales $3,196 $2,981 $1,830 $1,187 $1,249 $1,204 $1,166 $1,133 $1,102 % of Sales 68.3% 63.0% 50.6% 42.9% 42.5% 40.5% 38.7% 37.0% 35.4% % Comp(5.0%) (4.8%) (35.6%) 23.2% 26.5% (3.6%) (3.2%) (2.8%) (2.7%) E-Commerce Sales, Net1,307 1,544 1,625 1,483 1,563 1,645 1,721 1,800 1,883 % of Sales 27.9% 32.6% 44.9% 53.6% 53.2% 55.3% 57.1% 58.8% 60.4% % Comp15.1% 18.1% 5.2% (8.7%) 5.4% 5.3% 4.6% 4.6% 4.6% Other(1) 175 209 165 95 124 126 128 130 132 % of Sales 3.7% 4.4% 4.6% 3.4% 4.2% 4.2% 4.2% 4.2% 4.2% Revenue $4,678 $4,735 % Comp0.2% 2.1% $3,619 $2,764 $2,936 $2,975 $3,014 $3,063 $3,118 (21.2%) 3.1% 13.8% 1.4% 1.3% 1.6% 1.8% Less: COGS (1,929) (2,088) (1,836) (1,396) (1,267) (1,268) (1,284) (1,304) (1,331) Gross Margin $2,748 $2,647 % Margin 58.8% 55.9% $1,784 $1,368 $1,669 $1,707 $1,730 $1,759 $1,787 49.3% 49.5% 56.8% 57.4% 57.4% 57.4% 57.3% Less: BD&O and SG&A Expense (2,448) (2,482) (2,078) (1,595) (1,399) (1,409) (1,427) (1,445) (1,463) EBITDA $301 $165 % Margin 6.4% 3.5% ($295) ($227) $270 $298 $304 $315 $324 (8.1%) (8.2%) 9.2% 10.0% 10.1% 10.3% 10.4% Operating Income $113 ($11) % of Sales 2.4% (0.2%) Income Before Tax 4 (74) ($463) ($397) $118 $165 $187 $210 $228 (12.8%) (14.4%) 4.0% 5.6% 6.2% 6.9% 7.3% (577) (492) 95 148 172 197 218 Net Income ($5) ($87) Plus: GAAP Adjustments (35) (589) GAAP Net Income ($40) ($676) ($421) ($354) $68 $107 $124 $142 $157 (96) 2,228 – – – – – ($517) $1,874 $68 $107 $124 $142 $157 Memo: Store Count 2,920 2,829 2,658 1,207 1,207 1,207 1,207 1,207 1,207 Memo: E-Commerce Penetration 29% 34% 44% 56% 56% 58% 60% 61% 63% Estimate FY20 FY21 FY22 FY23 FY24 FY25 FY26 Actual FY18 FY19 |
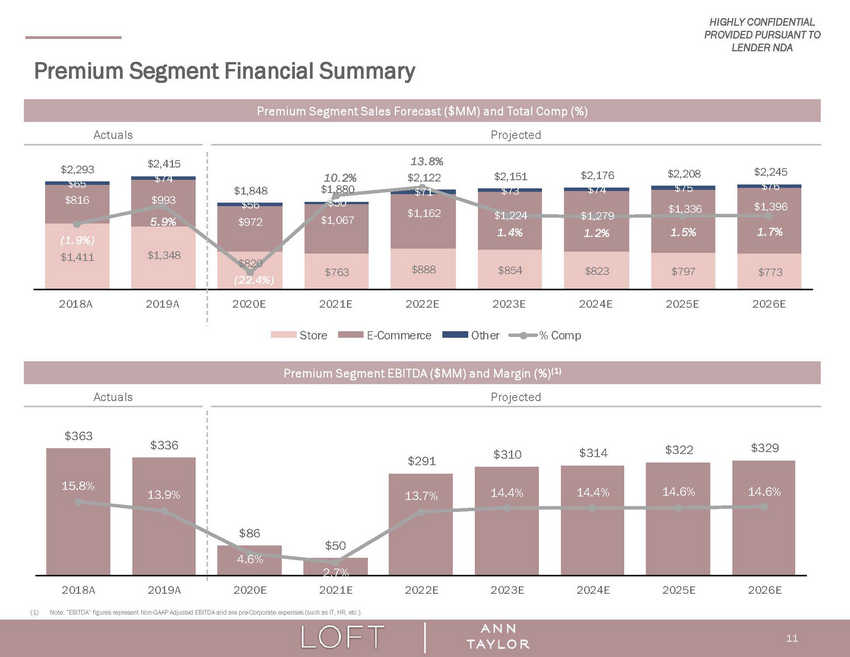 |
HIGHLY CONFIDENTIAL PROVIDED PURSUANT TO LENDER NDA Premium Segment Financial Summary Actuals Projected $2,245 $2,208 $2,176 $2,151 $2,122 10. 2% $1,880 $1,848 $972 Store E-Comme rce Other % Comp Actuals Projected $322 $314 $310 $291 $50 2018A 2019A 2020E 2021E 2022E 2023E 2024E 2025E 2026E (1)Note: “EBITDA” figures represent Non-GAAP Adjusted EBITDA and are pre-Corporate expenses (such as IT, HR, etc.). 11 $363 $336 $329 15.8% 13.9% 14.6% 14.6% 14.4% 14.4% $86 13.7% 4 % Premium Segment EBITDA ($MM) and Margin (%)(1) $2,293$2,415 13. 8% $993 5. 9% $816 $1,396 1. 7% $1,162 $1 24 1. 4% $1,336 1. 5% $1 79 1. 2% $1,067 ( 1. 9%) $1,411 $1,348 $888 $854 $823 $797 $773 $820 ( 22.4%) $763 2018A2019A 2020E2021E2022E2023E2024E2025E2026E Premium Segment Sales Forecast ($MM) and Total Comp (%) |
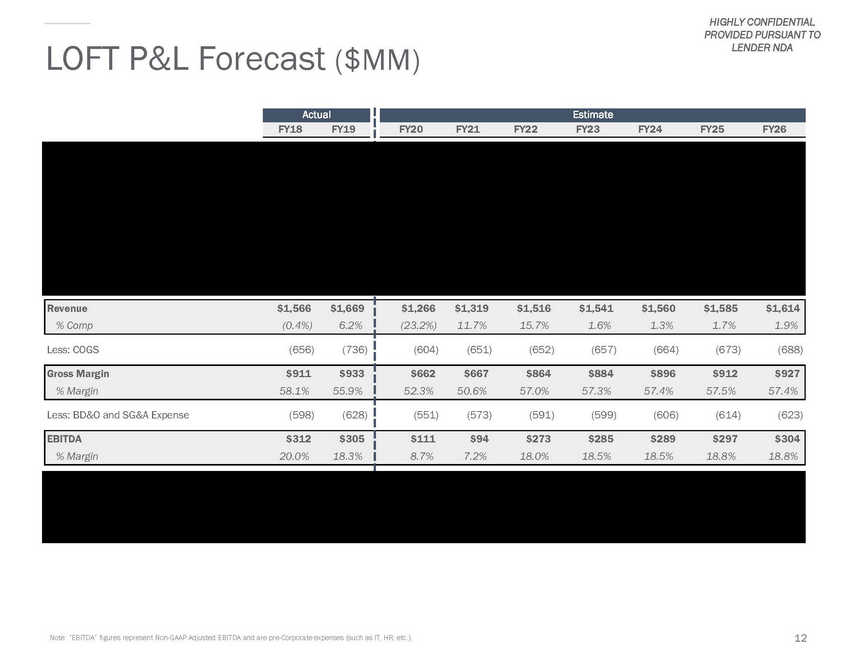 |
HIGHLY CONFIDENTIAL PROVIDED PURSUANT TO LENDER NDA LOFT P&L Forecast ($MM) 12 Note: “EBITDA” figures represent Non-GAAP Adjusted EBITDA and are pre-Corporate expenses (such as IT, HR, etc.). Net Store Sales$991$963$584$567$673$648$624$604$586 % of Sales63.3%57.7%46.2%43.0%44.4%42.0%40.0%38.1%36.3% % Comp(8.5%)(2.3%)(38.3%)12.4%22.8%(3.8%)(3.7%)(3.1%)(3.0%) E-Commerce Sales, Net534652642714790839881925972 % of Sales34.1%39.1%50.7%54.1%52.1%54.5%56.5%58.4%60.2% % Comp18.4%21.5%(0.5%)11.2%10.6%6.3%5.0%5.0%5.0% Other415439385354555557 % of Sales2.6%3.3%3.1%2.9%3.5%3.5%3.5%3.5%3.5% Revenue$1,566$1,669 % Comp(0.4%)6.2% $1,266$1,319$1,516$1,541$1,560$1,585$1,614 (23.2%)11.7%15.7%1.6%1.3%1.7%1.9% Less: COGS(656)(736) (604)(651)(652)(657)(664)(673)(688) Gross Margin$911$933 % Margin58.1%55.9% $662$667$864$884$896$912$927 52.3%50.6%57.0%57.3%57.4%57.5%57.4% Less: BD&O and SG&A Expense(598)(628) (551)(573)(591)(599)(606)(614)(623) EBITDA$312$305 % Margin20.0%18.3% $111$94$273$285$289$297$304 8.7%7.2%18.0%18.5%18.5%18.8%18.8% Memo: Store Count672669657567567567567567567 Full-Price506496486442442442442442442 Outlet / Factory166173171125125125125125125 Memo: E-Commerce Penetration35.0%40.4%52.3%55.7%54.0%56.4%58.5%60.5%62.4% Estimate FY20FY21FY22FY23FY24FY25FY26 Actual FY18FY19 |
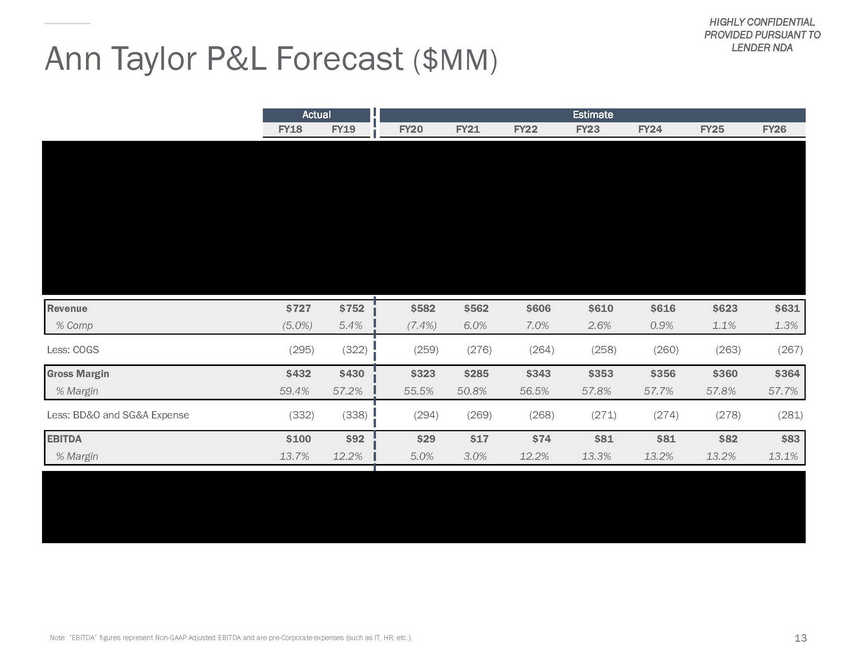 |
HIGHLY CONFIDENTIAL PROVIDED PURSUANT TO LENDER NDA Ann Taylor P&L Forecast ($MM) 13 Note: “EBITDA” figures represent Non-GAAP Adjusted EBITDA and are pre-Corporate expenses (such as IT, HR, etc.). Net Store Sales$420$385$235$196$215$206$199$193$187 % of Sales57.8%51.3%40.4%34.9%35.5%33.8%32.3%30.9%29.6% % Comp(9.5%)(5.6%)(37.2%)13.1%19.6%(3.8%)(3.5%)(3.3%)(3.0%) E-Commerce Sales, Net283341330353372385398411425 % of Sales38.9%45.3%56.8%62.9%61.4%63.1%64.6%66.0%67.3% % Comp2.4%21.1%(2.8%)7.0%5.6%3.4%3.3%3.3%3.3% Other242516131919191920 % of Sales3.3%3.4%2.8%2.2%3.1%3.1%3.1%3.1%3.1% Revenue$727$752 % Comp(5.0%)5.4% $582$562$606$610$616$623$631 (7.4%)6.0%7.0%2.6%0.9%1.1%1.3% Less: COGS(295)(322) (259)(276)(264)(258)(260)(263)(267) Gross Margin$432$430 % Margin59.4%57.2% $323$285$343$353$356$360$364 55.5%50.8%56.5%57.8%57.7%57.8%57.7% Less: BD&O and SG&A Expense(332)(338) (294)(269)(268)(271)(274)(278)(281) EBITDA$100$92 % Margin13.7%12.2% $29$17$74$81$81$82$83 5.0%3.0%12.2%13.3%13.2%13.2%13.1% Memo: Store Count304293292206206206206206206 Full-Price178168165129129129129129129 Outlet / Factory126125127777777777777 Memo: E-Commerce Penetration40.2%46.9%58.4%64.3%63.4%65.1%66.6%68.1%69.4% Estimate FY20FY21FY22FY23FY24FY25FY26 Actual FY18FY19 |
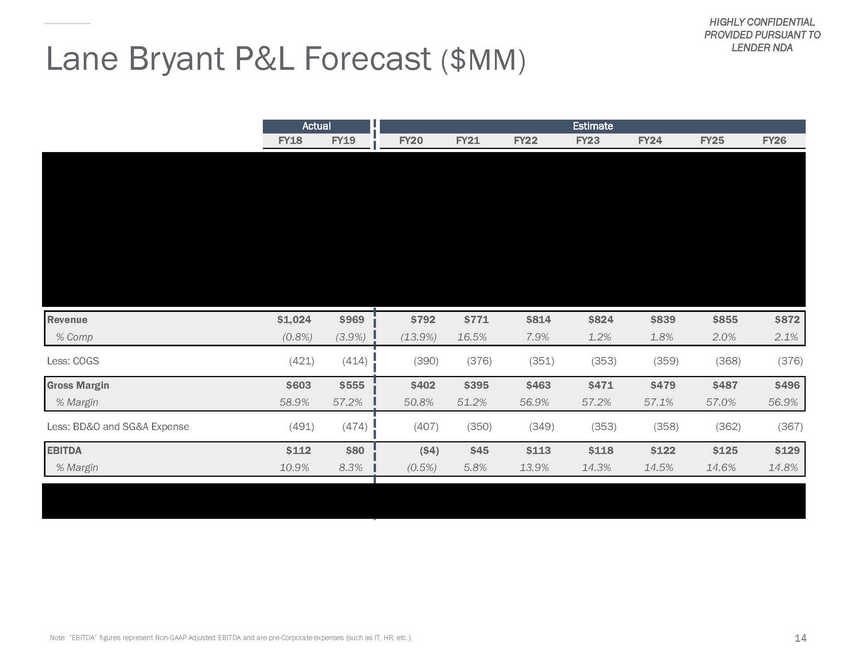 |
HIGHLY CONFIDENTIAL PROVIDED PURSUANT TO LENDER NDA Lane Bryant P&L Forecast ($MM) 14 Note: “EBITDA” figures represent Non-GAAP Adjusted EBITDA and are pre-Corporate expenses (such as IT, HR, etc.). Net Store Sales$707$611$391$355$361$350$343$336$329 % of Sales69.1%63.1%49.4%46.1%44.3%42.5%40.9%39.3%37.8% % Comp(7.5%)(11.4%)(31.1%)33.0%10.2%(3.0%)(2.0%)(2.0%)(2.0%) E-Commerce Sales, Net268307362378401421442464487 % of Sales26.2%31.7%45.7%49.0%49.2%51.1%52.7%54.2%55.8% % Comp21.8%15.0%18.0%4.5%6.0%5.0%5.0%5.0%5.0% Other485139385253545556 % of Sales4.7%5.3%5.0%4.9%6.4%6.4%6.4%6.4%6.4% Revenue$1,024$969 % Comp(0.8%)(3.9%) $792$771$814$824$839$855$872 (13.9%)16.5%7.9%1.2%1.8%2.0%2.1% Less: COGS(421)(414) (390)(376)(351)(353)(359)(368)(376) Gross Margin$603$555 % Margin58.9%57.2% $402$395$463$471$479$487$496 50.8%51.2%56.9%57.2%57.1%57.0%56.9% Less: BD&O and SG&A Expense(491)(474) (407)(350)(349)(353)(358)(362)(367) EBITDA$112$80 % Margin10.9%8.3% ($4)$45$113$118$122$125$129 (0.5%)5.8%13.9%14.3%14.5%14.6%14.8% Memo: Store Count749721657434434434434434434 Memo: E-Commerce Penetration27.5%33.4%48.0%51.5%52.6%54.6%56.3%58.0%59.6% Estimate FY20FY21FY22FY23FY24FY25FY26 Actual FY18FY19 |
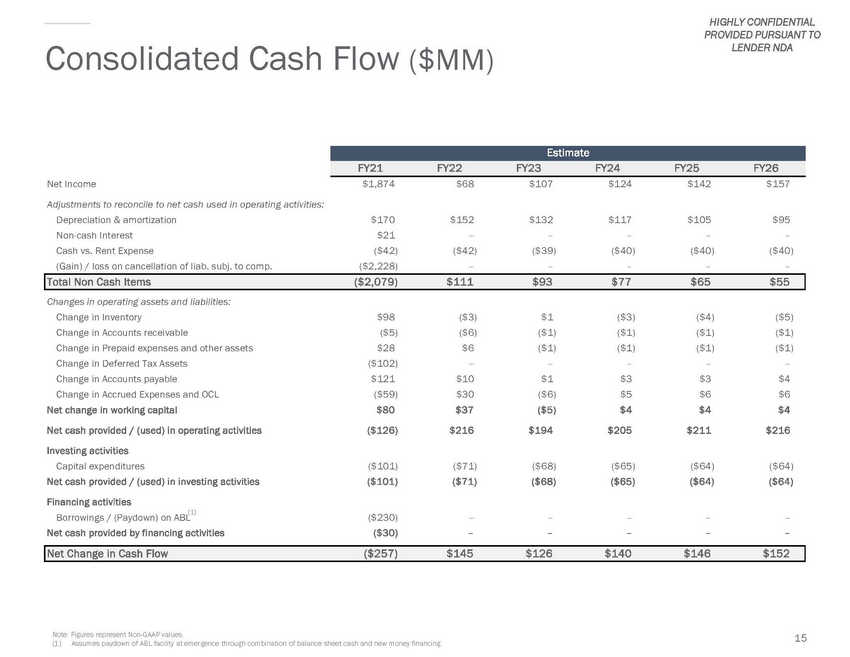 |
HIGHLY CONFIDENTIAL PROVIDED PURSUANT TO LENDER NDA Consolidated Cash Flow ($MM) Net Income Adjustments to reconcile to net cash used in operating activities: Depreciation & amortization Non-cash Interest Cash vs. Rent Expense (Gain) / loss on cancellation of liab. subj. to comp. $1,874 $68 $107 $124 $142 $157 $170 $21 ($42) ($2,228) $152 – ($42) – $132 – ($39) – $117 – ($40) – $105 – ($40) – $95 – ($40) – Changes in operating assets and liabilities: Change in Inventory Change in Accounts receivable Change in Prepaid expenses and other assets Change in Deferred Tax Assets Change in Accounts payable Change in Accrued Expenses and OCL Net change in working capital Net cash provided / (used) in operating activities Investing activities Capital expenditures Net cash provided / (used) in investing activities Financing activities $98 ($5) $28 ($102) $121 ($59) $80 ($126) ($3) ($6) $6 – $10 $30 $37 $216 $1 ($1) ($1) – $1 ($6) ($5) $194 ($3) ($1) ($1) – $3 $5 $4 $205 ($4) ($1) ($1) – $3 $6 $4 $211 ($5) ($1) ($1) – $4 $6 $4 $216 ($101) ($101) ($71) ($71) ($68) ($68) ($65) ($65) ($64) ($64) ($64) ($64) (1) Borrowings / (Paydown) on ABL ($230) ($30) – – – – – – – – – – Net cash provided by financing activities Note: Figures represent Non-GAAP values. (1) Assumes paydown of ABL facility at emergence through combination of balance sheet cash and new money financing. 15 Net Change in Cash Flow($257)$145$126$140$146$152 Total Non Cash Items($2,079)$111$93$77$65$55 Estimate FY21FY22FY23FY24FY25FY26 |
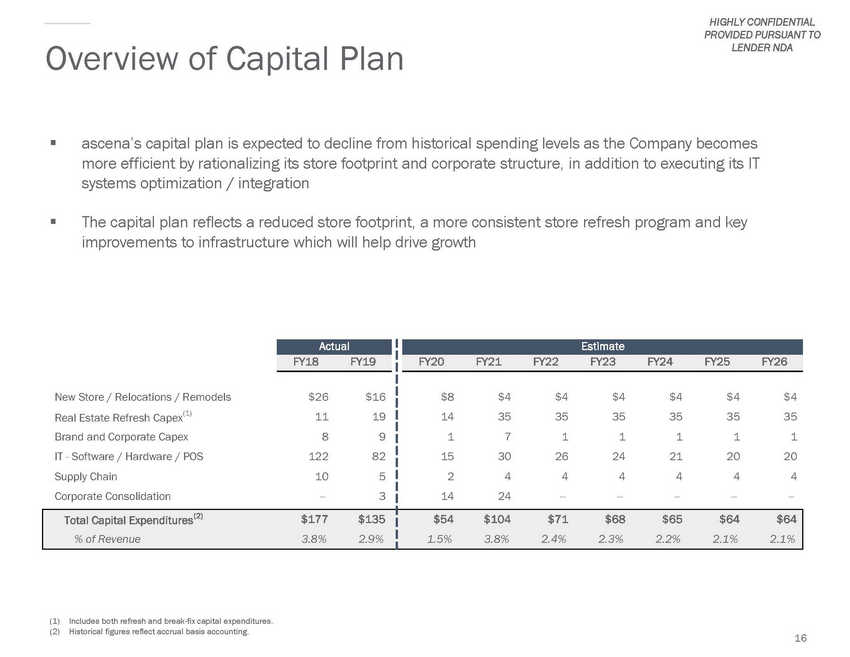 |
HIGHLY CONFIDENTIAL PROVIDED PURSUANT TO LENDER NDA Overview of Capital Plan ▪ ascena’s capital plan is expected to decline from historical spending levels as the Company becomes more efficient by rationalizing its store footprint and corporate structure, in addition to executing its IT systems optimization / integration ▪ The capital plan reflects a reduced store footprint, a more consistent store refresh program and key improvements to infrastructure which will help drive growth (1) (2) Includes both refresh and break-fix capital expenditures. Historical figures reflect accrual basis accounting. 16 New Store / Relocations / Remodels $26 $16 Real Estate Refresh Capex(1) 11 19 Brand and Corporate Capex 8 9 IT - Software / Hardware / POS 122 82 Supply Chain 10 5 Corporate Consolidation --3 $8 $4 $4 $4 $4 $4 $4 14 35 35 35 35 35 35 1 7 1 1 1 1 1 15 30 26 24 21 20 20 2 4 4 4 4 4 4 14 24 ---- ---- --Total Capital Expenditures(2) $177 $135 % of Revenue 3.8% 2.9% $54 $104 $71 $68 $65 $64 $64 1.5% 3.8% 2.4% 2.3% 2.2% 2.1% 2.1% Estimate FY20 FY21 FY22 FY23 FY24 FY25 FY26 Actual FY18 FY19 |
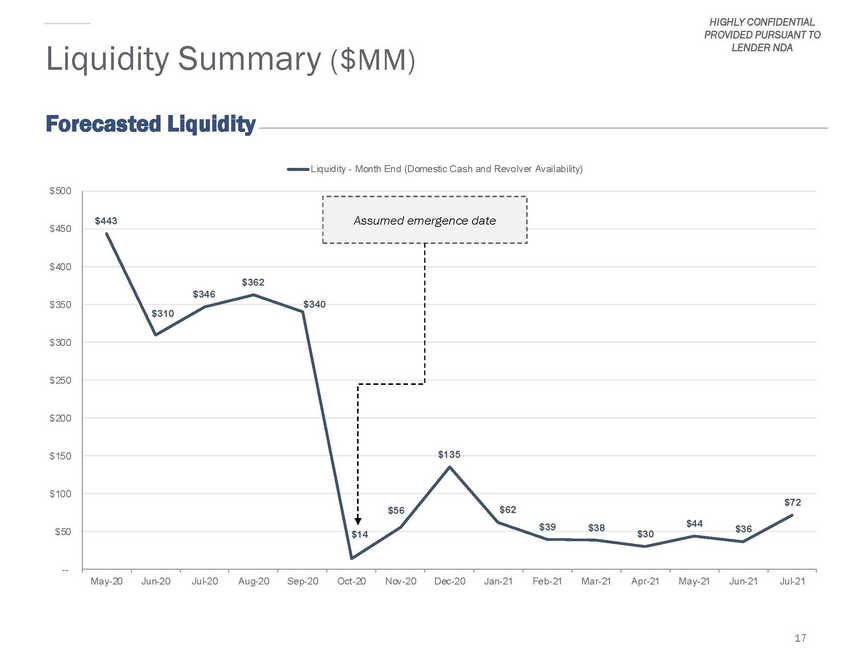 |
HIGHLY CONFIDENTIAL PROVIDED PURSUANT TO LENDER NDA Liquidity Summary ($MM) Forecasted Liquidity Liquidity - Month End (Domestic Cash and Revolver Availability) $500 $450 $400 $350 $340 $300 $250 $200 $135 $150 $100 $62 $56 $50 --May-20 Jun-20 Jul-20 Aug-20 Sep-20 Oct-20 Nov-20 Dec-20 Jan-21 Feb-21 Mar-21 Apr-21 May-21 Jun-21 Jul-21 17 $443 Assumed emergence date $362 $346 $310 $72 $39$38$44$36 $14$30 |
 |
HIGHLY CONFIDENTIAL PROVIDED PURSUANT TO LENDER NDA Additional Disclosure ▪ Continued shift away from malls (75% non-mall) with an average next lease action date of <2 years ▪ Significant progress of SG&A expenses made to date (~$150 million of cost savings in FY’20) ▪ Justice FY 2019 e-commerce penetration of 17%. 18 |