Attached files
| file | filename |
|---|---|
| EX-99.1 - EX-99.1 - Alpine Income Property Trust, Inc. | tmb-20200722xex99d1.htm |
| 8-K - 8-K - Alpine Income Property Trust, Inc. | tmb-20200722x8k.htm |
Exhibit 99.2
| INVESTOR PRESENTATION SECOND QUARTER 2020 JULY 2020 (NYSE:PINE) |
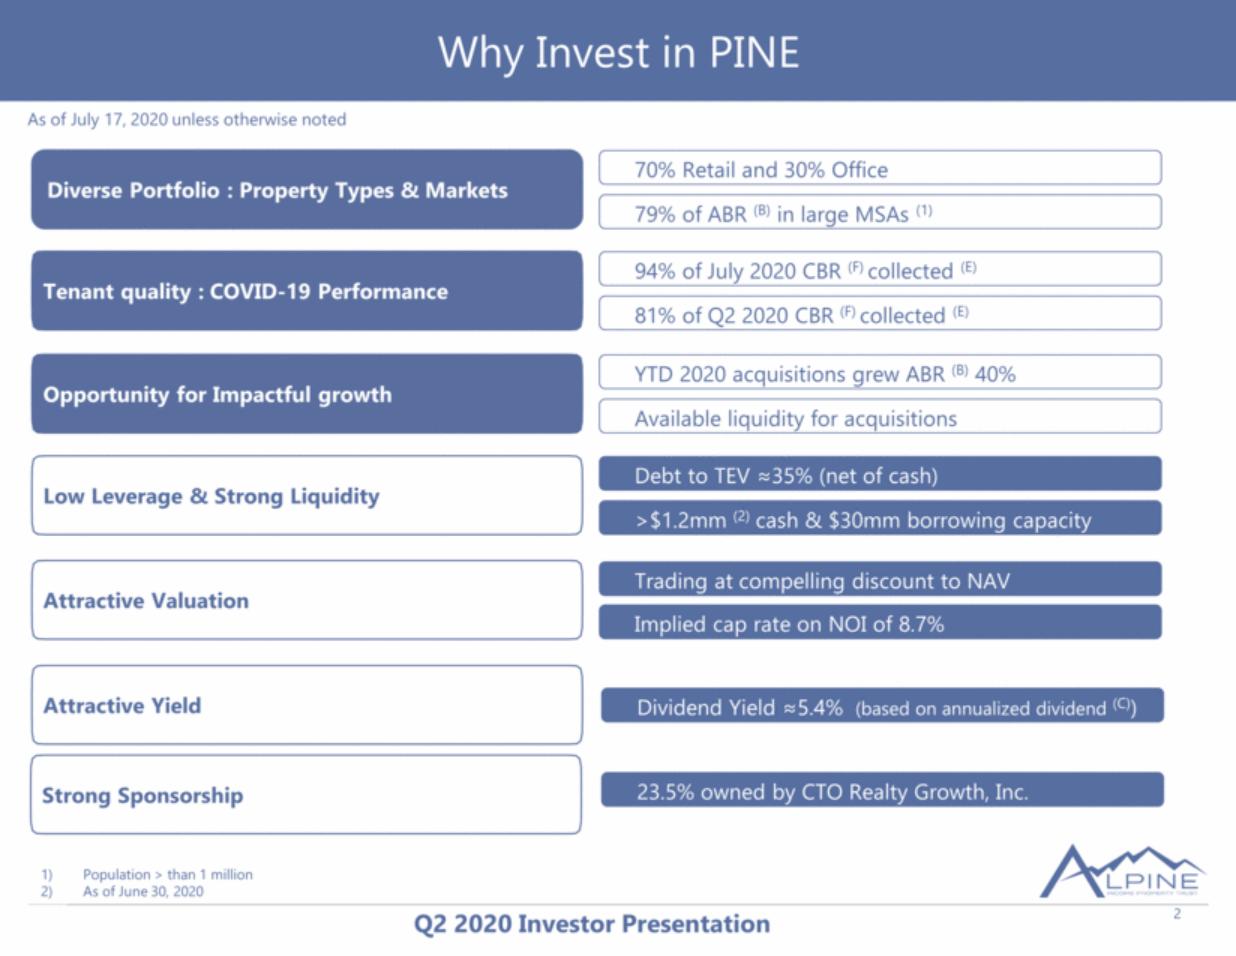
| 2 Diverse Portfolio : Property Types & Markets Tenant quality : COVID-19 Performance 70% Retail and 30% Office 79% of ABR (B) in large MSAs (1) Opportunity for Impactful growth Attractive Valuation Attractive Yield Trading at compelling discount to NAV Implied cap rate on NOI of 8.7% 94% of July 2020 CBR (F) collected (E) 81% of Q2 2020 CBR (F) collected (E) YTD 2020 acquisitions grew ABR (B) 40% Available liquidity for acquisitions Dividend Yield ≈5.4% (based on annualized dividend (C)) Population > than 1 million As of June 30, 2020 Low Leverage & Strong Liquidity Debt to TEV ≈35% (net of cash) >$1.2mm (2) cash & $30mm borrowing capacity Why Invest in PINE As of July 17, 2020 unless otherwise noted Strong Sponsorship 23.5% owned by CTO Realty Growth, Inc. |
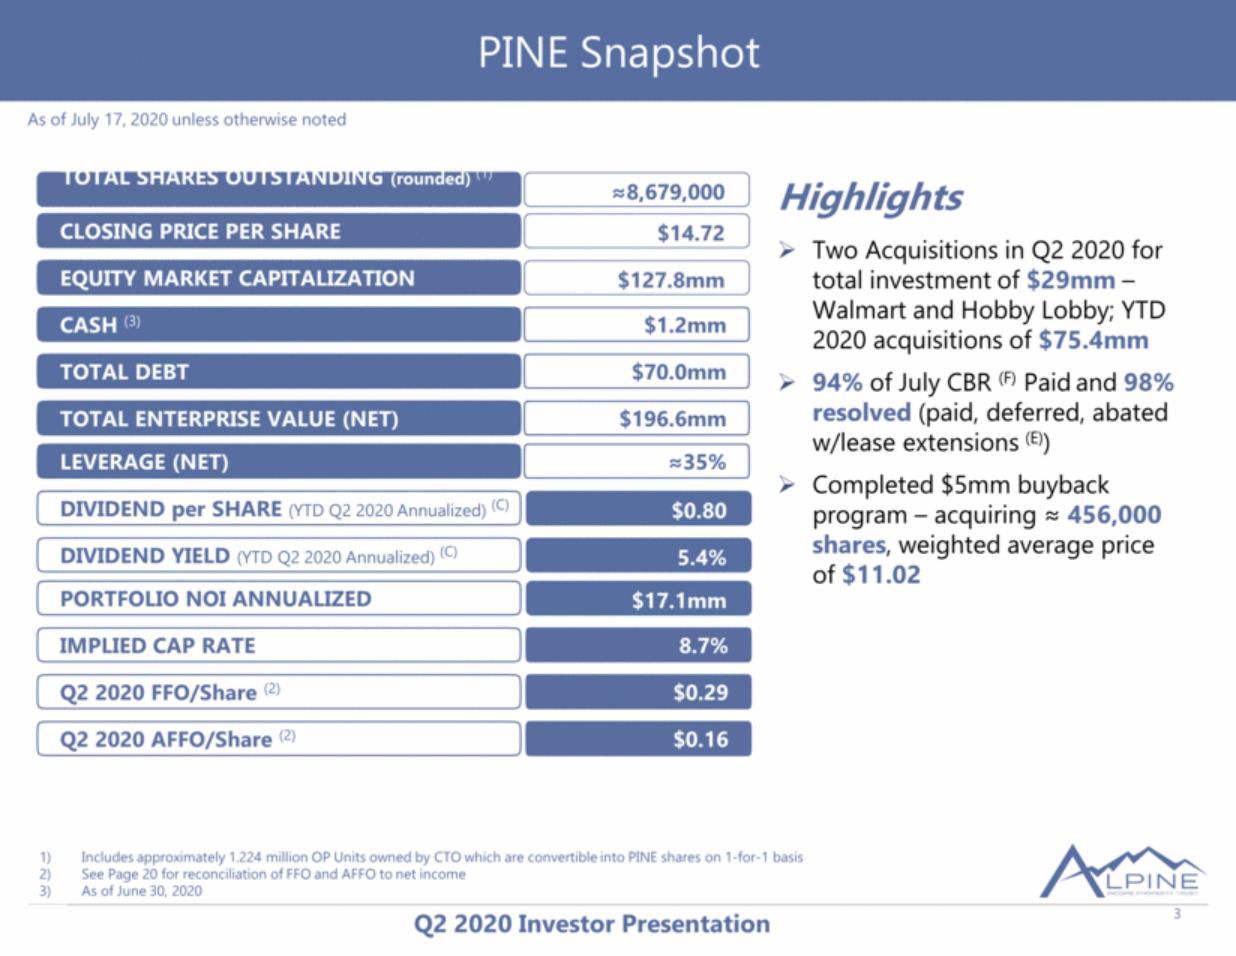
| 3 TOTAL SHARES OUTSTANDING (rounded) (1) ≈8,679,000 CLOSING PRICE PER SHARE IMPLIED CAP RATE CASH (3) $14.72 8.7% $1.2mm EQUITY MARKET CAPITALIZATION $127.8mm PORTFOLIO NOI ANNUALIZED $17.1mm TOTAL DEBT $70.0mm TOTAL ENTERPRISE VALUE (NET) $196.6mm LEVERAGE (NET) ≈35% Q2 2020 FFO/Share (2) $0.29 Q2 2020 AFFO/Share (2) $0.16 DIVIDEND per SHARE (YTD Q2 2020 Annualized) (C) $0.80 Includes approximately 1.224 million OP Units owned by CTO which are convertible into PINE shares on 1-for-1 basis See Page 20 for reconciliation of FFO and AFFO to net income As of June 30, 2020 Highlights Two Acquisitions in Q2 2020 for total investment of $29mm – Walmart and Hobby Lobby; YTD 2020 acquisitions of $75.4mm 94% of July CBR (F) Paid and 98% resolved (paid, deferred, abated w/lease extensions (E)) Completed $5mm buyback program – acquiring ≈ 456,000 shares, weighted average price of $11.02 DIVIDEND YIELD (YTD Q2 2020 Annualized) (C) 5.4% PINE Snapshot As of July 17, 2020 unless otherwise noted |
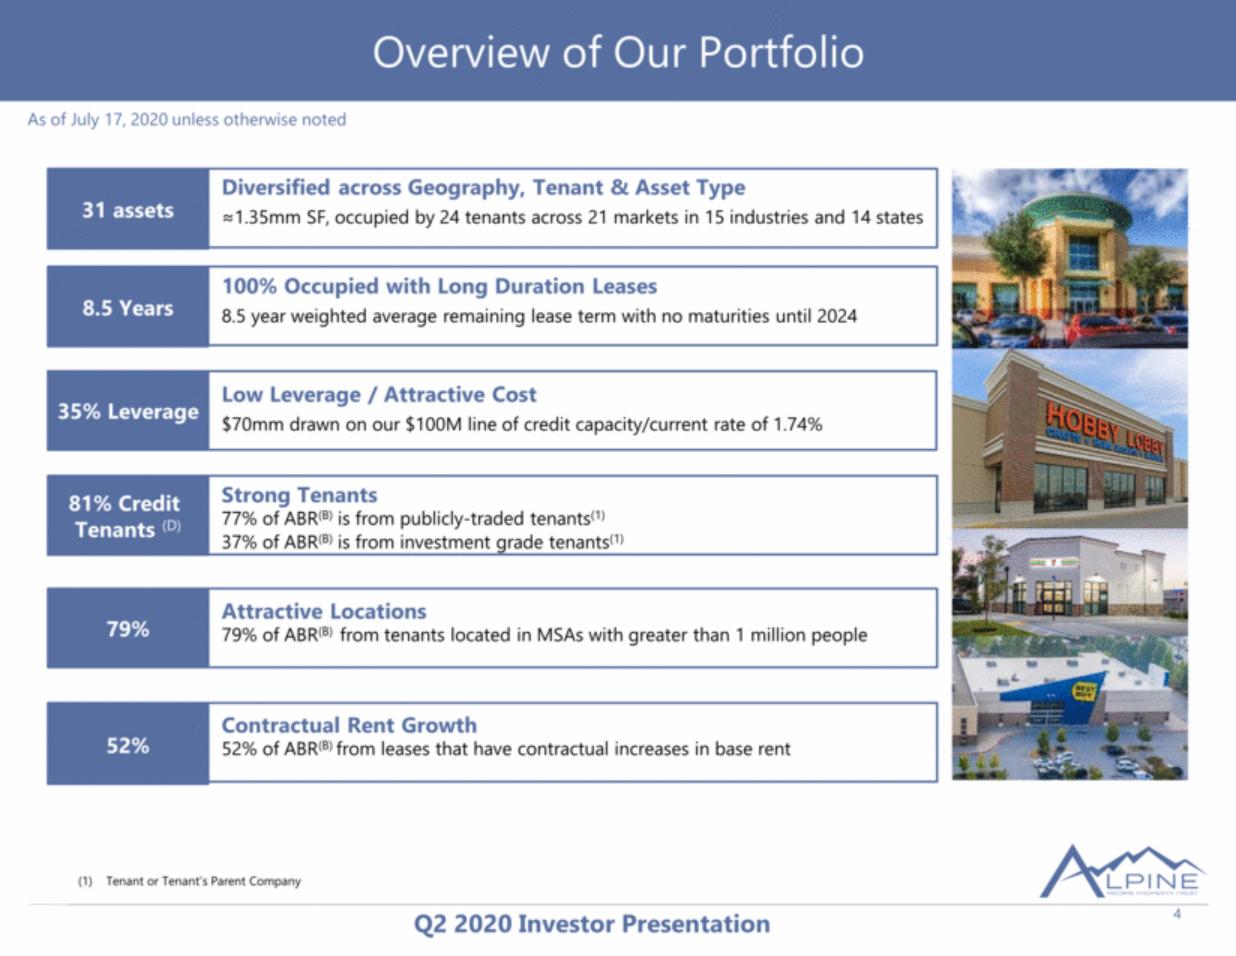
| 4 Overview of Our Portfolio Tenant or Tenant’s Parent Company 8.5 Years 100% Occupied with Long Duration Leases 8.5 year weighted average remaining lease term with no maturities until 2024 52% Contractual Rent Growth 52% of ABR(B) from leases that have contractual increases in base rent 35% Leverage Low Leverage / Attractive Cost $70mm drawn on our $100M line of credit capacity/current rate of 1.74% 31 assets Diversified across Geography, Tenant & Asset Type ≈1.35mm SF, occupied by 24 tenants across 21 markets in 15 industries and 14 states 81% Credit Tenants (D) Strong Tenants 77% of ABR(B) is from publicly-traded tenants(1) 37% of ABR(B) is from investment grade tenants(1) 79% Attractive Locations 79% of ABR(B) from tenants located in MSAs with greater than 1 million people As of July 17, 2020 unless otherwise noted |
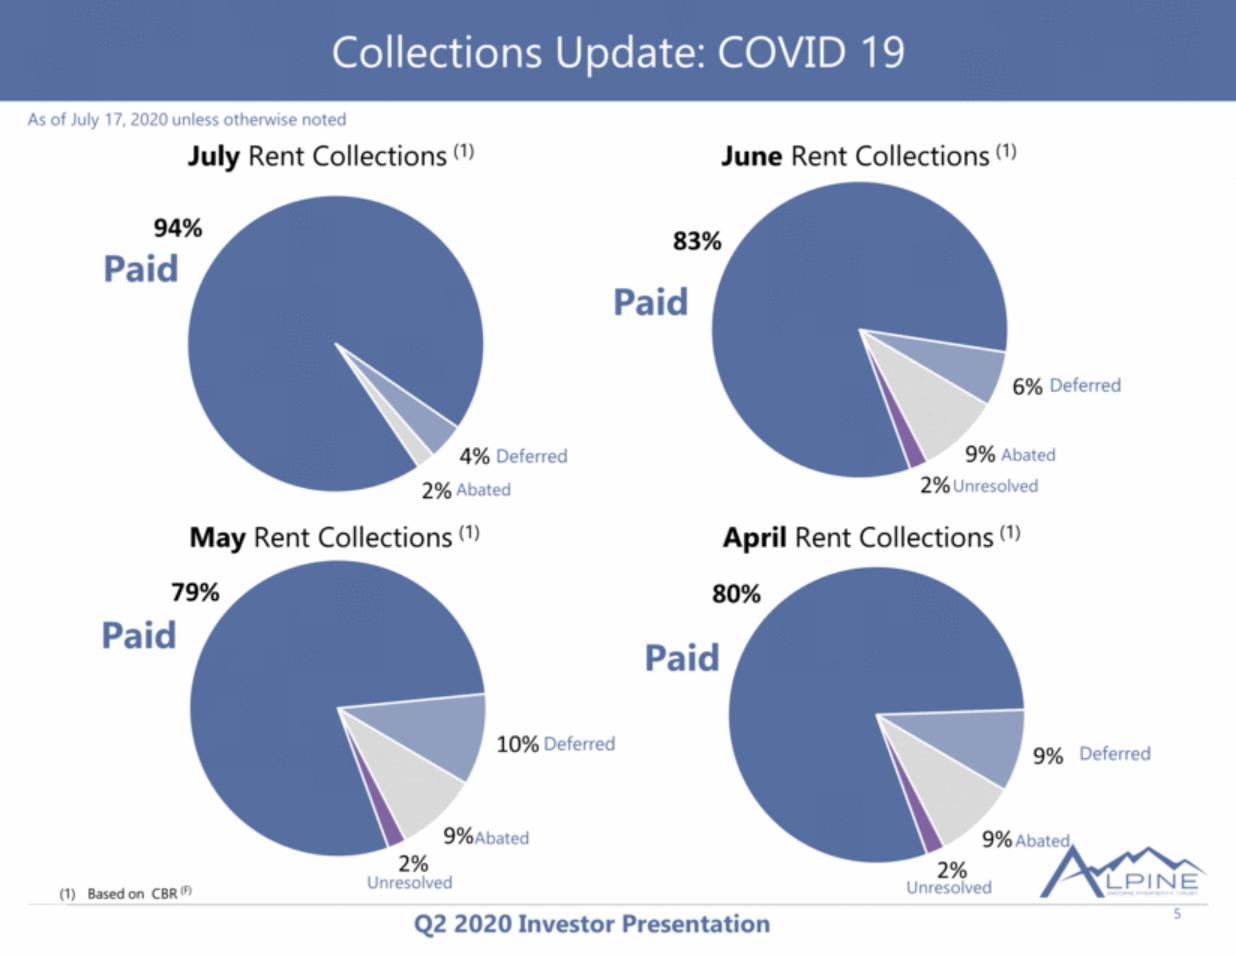
| 5 As of July 17, 2020 unless otherwise noted Paid Deferred Abated Based on CBR (F) Collections Update: COVID 19 July Rent Collections (1) June Rent Collections (1) May Rent Collections (1) April Rent Collections (1) Paid Paid Paid Unresolved Deferred Abated Unresolved Deferred Abated Unresolved Deferred Abated 94% 4% 2% 80% 9% 9% 2% 79% 10% 9% 2% 83% 6% 9% 2% |
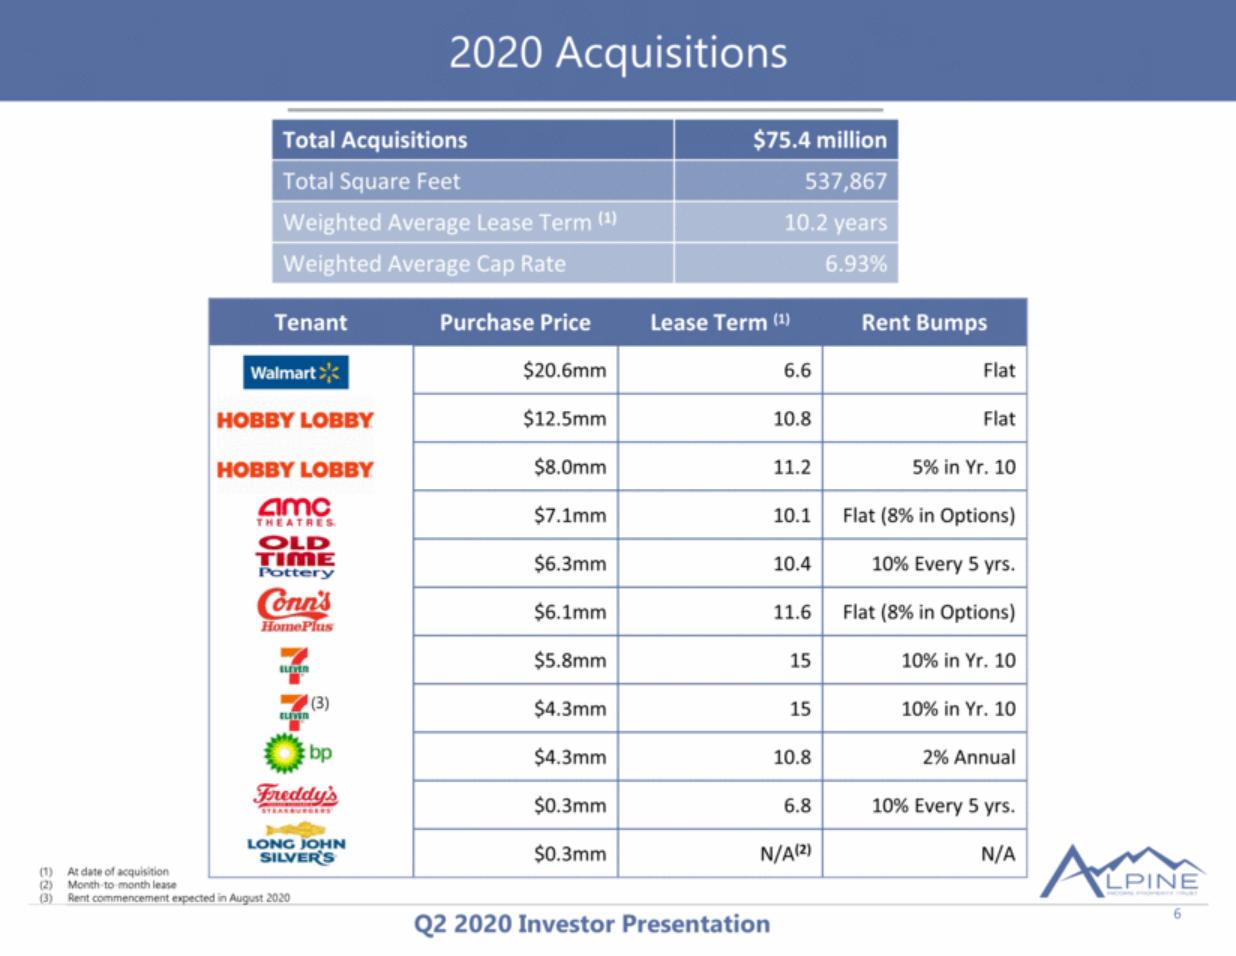
| Tenant Purchase Price Lease Term (1) Rent Bumps $20.6mm 6.6 Flat $12.5mm 10.8 Flat $8.0mm 11.2 5% in Yr. 10 $7.1mm 10.1 Flat (8% in Options) $6.3mm 10.4 10% Every 5 yrs. $6.1mm 11.6 Flat (8% in Options) $5.8mm 15 10% in Yr. 10 $4.3mm 15 10% in Yr. 10 $4.3mm 10.8 2% Annual $0.3mm 6.8 10% Every 5 yrs. $0.3mm N/A(2) N/A 6 Total Acquisitions $75.4 million Total Square Feet 537,867 Weighted Average Lease Term (1) 10.2 years Weighted Average Cap Rate 6.93% At date of acquisition Month-to-month lease Rent commencement expected in August 2020 (3) 2020 Acquisitions |
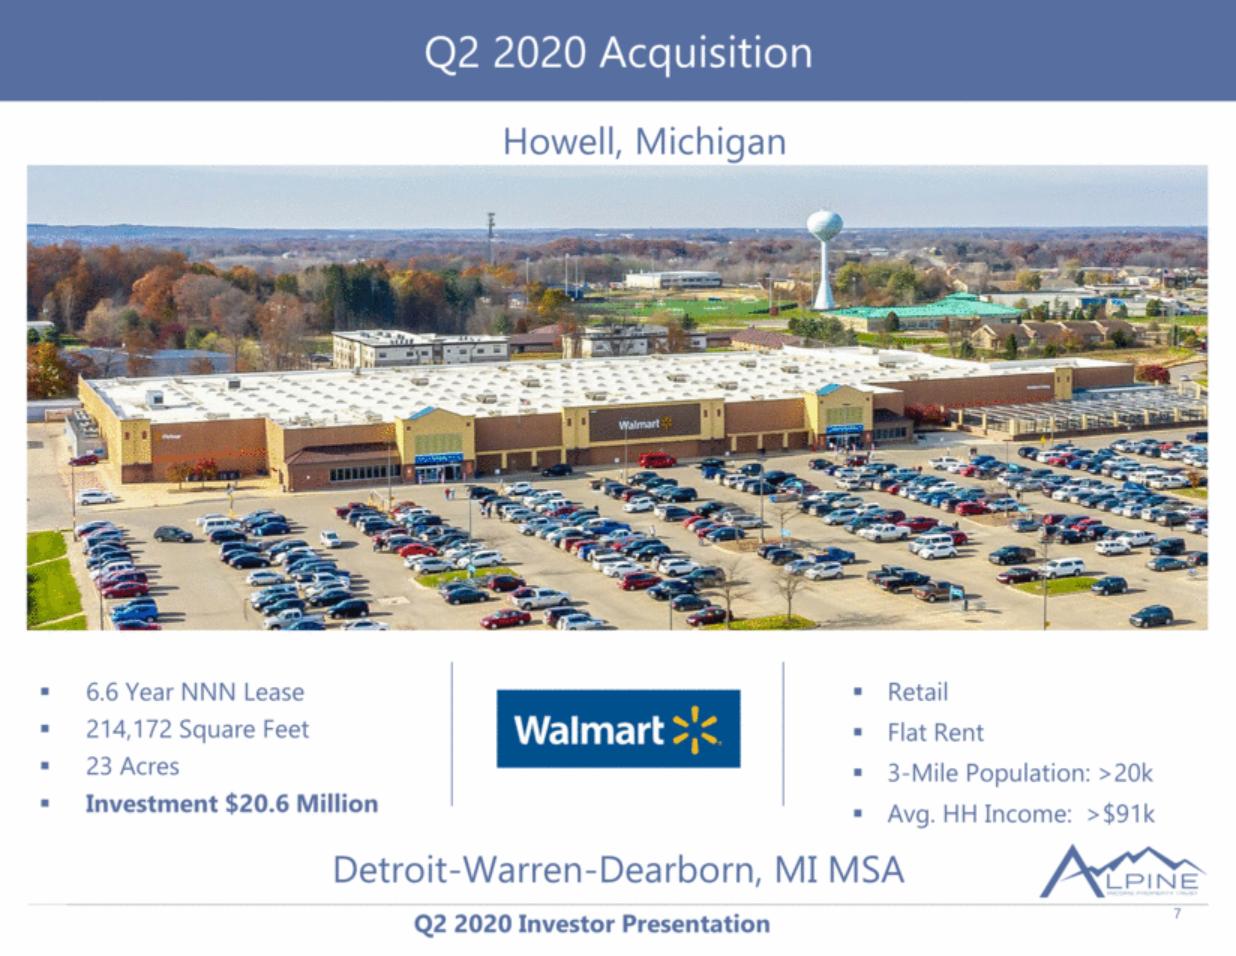
| 7 Q2 2020 Acquisition Retail Flat Rent 3-Mile Population: >20k Avg. HH Income: >$91k 6.6 Year NNN Lease 214,172 Square Feet 23 Acres Investment $20.6 Million Detroit-Warren-Dearborn, MI MSA Howell, Michigan |
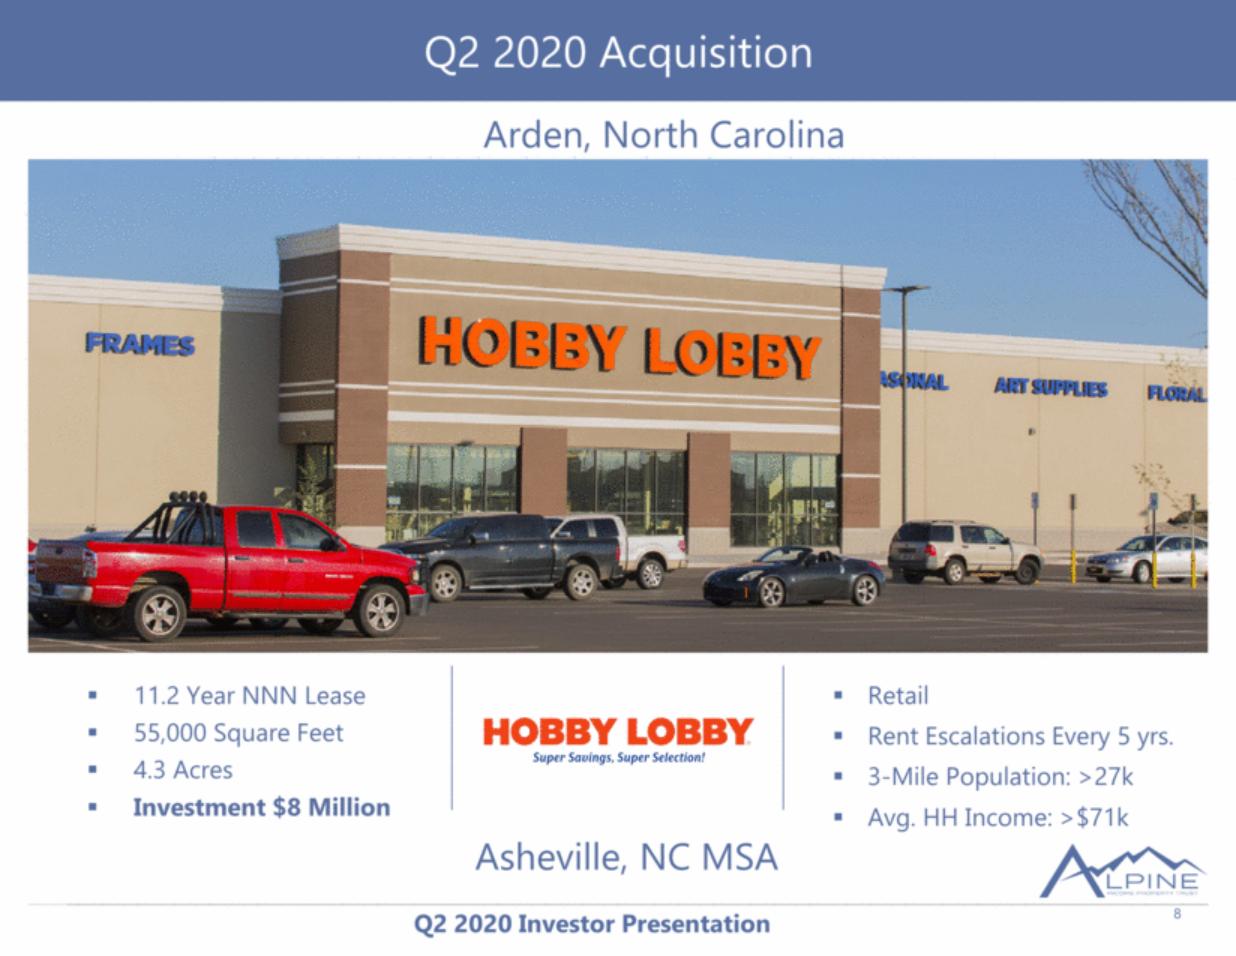
| 8 Q2 2020 Acquisition Retail Rent Escalations Every 5 yrs. 3-Mile Population: >27k Avg. HH Income: >$71k 11.2 Year NNN Lease 55,000 Square Feet 4.3 Acres Investment $8 Million Asheville, NC MSA Arden, North Carolina |
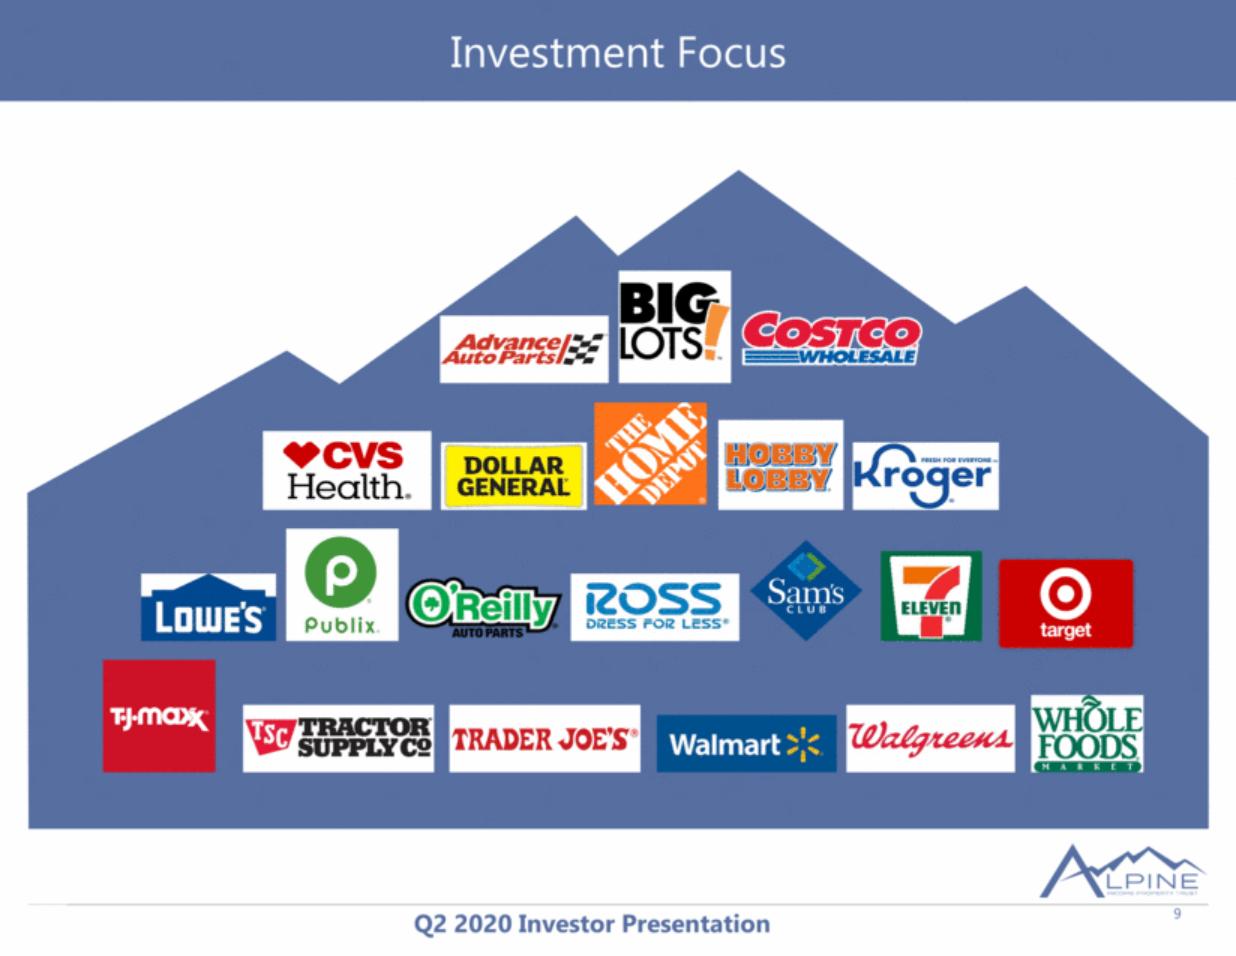
| 9 Investment Focus |
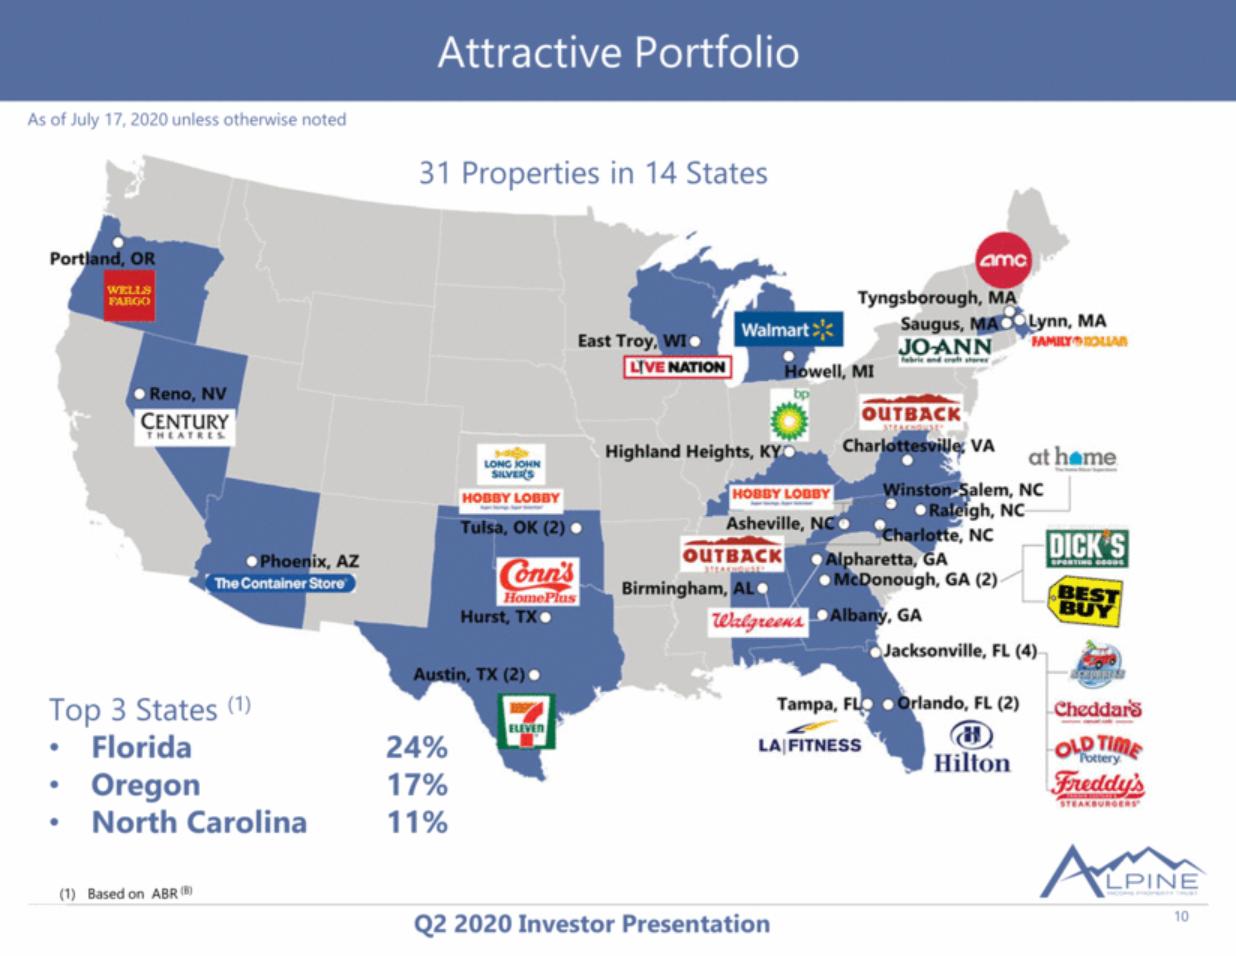
| 10 31 Properties in 14 States Attractive Portfolio As of July 17, 2020 unless otherwise noted Top 3 States (1) Florida 24% Oregon 17% North Carolina 11% Based on ABR (B) |
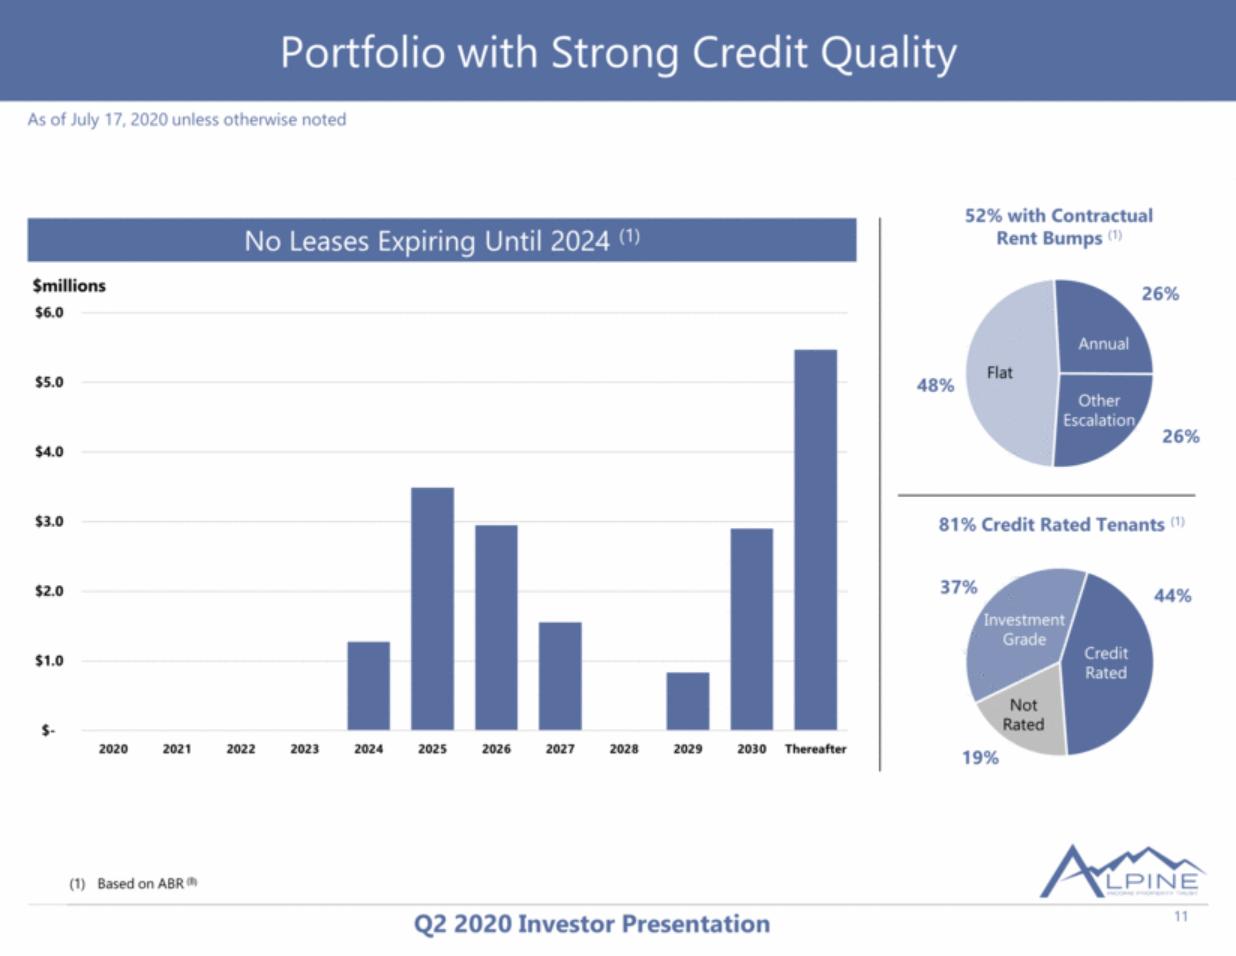
| 11 Portfolio with Strong Credit Quality No Leases Expiring Until 2024 (1) Based on ABR (B) 52% with Contractual Rent Bumps (1) Flat Annual Other Escalation 81% Credit Rated Tenants (1) Credit Rated Investment Grade Not Rated $millions As of July 17, 2020 unless otherwise noted $- $1.0 $2.0 $3.0 $4.0 $5.0 $6.0 2020 2021 2022 2023 2024 2025 2026 2027 2028 2029 2030 Thereafter 48% 26% 26% 37% 44% 19% |
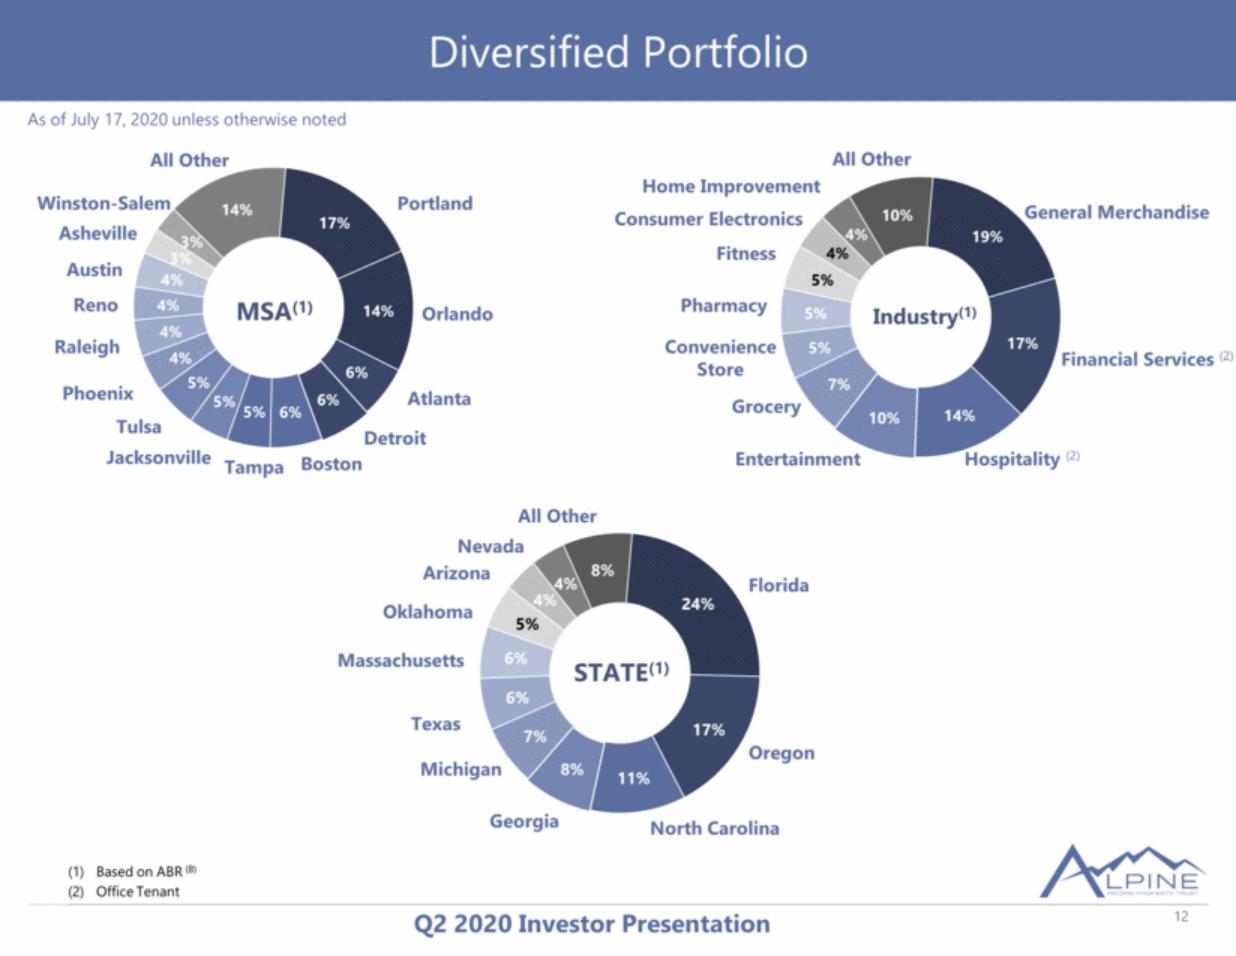
| Based on ABR (B) Office Tenant 12 STATE(1) Florida Oregon All Other Oklahoma Massachusetts Texas Georgia North Carolina Michigan Arizona Nevada MSA(1) Portland Orlando All Other Tulsa Jacksonville Tampa Boston Atlanta Phoenix Raleigh Reno Austin Detroit Asheville Winston-Salem Industry(1) General Merchandise Financial Services (2) All Other Pharmacy Convenience Store Entertainment Fitness Grocery Consumer Electronics Diversified Portfolio As of July 17, 2020 unless otherwise noted Hospitality (2) Home Improvement |
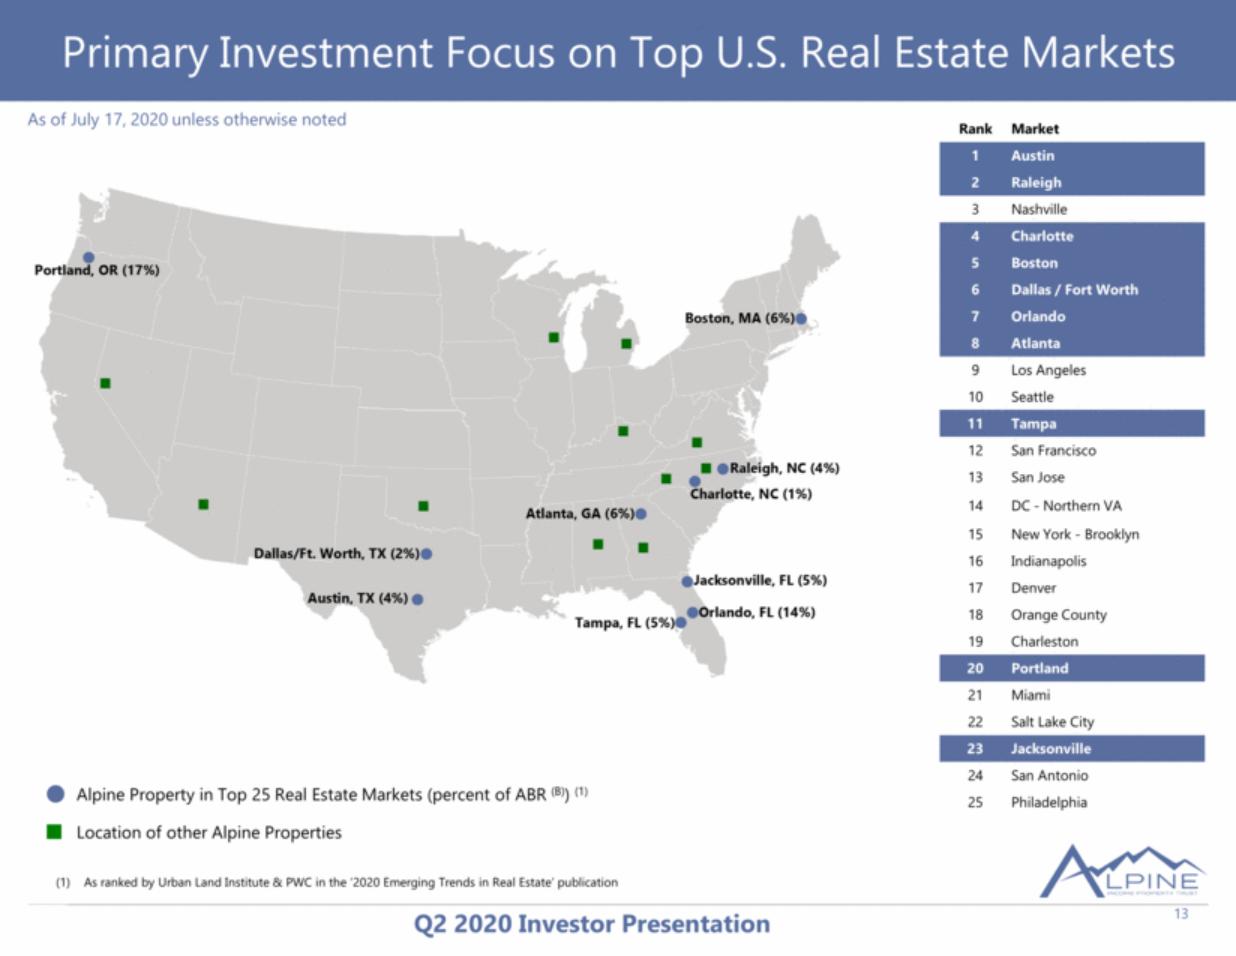
| 13 Rank Market 1 Austin 2 Raleigh 3 Nashville 4 Charlotte 5 Boston 6 Dallas / Fort Worth 7 Orlando 8 Atlanta 9 Los Angeles 10 Seattle 11 Tampa 12 San Francisco 13 San Jose 14 DC - Northern VA 15 New York - Brooklyn 16 Indianapolis 17 Denver 18 Orange County 19 Charleston 20 Portland 21 Miami 22 Salt Lake City 23 Jacksonville 24 San Antonio 25 Philadelphia As ranked by Urban Land Institute & PWC in the ‘2020 Emerging Trends in Real Estate’ publication Alpine Property in Top 25 Real Estate Markets (percent of ABR (B)) (1) Location of other Alpine Properties Primary Investment Focus on Top U.S. Real Estate Markets As of July 17, 2020 unless otherwise noted |
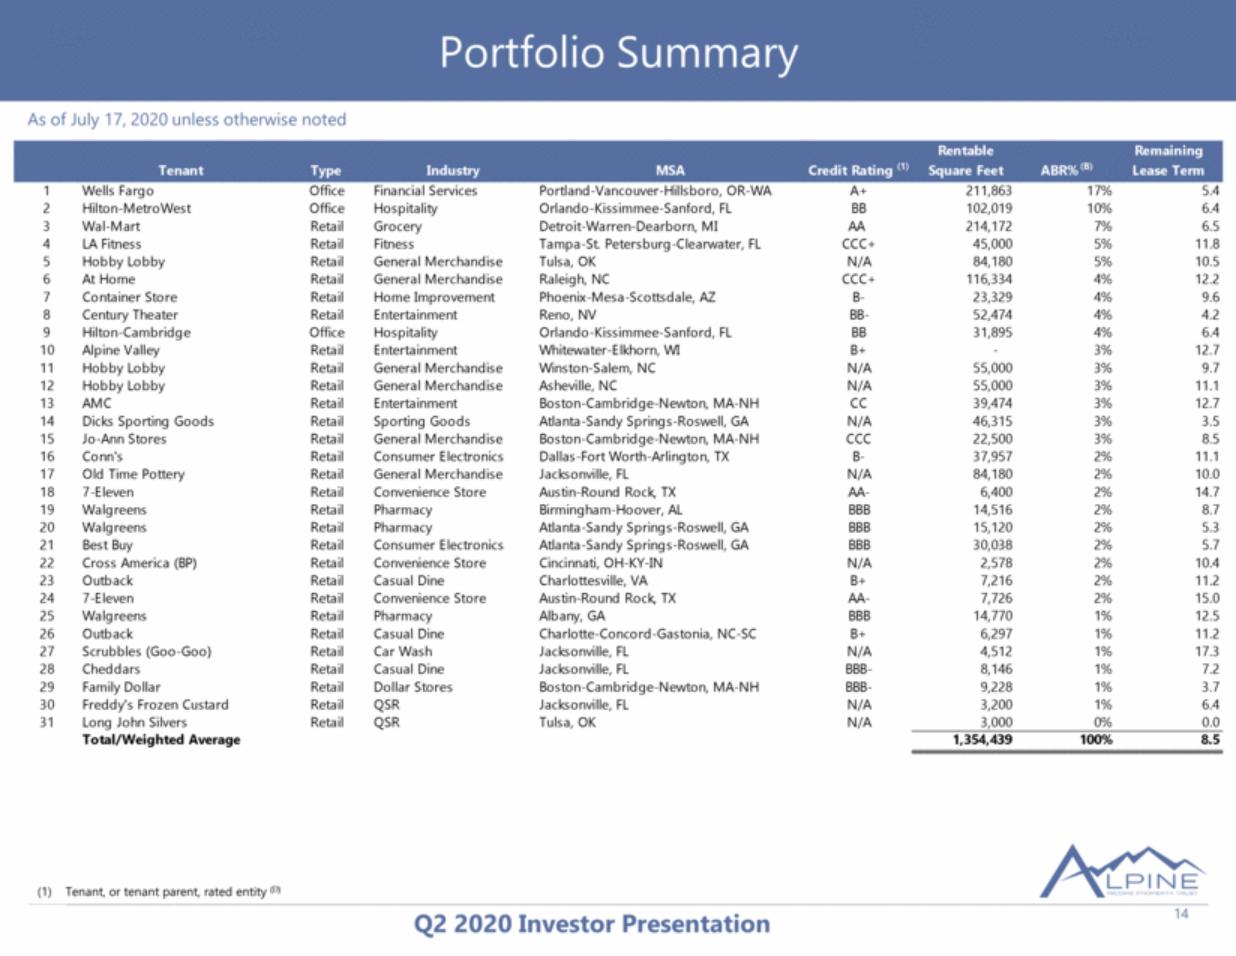
| 14 Tenant, or tenant parent, rated entity (D) Portfolio Summary As of July 17, 2020 unless otherwise noted Tenant Type Industry MSA Credit Rating (1) Rentable Square Feet ABR% (B) Remaining Lease Term 1 Wells Fargo Office Financial Services Portland-Vancouver-Hillsboro, OR-WA A+ 211,863 17% 5.4 2 Hilton-MetroWest Office Hospitality Orlando-Kissimmee-Sanford, FL BB 102,019 10% 6.4 3 Wal-Mart Retail Grocery Detroit-Warren-Dearborn, MI AA 214,172 7% 6.5 4 LA Fitness Retail Fitness Tampa-St. Petersburg-Clearwater, FL CCC+ 45,000 5% 11.8 5 Hobby Lobby Retail General Merchandise Tulsa, OK N/A 84,180 5% 10.5 6 At Home Retail General Merchandise Raleigh, NC CCC+ 116,334 4% 12.2 7 Container Store Retail Home Improvement Phoenix-Mesa-Scottsdale, AZ B- 23,329 4% 9.6 8 Century Theater Retail Entertainment Reno, NV BB- 52,474 4% 4.2 9 Hilton-Cambridge Office Hospitality Orlando-Kissimmee-Sanford, FL BB 31,895 4% 6.4 10 Alpine Valley Retail Entertainment Whitewater-Elkhorn, WI B+ - 3% 12.7 11 Hobby Lobby Retail General Merchandise Winston-Salem, NC N/A 55,000 3% 9.7 12 Hobby Lobby Retail General Merchandise Asheville, NC N/A 55,000 3% 11.1 13 AMC Retail Entertainment Boston-Cambridge-Newton, MA-NH CC 39,474 3% 12.7 14 Dicks Sporting Goods Retail Sporting Goods Atlanta-Sandy Springs-Roswell, GA N/A 46,315 3% 3.5 15 Jo-Ann Stores Retail General Merchandise Boston-Cambridge-Newton, MA-NH CCC 22,500 3% 8.5 16 Conn's Retail Consumer Electronics Dallas-Fort Worth-Arlington, TX B- 37,957 2% 11.1 17 Old Time Pottery Retail General Merchandise Jacksonville, FL N/A 84,180 2% 10.0 18 7-Eleven Retail Convenience Store Austin-Round Rock, TX AA- 6,400 2% 14.7 19 Walgreens Retail Pharmacy Birmingham-Hoover, AL BBB 14,516 2% 8.7 20 Walgreens Retail Pharmacy Atlanta-Sandy Springs-Roswell, GA BBB 15,120 2% 5.3 21 Best Buy Retail Consumer Electronics Atlanta-Sandy Springs-Roswell, GA BBB 30,038 2% 5.7 22 Cross America (BP) Retail Convenience Store Cincinnati, OH-KY-IN N/A 2,578 2% 10.4 23 Outback Retail Casual Dine Charlottesville, VA B+ 7,216 2% 11.2 24 7-Eleven Retail Convenience Store Austin-Round Rock, TX AA- 7,726 2% 15.0 25 Walgreens Retail Pharmacy Albany, GA BBB 14,770 1% 12.5 26 Outback Retail Casual Dine Charlotte-Concord-Gastonia, NC-SC B+ 6,297 1% 11.2 27 Scrubbles (Goo-Goo) Retail Car Wash Jacksonville, FL N/A 4,512 1% 17.3 28 Cheddars Retail Casual Dine Jacksonville, FL BBB- 8,146 1% 7.2 29 Family Dollar Retail Dollar Stores Boston-Cambridge-Newton, MA-NH BBB- 9,228 1% 3.7 30 Freddy's Frozen Custard Retail QSR Jacksonville, FL N/A 3,200 1% 6.4 31 Long John Silvers Retail QSR Tulsa, OK N/A 3,000 0% 0.0 Total/Weighted Average 1,354,439 100% 8.5 |
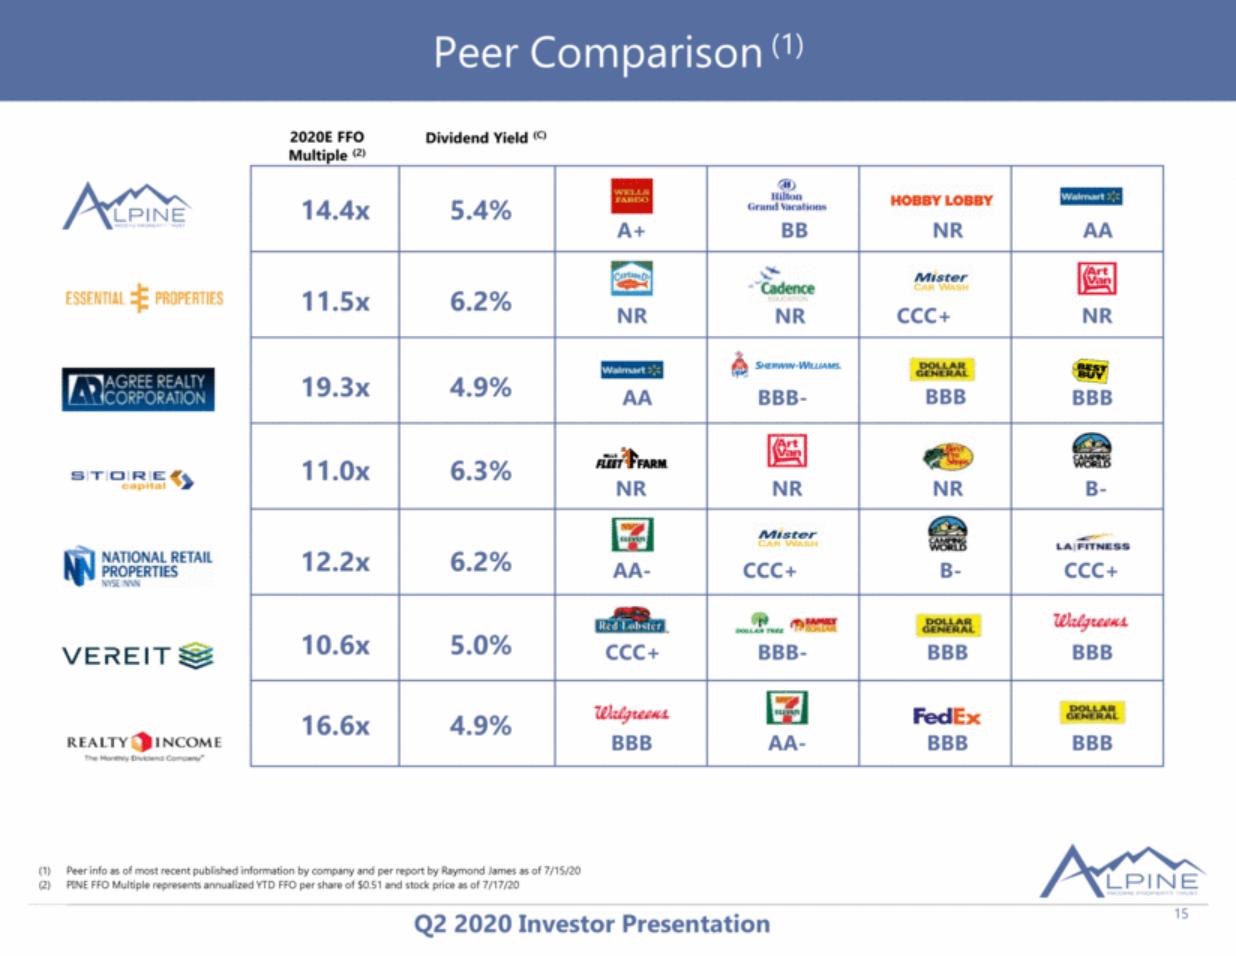
| Comparison with our Peers (1) 15 2020E FFO Multiple (2) A+ BB NR NR CCC+ NR AA BBB- NR NR NR B- AA- CCC+ B- CCC+ CCC+ BBB- BBB BBB AA- BBB BBB Peer info as of most recent published information by company and per report by Raymond James as of 7/15/20 PINE FFO Multiple represents annualized YTD FFO per share of $0.51 and stock price as of 7/17/20 BBB AA BBB Dividend Yield (C) 4.9% 6.2% 6.3% 6.2% 5.0% 4.9% 5.4% 19.3x 11.5x 11.0x 12.2x 10.6x 16.6x 14.4x NR BBB Peer Comparison (1) 15 |
| 16 Liquidity and Leverage Debt Schedule Principal Interest Rate Maturity Date Credit Facility w/swap $50.0 million 1.35%-1.95% + 0.48bps November 2023 Credit Facility $20.0 million 1.35% - 1.95% + LIBOR November 2023 Total Debt/Weighted-Average Rate $70.0 million 1.74% Credit Facility ($000’s) $- $10,000 $20,000 $30,000 $40,000 $50,000 $60,000 $70,000 $80,000 $90,000 $100,000 $70,000 $30,000 Drawn Available |

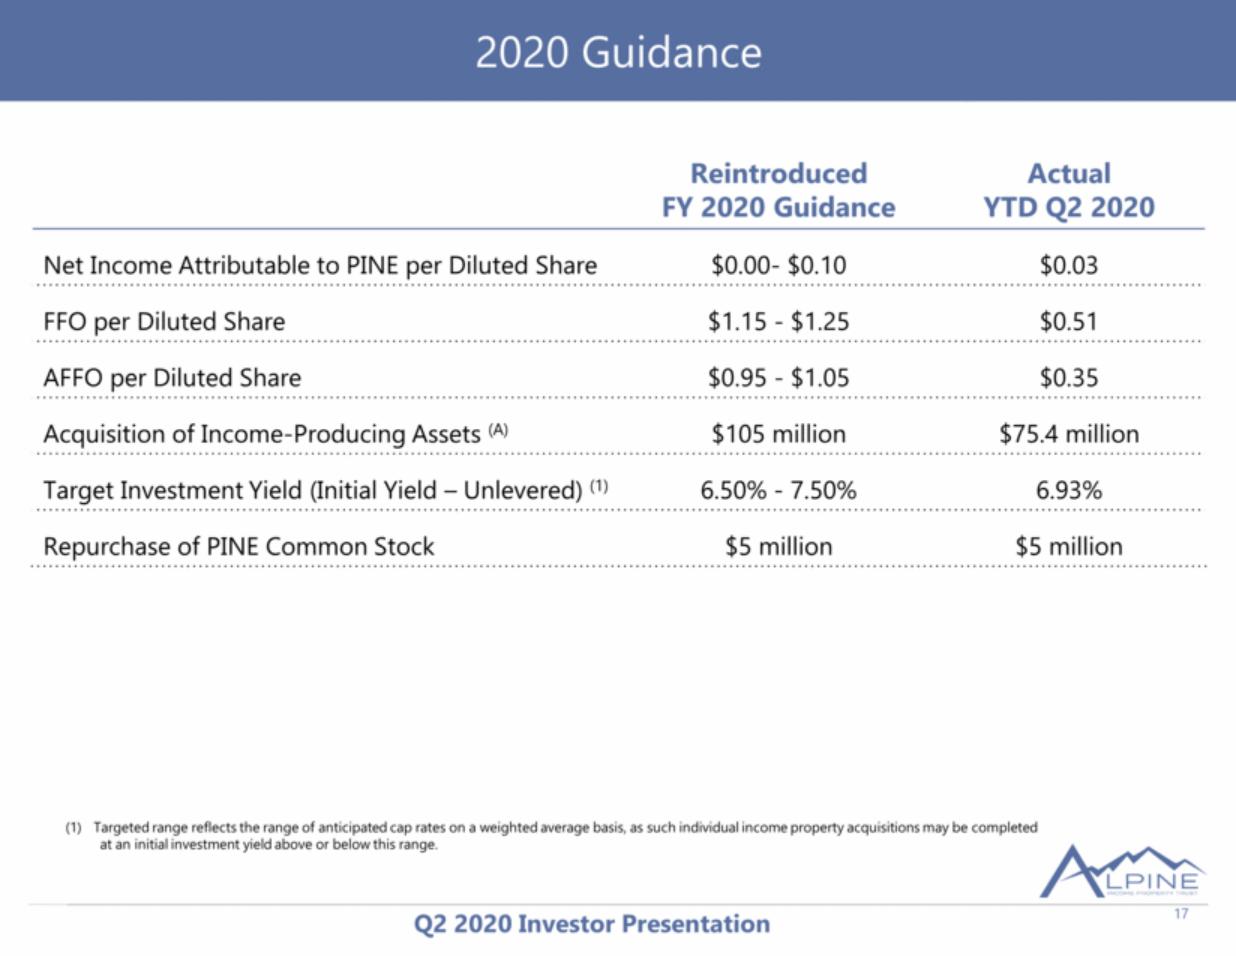
| 17 2020 Guidance Reintroduced FY 2020 Guidance Actual YTD Q2 2020 Net Income Attributable to PINE per Diluted Share $0.00- $0.10 $0.03 FFO per Diluted Share $1.15 - $1.25 $0.51 AFFO per Diluted Share $0.95 - $1.05 $0.35 Acquisition of Income-Producing Assets (A) $105 million $75.4 million Target Investment Yield (Initial Yield – Unlevered) (1) 6.50% - 7.50% 6.93% Repurchase of PINE Common Stock $5 million $5 million Targeted range reflects the range of anticipated cap rates on a weighted average basis, as such individual income property acquisitions may be completed at an initial investment yield above or below this range. |
| 18 Appendix |
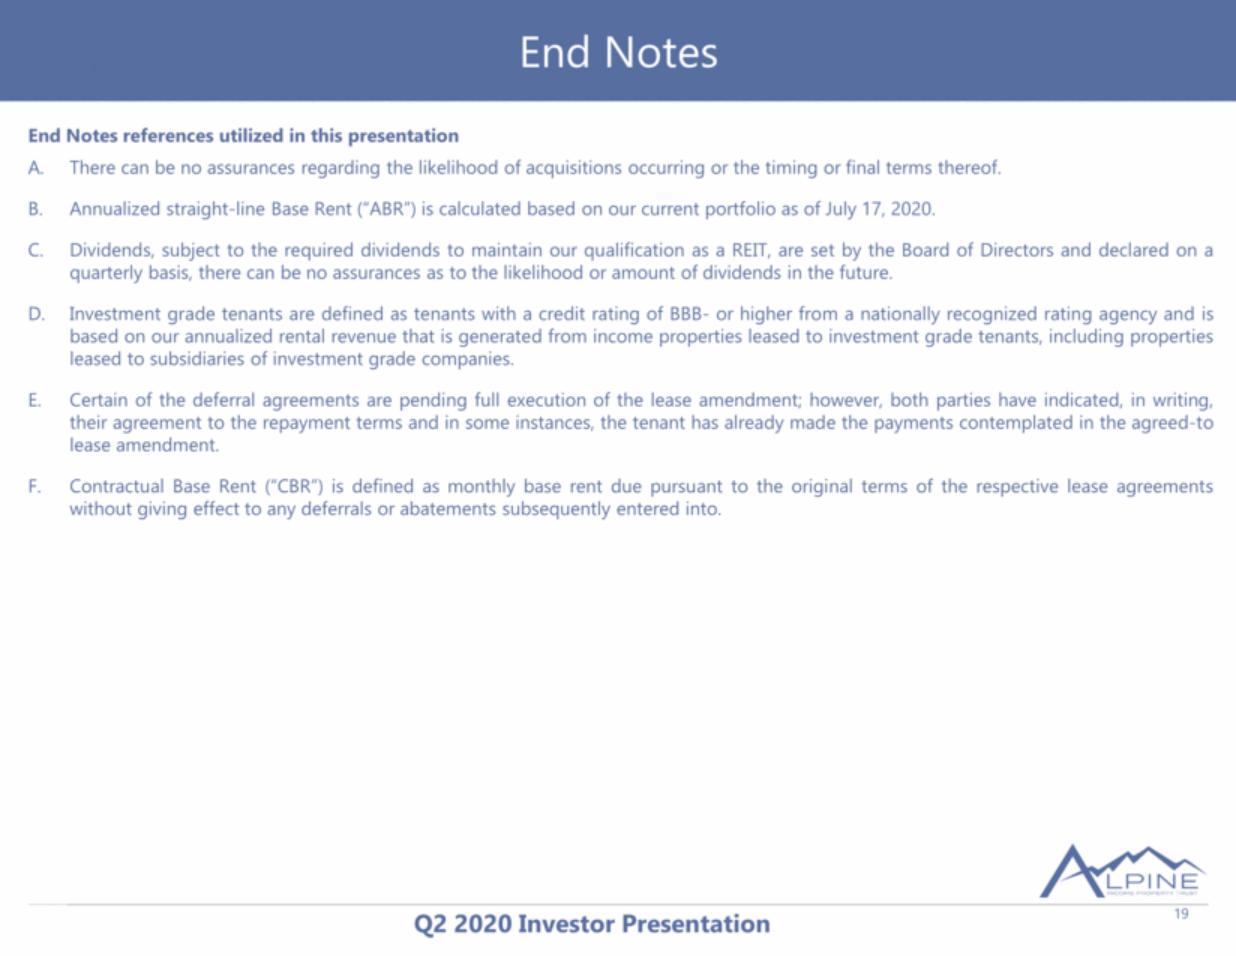
| 19 End Notes references utilized in this presentation There can be no assurances regarding the likelihood of acquisitions occurring or the timing or final terms thereof. Annualized straight-line Base Rent (“ABR”) is calculated based on our current portfolio as of July 17, 2020. Dividends, subject to the required dividends to maintain our qualification as a REIT, are set by the Board of Directors and declared on a quarterly basis, there can be no assurances as to the likelihood or amount of dividends in the future. Investment grade tenants are defined as tenants with a credit rating of BBB- or higher from a nationally recognized rating agency and is based on our annualized rental revenue that is generated from income properties leased to investment grade tenants, including properties leased to subsidiaries of investment grade companies. Certain of the deferral agreements are pending full execution of the lease amendment; however, both parties have indicated, in writing, their agreement to the repayment terms and in some instances, the tenant has already made the payments contemplated in the agreed-to lease amendment. Contractual Base Rent (“CBR”) is defined as monthly base rent due pursuant to the original terms of the respective lease agreements without giving effect to any deferrals or abatements subsequently entered into. End Notes |
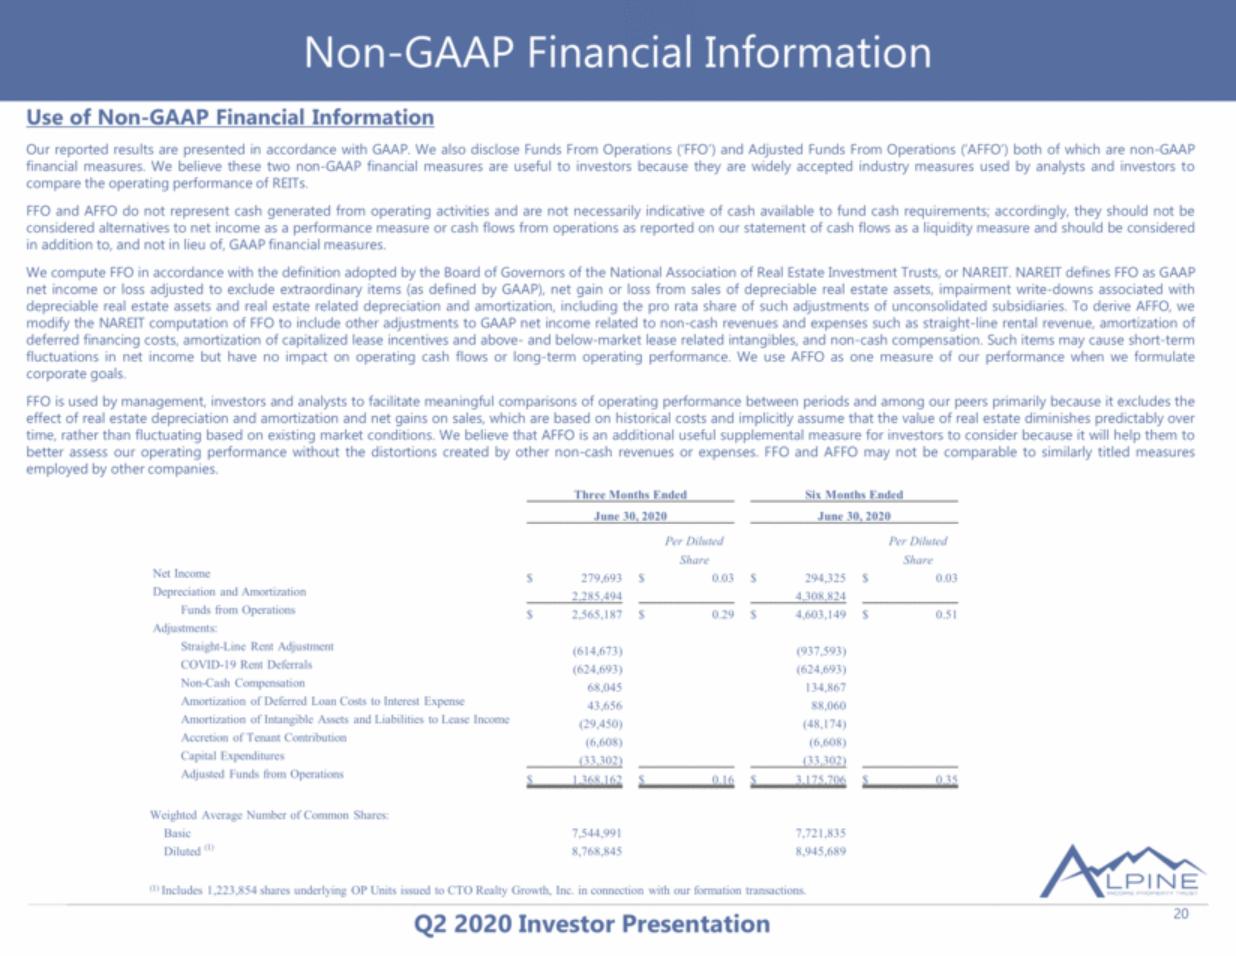
| 20 Use of Non-GAAP Financial Information Our reported results are presented in accordance with GAAP. We also disclose Funds From Operations (‘FFO’) and Adjusted Funds From Operations (‘AFFO’) both of which are non-GAAP financial measures. We believe these two non-GAAP financial measures are useful to investors because they are widely accepted industry measures used by analysts and investors to compare the operating performance of REITs. FFO and AFFO do not represent cash generated from operating activities and are not necessarily indicative of cash available to fund cash requirements; accordingly, they should not be considered alternatives to net income as a performance measure or cash flows from operations as reported on our statement of cash flows as a liquidity measure and should be considered in addition to, and not in lieu of, GAAP financial measures. We compute FFO in accordance with the definition adopted by the Board of Governors of the National Association of Real Estate Investment Trusts, or NAREIT. NAREIT defines FFO as GAAP net income or loss adjusted to exclude extraordinary items (as defined by GAAP), net gain or loss from sales of depreciable real estate assets, impairment write-downs associated with depreciable real estate assets and real estate related depreciation and amortization, including the pro rata share of such adjustments of unconsolidated subsidiaries. To derive AFFO, we modify the NAREIT computation of FFO to include other adjustments to GAAP net income related to non-cash revenues and expenses such as straight-line rental revenue, amortization of deferred financing costs, amortization of capitalized lease incentives and above- and below-market lease related intangibles, and non-cash compensation. Such items may cause short-term fluctuations in net income but have no impact on operating cash flows or long-term operating performance. We use AFFO as one measure of our performance when we formulate corporate goals. FFO is used by management, investors and analysts to facilitate meaningful comparisons of operating performance between periods and among our peers primarily because it excludes the effect of real estate depreciation and amortization and net gains on sales, which are based on historical costs and implicitly assume that the value of real estate diminishes predictably over time, rather than fluctuating based on existing market conditions. We believe that AFFO is an additional useful supplemental measure for investors to consider because it will help them to better assess our operating performance without the distortions created by other non-cash revenues or expenses. FFO and AFFO may not be comparable to similarly titled measures employed by other companies. Non-GAAP Financial Information Three Months Ended Six Months Ended June 30, 2020 June 30, 2020 Per Diluted Per Diluted Share Share Net Income $ 279,693 $ 0.03 $ 294,325 $ 0.03 Depreciation and Amortization 2,285,494 4,308,824 Funds from Operations $ 2,565,187 $ 0.29 $ 4,603,149 $ 0.51 Adjustments: Straight-Line Rent Adjustment (614,673) (937,593) COVID-19 Rent Deferrals (624,693) (624,693) Non-Cash Compensation 68,045 134,867 Amortization of Deferred Loan Costs to Interest Expense 43,656 88,060 Amortization of Intangible Assets and Liabilities to Lease Income (29,450) (48,174) Accretion of Tenant Contribution (6,608) (6,608) Capital Expenditures (33,302) (33,302) Adjusted Funds from Operations $ 1,368,162 $ 0.16 $ 3,175,706 $ 0.35 Weighted Average Number of Common Shares: Basic 7,544,991 7,721,835 Diluted (1) 8,768,845 8,945,689 (1) Includes 1,223,854 shares underlying OP Units issued to CTO Realty Growth, Inc. in connection with our formation transactions. |
| 21 This presentation may contain “forward-looking statements.” Forward-looking statements include statements that may be identified by words such as “could,” “may,” “might,” “will,” “likely,” “anticipates,” “intends,” “plans,” “seeks,” “believes,” “estimates,” “expects,” “continues,” “projects” and similar references to future periods, or by the inclusion of forecasts or projections. Forward-looking statements are based on the Company’s current expectations and assumptions regarding capital market conditions, the Company’s business, the economy and other future conditions. Because forward-looking statements relate to the future, by their nature, they are subject to inherent uncertainties, risks and changes in circumstances that are difficult to predict. As a result, the Company’s actual results may differ materially from those contemplated by the forward-looking statements. Important factors that could cause actual results to differ materially from those in the forward-looking statements include general business and economic conditions, continued volatility and uncertainty in the credit markets and broader financial markets, risks inherent in the real estate business, including tenant defaults, potential liability relating to environmental matters, illiquidity of real estate investments and potential damages from natural disasters, the impact of the COVID-19 Pandemic on the Company’s business and the business of its tenants and the impact on the U.S. economy and market conditions generally, other factors affecting the Company’s business or the business of its tenants that are beyond the control of the Company or its tenants, and the factors set forth under “Risk Factors” in the Company’s Annual Report on Form 10-K for the year ended December 31, 2019 and its Quarterly Report on Form 10-Q for the quarter ended March 31, 2020. Any forward-looking statement made in this press release speaks only as of the date on which it is made. The Company undertakes no obligation to publicly update or revise any forward-looking statement, whether as a result of new information, future developments or otherwise. Disclaimer |
| INVESTOR PRESENTATION SECOND QUARTER 2020 (NYSE:PINE) For additional information, please see our website www.AlpineREIT.com. Contact Us Investor Relations: 1140 N. Williamson Boulevard, Suite 140 Daytona Beach, FL 32114 P: 386.274.2202 Info@alpinereit.com |