Attached files
| file | filename |
|---|---|
| EX-99.1 - EXHIBIT 99.1 - ALLIANCE DATA SYSTEMS CORP | exhibit_99-1.htm |
| 8-K - FORM 8-K - ALLIANCE DATA SYSTEMS CORP | form_8k.htm |
Exhibit 99.2
Alliance Data NYSE: ADS Second Quarter 2020 ResultsJuly 23, 2020
2 Forward-Looking StatementsThis presentation contains forward-looking statements within the meaning of
Section 27A of the Securities Act of 1933 and Section 21E of the Securities Exchange Act of 1934. Forward-looking statements give our expectations or forecasts of future events and can generally be identified by the use of words such as
“believe,” “expect,” “anticipate,” “estimate,” “intend,” “project,” “plan,” “likely,” “may,” “should” or other words or phrases of similar import. Similarly, statements that describe our business strategy, outlook, objectives, plans, intentions
or goals also are forward-looking statements. Examples of forward-looking statements include, but are not limited to, statements we make regarding, and the guidance we give with respect to, our anticipated operating or financial results,
completion of strategic initiatives, future dividend declarations, and future economic conditions, including, but not limited to, fluctuation in currency exchange rates, market conditions and COVID-19 impacts related to relief measures for
impacted borrowers and depositors, labor shortages due to quarantine, reduction in demand from clients, supply chain disruption for our reward suppliers and disruptions in the airline or travel industries.We believe that our expectations are
based on reasonable assumptions. Forward-looking statements, however, are subject to a number of risks and uncertainties that could cause actual results to differ materially from the projections, anticipated results or other expectations
expressed in this presentation, and no assurances can be given that our expectations will prove to have been correct. These risks and uncertainties include, but are not limited to, factors set forth in the Risk Factors section in our Annual
Report on Form 10-K for the most recently ended fiscal year, which may be updated in Item 1A of, or elsewhere in, our Quarterly Reports on Form 10-Q filed for periods subsequent to such Form 10-K. Our forward-looking statements speak only as of
the date made, and we undertake no obligation, other than as required by applicable law, to update or revise any forward-looking statements, whether as a result of new information, subsequent events, anticipated or unanticipated circumstances
or otherwise.
Q2 2020 Agenda Speakers: Ralph Andretta President and CEO Tim King EVP and CFO Key TakeawaysQ2
Consolidated Financial Results Q2 Business Segment Financial ResultsLoyaltyOne®Card ServicesQ2 Business Update – Card ServicesKey MetricsLiquidity UpdateStore Opening / Credit Sales TrendsState Re-opening TrendsPayment Behavior Trends Retailer
Bankruptcy EconomicsClosing Remarks Q&A 3
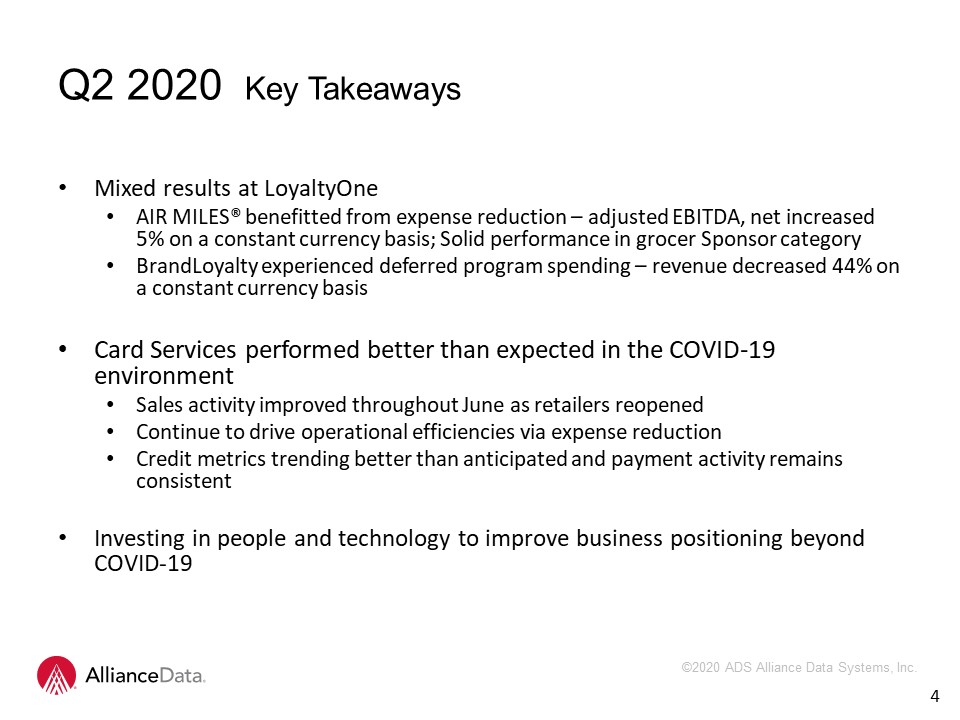
Q2 2020 Key Takeaways Mixed results at LoyaltyOne AIR MILES® benefitted from expense reduction –
adjusted EBITDA, net increased 5% on a constant currency basis; Solid performance in grocer Sponsor categoryBrandLoyalty experienced deferred program spending – revenue decreased 44% on a constant currency basis Card Services performed better
than expected in the COVID-19 environmentSales activity improved throughout June as retailers reopened Continue to drive operational efficiencies via expense reduction Credit metrics trending better than anticipated and payment activity remains
consistent Investing in people and technology to improve business positioning beyond COVID-19 4
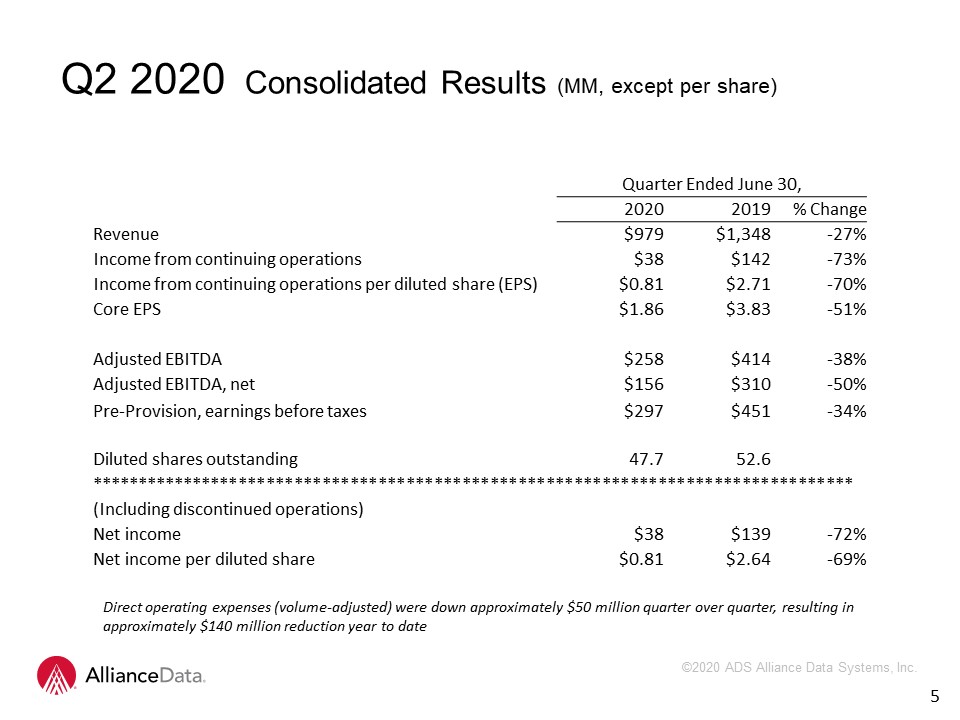
Q2 2020 Consolidated Results (MM, except per share) 5 Quarter Ended June 30, 2020 2019 %
Change Revenue $979 $1,348 -27% Income from continuing operations $38 $142 -73% Income from continuing operations per diluted share (EPS) $0.81 $2.71 -70% Core EPS $1.86 $3.83 -51% Adjusted
EBITDA $258 $414 -38% Adjusted EBITDA, net $156 $310 -50% Pre-Provision, earnings before taxes $297 $451 -34% Diluted shares
outstanding 47.7 52.6 ********************************************************************************** (Including discontinued operations) Net income $38 $139 -72% Net income per diluted
share $0.81 $2.64 -69% Direct operating expenses (volume-adjusted) were down approximately $50 million quarter over quarter, resulting in approximately $140 million reduction year to date
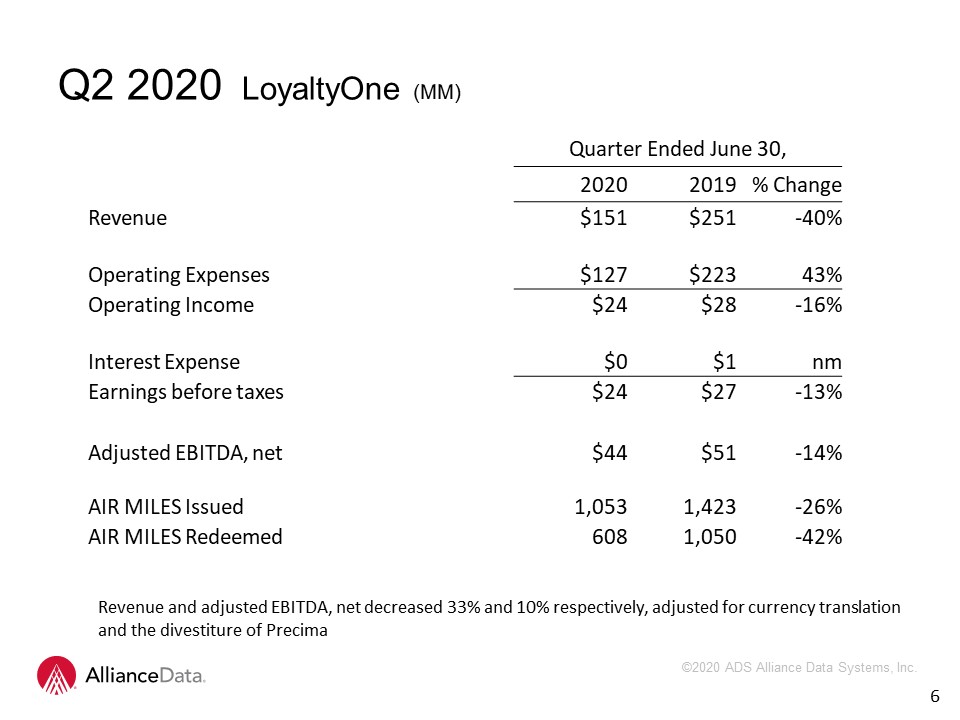
6 Quarter Ended June 30, 2020 2019 %
Change Revenue $151 $251 -40% Operating Expenses $127 $223 43% Operating Income $24 $28 -16% Interest Expense $0 $1 nm Earnings before taxes $24 $27 -13% Adjusted EBITDA,
net $44 $51 -14% AIR MILES Issued 1,053 1,423 -26% AIR MILES Redeemed 608 1,050 -42% Revenue and adjusted EBITDA, net decreased 33% and 10% respectively, adjusted for currency translation and the divestiture of
Precima Q2 2020 LoyaltyOne (MM)
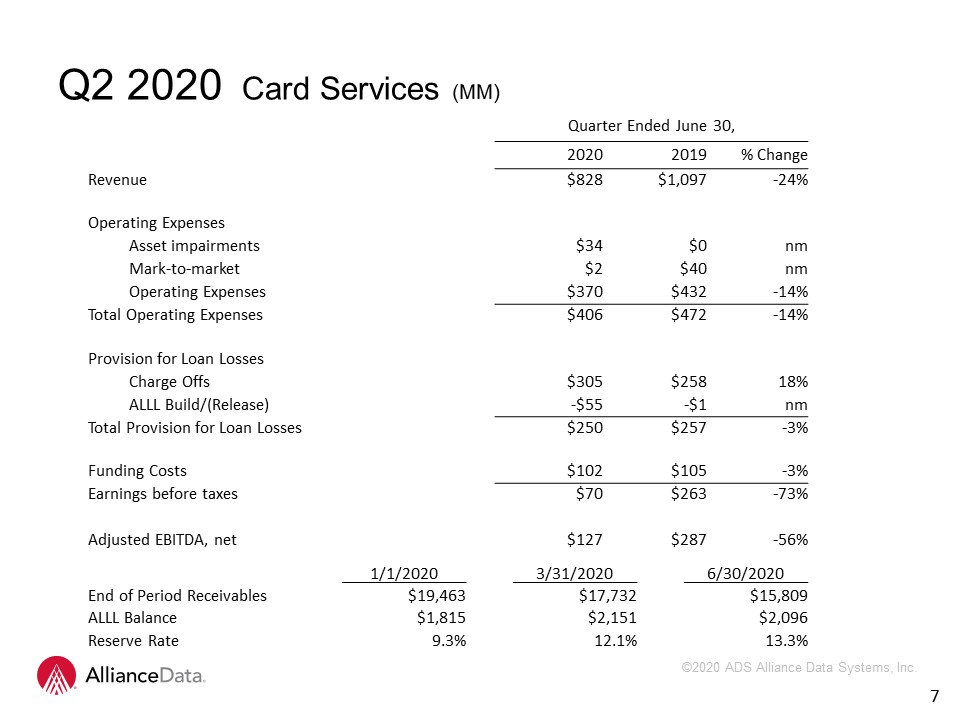
7 Quarter Ended June 30, 2020 2019 %
Change Revenue $828 $1,097 -24% Operating Expenses Asset impairments $34 $0 nm Mark-to-market $2 $40 nm Operating Expenses $370 $432 -14% Total Operating Expenses $406 $472 -14% Provision
for Loan Losses Charge Offs $305 $258 18% ALLL Build/(Release) -$55 -$1 nm Total Provision for Loan Losses $250 $257 -3% Funding Costs $102 $105 -3% Earnings before
taxes $70 $263 -73% Adjusted EBITDA, net $127 $287 -56% 1/1/2020 3/31/2020 6/30/2020 End of Period Receivables $19,463 $17,732 $15,809 ALLL Balance $1,815 $2,151 $2,096 Reserve
Rate 9.3% 12.1% 13.3% Q2 2020 Card Services (MM)
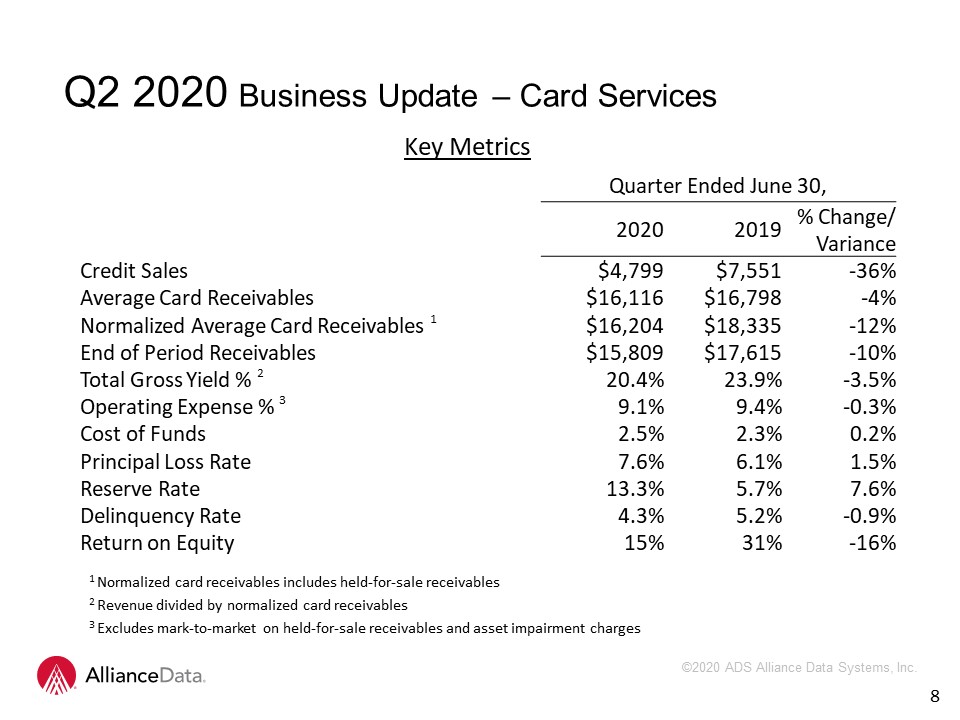
Q2 2020 Business Update – Card Services 8 1 Normalized card receivables includes held-for-sale
receivables2 Revenue divided by normalized card receivables3 Excludes mark-to-market on held-for-sale receivables and asset impairment charges Key Metrics Quarter Ended June 30, 2020 2019 % Change/ Variance Credit
Sales $4,799 $7,551 -36% Average Card Receivables $16,116 $16,798 -4% Normalized Average Card Receivables 1 $16,204 $18,335 -12% End of Period Receivables $15,809 $17,615 -10% Total Gross Yield %
2 20.4% 23.9% -3.5% Operating Expense % 3 9.1% 9.4% -0.3% Cost of Funds 2.5% 2.3% 0.2% Principal Loss Rate 7.6% 6.1% 1.5% Reserve Rate 13.3% 5.7% 7.6% Delinquency Rate 4.3% 5.2% -0.9% Return on Equity 15% 31% -16%
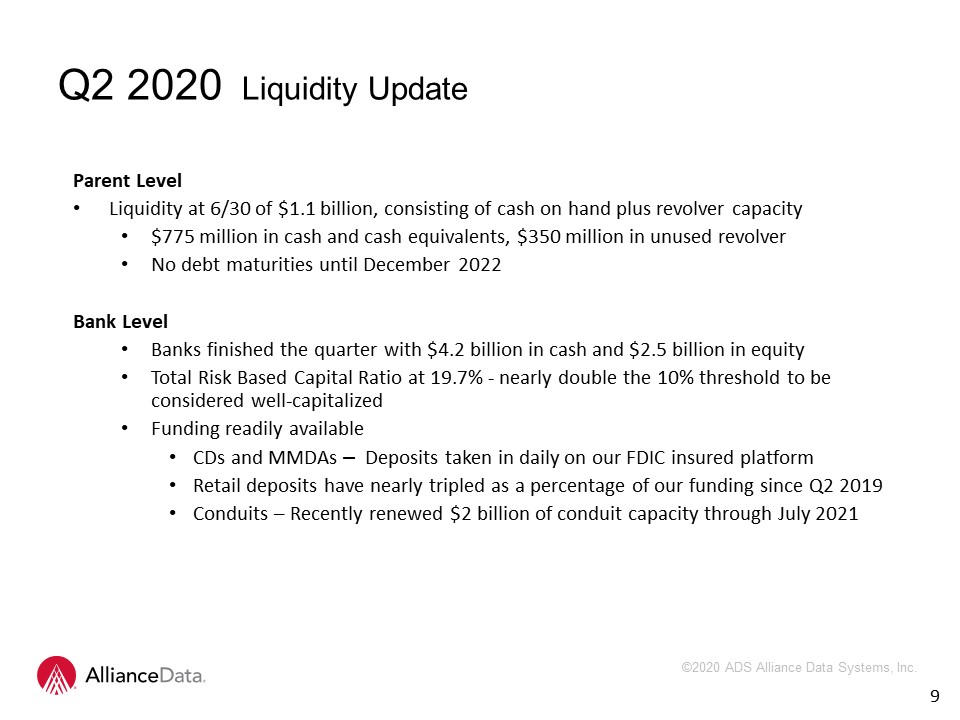
Parent Level Liquidity at 6/30 of $1.1 billion, consisting of cash on hand plus revolver capacity $775
million in cash and cash equivalents, $350 million in unused revolverNo debt maturities until December 2022Bank LevelBanks finished the quarter with $4.2 billion in cash and $2.5 billion in equityTotal Risk Based Capital Ratio at 19.7% - nearly
double the 10% threshold to be considered well-capitalizedFunding readily availableCDs and MMDAs – Deposits taken in daily on our FDIC insured platformRetail deposits have nearly tripled as a percentage of our funding since Q2 2019Conduits –
Recently renewed $2 billion of conduit capacity through July 2021 9 Q2 2020 Liquidity Update
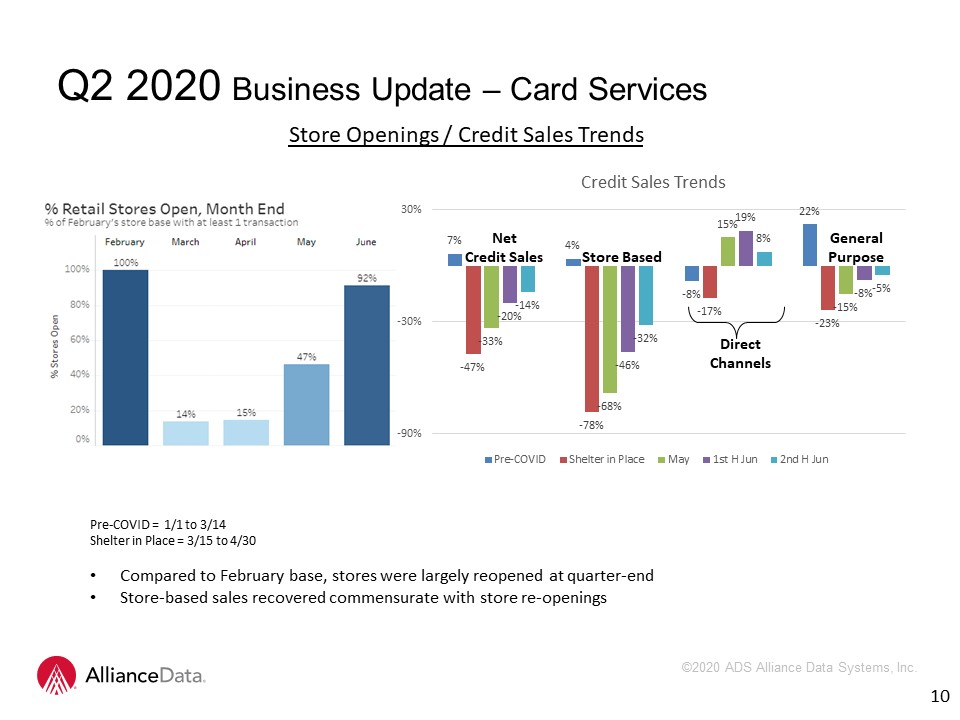
Pre-COVID = 1/1 to 3/14Shelter in Place = 3/15 to 4/30Compared to February base, stores were largely
reopened at quarter-endStore-based sales recovered commensurate with store re-openings Q2 2020 Business Update – Card Services Net Credit Sales Direct Channels Store Based General Purpose 10 Store Openings / Credit Sales Trends
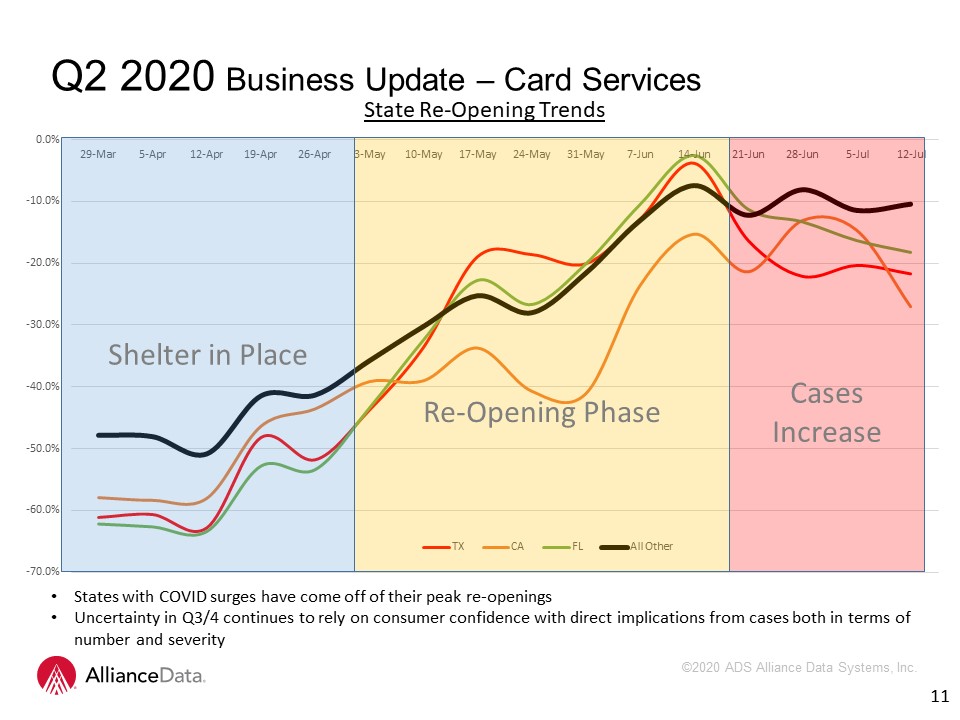
States with COVID surges have come off of their peak re-openingsUncertainty in Q3/4 continues to rely on
consumer confidence with direct implications from cases both in terms of number and severity Q2 2020 Business Update – Card Services 11 State Re-Opening Trends Shelter in Place Re-Opening Phase Cases Increase
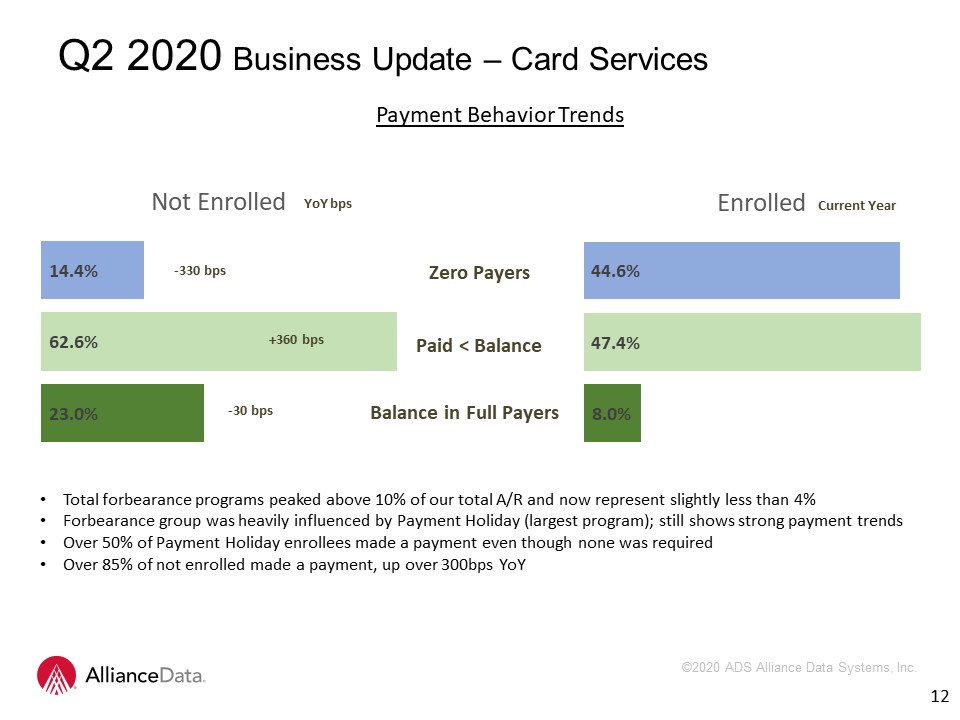
Total forbearance programs peaked above 10% of our total A/R and now represent slightly less than
4%Forbearance group was heavily influenced by Payment Holiday (largest program); still shows strong payment trends Over 50% of Payment Holiday enrollees made a payment even though none was requiredOver 85% of not enrolled made a payment, up
over 300bps YoY Q2 2020 Business Update – Card Services 12 Payment Behavior Trends Zero Payers Paid < Balance Balance in Full Payers -330 bps +360 bps -30 bps YoY bps Current Year

Approximately 6% of A/R is from retailers currently in bankruptcy process Cards retain functionality
during retailer reorganizations, with appropriate measures implemented by ADS for prudent account managementIf a retailer ultimately liquidates, the associated A/R portfolio follows a predictable and profitable curve. For instance, with a
typical private label credit card apparel program: Card utility is suspendedA/R declines to about 50% after 6 months, and to about 10% after 24 monthsGross Yields increase about 800 basis points over 24 monthsCharge-offs peak in 6 to 8
monthsOperating expenses trend down as we no longer incur sales or marketing expenses and client compensationWe can optimize value by profitably liquidating the file, selling the portfolio or we can offer cardholders a proprietary co-brand card
to replace the private label credit card 13 Q2 2020 Business Update – Card Services Retailer Bankruptcy Economics
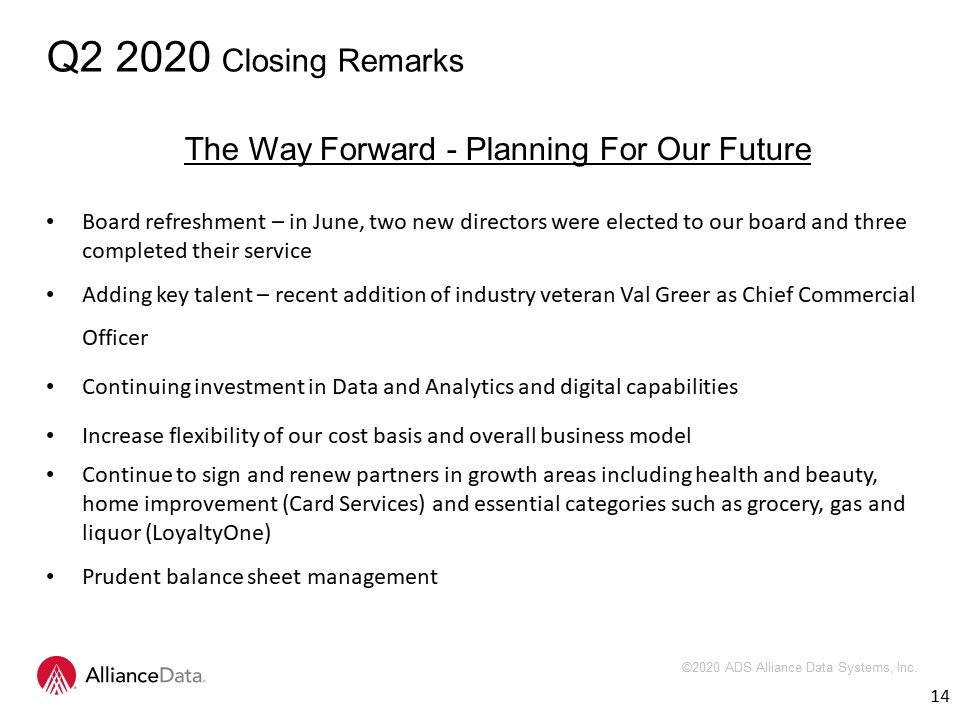
The Way Forward - Planning For Our FutureBoard refreshment – in June, two new directors were elected to
our board and three completed their serviceAdding key talent – recent addition of industry veteran Val Greer as Chief Commercial OfficerContinuing investment in Data and Analytics and digital capabilities Increase flexibility of our cost basis
and overall business model Continue to sign and renew partners in growth areas including health and beauty, home improvement (Card Services) and essential categories such as grocery, gas and liquor (LoyaltyOne)Prudent balance sheet
management 14 Q2 2020 Closing Remarks
15 Financial MeasuresIn addition to the results presented in accordance with generally accepted
accounting principles, or GAAP, the Company may present financial measures that are non-GAAP measures, such as constant currency financial measures, pre-provision earnings before taxes, adjusted EBITDA, adjusted EBITDA margin, adjusted EBITDA,
net of funding costs, core earnings and core earnings per diluted share (core EPS). Constant currency excludes the impact of fluctuations in foreign exchange rates. The Company calculates constant currency by converting our current period local
currency financial results using the prior period exchange rates. The Company uses adjusted EBITDA and adjusted EBITDA, net as an integral part of internal reporting to measure the performance and operational strength of reportable segments and
to evaluate the performance of senior management. Adjusted EBITDA eliminates the uneven effect across all reportable segments of non-cash depreciation of tangible assets and amortization of intangible assets, including certain intangible assets
that were recognized in business combinations, and the non-cash effect of stock compensation expense. In addition, adjusted EBITDA eliminates the effect of the gain (loss) on the sale of a business, strategic transaction costs, asset
impairments, and restructuring and other charges. Adjusted EBITDA, net is equal to adjusted EBITDA less securitization funding costs and interest expense on deposits. Similarly, core earnings and core EPS eliminate non-cash or non-operating
items, including, but not limited to, stock compensation expense, amortization of purchased intangibles, non-cash interest, gain (loss) on the sale of a business, strategic transaction costs, asset impairments, and restructuring and other
charges. The Company believes that these non-GAAP financial measures, viewed in addition to and not in lieu of the Company’s reported GAAP results, provide useful information to investors regarding the Company’s performance and overall results
of operations.

Q & A 16