Attached files
| file | filename |
|---|---|
| 8-K - FORM 8-K - Surgery Partners, Inc. | tm2025289d2_8k.htm |
Exhibit 99.1
 |
SURGERY PARTNERS Lender Presentation July 2020 Exhibit 99.1 |
 |
Legal Disclaimer Forward-Looking Statements This presentation contains forward-looking statements, which are based on our current expectations, estimates and assumptions about future events. All statements other than statements of current or historical fact contained in this report are forward-looking statements. These statements include, but are not limited to, statements regarding our future financial position, business strategy, budgets, effective tax rate, projected costs and plans and objectives of management for future operations. The words "projections," "believe," "continue," "drive," "estimate," "expect," "intend," "may," "plan," "will," "could," "would" and similar expressions are generally intended to identify forward-looking statements. These statements involve risks, uncertainties and other factors that may cause actual results to differ from the expectations expressed in the statements. Many of these factors are beyond our ability to control or predict. These factors include, without limitation, the duration and severity of the COVID-19 outbreak in the United States and the regions in which we operate, the impact to the state and local economies of prolonged shelter in place orders and the pandemic generally, our ability to respond nimbly to challenging economic conditions, the unpredictability of our case volume both in the current environment and if and when restrictions are eased, our ability to preserve or raise sufficient funds to continue operations throughout this period of uncertainty, including through our in-process asset sales, which may not occur during this period of uncertainty, if at all, the impact of our cost-cutting measures on our future performance, our ability to defer payments, including certain lease payments, our ability to cause distributions from our subsidiaries, the responsiveness of our payors, including Medicaid and Medicare, to the challenging operating conditions, including their willingness and ability to continue paying in a timely manner and to advance payments in a timely manner, if at all; our ability to execute on our operational and strategic initiatives; the timing and impact of our portfolio optimization efforts; our ability to continue to improve same-facility volume and revenue growth on the timeline anticipated, if at all; our ability to successfully integrate acquisitions; the anticipated impact and timing of our ongoing efficiency efforts, including insurance consolidations and completed headcount actions, as well as our ongoing procurement and revenue cycle efforts; the impact of adverse weather conditions and other events outside of our control; and the risks and uncertainties set forth under the heading "Risk Factors" in our quarterly report on 10-Q for the quarter ended March 31, 2020 and in our Annual Report on Form 10-K for the year ended December 31, 2019 and discussed from time to time in our reports filed with the SEC. Considering these risks, uncertainties and assumptions, the forward-looking events and circumstances discussed in this presentation and in such reports may not occur, and actual results could differ materially from those anticipated or implied in the forward-looking statements. When you consider these forward-looking statements, you should keep in mind these risk factors and other cautionary statements in this this presentation and such reports. These forward-looking statements speak only as of the date made. Other than as required by law, we undertake no obligation to publicly update or revise any forward-looking statements, whether because of new information, future events or otherwise. Investors, potential investors, and others should give careful consideration to these risks and uncertainties and should not place considerable reliance on the forward-looking statements contained in this presentation. Data and Information Contained in this Presentation This presentation also contains market research, estimates and forecasts, which are inherently subject to uncertainties and actual events or circumstances may differ materially from events and circumstances reflected in this information. Certain data in this presentation was obtained from various external sources, and neither the Company nor its affiliates, advisers or representatives has verified such data with independent sources. Accordingly, neither the Company nor any of its affiliates, advisers or representatives makes any representations as to the accuracy or completeness of that data or to update such data after the date of this presentation. Such data involves risks and uncertainties and is subject to change based on various factors. The trademarks included herein are the property of the owners thereof and are used for reference purposes only. Such use should not be construed as an endorsement of the products or services of such owners. Preliminary Unaudited Selected Financial Data This presentation includes unaudited estimates regarding surgical case volumes, Revenues, Adjusted Revenues, Same-facility Revenues, Adjusted EBITDA, and Consolidated Cash and Cash Equivalents for the quarter ended June 30, 2020. These estimates are the responsibility of management and are subject to quarter-end adjustments in connection with the completion of our customary financial closing procedures, including management’s review and finalization and to accounting review procedures by our independent registered public accounting firm, which have not yet been performed. During the course of our review process, items may be identified that would require the Company to make adjustments, which could result in material changes to these preliminary unaudited estimated financial results. Consequently, the results should not be viewed as a substitute for the Company’s earnings release and Quarterly Report on Form 10-Q, which are expected to be released on August 5, 2020. Actual results may differ materially from our preliminary expectations. Confidential 2 |
 |
Legal Disclaimer (continued) Non-GAAP Financial Measures This presentation contains certain non-GAAP financial measures, including Adjusted Revenue, Adjusted EBITDA, and Credit Agreement EBITDA. A “non-GAAP financial measure” is defined as a numerical measure of a company’s financial performance that excludes or includes amounts so as to be different than the most directly comparable measure calculated and presented in accordance with GAAP in the statements of income, balance sheets or statements of cash flow of the company. The Company presents non-GAAP financial measures when it believes that the additional information is useful and meaningful to investors. Non-GAAP financial measures do not have any standardized meaning and are therefore unlikely to be comparable to similar measures presented by other companies. The presentation of non-GAAP financial measures is not intended to be a substitute for, and should not be considered in isolation from, the financial measures reported in accordance with GAAP. For additional information about our non-GAAP financial measures, and a reconciliation of certain non-GAAP financial measures to the most nearly comparable GAAP measures, see slides 23 and 24 of this presentation and the Company’s 10-K. The Company will provide a full GAAP reconciliation of final Adjusted Revenue and Adjusted EBITDA for the quarter ending March 31, 2020 when it reports its full second quarter results. Important Notice Regarding Information Contained in this Presentation This investor presentation (this “Presentation”) is intended to facilitate discussions with representatives of certain institutions regarding a notes offering for Surgery Partners, Inc. and its subsidiaries. You should not rely on the information contained in this Presentation and this Presentation does not purport to be all-inclusive or to contain all of the information that a prospective participant may consider material or desirable in making its decision to become an investor in the notes. In all cases, prospective participants should conduct their own investigation and analysis of the Company, their assets, financial condition and prospects, and of the data set forth in this Presentation. This Presentation is not an offer to sell or the solicitation of an offer to buy any securities, nor will there be any sales of securities by the Company or its subsidiaries in any jurisdiction in which the offer, solicitation or sale would be unlawful. The Unsecured Notes offered in the offering to which this Presentation relates have not been and will not be registered under the Securities Act of 1933, as amended (the “Act”), or under any state securities laws. Securities may not be offered or sold in the United States to any persons unless they are registered or exempt from registration under the Act. Confidential 3 |
 |
Transaction Section 1 Overview Confidential |
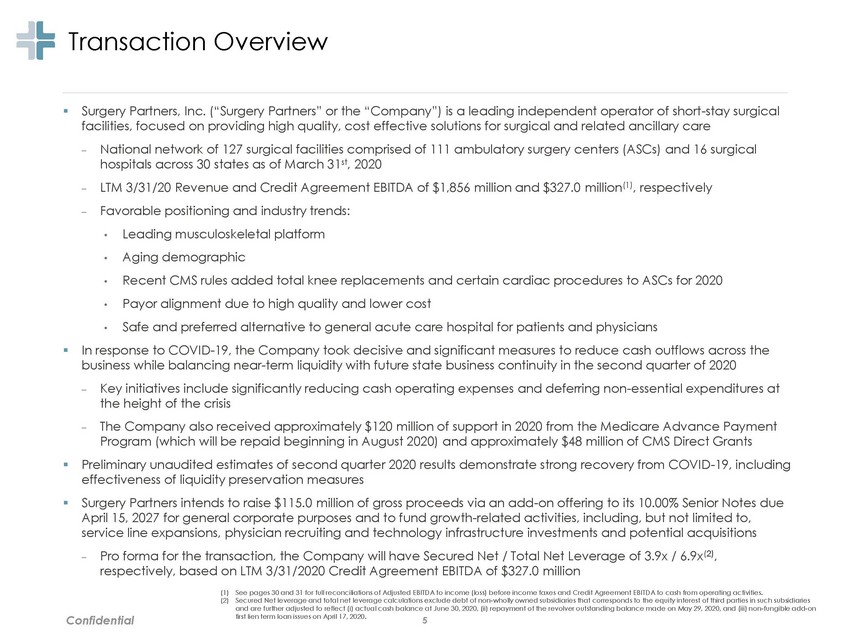 |
Transaction Overview ▪ Surgery Partners, Inc. (“Surgery Partners” or the “Company”) is a leading independent operator of short-stay surgical facilities, focused on providing high quality, cost effective solutions for surgical and related ancillary care National network of 127 surgical facilities comprised of 111 ambulatory surgery centers (ASCs) and 16 surgical hospitals across 30 states as of March 31st, 2020 LTM 3/31/20 Revenue and Credit Agreement EBITDA of $1,856 million and $327.0 million(1), respectively Favorable positioning and industry trends: – – – Leading musculoskeletal platform Aging demographic Recent CMS rules added total knee replacements and certain cardiac procedures to ASCs for 2020 Payor alignment due to high quality and lower cost Safe and preferred alternative to general acute care hospital for patients and physicians • • • • • In response to COVID-19, the Company took decisive and significant measures to reduce cash outflows across the business while balancing near-term liquidity with future state business continuity in the second quarter of 2020 ▪ Key initiatives include significantly reducing cash operating expenses and deferring non-essential expenditures at the height of the crisis The Company also received approximately $120 million of support in 2020 from the Medicare Advance Payment Program (which will be repaid beginning in August 2020) and approximately $48 million of CMS Direct Grants – – Preliminary unaudited estimates of second quarter 2020 results demonstrate strong recovery from COVID-19, including effectiveness of liquidity preservation measures Surgery Partners intends to raise $115.0 million of gross proceeds via an add-on offering to its 10.00% Senior Notes due April 15, 2027 for general corporate purposes and to fund growth-related activities, including, but not limited to, service line expansions, physician recruiting and technology infrastructure investments and potential acquisitions ▪ ▪ Pro forma for the transaction, the Company will have Secured Net / Total Net Leverage of 3.9x / 6.9x(2), respectively, based on LTM 3/31/2020 Credit Agreement EBITDA of $327.0 million (1) See pages 30 and 31 for full reconciliations of Adjusted EBITDA to income (loss) before income taxes and Credit Agreement EBI TDA to cash from operating activities. (2) Secured Net leverage and total net leverage calculations exclude debt of non-wholly owned subsidiaries that corresponds to the equity interest of third parties in such subsidiaries and are further adjusted to reflect (i) actual cash balance at June 30, 2020, (ii) repayment of the revolver outstanding balance made on May 29, 2020, and (iii) non-fungible add-on – first lien term loan issues on April 17, 2020. Confidential 5 |
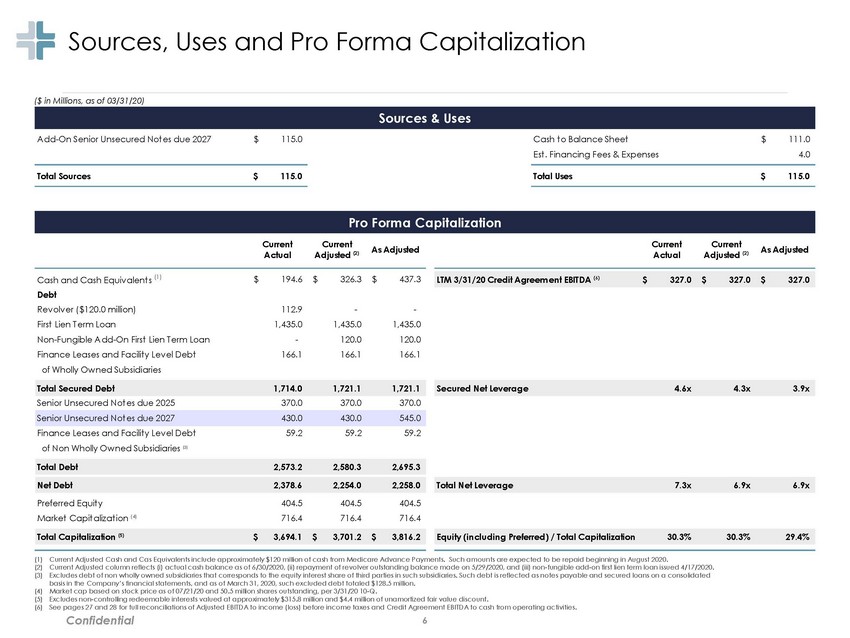 |
Sources, Uses and Pro Forma Capitalization ($ in Millions, as of 03/31/20) A dd-On Senior Unsecured Not es due 2027 $ 115.0 Cash t o Balance Sheet Est . Financing Fees & Expenses $ 111.0 4.0 Total Sources $ 115.0 Total Uses $ 115.0 Current Actual Current Adjusted (2) Current Actual Current Adjusted (2) As Adjusted As Adjusted Cash and Cash Equiv alent s (1) Debt Rev olv er ( $120.0 million) First Lien T erm Loan Non-Fungible A dd-On First Lien T erm Loan Finance Leases and Facilit y Lev el Debt of Wholly Owned Subsidiaries $ 194.6 $ 326.3 $ 437.3 112.9 1,435.0 - 166.1 - 1,435.0 120.0 166.1 - 1,435.0 120.0 166.1 Senior Unsecured Not es due 2025 370.0 370.0 370.0 Finance Leases and Facilit y Lev el Debt of Non Wholly Owned Subsidiaries (3) 59.2 59.2 59.2 Preferred Equit y Market Capit alizat ion ( 4) 404.5 716.4 404.5 716.4 404.5 716.4 (1) (2) (3) Current Adjusted Cash and Cas Equivalents include approximately $120 million of cash from Medicare Advance Payments. Such amounts are expected to be repaid beginning in August 2020. Current Adjusted column reflects (i) actual cash balance as of 6/30/2020, (ii) repayment of revolver outstanding balance made on 5/29/2020, and (iii) non-fungible add-on first lien term loan issued 4/17/2020. Excludes debt of non wholly owned subsidiaries that corresponds to the equity interest share of third parties in such subsidiaries. Such debt is reflected as notes payable and secured loans on a consolidated basis in the Company’s financial statements, and as of March 31, 2020, such excluded debt totaled $128.5 million. Market cap based on stock price as of 07/21/20 and 50.5 million shares outstanding, per 3/31/20 10-Q. Excludes non-controlling redeemable interests valued at approximately $315.8 million and $4.4 million of unamortized fair value discount. See pages 27 and 28 for full reconciliations of Adjusted EBITDA to income (loss) before income taxes and Credit Agreement EBITDA to cash from operating activities. (4) (5) (6) Confidential 6 Equity (including Preferred) / Total Capitalization 30.3% 30.3% 29.4% Total Capitalization (5) $ 3,694.1 $ 3,701.2 $ 3,816.2 Total Net Leverage 7.3x 6.9x 6.9x Net Debt 2,378.6 2,254.0 2,258.0 Total Debt 2,573.2 2,580.3 2,695.3 Senior Unsecured Not es due 2027 430.0 430.0 545.0 Secured Net Leverage 4.6x 4.3x 3.9x Total Secured Debt 1,714.0 1,721.1 1,721.1 LTM 3/31/20 Credit Agreement EBITDA (6) $ 327.0 $ 327.0 $ 327.0 Pro Forma Capitalization Sources & Uses |
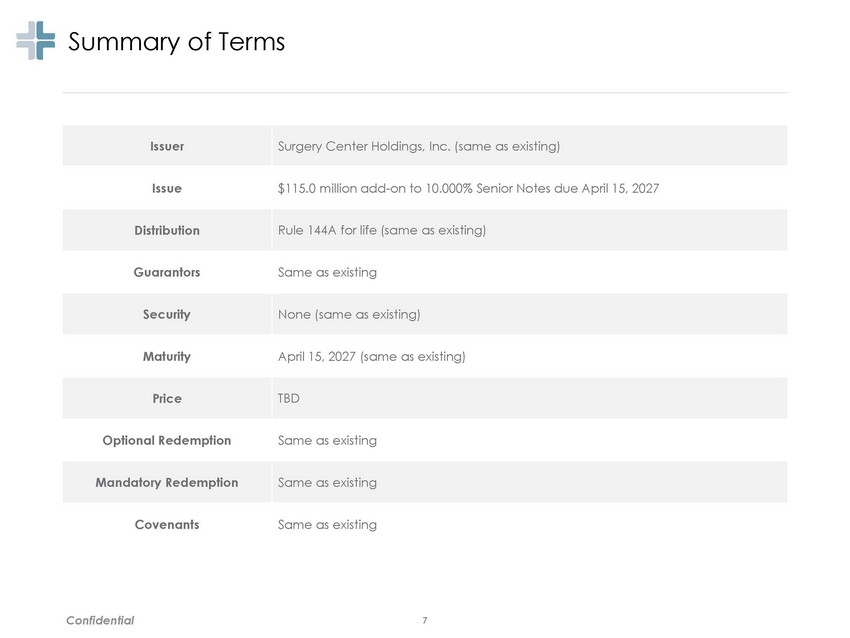 |
Summary of Terms Confidential 7 Issuer Surgery Center Holdings, Inc. (same as existing) Issue $115.0 million add-on to 10.000% Senior Notes due April 15, 2027 Distribution Rule 144A for life (same as existing) Guarantors Same as existing Security None (same as existing) Maturity April 15, 2027 (same as existing) Price TBD Optional Redemption Same as existing Mandatory Redemption Same as existing Covenants Same as existing |
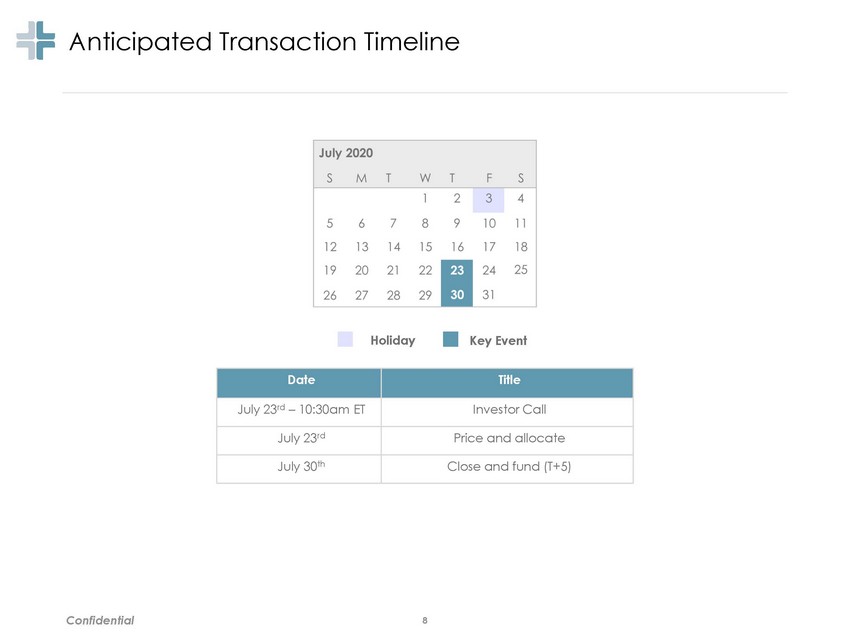 |
Anticipated Transaction Timeline Holiday Key Event Confidential 8 Date Title July 23rd – 10:30am ET Investor Call July 23rd Price and allocate July 30th Close and fund (T+5) |
 |
Company Section 2 Update Confidential |
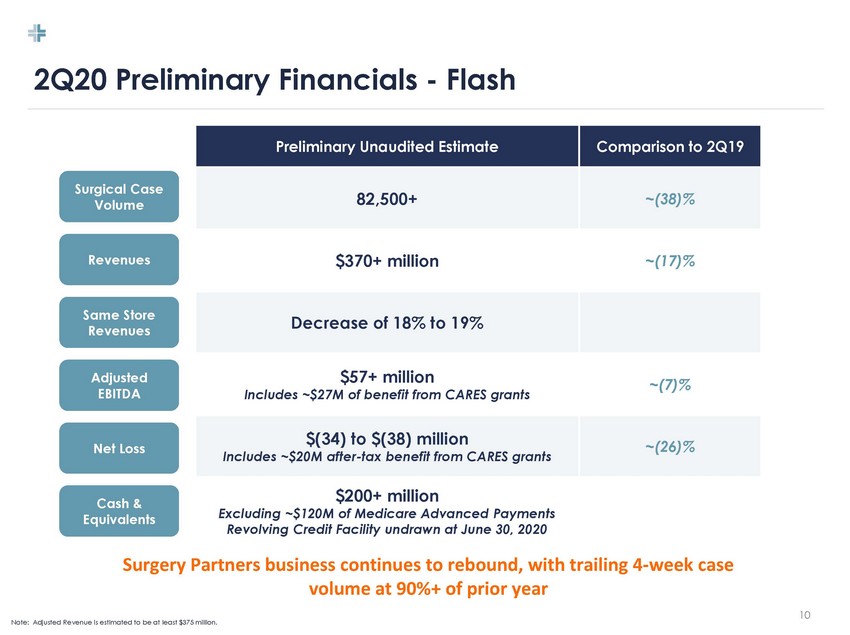 |
2Q20 Preliminary Financials - Flash Surgical Case Volume Revenues Same Store Revenues Adjusted EBITDA Net Loss Cash & Equivalents Surgery Partners business continues to rebound, with trailing 4-week case volume at 90%+ of prior year 10 Note: Adjusted Revenue is estimated to be at least $375 million. Preliminary Unaudited Estimate Comparison to 2Q19 82,500+ ~(38)% $370+ million ~(17)% Decrease of 18% to 19% $57+ million Includes ~$27M of benefit from CARES grants ~(7)% $(34) to $(38) million Includes ~$20M after-tax benefit from CARES grants ~(26)% $200+ million Excluding ~$120M of Medicare Advanced Payments Revolving Credit Facility undrawn at June 30, 2020 |
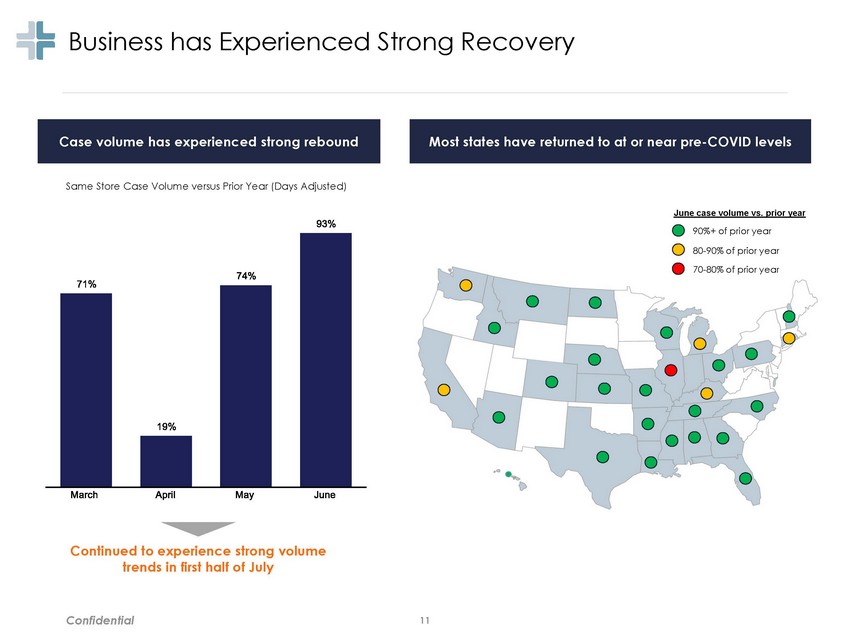 |
Business has Experienced Strong Recovery Same Store Case Volume versus Prior Year (Days Adjusted) June case volume vs. prior year 90%+ of prior year 80-90% of prior year 70-80% of prior year Continued to experience strong volume trends in first half of July Confidential 11 Most states have returned to at or near pre-COVID levels Case volume has experienced strong rebound |
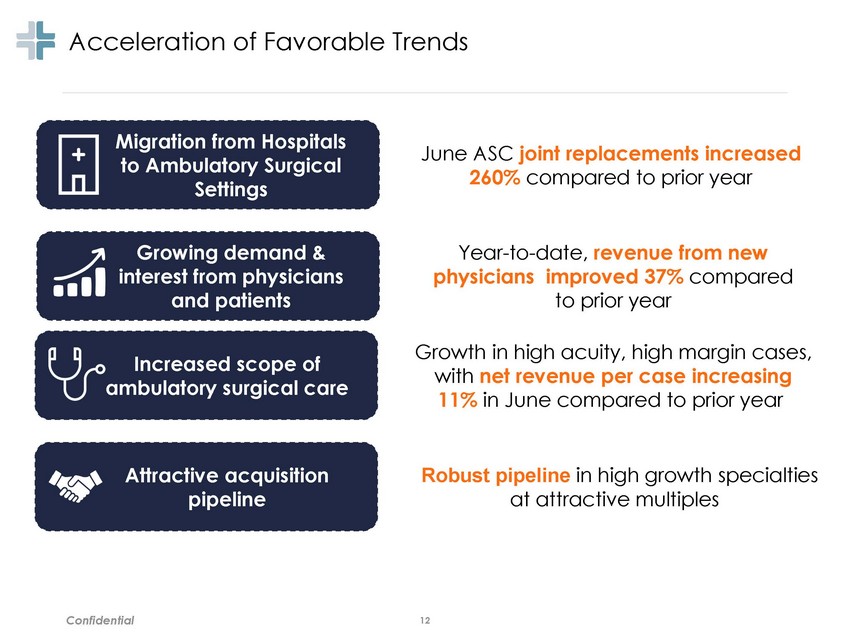 |
Acceleration of Favorable Trends Migration from Hospitals to Ambulatory Surgical Settings June ASC joint replacements increased 260% compared to prior year Growing demand & interest from physicians and patients Year-to-date, revenue from new physicians improved 37% compared to prior year Growth in high acuity, high margin cases, with net revenue per case increasing 11% in June compared to prior year Increased scope of ambulatory surgical care Attractive acquisition pipeline Robust pipeline in high growth specialties at attractive multiples Confidential 12 |
 |
Company Section 3 Overview Confidential |
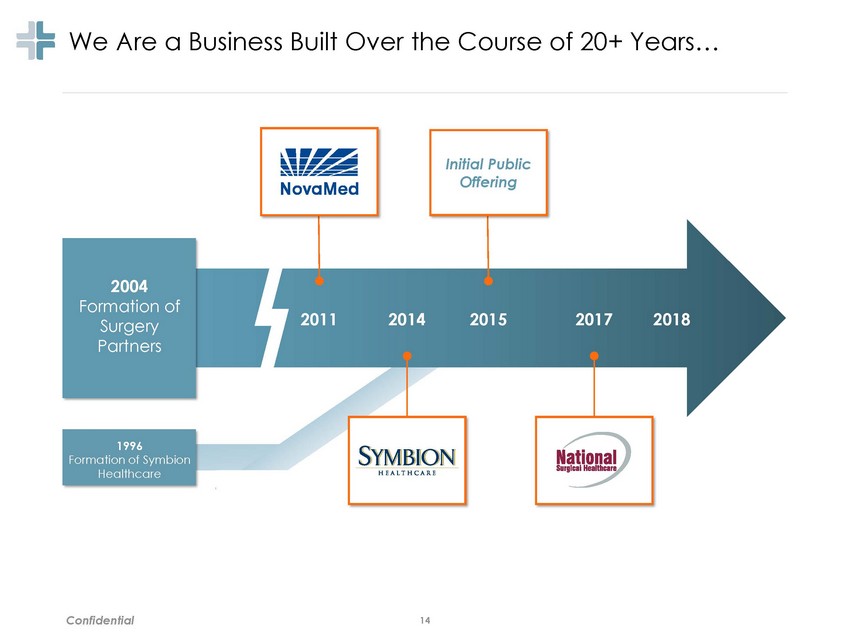 |
We Are a Business Built Over the Course of 20+ Years… 2011 2014 2015 2017 2018 Confidential 14 1996 Formation of Symbion Healthcare 2004 Formation of Surgery Partners Initial Public Offering |
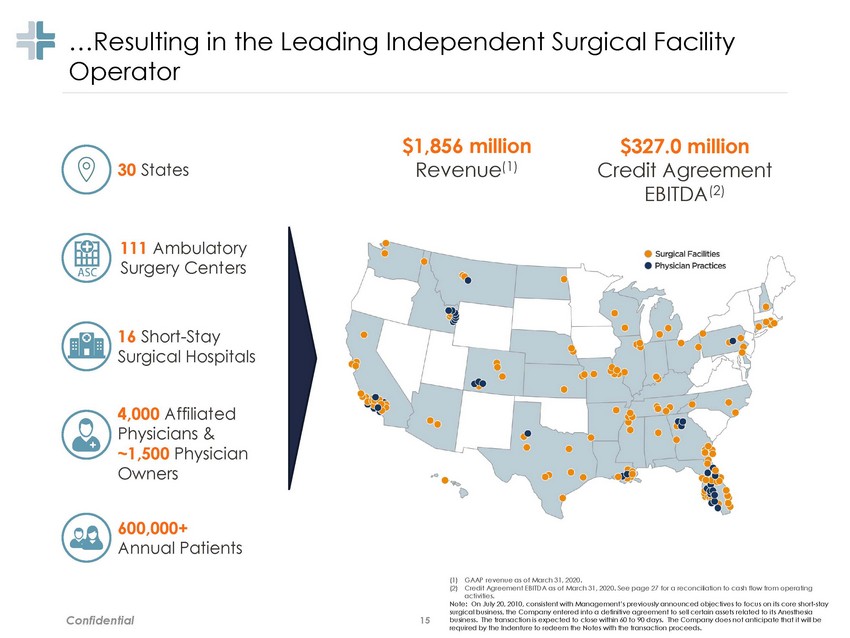 |
…Resulting in the Operator Leading Independent Surgical Facility $1,856 million Revenue(1) $327.0 million Credit Agreement EBITDA(2) 30 States 111 Ambulatory Surgery Centers 16 Short-Stay Surgical Hospitals 4,000 Affiliated Physicians & ~1,500 Physician Owners 600,000+ Annual Patients (1) GAAP revenue as of March 31, 2020. (2) Credit Agreement EBITDA as of March 31, 2020. See page 27 for a reconciliation to cash flow from operating activities. Note: On July 20, 2010, consistent with Management’s previously announced objectives to focus on its core short-stay surgical business, the Company entered into a definitive agreement to sell certain assets related to its Anesthesia business. The transaction is expected to close within 60 to 90 days. The Company does not anticipate that it will be required by the Indenture to redeem the Notes with the transaction proceeds. Confidential 15 |
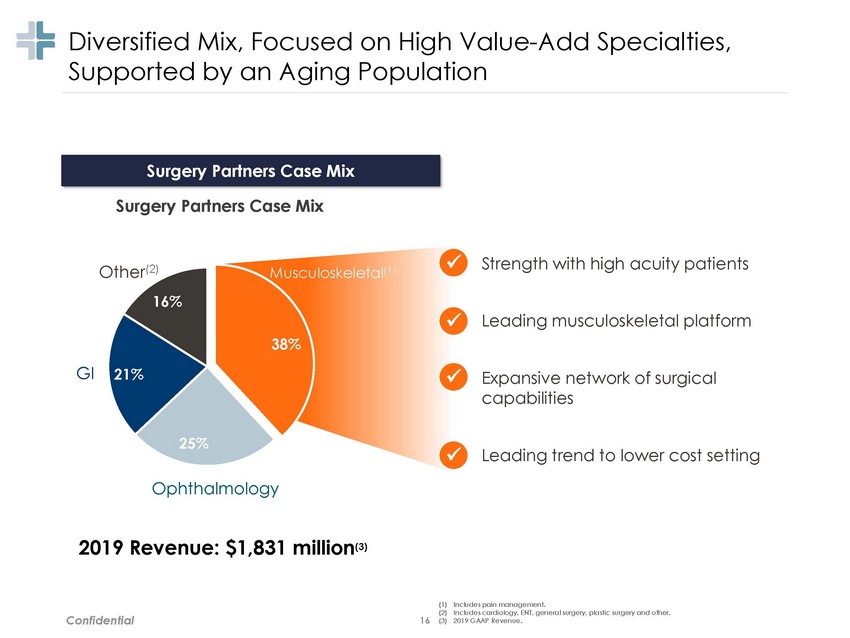 |
Diversified Mix, Focused Supported by an Aging on High Value-Add Population Specialties, Surgery Partners Case Mix ✓ Strength with high acuity patients Other(2) 16% oskeletal(1) Musc ✓ Leading musculoskeletal platform 38% GI 21% ✓ Expansive network of surgical capabilities 25% ✓ Leading trend to lower cost setting Ophthalmology 2019 Revenue: $1,831 million(3) (1) (2) (3) Includes pain management. Includes cardiology, ENT, general surgery, plastic surgery and other. 2019 GAAP Revenue. Confidential 16 Surgery Partners Case Mix |
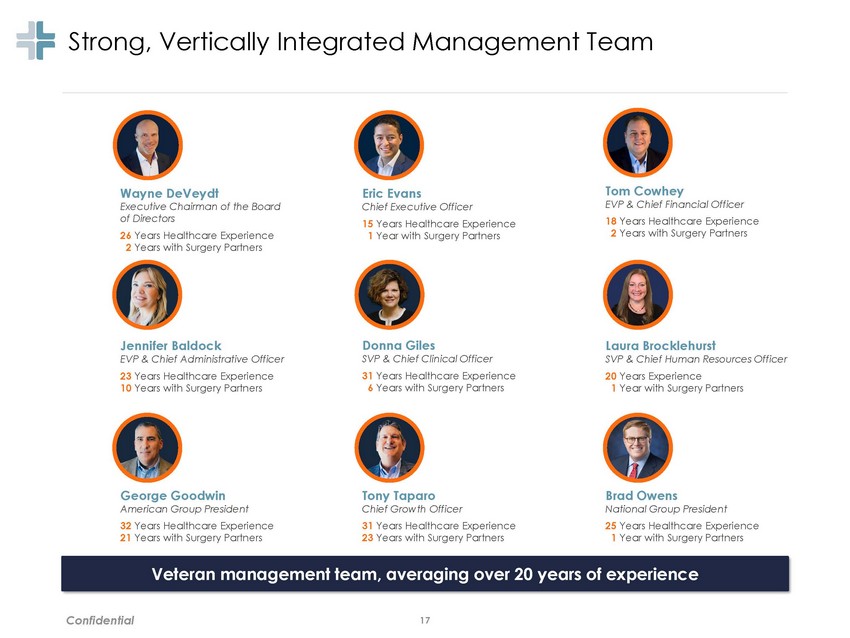 |
Strong, Vertically Integrated Management Team Tom Cowhey EVP & Chief Financial Officer 18 Years Healthcare Experience 2 Years with Surgery Partners Wayne DeVeydt Executive Chairman of the Board of Directors 26 Years Healthcare Experience 2 Years with Surgery Partners Eric Evans Chief Executive Officer 15 Years Healthcare Experience 1 Year with Surgery Partners Jennifer Baldock EVP & Chief Administrative Officer 23 Years Healthcare Experience 10 Years with Surgery Partners Donna Giles SVP & Chief Clinical Officer 31 Years Healthcare Experience 6 Years with Surgery Partners Laura Brocklehurst SVP & Chief Human Resources Officer 20 Years Experience 1 Year with Surgery Partners George Goodwin American Group President 32 Years Healthcare Experience 21 Years with Surgery Partners Tony Taparo Chief Growth Officer 31 Years Healthcare Experience 23 Years with Surgery Partners Brad Owens National Group President 25 Years Healthcare Experience 1 Year with Surgery Partners Confidential 17 Veteran management team, averaging over 20 years of experience |
 |
What Section 4 Makes Us Unique Confidential |
 |
What Makes Us Unique Uniquely positioned as a result of our focus on high growth specialties Supported by our superior clinical quality, customer satisfaction and physician engagement outcomes Only independent surgical facility operator of national size and scale Focused on consolidating an under-valued and fragmented industry with our distinctive scalable platform driving a more efficient and effective operation Trusted partner of choice Confidential 19 |
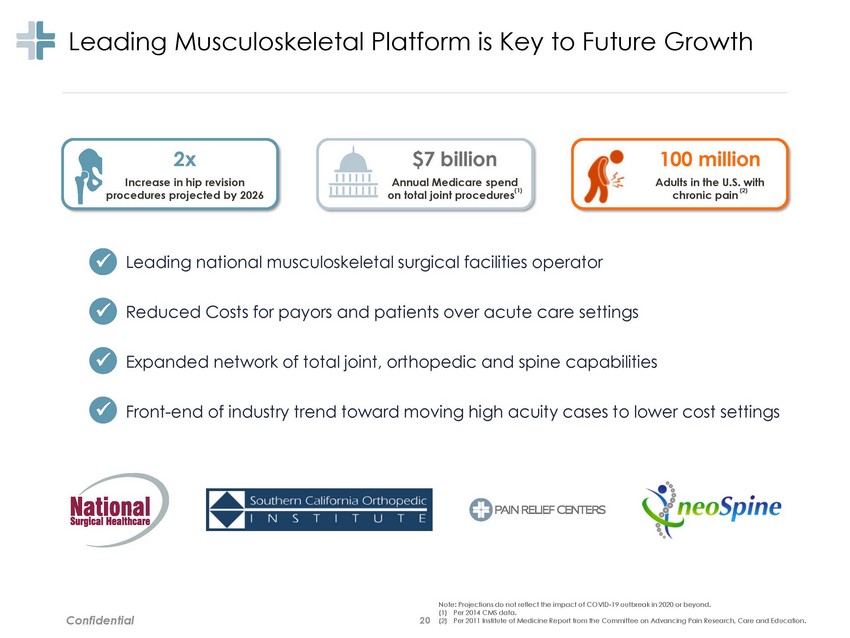 |
Leading Musculoskeletal Platform is Key to Future Growth 2x Increase in hip revision procedures projected by 2026 $7 billion Annual Medicare spend 100 million Adults in the U.S. with (1) (2) on total joint procedures chronic pain ✓ Leading national musculoskeletal surgical facilities operator ✓ Reduced Costs for payors and patients over acute care settings ✓ Expanded network of total joint, orthopedic and spine capabilities ✓ Front-end of industry trend toward moving high acuity cases to lower cost settings Note: Projections do not reflect the impact of COVID-19 outbreak in 2020 or beyond. (1) Per 2014 CMS data. (2) Per 2011 Institute of Medicine Report from the Committee on Advancing Pain Research, Care and Education. Confidential 20 |
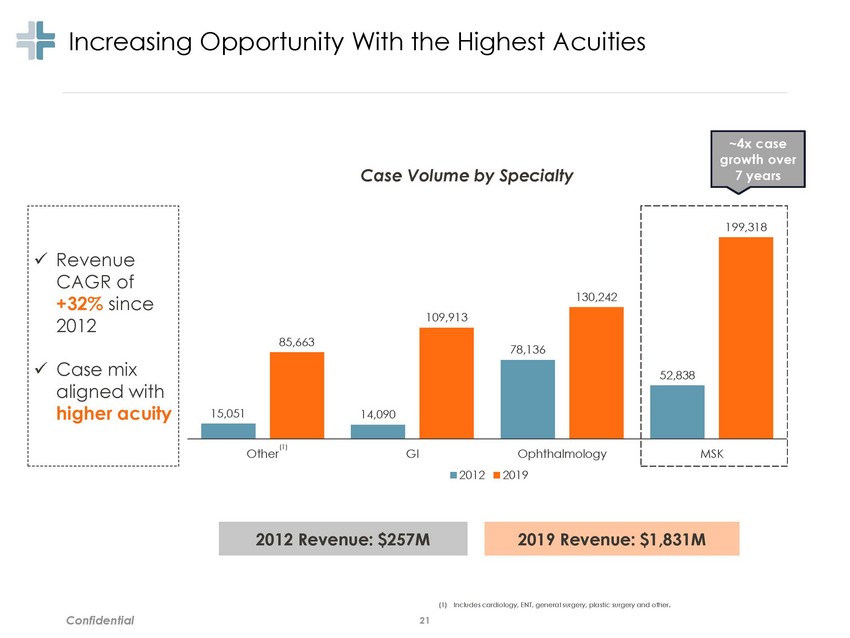 |
Increasing Opportunity With the Highest Acuities ~4x gr 7 Case Volume by Specialty +32% since 2012 2019 (1) Includes cardiology, ENT, general surgery, plastic surgery and other. Confidential 21 2019 Revenue: $1,831M 2012 Revenue: $257M ✓ Revenue CAGR of 2012 ✓ Case mix aligned with higher acuity 130,242 199,318 52,838 109,913 85,663 78,136 15,051 14,090 (1) OtherGIOphthalmology MSK |
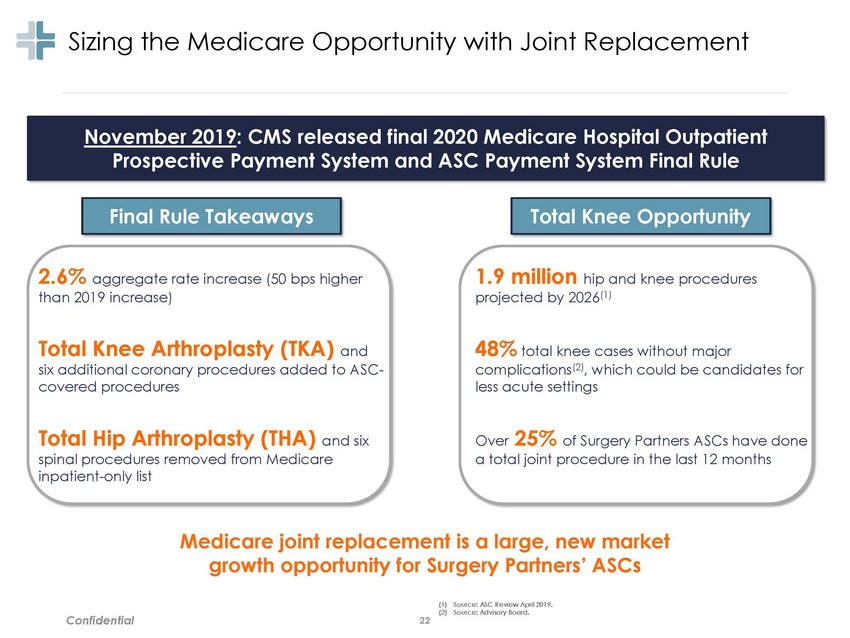 |
Sizing the Medicare Opportunity with Joint Replacement 2.6% aggregate rate increase (50 bps higher than 2019 increase) 1.9 million hip and knee procedures projected by 2026(1) Total Knee Arthroplasty (TKA) and covered procedures 48% total knee cases without major complications(2), which could be candidates for less acute settings six additional coronary procedures added to ASC-Total Hip Arthroplasty (THA) and six spinal procedures removed from Medicare inpatient-only list Over 25% of Surgery Partners ASCs have done a total joint procedure in the last 12 months Medicare growth joint replacement is a large, new market opportunity for Surgery Partners’ ASCs (1) Source: ASC Review April 2019. (2) Source: Advisory Board. Confidential 22 Total Knee Opportunity Final Rule Takeaways November 2019: CMS released final 2020 Medicare Hospital Outpatient Prospective Payment System and ASC Payment System Final Rule |
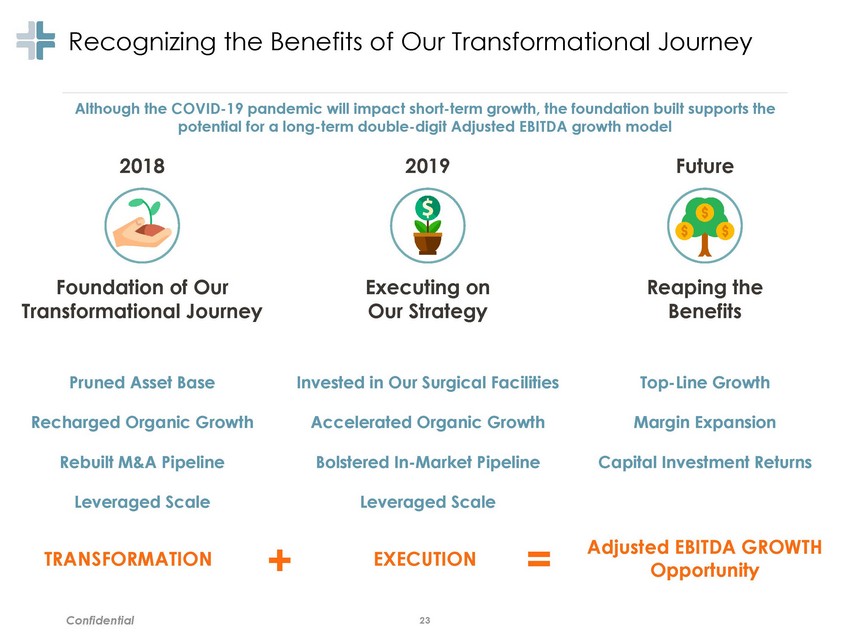 |
Recognizing the Benefits of Our Transformational Journey Although the COVID-19 pandemic will impact short-term growth, the foundation built supports the potential for a long-term double-digit Adjusted EBITDA growth model 2018 2019 Future Foundation of Our Transformational Journey Executing on Our Strategy Reaping the Benefits Pruned Asset Base Invested in Our Surgical Facilities Top-Line Growth Recharged Organic Growth Accelerated Organic Growth Margin Expansion Rebuilt M&A Pipeline Bolstered In-Market Pipeline Capital Investment Returns Leveraged Scale Leveraged Scale = Adjusted EBITDA GROWTH Opportunity + TRANSFORMATION EXECUTION Confidential 23 |
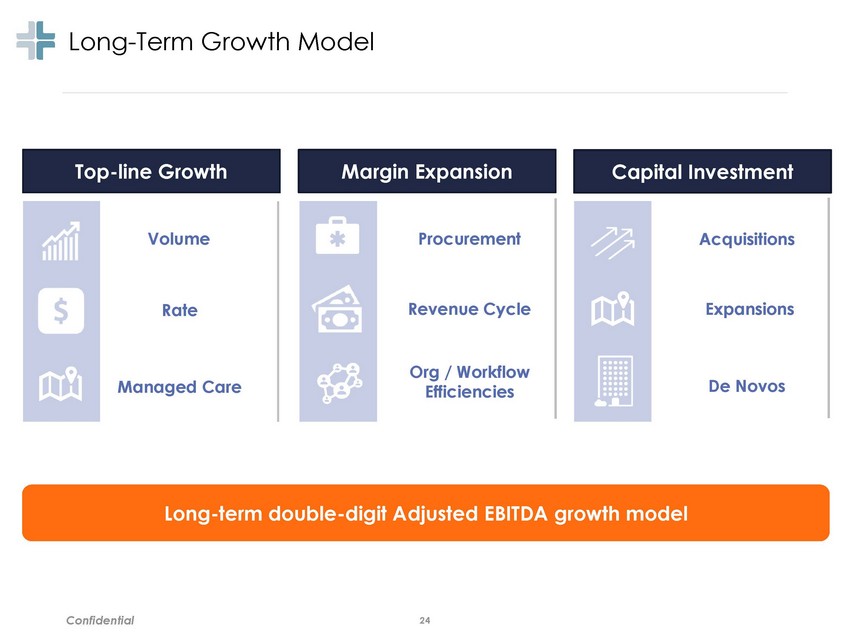 |
Long-Term Growth Model Volume Procurement Acquisitions Revenue Cycle Expansions Rate Org / Workflow Efficiencies Managed Care De Novos Long-term double-digit Adjusted EBITDA growth model Confidential 24 Capital Investment Margin Expansion Top-line Growth |
 |
Appendix Section 5 Confidential |
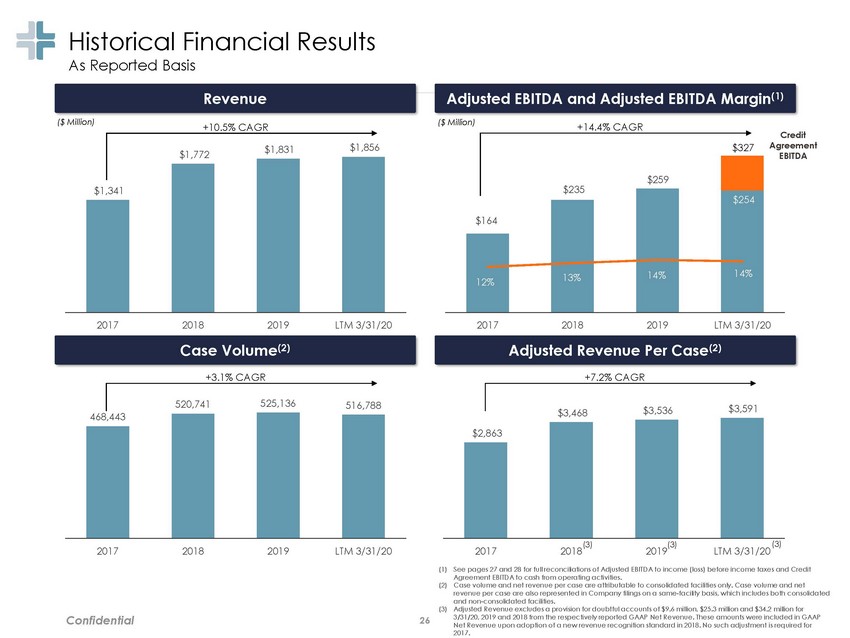 |
Historical Financial Results As Reported Basis ($ Million) ($ Million) +10.5% CAGR +14.4% CAGR Credit Agreement EBITDA $1,856 $327 $1,831 $1,772 $235 2017 2018 2019 LTM 3/31/20 2017 2018 2019 LTM 3/31/20 +3.1% CAGR +7.2% CAGR 525,136 520,741 516,788 $3,591 $3,536 $3,468 (3) (3) 2019 (3) 2017 2018 2019 LTM 3/31/20 2017 2018 LTM 3/31/20 (1) See pages 27 and 28 for full reconciliations of Adjusted EBITDA to income (loss) before income taxes and Credit Agreement EBITDA to cash from operating activities. Case volume and net revenue per case are attributable to consolidated facilities only. Case volume and net revenue per case are also represented in Company filings on a same-facility basis, which includes both consolidated and non-consolidated facilities. Adjusted Revenue excludes a provision for doubtful accounts of $9.6 million, $25.3 million and $34.2 million for 3/31/20, 2019 and 2018 from the respectively reported GAAP Net Revenue. These amounts were included in GAAP Net Revenue upon adoption of a new revenue recognition standard in 2018. No such adjustment is required for 2017. (2) (3) Confidential 26 $2,863 468,443 Adjusted Revenue Per Case(2) Case Volume(2) $1,341 $259 14% $254 14% $164 13% 12% Revenue Adjusted EBITDA and Adjusted EBITDA Margin(1) |
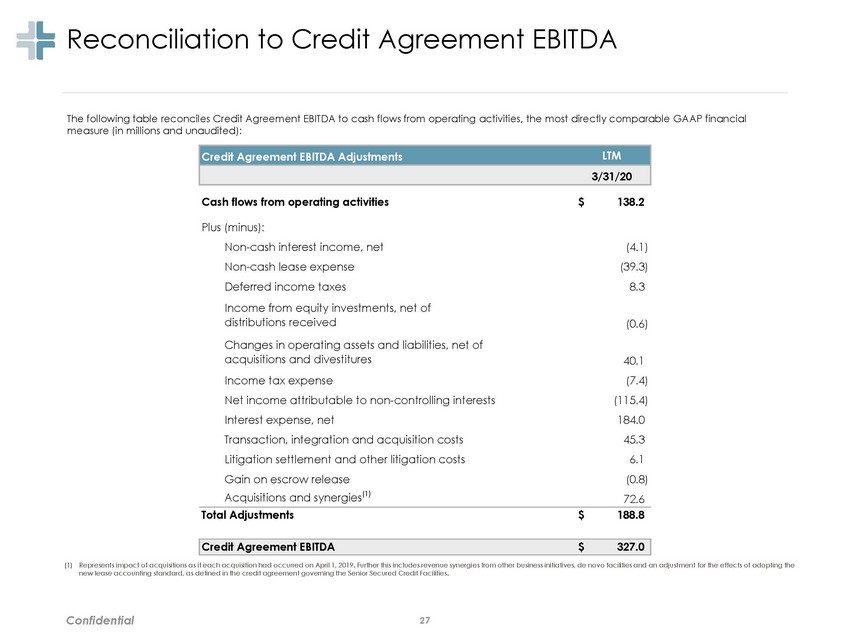 |
Reconciliation to Credit Agreement EBITDA The following table reconciles Credit Agreement EBITDA to cash flows from operating activities, the most directly comparable GAAP financial measure (in millions and unaudited): Cash flows from operating activities $ 138.2 Plus (minus): Non-cash interest income, net Non-cash lease expense Deferred income taxes Income from equity investments, net of distributions received (4.1) (39.3) 8.3 (0.6) Changes in operating assets and liabilities, net of acquisitions and divestitures Income tax expense Net income attributable to non-controlling interests Interest expense, net Transaction, integration and acquisition costs Litigation settlement and other litigation costs Gain on escrow release Acquisitions and synergies(1) 40.1 (7.4) (115.4) 184.0 45.3 6.1 (0.8) 72.6 Total Adjustments $ 188.8 (1) Represents impact of acquisitions as if each acquisition had occurred on April 1, 2019. Further this includes revenue synergies from other business initiatives, de novo facilities and an adjustment for the effects of adopting the new lease accounting standard, as defined in the credit agreement governing the Senior Secured Credit Facilities. Confidential 27 Credit Agreement EBITDA $ 327.0 Credit Agreement EBITDA Adjustments LTM 3/31/20 |
 |
Reconciliation to Adjusted EBITDA The following table reconciles Adjusted EBITDA to income (loss) before income taxes, the most directly comparable GAAP financial measure (in millions and unaudited): Income (loss) before income taxes $ 25.8 $ 54.6 $ (69.2) $ 82.3 Plus (minus): Net income attributable to non-controlling interests Interest expense, net Depreciation and amortization Equity-based compensation Contingent acquisition compensation expense Transaction, integration & acquisition costs(1) Loss (gain) on litigation settlements & other litigation costs(2) Gain on acquisition escrow release (Gain) loss on disposals and deconsolidations, net Reserve adjustments(3) Impairment charges Gain on amendment to tax receivable agreement Tax receivable agreement expense (benefit) expense Loss on debt extinguishment (115.4) 184.0 79.5 11.8 - 45.3 6.1 (0.8) (1.5) - 7.9 - - 11.7 (119.9) 178.9 76.5 10.2 - 36.1 4.6 - (4.4) - 7.9 - 2.4 11.7 (110.1) 147.0 67.4 9.3 1.5 34.0 46.0 - 31.8 2.7 74.4 - - - (81.7) 117.7 51.9 5.6 7.0 17.0 (12.5) (1.2) 1.7 - - (16.4) (25.3) 18.2 Total Adjustments $ 228.6 $ 204.0 $ 304.0 $ 82.0 (1) For the years ended December 31, 2019 and 2018, this amount includes transaction and integration costs of $19.0 million and $31.7 million, respectively, and acquisition costs of $2.8 million and $2.2 million, respectively. This amount further includes start-up costs related to a de novo surgical hospital of $14.3 million for the year ended December 31, 2019, with no comparable costs in the 2018 period. For the combined year ended December 31, 2017, this amount includes transaction and integration costs of $13.1 million and acquisition costs of $3.9 million. There were no start-up costs related to the de novo surgical hospital in the 2017 periods. For the years ended December 31, 2019 and 2018, this amount includes a loss on litigation settlements of $0.2 million and $46.0 million, respectively. This amount further includes other litigation costs of $4.4 million for the year ended December 31, 2019, with no comparable costs in the 2018 period. For the combined year ended December 31, 2017, this amount includes a gain on litigation settlements of $12.5 million. This amount represents adjustments to revenue in connection with applying consistent policies across the combined company as a result of the integration of Surgery Partners and NSH. (2) (3) Confidential 28 Adjusted EBITDA $ 254.4 $ 258.6 $ 234.8 $ 164.3 EBITDA Adjustments LTM FYE 3/31/20 2019 2018 2017 |