Attached files
| file | filename |
|---|---|
| 8-K - 8-K - SLM Corp | slm-20200722.htm |
Exhibit 99.1 SLM Corporation Earnings Presentation Second Quarter 2020 July 23, 2020
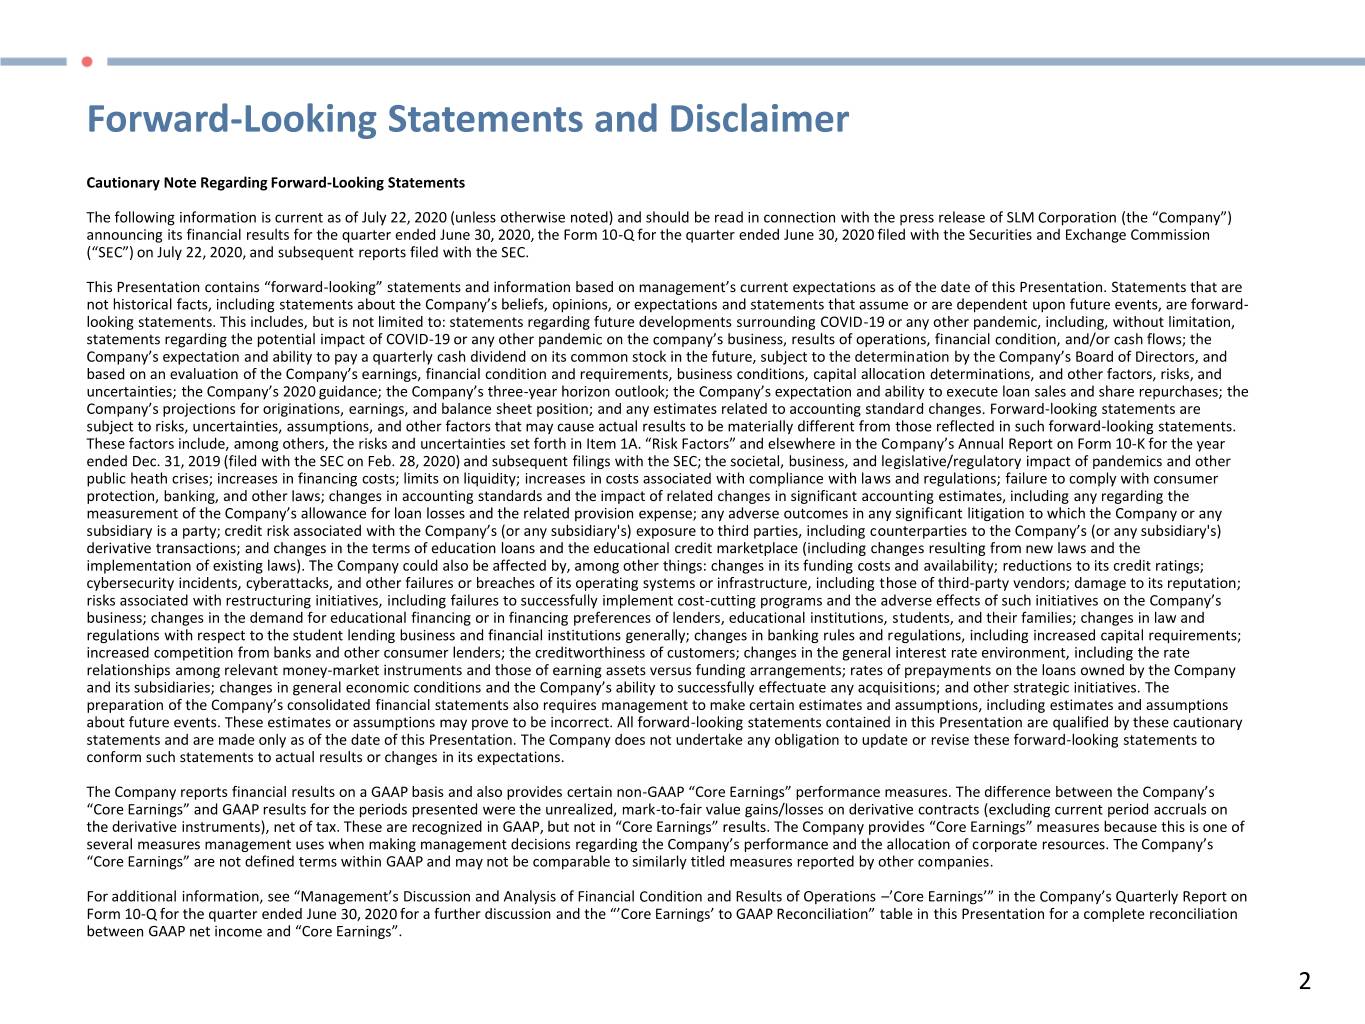
Forward-Looking Statements and Disclaimer Cautionary Note Regarding Forward-Looking Statements The following information is current as of July 22, 2020 (unless otherwise noted) and should be read in connection with the press release of SLM Corporation (the “Company”) announcing its financial results for the quarter ended June 30, 2020, the Form 10-Q for the quarter ended June 30, 2020 filed with the Securities and Exchange Commission (“SEC”) on July 22, 2020, and subsequent reports filed with the SEC. This Presentation contains “forward-looking” statements and information based on management’s current expectations as of the date of this Presentation. Statements that are not historical facts, including statements about the Company’s beliefs, opinions, or expectations and statements that assume or are dependent upon future events, are forward- looking statements. This includes, but is not limited to: statements regarding future developments surrounding COVID-19 or any other pandemic, including, without limitation, statements regarding the potential impact of COVID-19 or any other pandemic on the company’s business, results of operations, financial condition, and/or cash flows; the Company’s expectation and ability to pay a quarterly cash dividend on its common stock in the future, subject to the determination by the Company’s Board of Directors, and based on an evaluation of the Company’s earnings, financial condition and requirements, business conditions, capital allocation determinations, and other factors, risks, and uncertainties; the Company’s 2020 guidance; the Company’s three-year horizon outlook; the Company’s expectation and ability to execute loan sales and share repurchases; the Company’s projections for originations, earnings, and balance sheet position; and any estimates related to accounting standard changes. Forward-looking statements are subject to risks, uncertainties, assumptions, and other factors that may cause actual results to be materially different from those reflected in such forward-looking statements. These factors include, among others, the risks and uncertainties set forth in Item 1A. “Risk Factors” and elsewhere in the Company’s Annual Report on Form 10-K for the year ended Dec. 31, 2019 (filed with the SEC on Feb. 28, 2020) and subsequent filings with the SEC; the societal, business, and legislative/regulatory impact of pandemics and other public heath crises; increases in financing costs; limits on liquidity; increases in costs associated with compliance with laws and regulations; failure to comply with consumer protection, banking, and other laws; changes in accounting standards and the impact of related changes in significant accounting estimates, including any regarding the measurement of the Company’s allowance for loan losses and the related provision expense; any adverse outcomes in any significant litigation to which the Company or any subsidiary is a party; credit risk associated with the Company’s (or any subsidiary's) exposure to third parties, including counterparties to the Company’s (or any subsidiary's) derivative transactions; and changes in the terms of education loans and the educational credit marketplace (including changes resulting from new laws and the implementation of existing laws). The Company could also be affected by, among other things: changes in its funding costs and availability; reductions to its credit ratings; cybersecurity incidents, cyberattacks, and other failures or breaches of its operating systems or infrastructure, including those of third-party vendors; damage to its reputation; risks associated with restructuring initiatives, including failures to successfully implement cost-cutting programs and the adverse effects of such initiatives on the Company’s business; changes in the demand for educational financing or in financing preferences of lenders, educational institutions, students, and their families; changes in law and regulations with respect to the student lending business and financial institutions generally; changes in banking rules and regulations, including increased capital requirements; increased competition from banks and other consumer lenders; the creditworthiness of customers; changes in the general interest rate environment, including the rate relationships among relevant money-market instruments and those of earning assets versus funding arrangements; rates of prepayments on the loans owned by the Company and its subsidiaries; changes in general economic conditions and the Company’s ability to successfully effectuate any acquisitions; and other strategic initiatives. The preparation of the Company’s consolidated financial statements also requires management to make certain estimates and assumptions, including estimates and assumptions about future events. These estimates or assumptions may prove to be incorrect. All forward-looking statements contained in this Presentation are qualified by these cautionary statements and are made only as of the date of this Presentation. The Company does not undertake any obligation to update or revise these forward-looking statements to conform such statements to actual results or changes in its expectations. The Company reports financial results on a GAAP basis and also provides certain non-GAAP “Core Earnings” performance measures. The difference between the Company’s “Core Earnings” and GAAP results for the periods presented were the unrealized, mark-to-fair value gains/losses on derivative contracts (excluding current period accruals on the derivative instruments), net of tax. These are recognized in GAAP, but not in “Core Earnings” results. The Company provides “Core Earnings” measures because this is one of several measures management uses when making management decisions regarding the Company’s performance and the allocation of corporate resources. The Company’s “Core Earnings” are not defined terms within GAAP and may not be comparable to similarly titled measures reported by other companies. For additional information, see “Management’s Discussion and Analysis of Financial Condition and Results of Operations –’Core Earnings’” in the Company’s Quarterly Report on Form 10-Q for the quarter ended June 30, 2020 for a further discussion and the “’Core Earnings’ to GAAP Reconciliation” table in this Presentation for a complete reconciliation between GAAP net income and “Core Earnings”. 2
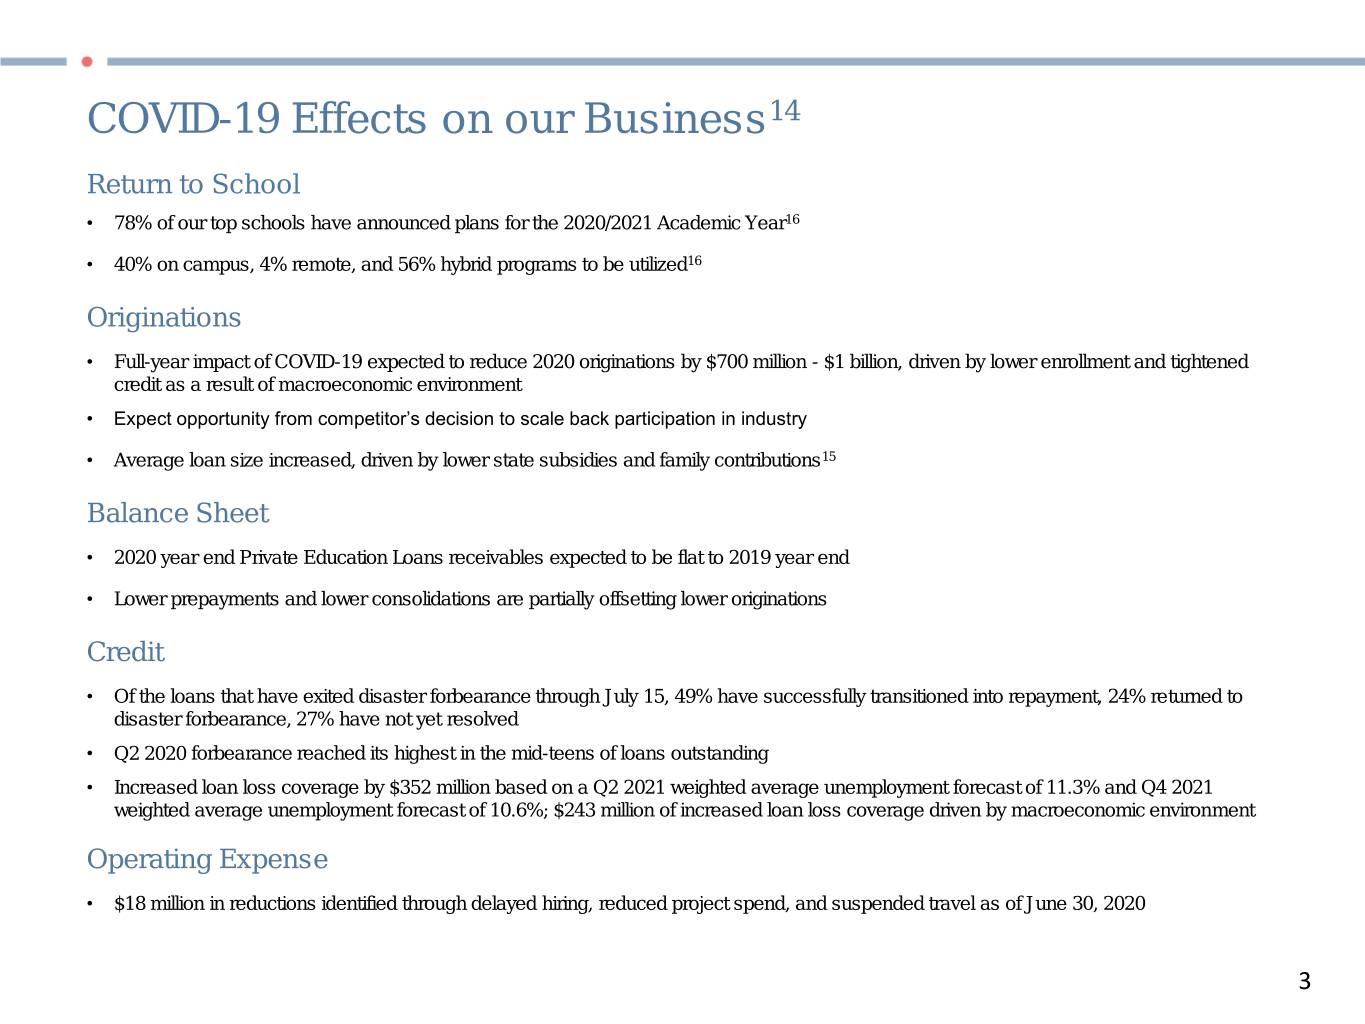
COVID-19 Effects on our Business14 Return to School • 78% of our top schools have announced plans for the 2020/2021 Academic Year16 • 40% on campus, 4% remote, and 56% hybrid programs to be utilized16 Originations • Full-year impact of COVID-19 expected to reduce 2020 originations by $700 million - $1 billion, driven by lower enrollment and tightened credit as a result of macroeconomic environment • Expect opportunity from competitor’s decision to scale back participation in industry • Average loan size increased, driven by lower state subsidies and family contributions15 Balance Sheet • 2020 year end Private Education Loans receivables expected to be flat to 2019 year end • Lower prepayments and lower consolidations are partially offsetting lower originations Credit • Of the loans that have exited disaster forbearance through July 15, 49% have successfully transitioned into repayment, 24% returned to disaster forbearance, 27% have not yet resolved • Q2 2020 forbearance reached its highest in the mid-teens of loans outstanding • Increased loan loss coverage by $352 million based on a Q2 2021 weighted average unemployment forecast of 11.3% and Q4 2021 weighted average unemployment forecast of 10.6%; $243 million of increased loan loss coverage driven by macroeconomic environment Operating Expense • $18 million in reductions identified through delayed hiring, reduced project spend, and suspended travel as of June 30, 2020 3
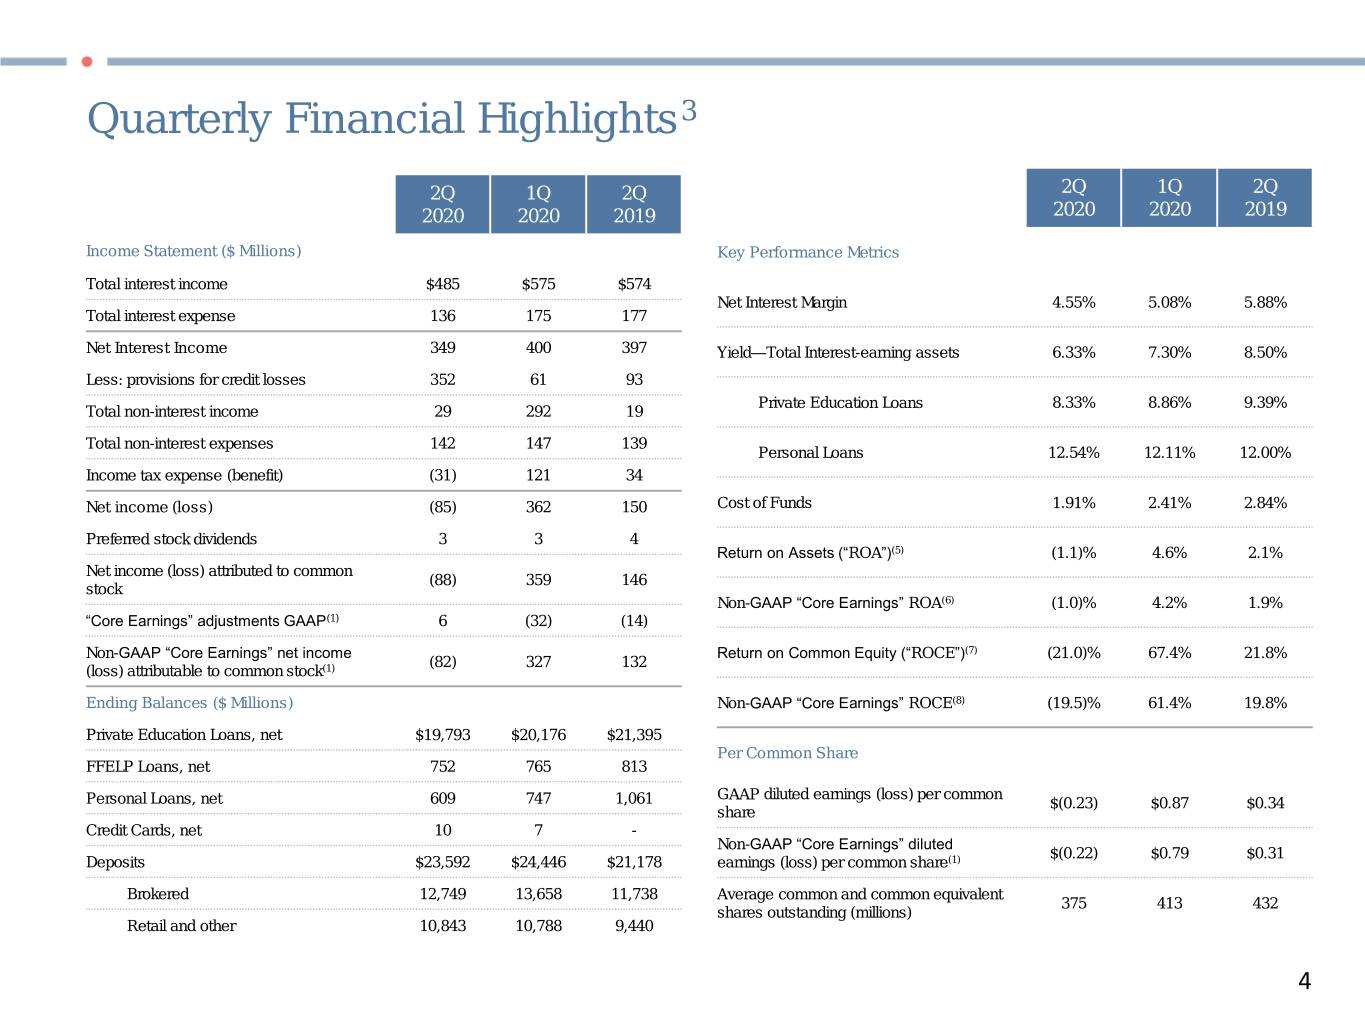
Quarterly Financial Highlights3 2Q 1Q 2Q 2Q 1Q 2Q 2020 2020 2019 2020 2020 2019 Income Statement ($ Millions) Key Performance Metrics Total interest income $485 $575 $574 Net Interest Margin 4.55% 5.08% 5.88% Total interest expense 136 175 177 Net Interest Income 349 400 397 Yield—Total Interest-earning assets 6.33% 7.30% 8.50% Less: provisions for credit losses 352 61 93 Private Education Loans 8.33% 8.86% 9.39% Total non-interest income 29 292 19 Total non-interest expenses 142 147 139 Personal Loans 12.54% 12.11% 12.00% Income tax expense (benefit) (31) 121 34 Net income (loss) (85) 362 150 Cost of Funds 1.91% 2.41% 2.84% Preferred stock dividends 3 3 4 Return on Assets (“ROA”)(5) (1.1)% 4.6% 2.1% Net income (loss) attributed to common (88) 359 146 stock Non-GAAP “Core Earnings” ROA(6) (1.0)% 4.2% 1.9% “Core Earnings” adjustments GAAP(1) 6 (32) (14) Non-GAAP “Core Earnings” net income Return on Common Equity (“ROCE”)(7) (21.0)% 67.4% 21.8% (82) 327 132 (loss) attributable to common stock(1) Ending Balances ($ Millions) Non-GAAP “Core Earnings” ROCE(8) (19.5)% 61.4% 19.8% Private Education Loans, net $19,793 $20,176 $21,395 Per Common Share FFELP Loans, net 752 765 813 GAAP diluted earnings (loss) per common Personal Loans, net 609 747 1,061 $(0.23) $0.87 $0.34 share Credit Cards, net 10 7 - Non-GAAP “Core Earnings” diluted $(0.22) $0.79 $0.31 Deposits $23,592 $24,446 $21,178 earnings (loss) per common share(1) Brokered 12,749 13,658 11,738 Average common and common equivalent 375 413 432 shares outstanding (millions) Retail and other 10,843 10,788 9,440 4
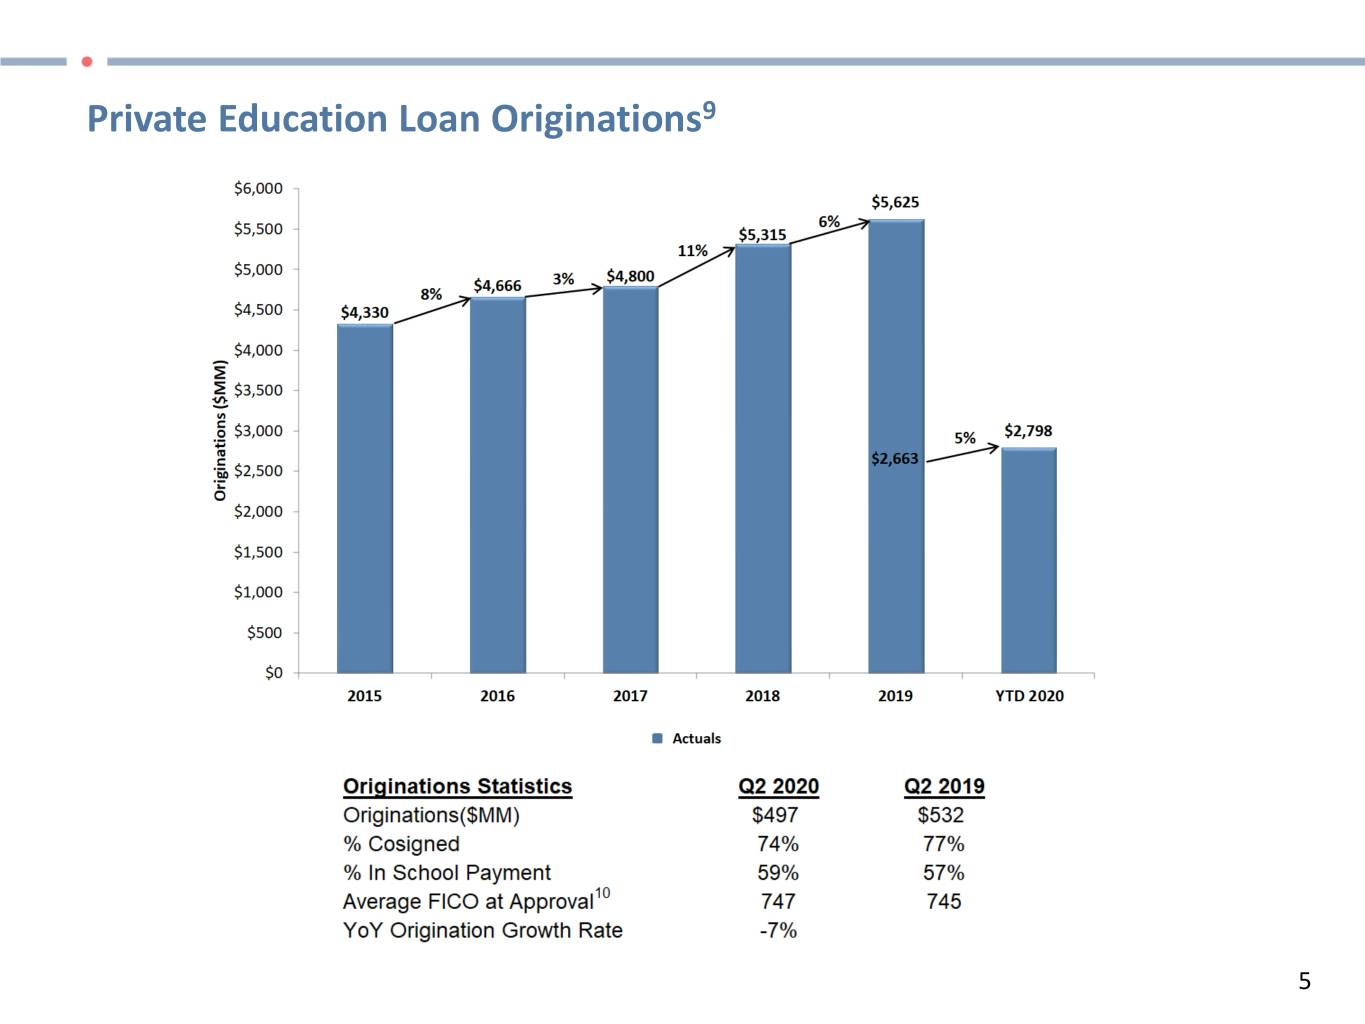
Private Education Loan Originations9 5
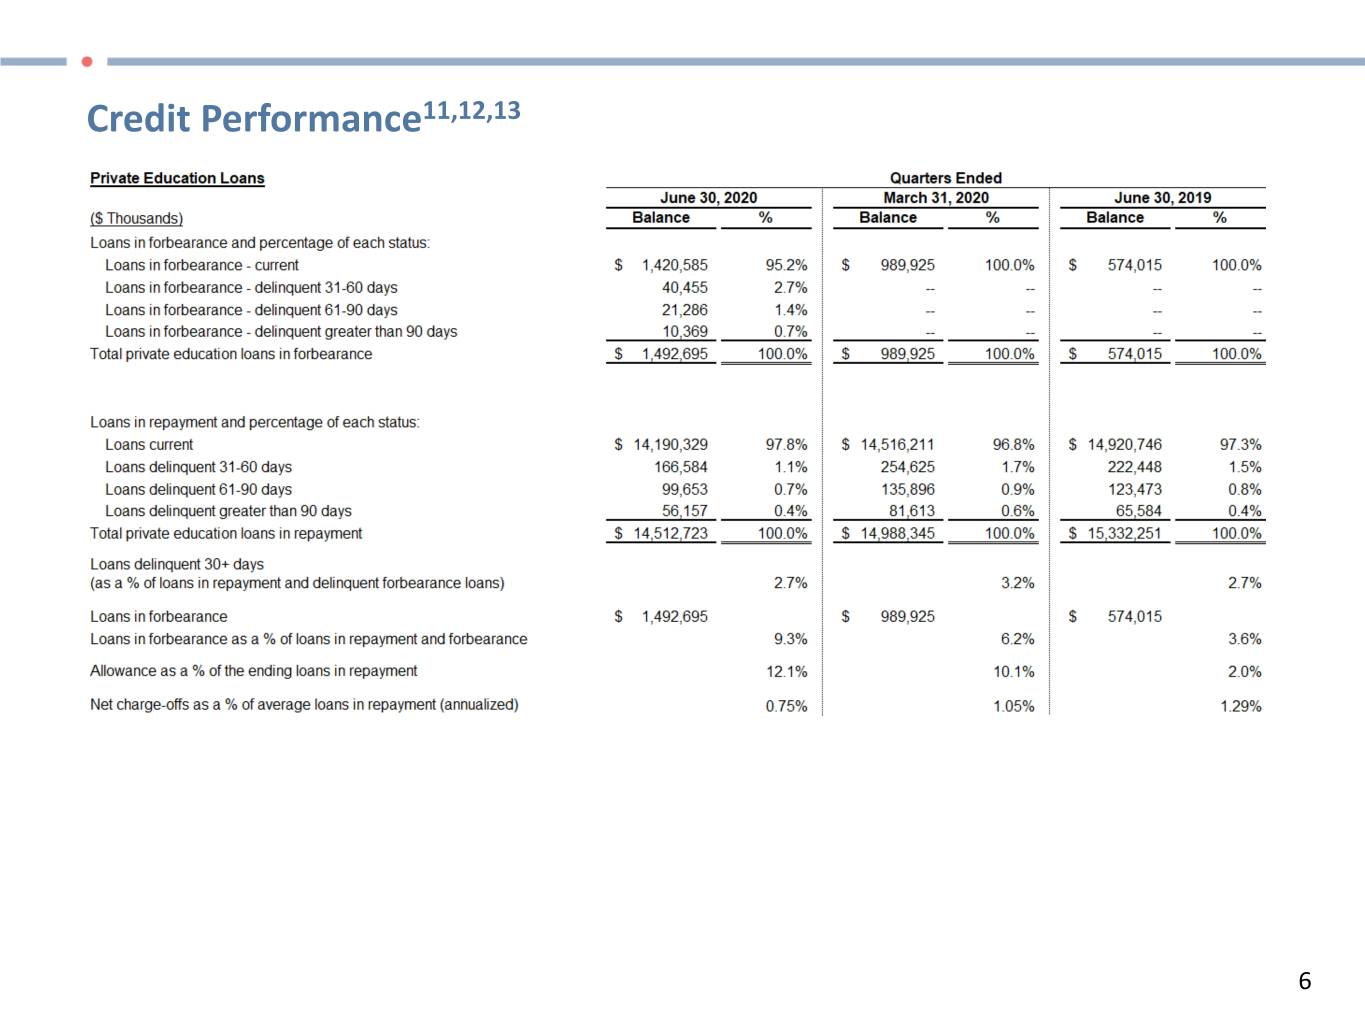
Credit Performance11,12,13 6
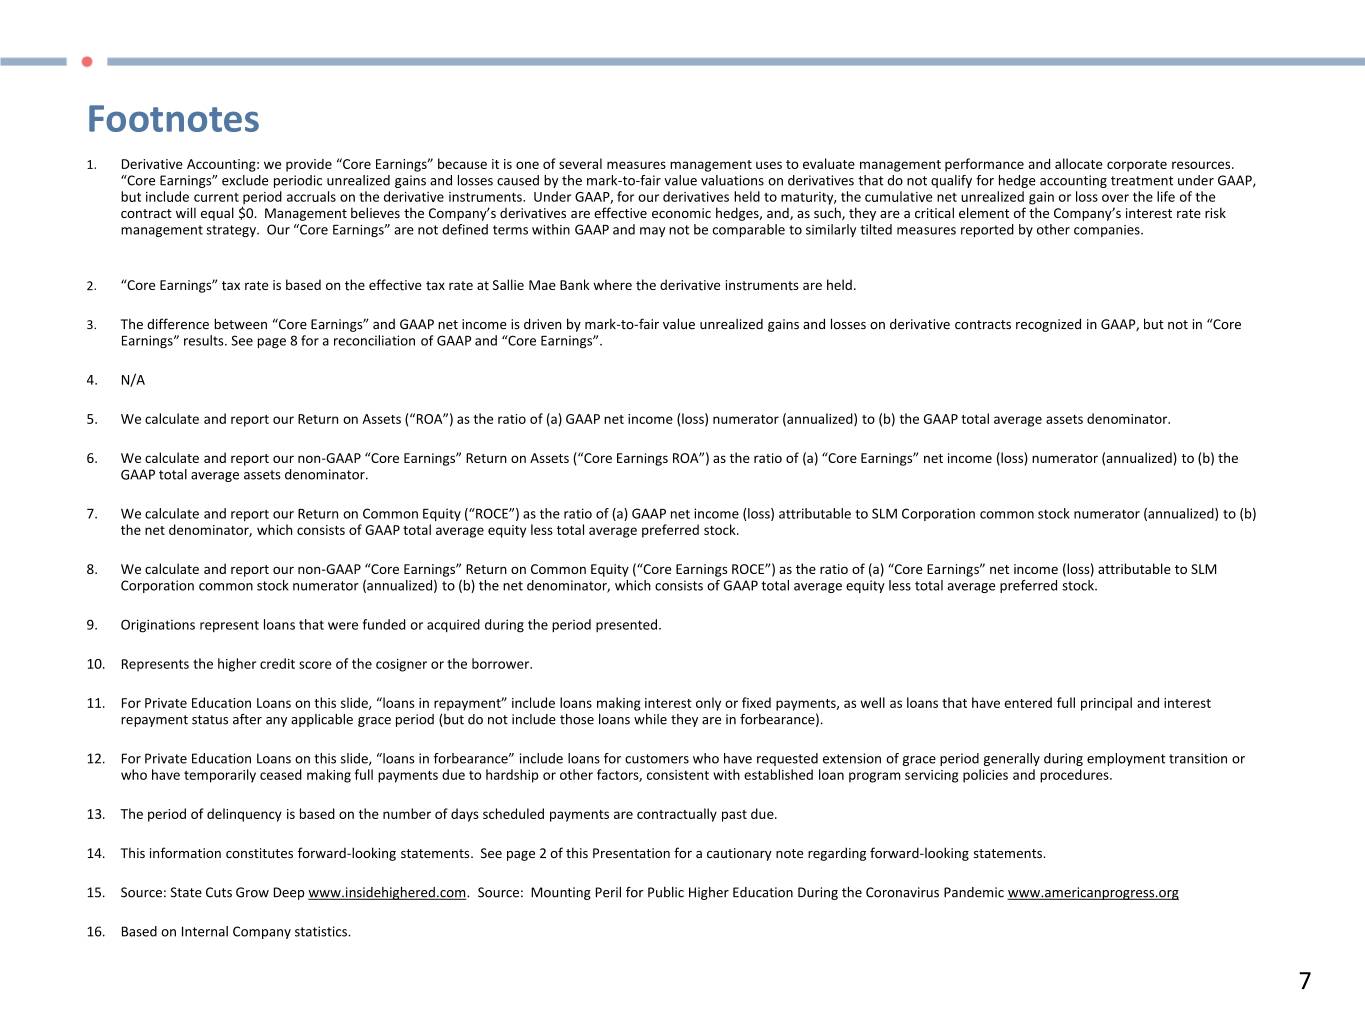
Footnotes 1. Derivative Accounting: we provide “Core Earnings” because it is one of several measures management uses to evaluate management performance and allocate corporate resources. “Core Earnings” exclude periodic unrealized gains and losses caused by the mark-to-fair value valuations on derivatives that do not qualify for hedge accounting treatment under GAAP, but include current period accruals on the derivative instruments. Under GAAP, for our derivatives held to maturity, the cumulative net unrealized gain or loss over the life of the contract will equal $0. Management believes the Company’s derivatives are effective economic hedges, and, as such, they are a critical element of the Company’s interest rate risk management strategy. Our “Core Earnings” are not defined terms within GAAP and may not be comparable to similarly tilted measures reported by other companies. 2. “Core Earnings” tax rate is based on the effective tax rate at Sallie Mae Bank where the derivative instruments are held. 3. The difference between “Core Earnings” and GAAP net income is driven by mark-to-fair value unrealized gains and losses on derivative contracts recognized in GAAP, but not in “Core Earnings” results. See page 8 for a reconciliation of GAAP and “Core Earnings”. 4. N/A 5. We calculate and report our Return on Assets (“ROA”) as the ratio of (a) GAAP net income (loss) numerator (annualized) to (b) the GAAP total average assets denominator. 6. We calculate and report our non-GAAP “Core Earnings” Return on Assets (“Core Earnings ROA”) as the ratio of (a) “Core Earnings” net income (loss) numerator (annualized) to (b) the GAAP total average assets denominator. 7. We calculate and report our Return on Common Equity (“ROCE”) as the ratio of (a) GAAP net income (loss) attributable to SLM Corporation common stock numerator (annualized) to (b) the net denominator, which consists of GAAP total average equity less total average preferred stock. 8. We calculate and report our non-GAAP “Core Earnings” Return on Common Equity (“Core Earnings ROCE”) as the ratio of (a) “Core Earnings” net income (loss) attributable to SLM Corporation common stock numerator (annualized) to (b) the net denominator, which consists of GAAP total average equity less total average preferred stock. 9. Originations represent loans that were funded or acquired during the period presented. 10. Represents the higher credit score of the cosigner or the borrower. 11. For Private Education Loans on this slide, “loans in repayment” include loans making interest only or fixed payments, as well as loans that have entered full principal and interest repayment status after any applicable grace period (but do not include those loans while they are in forbearance). 12. For Private Education Loans on this slide, “loans in forbearance” include loans for customers who have requested extension of grace period generally during employment transition or who have temporarily ceased making full payments due to hardship or other factors, consistent with established loan program servicing policies and procedures. 13. The period of delinquency is based on the number of days scheduled payments are contractually past due. 14. This information constitutes forward-looking statements. See page 2 of this Presentation for a cautionary note regarding forward-looking statements. 15. Source: State Cuts Grow Deep www.insidehighered.com. Source: Mounting Peril for Public Higher Education During the Coronavirus Pandemic www.americanprogress.org 16. Based on Internal Company statistics. 7
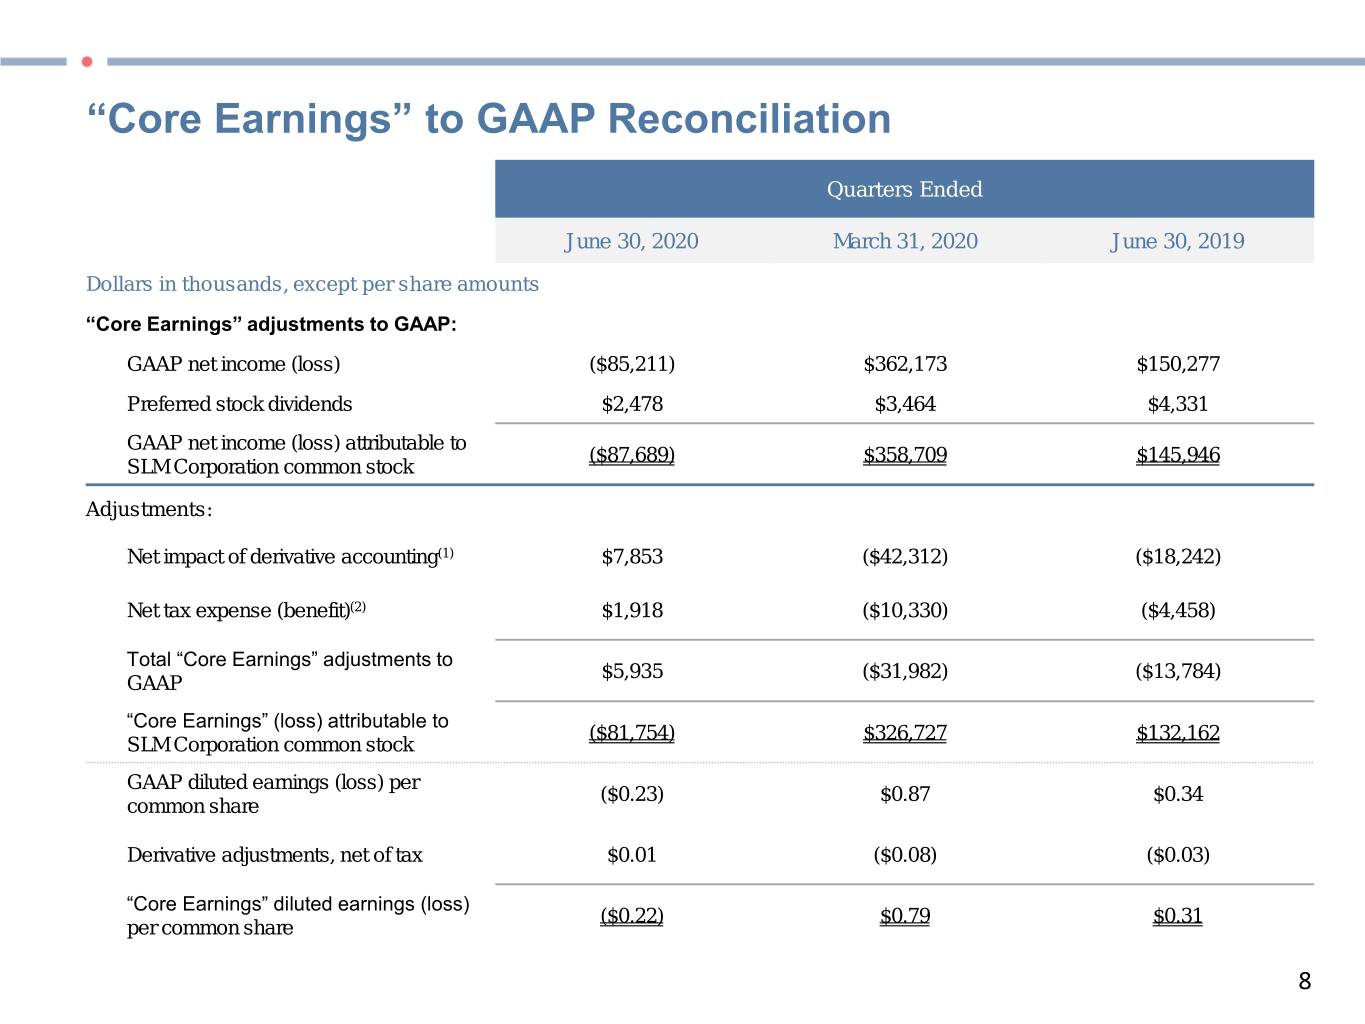
“Core Earnings” to GAAP Reconciliation Quarters Ended June 30, 2020 March 31, 2020 June 30, 2019 Dollars in thousands, except per share amounts “Core Earnings” adjustments to GAAP: GAAP net income (loss) ($85,211) $362,173 $150,277 Preferred stock dividends $2,478 $3,464 $4,331 GAAP net income (loss) attributable to ($87,689) $358,709 $145,946 SLM Corporation common stock Adjustments: Net impact of derivative accounting(1) $7,853 ($42,312) ($18,242) Net tax expense (benefit)(2) $1,918 ($10,330) ($4,458) Total “Core Earnings” adjustments to $5,935 ($31,982) ($13,784) GAAP “Core Earnings” (loss) attributable to ($81,754) $326,727 $132,162 SLM Corporation common stock GAAP diluted earnings (loss) per ($0.23) $0.87 $0.34 common share Derivative adjustments, net of tax $0.01 ($0.08) ($0.03) “Core Earnings” diluted earnings (loss) ($0.22) $0.79 $0.31 per common share 8
