Attached files
| file | filename |
|---|---|
| EX-99.1 - EX-99.1 - OLD SECOND BANCORP INC | osbc-20200722ex991b82582.htm |
| 8-K - 8-K - OLD SECOND BANCORP INC | osbc-20200722x8k.htm |
Exhibit 99.2
| Old Second Bancorp, Inc. Loan Portfolio Disclosures As of June 30, 2020 |
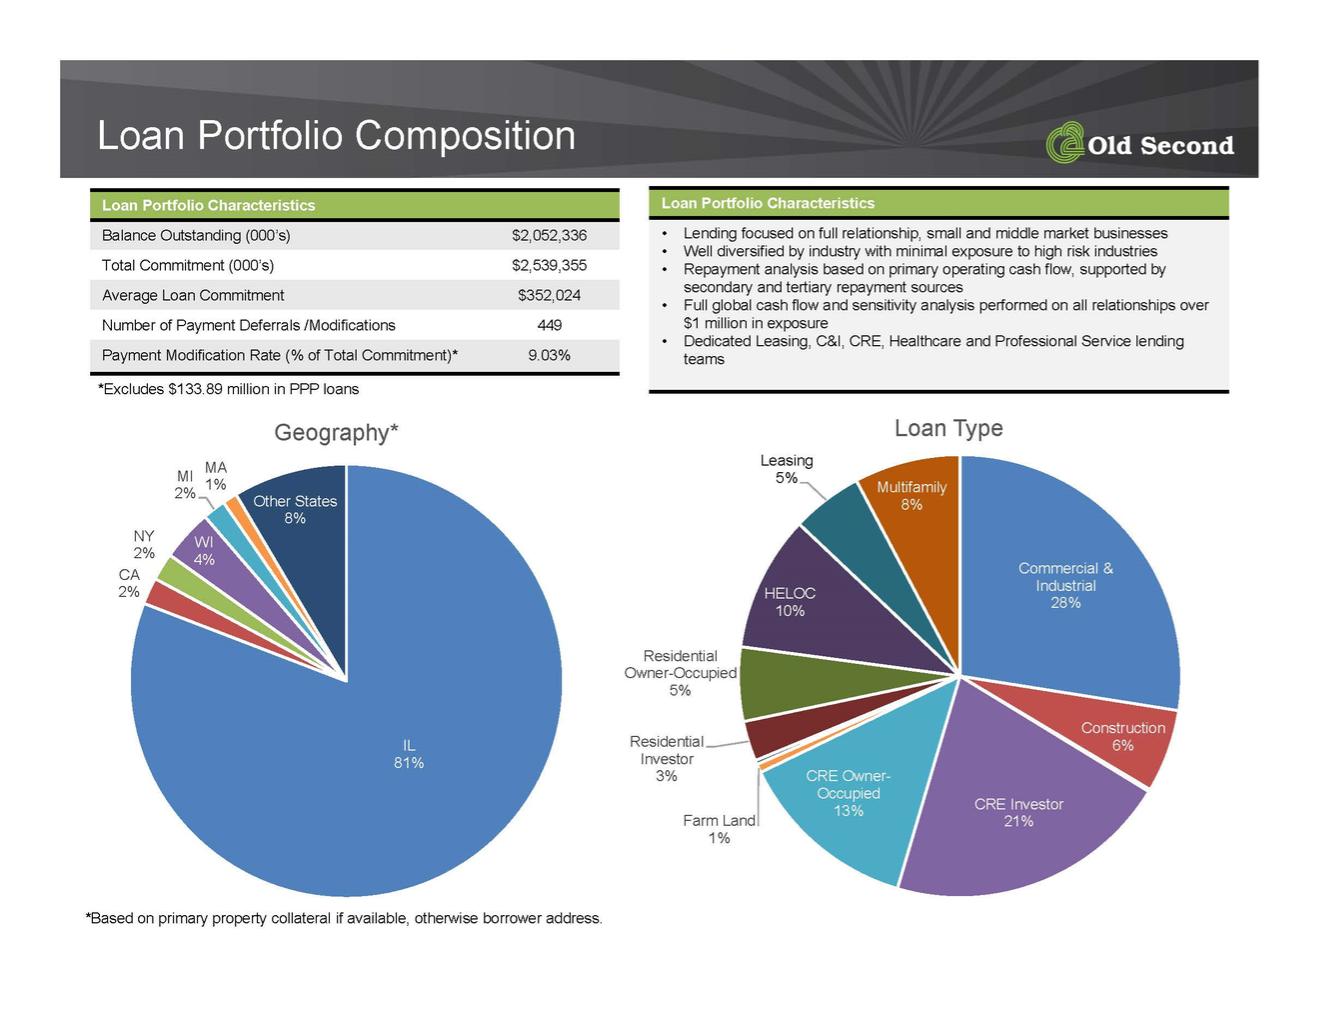
| Loan Portfolio Composition Loan Portfolio Characteristics Balance Outstanding (000’s) $2,052,336 Total Commitment (000’s) $2,539,355 Average Loan Commitment $352,024 Number of Payment Deferrals /Modifications 449 Payment Modification Rate (% of Total Commitment)* 9.03% Loan Portfolio Characteristics • Lending focused on full relationship, small and middle market businesses • Well diversified by industry with minimal exposure to high risk industries • Repayment analysis based on primary operating cash flow, supported by secondary and tertiary repayment sources • Full global cash flow and sensitivity analysis performed on all relationships over $1 million in exposure • Dedicated Leasing, C&I, CRE, Healthcare and Professional Service lending teams Commercial & Industrial 28% Construction 6% CRE Investor 21% CRE Owner- Occupied Farm Land 13% 1% Residential Investor 3% Residential Owner-Occupied 5% HELOC 10% Leasing 5% Multifamily 8% Loan Type IL 81% CA 2% NY 2% WI 4% MI 2% MA 1% Other States 8% Geography* *Based on primary property collateral if available, otherwise borrower address. *Excludes $133.89 million in PPP loans |
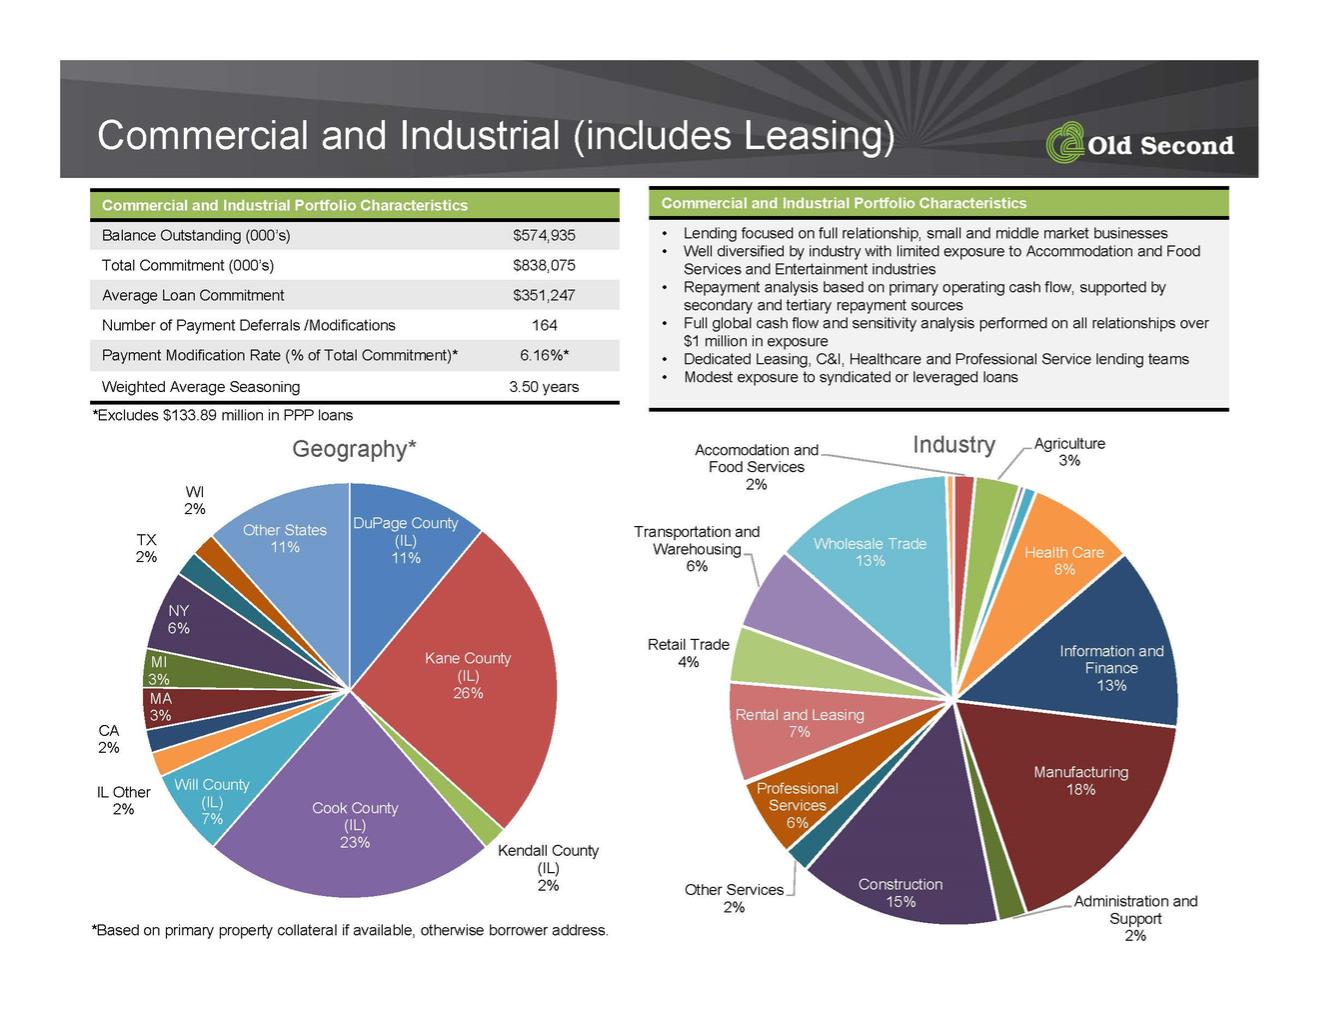
| Commercial and Industrial (includes Leasing) Commercial and Industrial Portfolio Characteristics Balance Outstanding (000’s) $574,935 Total Commitment (000’s) $838,075 Average Loan Commitment $351,247 Number of Payment Deferrals /Modifications 164 Payment Modification Rate (% of Total Commitment)* 6.16%* Weighted Average Seasoning 3.50 years Commercial and Industrial Portfolio Characteristics • Lending focused on full relationship, small and middle market businesses • Well diversified by industry with limited exposure to Accommodation and Food Services and Entertainment industries • Repayment analysis based on primary operating cash flow, supported by secondary and tertiary repayment sources • Full global cash flow and sensitivity analysis performed on all relationships over $1 million in exposure • Dedicated Leasing, C&I, Healthcare and Professional Service lending teams • Modest exposure to syndicated or leveraged loans DuPage County (IL) 11% Kane County (IL) 26% Kendall County (IL) 2% Cook County (IL) 23% Will County (IL) 7% IL Other 2% CA 2% MA 3% MI 3% NY 6% TX 2% WI 2% Other States 11% Geography* *Based on primary property collateral if available, otherwise borrower address. Accomodation and Food Services 2% Agriculture 3% Health Care 8% Information and Finance 13% Manufacturing 18% Administration and Support 2% Construction 15% Other Services 2% Professional Services 6% Rental and Leasing 7% Retail Trade 4% Transportation and Warehousing 6% Wholesale Trade 13% Industry *Excludes $133.89 million in PPP loans |
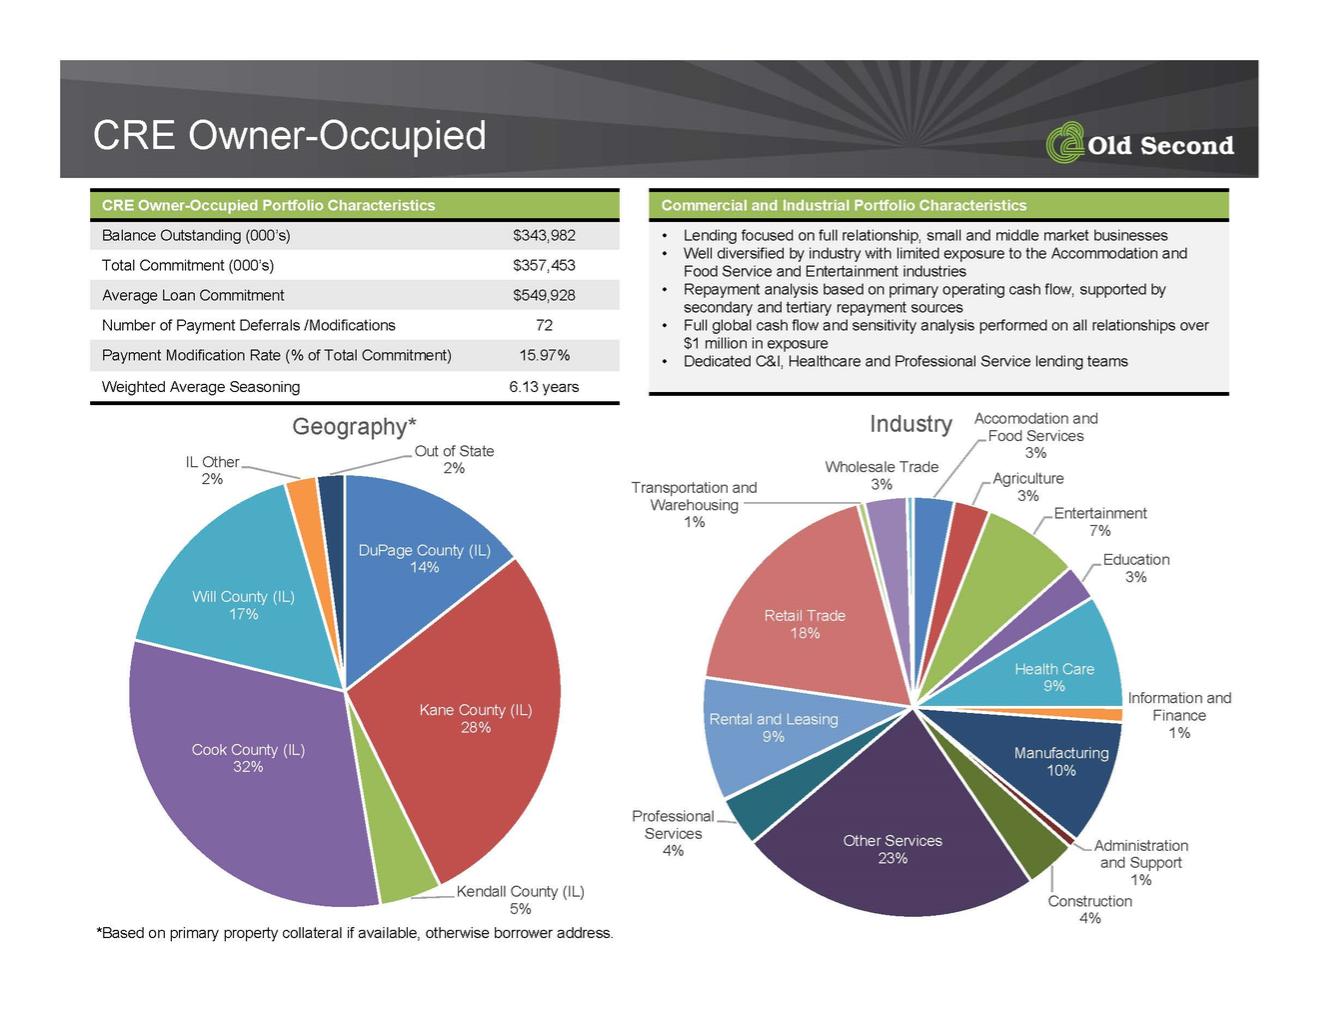
| CRE Owner-Occupied CRE Owner-Occupied Portfolio Characteristics Balance Outstanding (000’s) $343,982 Total Commitment (000’s) $357,453 Average Loan Commitment $549,928 Number of Payment Deferrals /Modifications 72 Payment Modification Rate (% of Total Commitment) 15.97% Weighted Average Seasoning 6.13 years Commercial and Industrial Portfolio Characteristics • Lending focused on full relationship, small and middle market businesses • Well diversified by industry with limited exposure to the Accommodation and Food Service and Entertainment industries • Repayment analysis based on primary operating cash flow, supported by secondary and tertiary repayment sources • Full global cash flow and sensitivity analysis performed on all relationships over $1 million in exposure • Dedicated C&I, Healthcare and Professional Service lending teams DuPage County (IL) 14% Kane County (IL) 28% Kendall County (IL) 5% Cook County (IL) 32% Will County (IL) 17% IL Other 2% Out of State 2% Geography* *Based on primary property collateral if available, otherwise borrower address. Accomodation and Food Services 3% Agriculture 3% Entertainment 7% Education 3% Health Care 9% Information and Finance 1% Manufacturing 10% Administration and Support 1% Construction 4% Other Services 23% Professional Services 4% Rental and Leasing 9% Retail Trade 18% Transportation and Warehousing 1% Wholesale Trade 3% Industry |
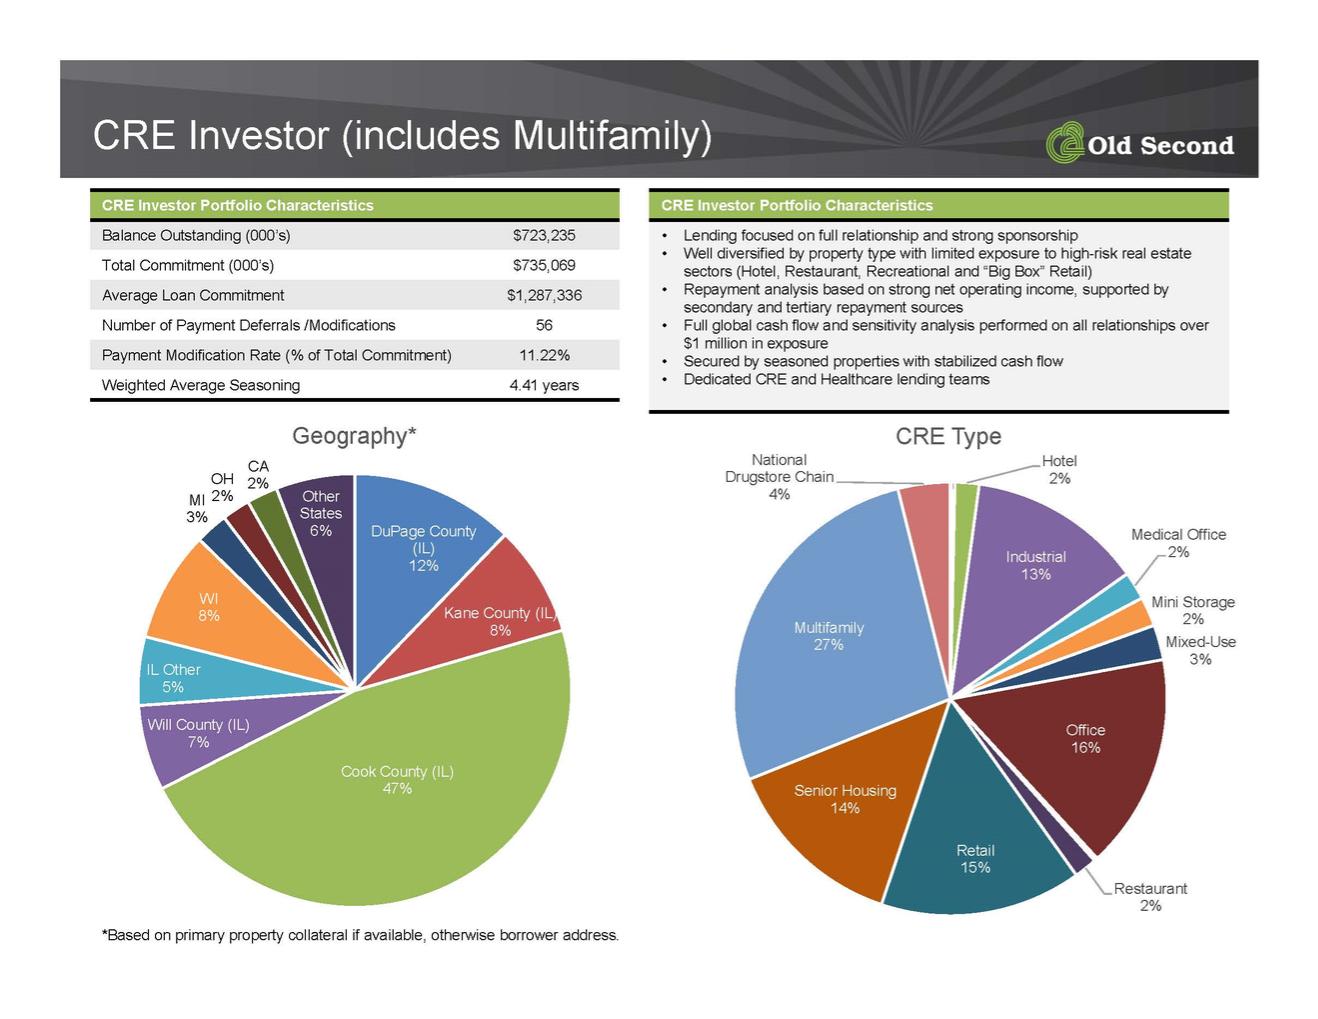
| CRE Investor (includes Multifamily) CRE Investor Portfolio Characteristics Balance Outstanding (000’s) $723,235 Total Commitment (000’s) $735,069 Average Loan Commitment $1,287,336 Number of Payment Deferrals /Modifications 56 Payment Modification Rate (% of Total Commitment) 11.22% Weighted Average Seasoning 4.41 years CRE Investor Portfolio Characteristics • Lending focused on full relationship and strong sponsorship • Well diversified by property type with limited exposure to high-risk real estate sectors (Hotel, Restaurant, Recreational and “Big Box” Retail) • Repayment analysis based on strong net operating income, supported by secondary and tertiary repayment sources • Full global cash flow and sensitivity analysis performed on all relationships over $1 million in exposure • Secured by seasoned properties with stabilized cash flow • Dedicated CRE and Healthcare lending teams Hotel 2% Industrial 13% Medical Office 2% Mini Storage 2% Mixed-Use 3% Office 16% Restaurant 2% Retail 15% Senior Housing 14% Multifamily 27% National Drugstore Chain 4% CRE Type DuPage County (IL) 12% Kane County (IL) 8% Cook County (IL) 47% Will County (IL) 7% IL Other 5% WI 8% MI 3% OH 2% CA 2% Other States 6% Geography* *Based on primary property collateral if available, otherwise borrower address. |
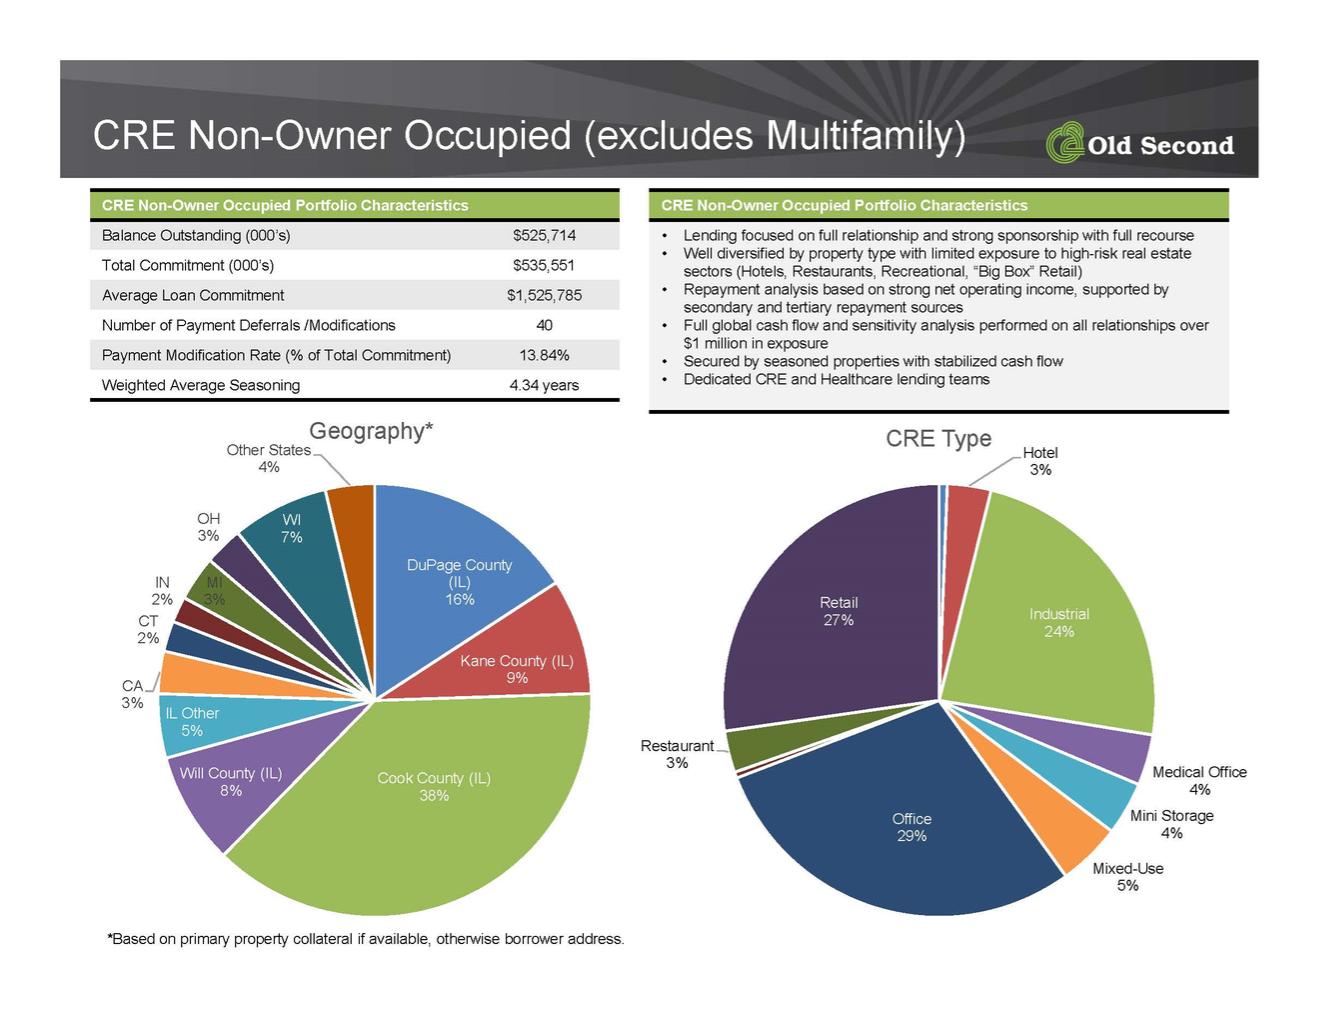
| CRE Non-Owner Occupied (excludes Multifamily) CRE Non-Owner Occupied Portfolio Characteristics Balance Outstanding (000’s) $525,714 Total Commitment (000’s) $535,551 Average Loan Commitment $1,525,785 Number of Payment Deferrals /Modifications 40 Payment Modification Rate (% of Total Commitment) 13.84% Weighted Average Seasoning 4.34 years CRE Non-Owner Occupied Portfolio Characteristics • Lending focused on full relationship and strong sponsorship with full recourse • Well diversified by property type with limited exposure to high-risk real estate sectors (Hotels, Restaurants, Recreational, “Big Box” Retail) • Repayment analysis based on strong net operating income, supported by secondary and tertiary repayment sources • Full global cash flow and sensitivity analysis performed on all relationships over $1 million in exposure • Secured by seasoned properties with stabilized cash flow • Dedicated CRE and Healthcare lending teams DuPage County (IL) 16% Kane County (IL) 9% Cook County (IL) 38% Will County (IL) 8% IL Other 5% CA 3% CT 2% IN 2% MI 3% OH 3% WI 7% Other States 4% Geography* *Based on primary property collateral if available, otherwise borrower address. Hotel 3% Industrial 24% Medical Office 4% Mini Storage 4% Mixed-Use 5% Office 29% Restaurant 3% Retail 27% CRE Type |
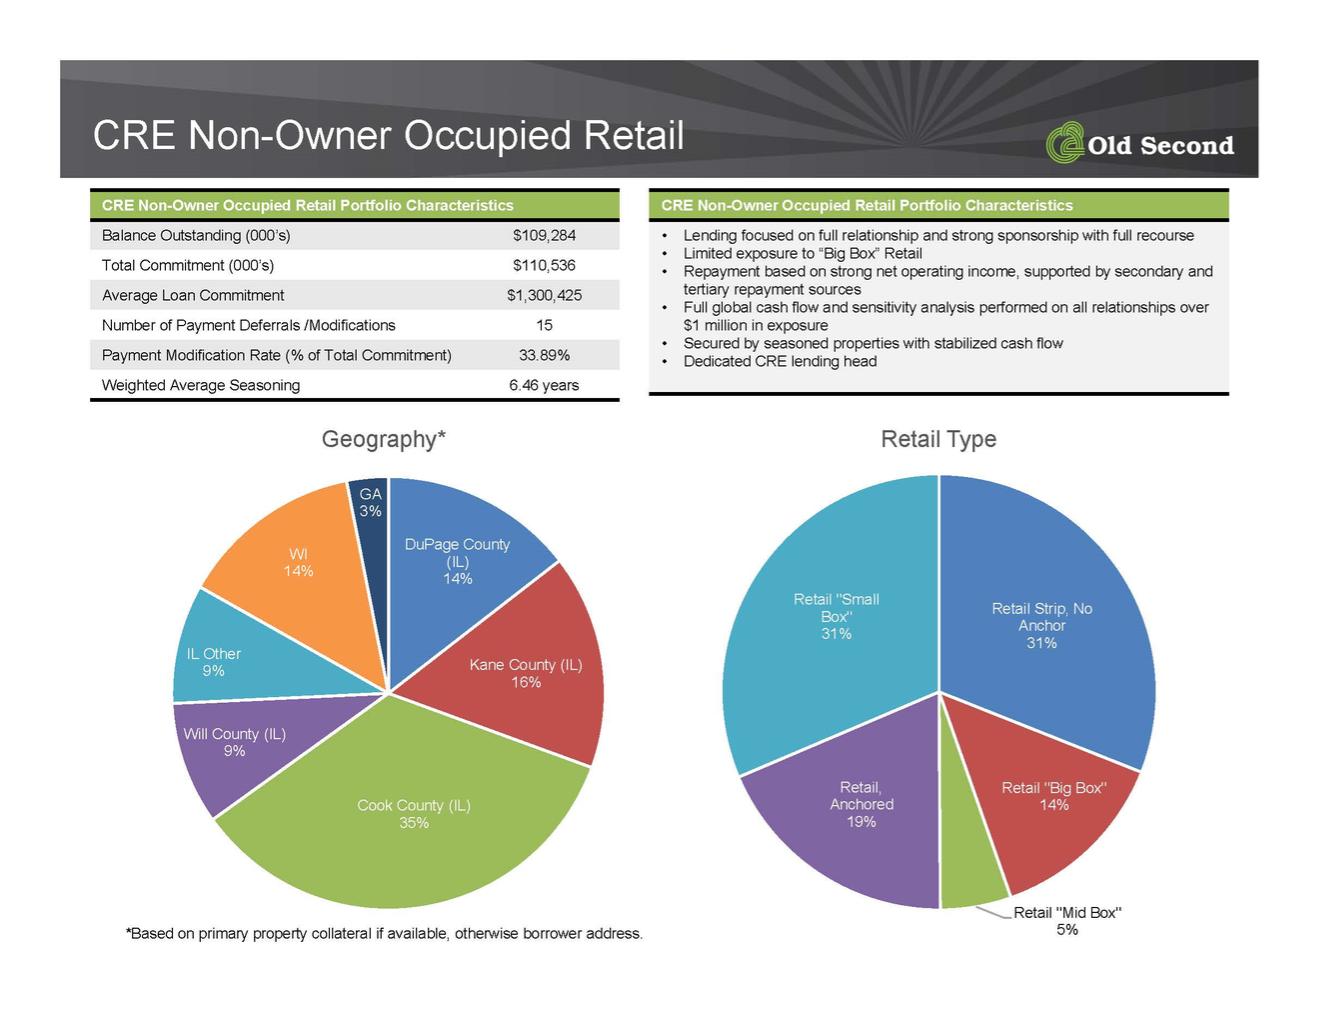
| CRE Non-Owner Occupied Retail CRE Non-Owner Occupied Retail Portfolio Characteristics Balance Outstanding (000’s) $109,284 Total Commitment (000’s) $110,536 Average Loan Commitment $1,300,425 Number of Payment Deferrals /Modifications 15 Payment Modification Rate (% of Total Commitment) 33.89% Weighted Average Seasoning 6.46 years CRE Non-Owner Occupied Retail Portfolio Characteristics • Lending focused on full relationship and strong sponsorship with full recourse • Limited exposure to “Big Box” Retail • Repayment based on strong net operating income, supported by secondary and tertiary repayment sources • Full global cash flow and sensitivity analysis performed on all relationships over $1 million in exposure • Secured by seasoned properties with stabilized cash flow • Dedicated CRE lending head Retail Strip, No Anchor 31% Retail "Big Box" 14% Retail "Mid Box" 5% Retail, Anchored 19% Retail "Small Box" 31% Retail Type DuPage County (IL) 14% Kane County (IL) 16% Cook County (IL) 35% Will County (IL) 9% IL Other 9% WI 14% GA 3% Geography* *Based on primary property collateral if available, otherwise borrower address. |
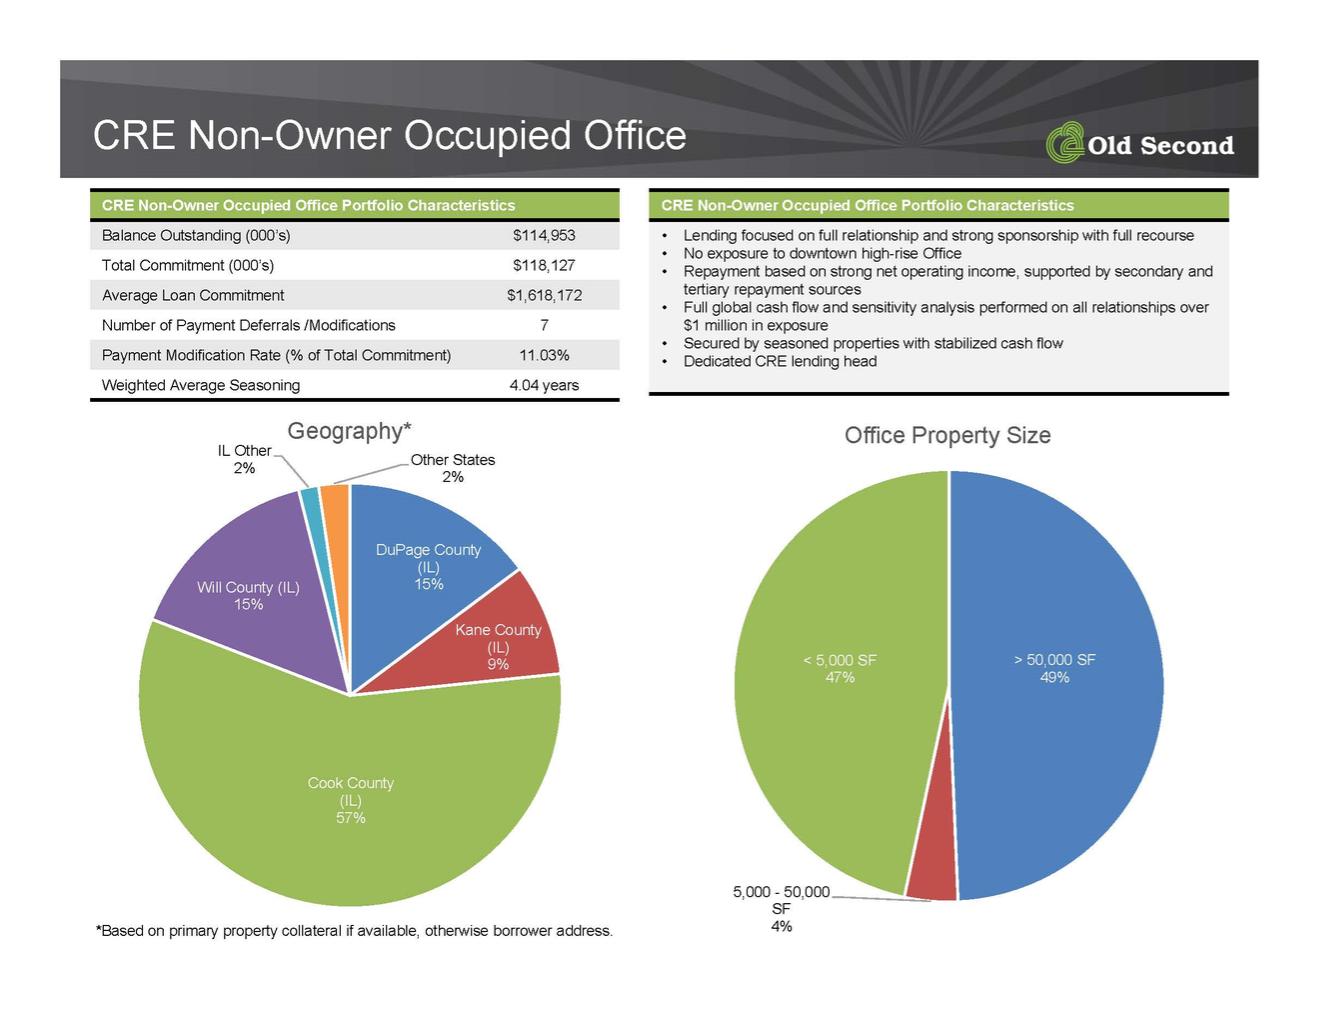
| CRE Non-Owner Occupied Office CRE Non-Owner Occupied Office Portfolio Characteristics Balance Outstanding (000’s) $114,953 Total Commitment (000’s) $118,127 Average Loan Commitment $1,618,172 Number of Payment Deferrals /Modifications 7 Payment Modification Rate (% of Total Commitment) 11.03% Weighted Average Seasoning 4.04 years CRE Non-Owner Occupied Office Portfolio Characteristics • Lending focused on full relationship and strong sponsorship with full recourse • No exposure to downtown high-rise Office • Repayment based on strong net operating income, supported by secondary and tertiary repayment sources • Full global cash flow and sensitivity analysis performed on all relationships over $1 million in exposure • Secured by seasoned properties with stabilized cash flow • Dedicated CRE lending head > 50,000 SF 49% 5,000 - 50,000 SF 4% < 5,000 SF 47% Office Property Size DuPage County (IL) 15% Kane County (IL) 9% Cook County (IL) 57% Will County (IL) 15% IL Other 2% Other States 2% Geography* *Based on primary property collateral if available, otherwise borrower address. |
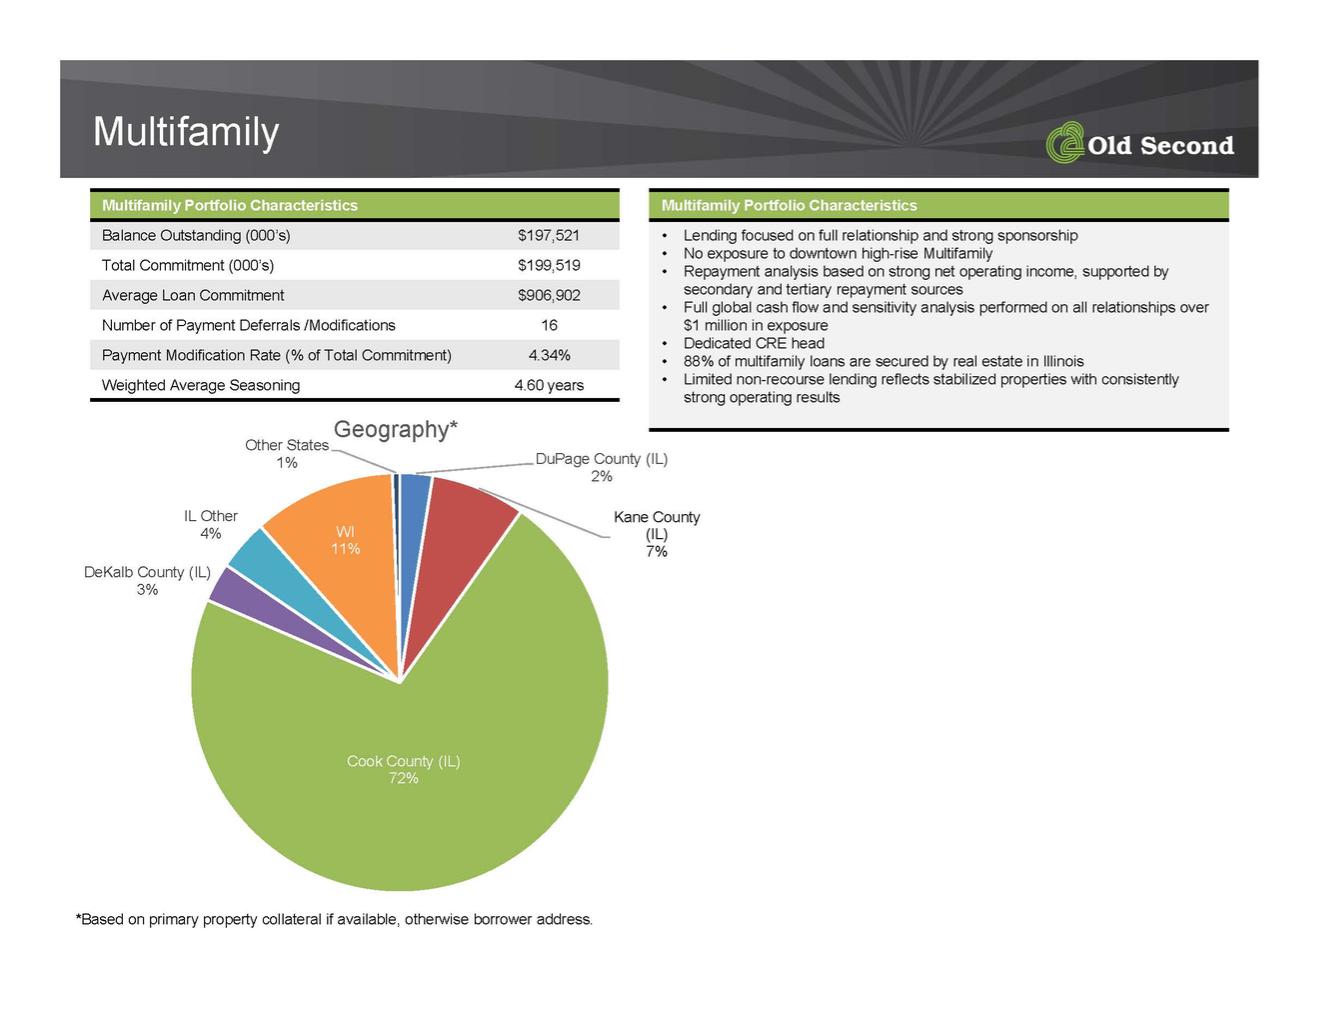
| Multifamily Multifamily Portfolio Characteristics Balance Outstanding (000’s) $197,521 Total Commitment (000’s) $199,519 Average Loan Commitment $906,902 Number of Payment Deferrals /Modifications 16 Payment Modification Rate (% of Total Commitment) 4.34% Weighted Average Seasoning 4.60 years Multifamily Portfolio Characteristics • Lending focused on full relationship and strong sponsorship • No exposure to downtown high-rise Multifamily • Repayment analysis based on strong net operating income, supported by secondary and tertiary repayment sources • Full global cash flow and sensitivity analysis performed on all relationships over $1 million in exposure • Dedicated CRE head • 88% of multifamily loans are secured by real estate in Illinois • Limited non-recourse lending reflects stabilized properties with consistently strong operating results DuPage County (IL) 2% Kane County (IL) 7% Cook County (IL) 72% DeKalb County (IL) 3% IL Other 4% WI 11% Other States 1% Geography* *Based on primary property collateral if available, otherwise borrower address. |
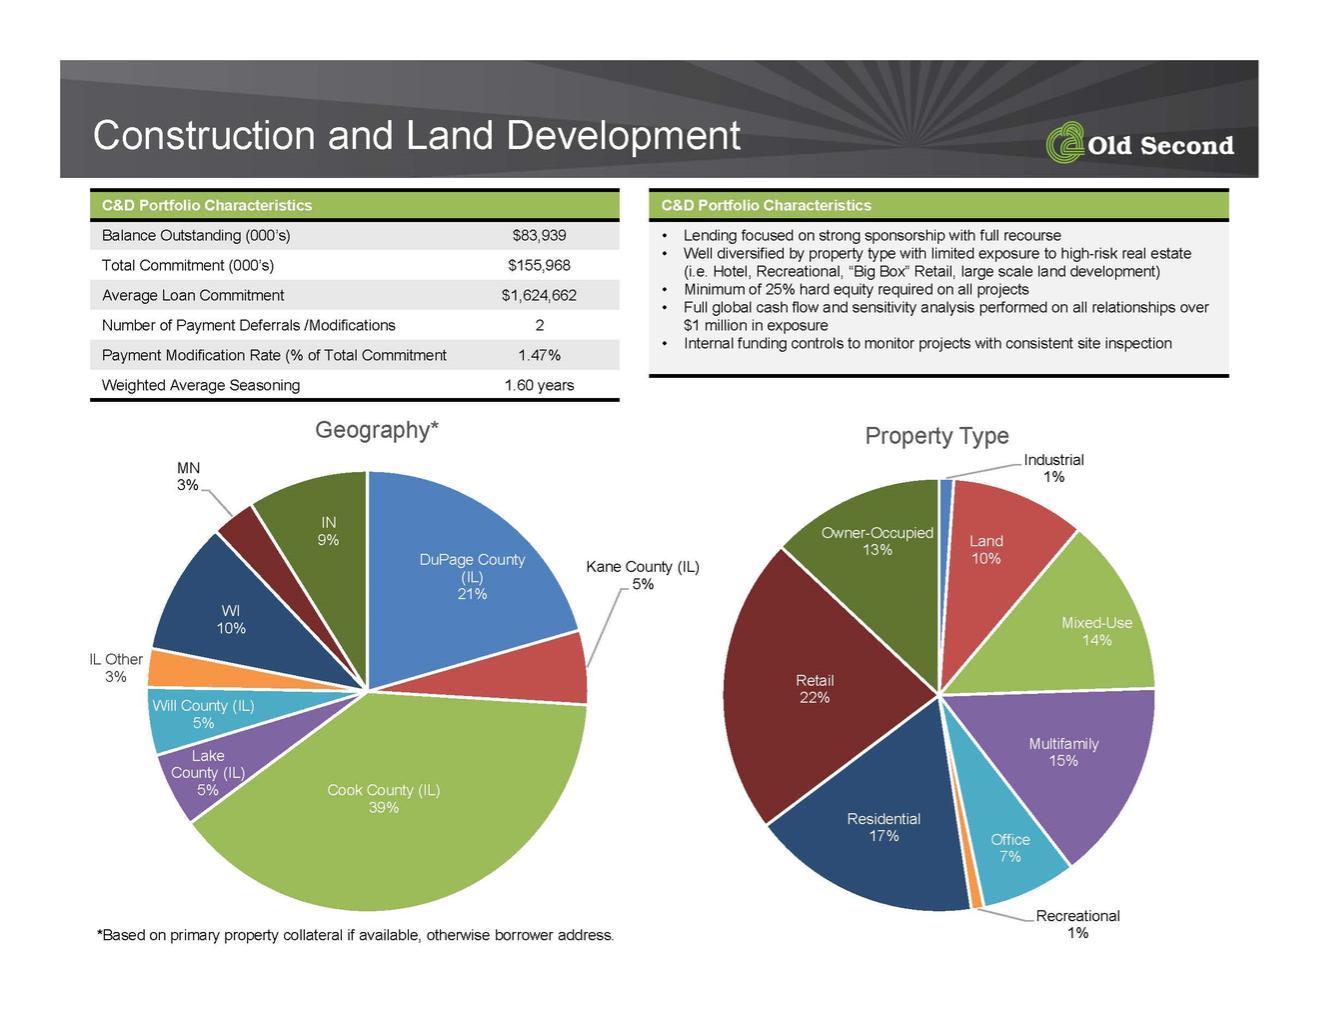
| Construction and Land Development C&D Portfolio Characteristics Balance Outstanding (000’s) $83,939 Total Commitment (000’s) $155,968 Average Loan Commitment $1,624,662 Number of Payment Deferrals /Modifications 2 Payment Modification Rate (% of Total Commitment 1.47% Weighted Average Seasoning 1.60 years C&D Portfolio Characteristics • Lending focused on strong sponsorship with full recourse • Well diversified by property type with limited exposure to high-risk real estate (i.e. Hotel, Recreational, “Big Box” Retail, large scale land development) • Minimum of 25% hard equity required on all projects • Full global cash flow and sensitivity analysis performed on all relationships over $1 million in exposure • Internal funding controls to monitor projects with consistent site inspection Industrial 1% Land 10% Mixed-Use 14% Multifamily 15% Office 7% Recreational 1% Residential 17% Retail 22% Owner-Occupied 13% Property Type DuPage County (IL) 21% Kane County (IL) 5% Cook County (IL) 39% Lake County (IL) 5% Will County (IL) 5% IL Other 3% WI 10% MN 3% IN 9% Geography* *Based on primary property collateral if available, otherwise borrower address. |
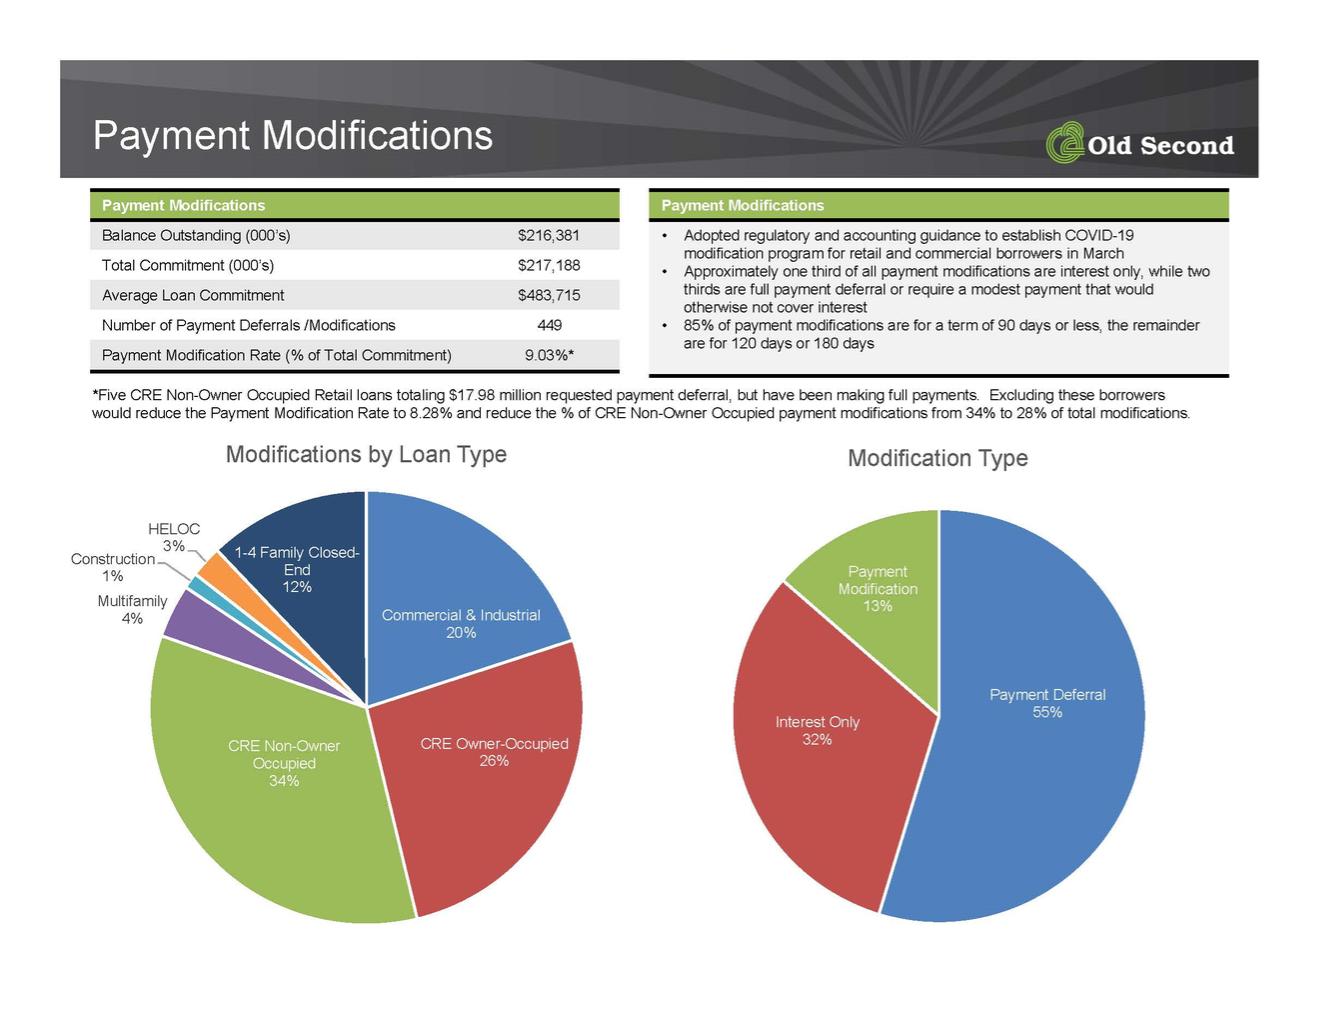
| Payment Modifications Payment Modifications Balance Outstanding (000’s) $216,381 Total Commitment (000’s) $217,188 Average Loan Commitment $483,715 Number of Payment Deferrals /Modifications 449 Payment Modification Rate (% of Total Commitment) 9.03%* Payment Modifications • Adopted regulatory and accounting guidance to establish COVID-19 modification program for retail and commercial borrowers in March • Approximately one third of all payment modifications are interest only, while two thirds are full payment deferral or require a modest payment that would otherwise not cover interest • 85% of payment modifications are for a term of 90 days or less, the remainder are for 120 days or 180 days Payment Deferral Interest Only 55% 32% Payment Modification 13% Modification Type *Five CRE Non-Owner Occupied Retail loans totaling $17.98 million requested payment deferral, but have been making full payments. Excluding these borrowers would reduce the Payment Modification Rate to 8.28% and reduce the % of CRE Non-Owner Occupied payment modifications from 34% to 28% of total modifications. Commercial & Industrial 20% CRE Owner-Occupied 26% CRE Non-Owner Occupied 34% Multifamily 4% Construction 1% HELOC 3% 1-4 Family Closed- End 12% Modifications by Loan Type |
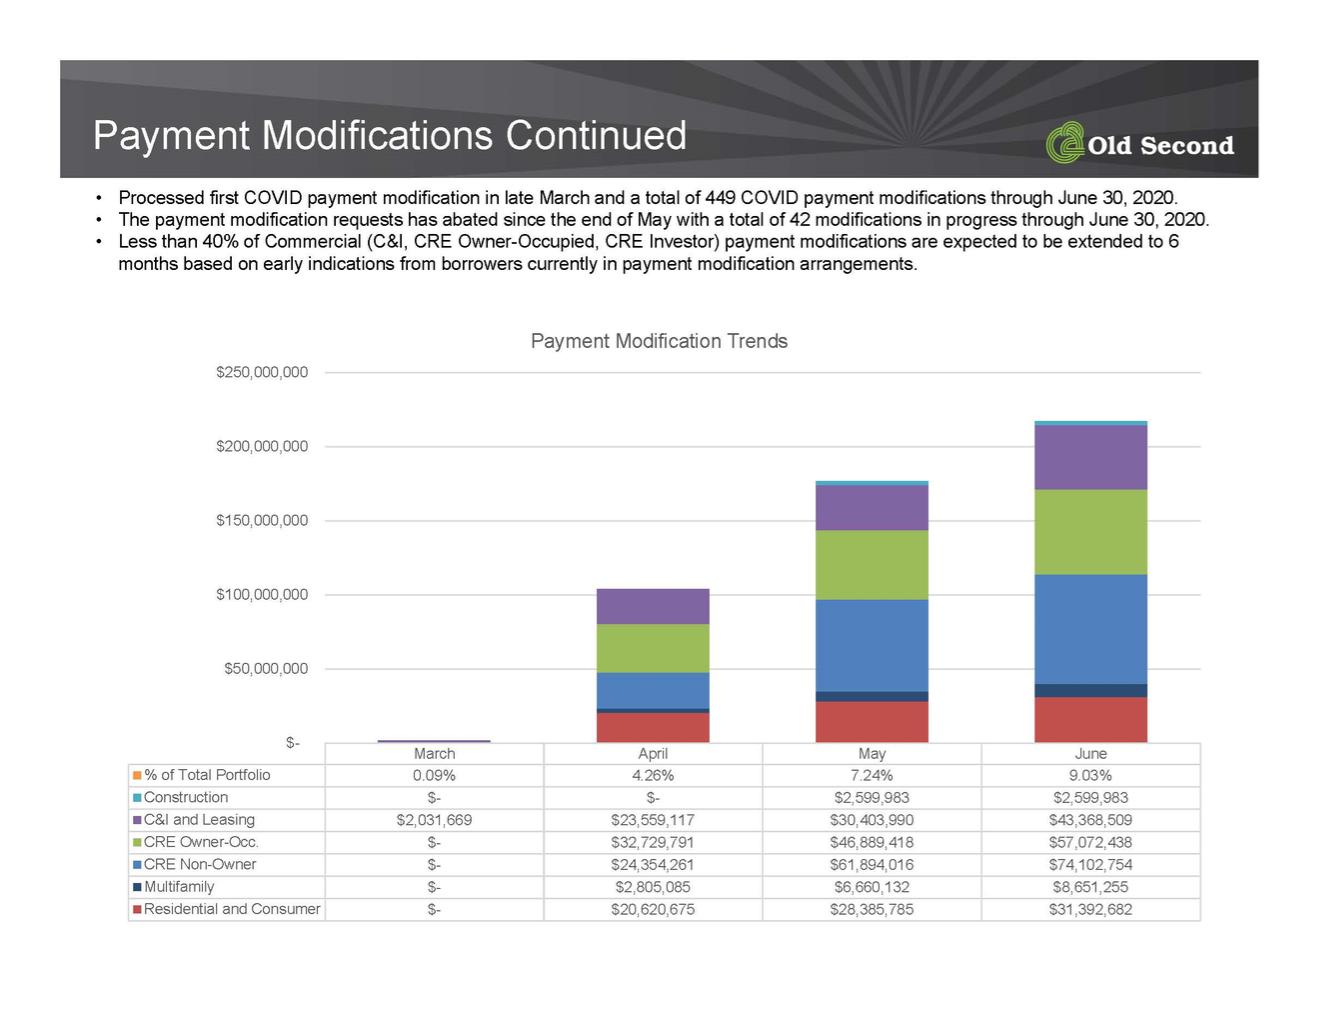
| Payment Modifications Continued • Processed first COVID payment modification in late March and a total of 449 COVID payment modifications through June 30, 2020. • The payment modification requests has abated since the end of May with a total of 42 modifications in progress through June 30, 2020. • Less than 40% of Commercial (C&I, CRE Owner-Occupied, CRE Investor) payment modifications are expected to be extended to 6 months based on early indications from borrowers currently in payment modification arrangements. March April May June % of Total Portfolio 0.09% 4.26% 7.24% 9.03% Construction $- $- $2,599,983 $2,599,983 C&I and Leasing $2,031,669 $23,559,117 $30,403,990 $43,368,509 CRE Owner-Occ. $- $32,729,791 $46,889,418 $57,072,438 CRE Non-Owner $- $24,354,261 $61,894,016 $74,102,754 Multifamily $- $2,805,085 $6,660,132 $8,651,255 Residential and Consumer $- $20,620,675 $28,385,785 $31,392,682 $- $50,000,000 $100,000,000 $150,000,000 $200,000,000 $250,000,000 Payment Modification Trends |
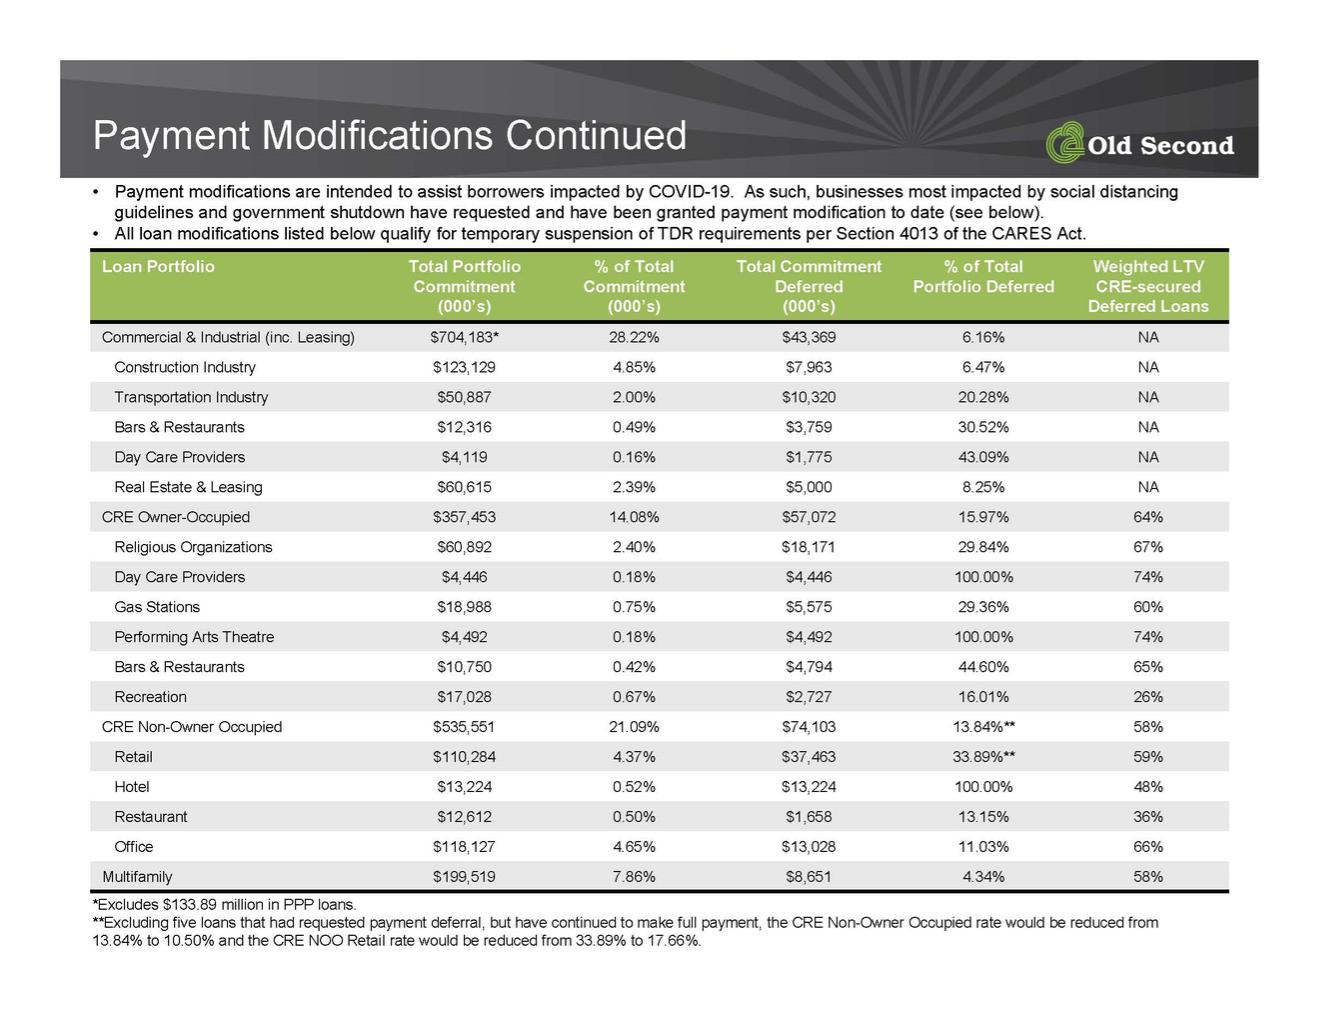
| Payment Modifications Continued Loan Portfolio Total Portfolio Commitment (000’s) % of Total Commitment (000’s) Total Commitment Deferred (000’s) % of Total Portfolio Deferred Weighted LTV CRE-secured Deferred Loans Commercial & Industrial (inc. Leasing) $704,183* 28.22% $43,369 6.16% NA Construction Industry $123,129 4.85% $7,963 6.47% NA Transportation Industry $50,887 2.00% $10,320 20.28% NA Bars & Restaurants $12,316 0.49% $3,759 30.52% NA Day Care Providers $4,119 0.16% $1,775 43.09% NA Real Estate & Leasing $60,615 2.39% $5,000 8.25% NA CRE Owner-Occupied $357,453 14.08% $57,072 15.97% 64% Religious Organizations $60,892 2.40% $18,171 29.84% 67% Day Care Providers $4,446 0.18% $4,446 100.00% 74% Gas Stations $18,988 0.75% $5,575 29.36% 60% Performing Arts Theatre $4,492 0.18% $4,492 100.00% 74% Bars & Restaurants $10,750 0.42% $4,794 44.60% 65% Recreation $17,028 0.67% $2,727 16.01% 26% CRE Non-Owner Occupied $535,551 21.09% $74,103 13.84%** 58% Retail $110,284 4.37% $37,463 33.89%** 59% Hotel $13,224 0.52% $13,224 100.00% 48% Restaurant $12,612 0.50% $1,658 13.15% 36% Office $118,127 4.65% $13,028 11.03% 66% Multifamily $199,519 7.86% $8,651 4.34% 58% • Payment modifications are intended to assist borrowers impacted by COVID-19. As such, businesses most impacted by social distancing guidelines and government shutdown have requested and have been granted payment modification to date (see below). • All loan modifications listed below qualify for temporary suspension of TDR requirements per Section 4013 of the CARES Act. *Excludes $133.89 million in PPP loans. **Excluding five loans that had requested payment deferral, but have continued to make full payment, the CRE Non-Owner Occupied rate would be reduced from 13.84% to 10.50% and the CRE NOO Retail rate would be reduced from 33.89% to 17.66%. |
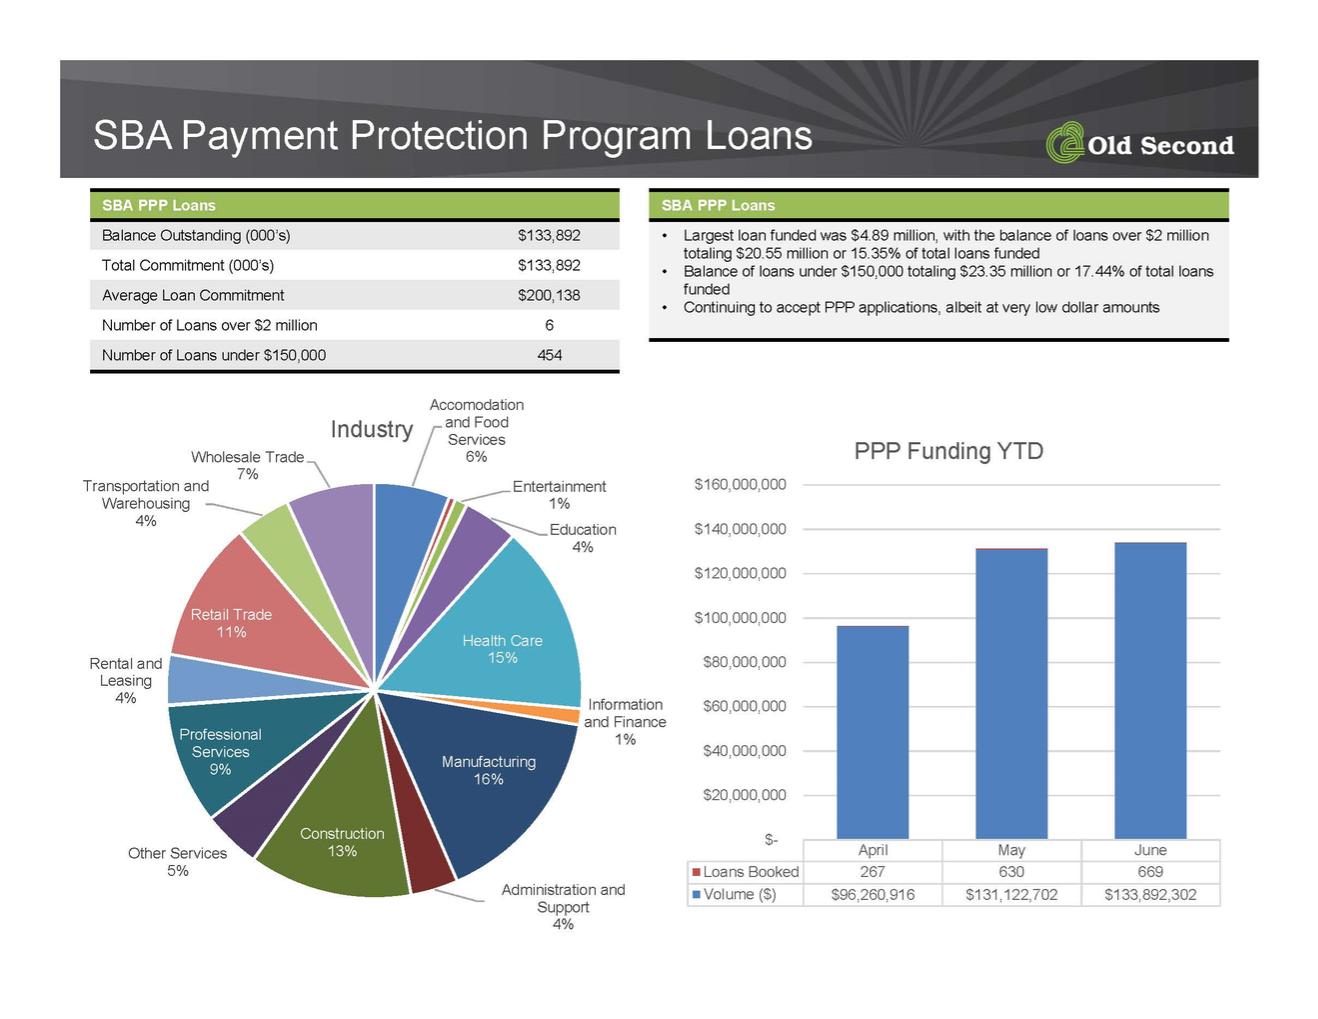
| SBA Payment Protection Program Loans Accomodation and Food Services 6% Entertainment 1% Education 4% Health Care 15% Information and Finance 1% Manufacturing 16% Administration and Support 4% Construction Other Services 13% 5% Professional Services 9% Rental and Leasing 4% Retail Trade 11% Transportation and Warehousing 4% Wholesale Trade 7% Industry April May June Loans Booked 267 630 669 Volume ($) $96,260,916 $131,122,702 $133,892,302 $- $20,000,000 $40,000,000 $60,000,000 $80,000,000 $100,000,000 $120,000,000 $140,000,000 $160,000,000 PPP Funding YTD SBA PPP Loans Balance Outstanding (000’s) $133,892 Total Commitment (000’s) $133,892 Average Loan Commitment $200,138 Number of Loans over $2 million 6 Number of Loans under $150,000 454 SBA PPP Loans • Largest loan funded was $4.89 million, with the balance of loans over $2 million totaling $20.55 million or 15.35% of total loans funded • Balance of loans under $150,000 totaling $23.35 million or 17.44% of total loans funded • Continuing to accept PPP applications, albeit at very low dollar amounts |
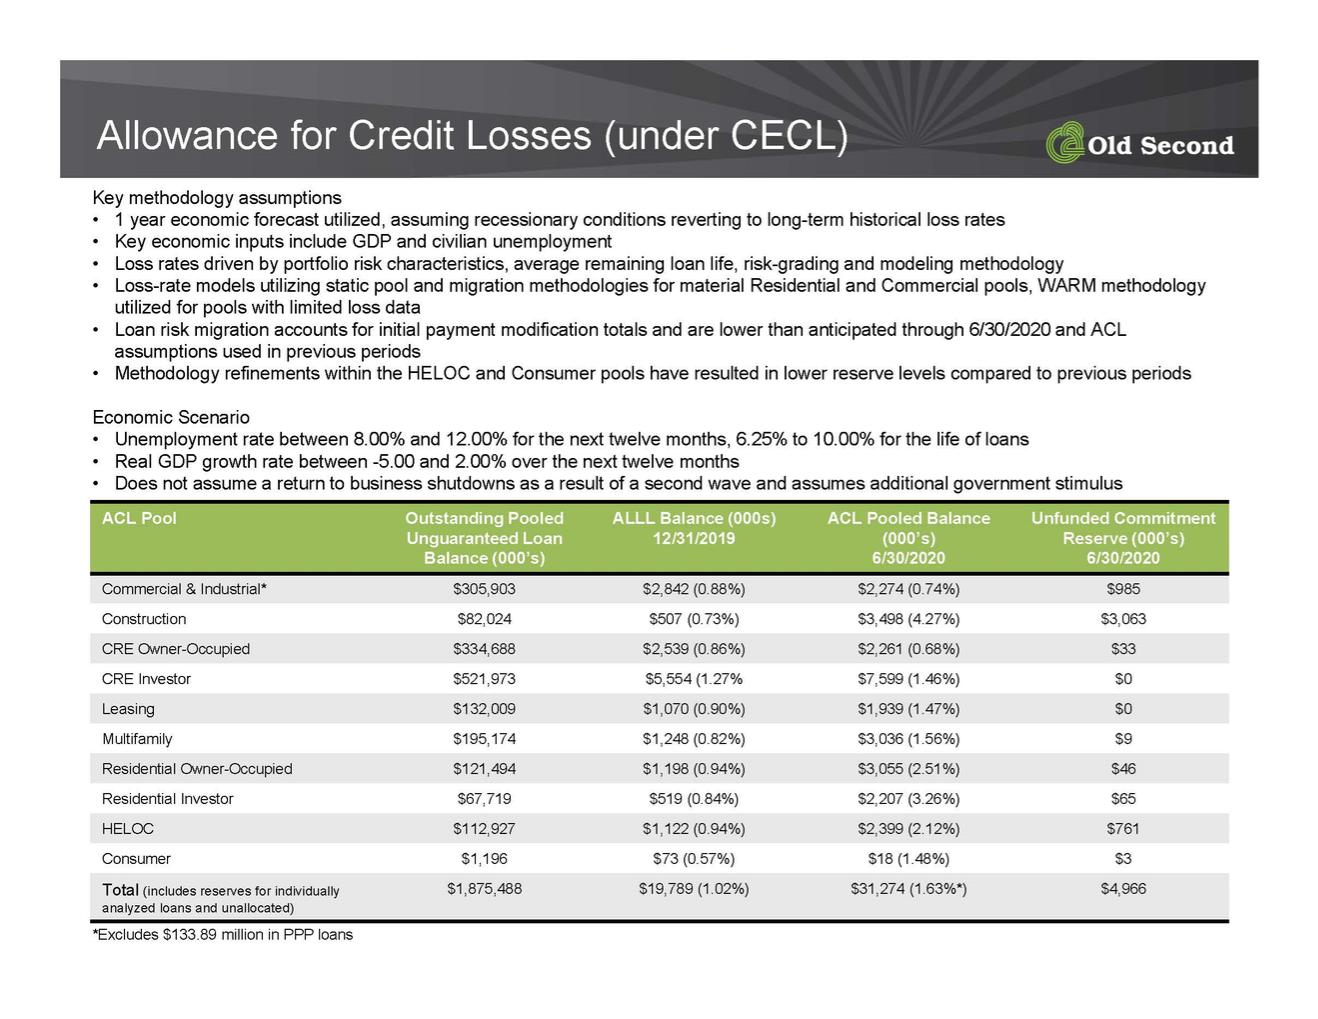
| Allowance for Credit Losses (under CECL) ACL Pool Outstanding Pooled Unguaranteed Loan Balance (000’s) ALLL Balance (000s) 12/31/2019 ACL Pooled Balance (000’s) 6/30/2020 Unfunded Commitment Reserve (000’s) 6/30/2020 Commercial & Industrial* $305,903 $2,842 (0.88%) $2,274 (0.74%) $985 Construction $82,024 $507 (0.73%) $3,498 (4.27%) $3,063 CRE Owner-Occupied $334,688 $2,539 (0.86%) $2,261 (0.68%) $33 CRE Investor $521,973 $5,554 (1.27% $7,599 (1.46%) $0 Leasing $132,009 $1,070 (0.90%) $1,939 (1.47%) $0 Multifamily $195,174 $1,248 (0.82%) $3,036 (1.56%) $9 Residential Owner-Occupied $121,494 $1,198 (0.94%) $3,055 (2.51%) $46 Residential Investor $67,719 $519 (0.84%) $2,207 (3.26%) $65 HELOC $112,927 $1,122 (0.94%) $2,399 (2.12%) $761 Consumer $1,196 $73 (0.57%) $18 (1.48%) $3 Total (includes reserves for individually analyzed loans and unallocated) $1,875,488 $19,789 (1.02%) $31,274 (1.63%*) $4,966 Key methodology assumptions • 1 year economic forecast utilized, assuming recessionary conditions reverting to long-term historical loss rates • Key economic inputs include GDP and civilian unemployment • Loss rates driven by portfolio risk characteristics, average remaining loan life, risk-grading and modeling methodology • Loss-rate models utilizing static pool and migration methodologies for material Residential and Commercial pools, WARM methodology utilized for pools with limited loss data • Loan risk migration accounts for initial payment modification totals and are lower than anticipated through 6/30/2020 and ACL assumptions used in previous periods • Methodology refinements within the HELOC and Consumer pools have resulted in lower reserve levels compared to previous periods Economic Scenario • Unemployment rate between 8.00% and 12.00% for the next twelve months, 6.25% to 10.00% for the life of loans • Real GDP growth rate between -5.00 and 2.00% over the next twelve months • Does not assume a return to business shutdowns as a result of a second wave and assumes additional government stimulus *Excludes $133.89 million in PPP loans |
CAUTIONARY NOTE REGARDING FORWARD-LOOKING STATEMENTS
Some of the statements in this presentation are “forward-looking statements” within the meaning of the Private Securities Litigation Reform Act. Forward-looking statements can be identified by words such as: "expect," “opportunity,” "anticipate," “focus,” "intend," "plan," "seek," "believe," "may," "should," "will," “projected” and similar references to future periods. Pro forma financial information is not a guarantee of future results and is presented for informational purposes only. Forward-looking statements are not guarantees of future performance and are subject to risks, uncertainties and other factors (“risk factors”) that are difficult to predict with regard to timing, extent, likelihood and degree of occurrence. Therefore, actual results and outcomes may materially differ from what may be expressed or forecasted in such forward-looking statements. All forward-looking statements speak only as of the date of this presentation. We do not undertake any duty to update any forward-looking statement made herein. Risk factors include, without limitation:
| ● | the impact of the recent outbreak of the novel coronavirus, or COVID-19, on our business, including the impact of the actions taken by governmental authorities to try and contain the virus or address the impact of the virus on the U.S. economy (including, without limitation, the Coronavirus Aid, Relief and Economic Security Act, or the CARES Act), and the resulting effect of these items on our operations, liquidity and capital position, and on the financial condition of our borrowers and other customers; |
| ● | negative economic conditions that adversely affect the economy, real estate values, the job market and other factors nationally and in our market area, in each case that may affect our liquidity and the performance of our loan portfolio; |
| ● | the financial success and viability of the borrowers of our commercial loans; |
| ● | changes in U.S. monetary policy, the level and volatility of interest rates, the capital markets and other market conditions that may affect, among other things, our liquidity and the value of our assets and liabilities; |
| ● | ability to use technology to provide products and services that will satisfy customer demands and create efficiencies in operations; |
| ● | adverse effects on our information technology systems resulting from failures, human error or cyberattacks; |
| ● | adverse effects of failures by our vendors to provide agreed upon services in the manner and at the cost agreed, particularly our information technology vendors and those vendors performing a service on the Company’s behalf; |
| ● | the impact of any claims or legal actions, including any effect on our reputation; |
| ● | losses incurred in connection with repurchases and indemnification payments related to mortgages; |
| ● | the soundness of other financial institutions and other counter-party risk; |
| ● | changes in accounting standards, rules and interpretations and the impact on our financial statements; |
| ● | changes to our key methodology assumptions underlying the determination of our allowance for credit losses; |
| ● | our ability to receive dividends from our subsidiaries; |
| ● | a decrease in our regulatory capital ratios; |
| ● | risks associated with actual or potential litigation or investigations by customers, regulatory agencies or others; |
| ● | legislative or regulatory changes, particularly changes in regulation of financial services companies; |
| ● | negative changes in our capital position; |
| ● | the adverse effects of events such as outbreaks of contagious disease, war or terrorist activities, or essential utility outages, including deterioration in the global economy, instability in credit markets and disruptions in our customers’ supply chains and transportation; and |
| ● | changes in trade policy and any related tariffs. |
These and other factors are representative of risk factors that may emerge and could cause a difference between an ultimate actual outcome and a forward-looking statement. See Item 1A, Risk Factors, in our Annual Report on Form 10-K for the year ended December 31, 2019 and Quarterly Reports on Form 10-Q, or disclosed in other documents filed or furnished by us to the SEC after the date of the Annual Report, for a description of additional risk factors that may affect actual outcomes. The inclusion of this forward-looking information should not be construed as a representation by us or any person that future events, plans, or expectations contemplated by us will be achieved. We undertake no obligation to publicly update or revise any forward-looking statements, whether as a result of new information, future events, or otherwise, except as required by law.